
Abstract
Stroke disrupts the brain’s vascular supply, not only within but also outside areas of infarction. We investigated temporal delays (lag) in resting state functional magnetic resonance imaging signals in 130 stroke patients scanned two weeks, three months and 12 months post stroke onset. Thirty controls were scanned twice at an interval of three months. Hemodynamic lag was determined using cross-correlation with the global gray matter signal. Behavioral performance in multiple domains was assessed in all patients. Regional cerebral blood flow and carotid patency were assessed in subsets of the cohort using arterial spin labeling and carotid Doppler ultrasonography. Significant hemodynamic lag was observed in 30% of stroke patients sub-acutely. Approximately 10% of patients showed lag at one-year post-stroke. Hemodynamic lag corresponded to gross aberrancy in functional connectivity measures, performance deficits in multiple domains and local and global perfusion deficits. Correcting for lag partially normalized abnormalities in measured functional connectivity. Yet post-stroke FC–behavior relationships in the motor and attention systems persisted even after hemodynamic delays were corrected. Resting state fMRI can reliably identify areas of hemodynamic delay following stroke. Our data reveal that hemodynamic delay is common sub-acutely, alters functional connectivity, and may be of clinical importance.
Keywords
Introduction
Stroke causes a disruption to the brain’s vascular supply that leads to infarction and structural damage of gray/white matter, but also remote physiological and metabolic effects in structurally normal regions of the brain. It is becoming increasingly apparent that an understanding of behavioral deficits post-stroke will require a complete description not only of lesion topography, but also of the complement of metabolic, structural, and functional connectivity abnormalities. These changes, in turn may relate to abnormal neuronal dynamics at the level of whole brain networks.1,2 Functional MRI is the primary tool to examine network level abnormalities caused by brain diseases based on the premise of a normal coupling between neuronal activity and related blood flow/volume changes (hemodynamic response, HDR).
However, when studying disease states, a normal hemodynamic response cannot be assumed. 3 For instance, prior work has established that the hemodynamic response can be altered following stroke.4,5 In patients with cerebrovascular disease, peak BOLD response delays of up to 20 s have been reported in the affected hemisphere.6–8 Such responses are said to exhibit hemodynamic lags.
In resting state functional MRI (R-fMRI), functional connectivity between regions of the brain is estimated by the temporal correlation of the spontaneous BOLD signal. Two recent studies observed BOLD signal delays in R-fMRI in small cohorts.9,10 These studies raise concerns about how hemodynamic lags might be affecting measurement of functional connectivity after stroke.
In this study, we address fundamental questions concerning cerebrovascular physiology in stroke, specifically concerning the importance of hemodynamic lags in relation to changes of functional connectivity (FC), regional cerebral blood flow (rCBF) or diaschisis, as well as behavior and recovery. We report on a longitudinal study of hemodynamic lag in a cohort of 130 first time ischemic and hemorrhagic stroke patients. We consider the longitudinal trends, physiological correlates, and clinical implications of hemodynamic lag. We demonstrate a relationship between lag, and decrements of blood flow, and severity of clinical deficits after stroke. We also demonstrate that lag profoundly affects measures of FC and we investigate the effects of hemodynamic lag on previously reported FC–behavior relationships. Finally, we test a method for correcting for hemodynamic lag in measures of functional connectivity.
Materials and methods
Patient enrollment
All aspects of this study were approved by the Washington University School of Medicine (WUSM) Internal Review Board. Written informed consent was obtained from all participants in accordance with the Helsinki Declaration and procedures established by the Washington University in Saint Louis Institutional Review Board and all participants were compensated for their time. First time stroke patients were recruited by a research coordinator through the in-patient service at Barnes-Jewish Hospital (BJH) and the Rehabilitation Institute of St. Louis (TRISL). Inclusion criteria for stroke patients were: (1) age 18 or greater, (2) first symptomatic stroke, ischemic or intraparenchymal hemorrhagic etiology, (3) clinical evidence of motor, language, attention, visual, or memory deficits based on neurological examination, and (4) time of enrollment < 2 weeks post-stroke onset. Exclusion criteria were: (1) the inability to maintain wakefulness during testing, (2) the presence of other neurological, psychiatric, or medical conditions that preclude active participation in research and/or may alter the interpretation of the behavioral/imaging studies (e.g. dementia, schizophrenia), or limit life expectancy to less than 1 year (e.g. cancer or congestive heart failure class IV), (3) evidence of clinically significant periventricular white matter disease (equal or above grade 5 of Longstreth and colleagues 11 ), and (4) contraindications for MRI including claustrophobia or scanner incompatible implants. In total, 6260 charts were screened; 130 patients met all inclusion criteria and completed the entire sub-acute protocol (mean age 52.8 with range 22–77, 119 right handed, 61 female, 64 right hemisphere). Of those, 101 had ischemic strokes, 21 hemorrhagic, 5 ischemic with later hemorrhagic conversion, and 3 carotid or vertebral dissection. Other features of the patient cohort and lesion distribution were described previously. 12
Stroke source population
We conducted a control analysis to determine whether our stroke sample was representative of the general stroke population. The demographic and medical characteristics of the patients in our sample were compared to those of a large control group (n = 1209) that was selected from the Cognitive Rehabilitation Research Group database 13 of all patients seen at Barnes Jewish Hospital between 2008 and 2013 (n = 6260) using the same inclusion/exclusion criteria. All included stroke and control subjects provided informed consent according to procedures approved by the Institutional Review Board at Washington University.
Healthy control enrollment
Thirty healthy, demographically matched control subjects were recruited and underwent the same behavioral and imaging exams. Inclusion criteria for control subjects were: healthy adult matched to stroke study population by age, gender, handedness, and level of education. Exclusion criteria were: (1) a positive history of neurological, psychiatric, or medical abnormalities preventing participation in research activities, (2) a history of atherosclerotic (coronary, cerebral, peripheral) artery disease, and (3) an abnormal neurological examination with signs of CNS dysfunction. The average age at the time of enrollment was 55.7 years (SD = 11.5) with a range from 21 to 83 years.
R-fMRI acquisition and analysis
Patients were studied 2 weeks (mean = 13.4 days, SD = 4.8 days), 3 months (mean = 112.5 days, SD = 18.4 days), and 1 year (mean = 393.5 days, SD = 55.1 days) post stroke onset. Controls were studied twice at an interval of three months. All imaging were performed using a Siemens 3 T Tim-Trio scanner at the Washington University School of Medicine (WUSM) and the standard 12-channel head coil. The MRI protocol included structural, functional, pulsed arterial spin labeling (PASL), and diffusion tensor scans. Structural scans included: (1) a sagittal T1-weighted MP-RAGE (TR = 1950 ms, TE = 2.26 ms, flip angle = 90°, voxel size = 1.0 × 1.0 × 1.0 mm); (2) a transverse T2-weighted turbo spin-echo (TR = 2500 ms, TE = 435 ms, voxel-size = 1.0 × 1.0 × 1.0 mm); and (3) sagittal FLAIR (fluid attenuated inversion recovery) (TR = 7500 ms, TE = 326 ms, voxel-size = 1.5 × 1.5 × 1.5 mm). PASL acquisition parameters were: TR = 2600 ms, TE = 13 ms, flip angle = 90°, bandwidth 2.232 kHz/Px, and FoV 220 mm. A total of 120 volumes were acquired (322 s total), each containing 15 slices with slice thickness 6 mm and 23.7 mm gap. Resting state functional scans were acquired with a gradient echo EPI sequence (TR = 2000 ms, TE = 27 ms, 32 contiguous 4 mm slices, 4 × 4 mm in-plane resolution) during which participants were instructed to fixate on a small cross in a low luminance environment. Central fixation and wakefulness were monitored with an eye tracker and recorded. Six to eight R-fMRI runs, each including 128 volumes (30 min total), were acquired.
Participants with less than 5 minutes of retained R-fMRI data after strict motion scrubbing were excluded from further analysis. The fraction of participants providing useful fMRI data was 107/130 patients at two weeks, 86/94 patients at three months, 74/82 patients at one year, 24/30 controls at scan 1, and and 24/29 controls at scan 2 (Table S1).
R-fMRI data preprocessing
R-fMRI data underwent preprocessing as previously described by Baldassarre and colleagues. 14 Briefly, this included: (1) compensation for asynchronous slice acquisition using sinc interpolation; (2) elimination of odd/even slice intensity differences resulting from interleaved acquisition; (3) whole brain intensity normalization to achieve a mode value of 1000; (4) spatial realignment within and across R-fMRI runs; and (5) resampling to 3 mm cubic voxels in atlas space including realignment and atlas transformation in one resampling step. Cross-modal (e.g. T2-weighted to T1-weighted) image registration was accomplished by aligning image gradients. 15 Cross-model image registration in patients was checked by comparing the optimized voxel similarity measure to the 97.5 percentile obtained in the control group. In some cases, structural images were substituted across sessions to improve the quality of registration.
Lesion segmentation
Lesions were manually segmented using Analyze (www.mayo.edu) by inspection of the structural images (T1-weighted, T2- weighted, FLAIR), simultaneously displayed in atlas space. All segmentations were reviewed by two neurologists (Maurizio Corbetta and Alexandre Carter) with special attention to distinguishing lesion from CSF and hemorrhage from surrounding vasogenic edema. The lesions ranged from 0.02 cm3 to 82.97 cm3 with a mean of 10.15 cm3 (SD = 13.94 cm3).
Pulsed ASL and carotid Doppler
Pulsed arterial spin labeling (PASL) measures of regional cerebral blood flow (rCBF) were acquired in a subset of patients (27 sub-acute patients and 20 controls). Two proximal inversions with control for off-resonance effects (PICORE Q2) PASL-MRI perfusion scans were collected. PASL data were processed as described previously. 16 Normalized perfusion (percent of control average) was determined for a set of 169 regions of interest (ROIs) described below. Bilateral carotid Doppler was also acquired at initial post-stroke hospital admission for 66 of the included patients. Carotid Doppler velocity values were converted to categories of (1) ≤50% occlusion, (2) 51–79% occlusion, or (3) ≥80% occlusion, based on guidelines from the Society of Radiologists in Ultrasound Consensus Conference. 17 PASL and carotid Doppler were compared with R-fMRI measures of local (region of interest) and global (affected hemispheric) lag to determine how perfusion measures associate with lag.
Behavioral testing
All subjects and controls underwent a behavioral battery that included assessment of motor, language, attention, memory, and visual function following each scanning session. Overall clinical deficit was also assessed in each patient using the NIH stroke scale (NIHSS). 18 Imaging and behavioral testing session usually were performed on the same day. Dimensionality reduction was performed on the behavioral performance data as described previously. 12 Principal components analysis was performed on all tests within a behavioral domain to produce a single score that predicted the majority of variance across tasks. The ‘Motor’ score describes contralesional deficits that correlated across shoulder flexion, wrist extension/flexion, ankle flexion, hand dynamometer, nine hole peg, action research arm test, timed walk, functional independence measure, and the lower extremity motricity index. The ‘Attention (visual field)’ score describes contra-lesional visual field effects in Posner, Mesulam, and BIT center of cancellation tasks. A separate ‘Attention (sustained)’ score loaded on non-spatial measures of overall performance, reaction time, and accuracy on the same tests. The ‘Spatial Memory’ score loaded on the Brief Visuospatial Memory Test and spatial span. The ‘Verbal Memory’ score loaded on the Hopkins Verbal Learning Test. The ‘Language’ score loaded on both comprehension (complex ideational material, commands, reading comprehension) and production (Boston naming, oral reading).
ROIs
A set of 169 regions of interest (ROIs), defined based on Hacker and colleagues, 19 were used in post hoc analyses. Briefly, the ROIs were selected based on a meta-analysis of task fMRI studies and refined to optimally represent seven resting state networks. ROI-based analysis was used for (1) lag laterality measurement, (2) resting BOLD power analysis, and (3) FC analyses. ROIs partially or entirely overlapping with the infarct were excluded from all analyses (excepting the within-lesion BOLD power analysis).
Gray matter, white matter, and CSF compartments were defined in individual subjects using automated segmentation by FreeSurfer 20 . Any voxels that overlapped with the manual segmented lesion masks were excluded.
Lag measure
The R-fMRI data were first temporal bandpass filtered, retaining frequencies between 0.009 and 0.09 Hz. Next, frame censoring identified volumes with a DVARS measure >0.6% or a framewise displacement >0.5 mm to be excluded from the R-fMRI computations. 21 A shift mask was then generated by removing every frame within 4TR of masked frames. A minimum of 150 usable frames was required for subject inclusion in the present results. Thus, 23/130 sub-acute patients and 6/30 controls were excluded. In the retained data, on average, 570 out of 870 frames remained in sub-acute patients, and 495 of 851 frames remained in controls (Table S1). Next, a reference signal was generated from the average timecourse in each subject’s [non-lesion] gray matter compartment.
Lagged cross-correlation analysis with reference to the global gray matter reference signal was performed for each voxel over the range ±4 TRs (±8 s) (Figure 1) as follows:
Using temporal cross-correlation to measure lag in resting state fMRI. (a) The global reference signal (black line, top panel) is measured by averaging all non-lesioned gray matter voxels. Each voxel timecourse (red line, top panel) is then compared to the reference signal. The exemplar voxel is circled in (c). (b) The voxel timecourse is shifted forward and backward 8 s (±4 TR) and shift correlation is computed (equation 1). 5.08 s is the optimal shift determined by parabolic interpolation. (c) Voxelwise hemodynamic lag image. Orange/yellow indicates a lag behind the reference signal, cyan indicates a lead. Lesioned areas are shown in black. A small caudal infarct in left posterior cerebral artery (PCA) territory shows associated lag in the entire left PCA distribution. A full lag map for this individual is shown in row 5 of Figure 2.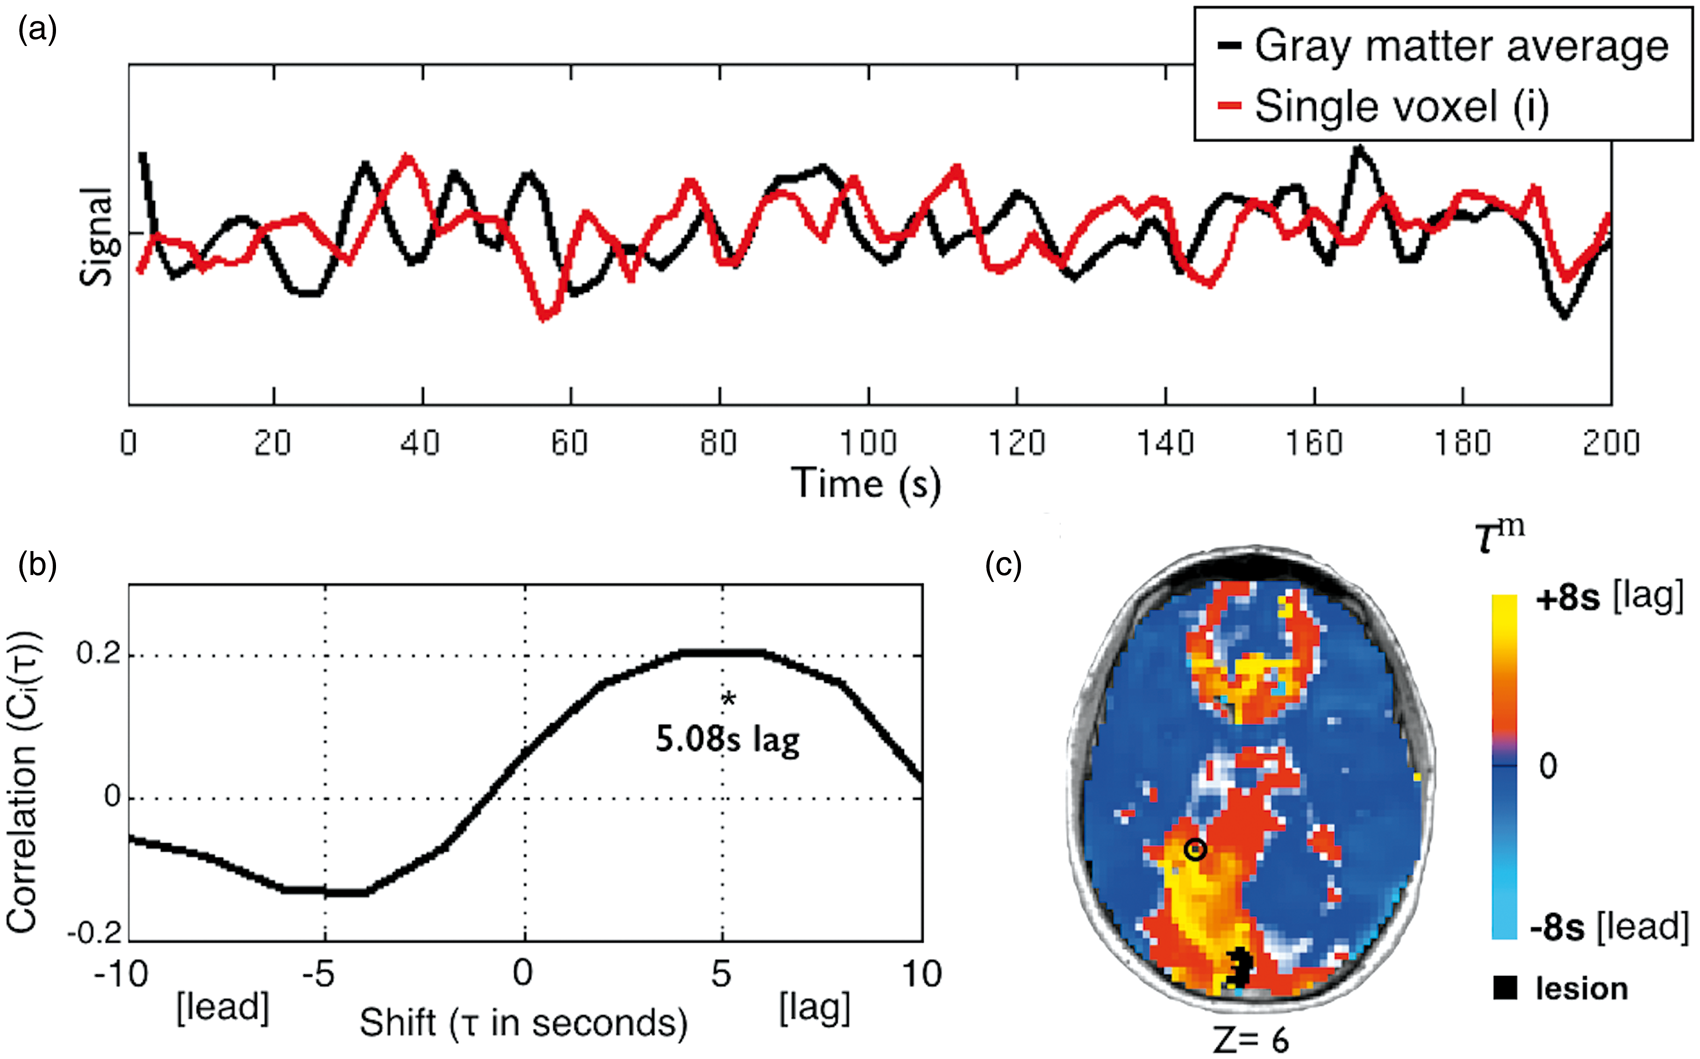

Lag laterality
Inspection of lag maps demonstrated that lags > 2 s almost always were confined to the lesioned hemisphere. Thus, it was possible to compute lag laterality scores as a measure of average lag difference in the affected versus unaffected hemisphere. Lag laterality was computed for each patient by finding the average lag for each of the 169 ROIs (excluding those intersecting the lesion) and then computing the difference between all right hemisphere ROIs (78/169) and all left hemisphere ROIs (78/169). The reliability of measured lag maps as well as laterality scores theoretically depends on the quantity of available data. 10 These relationships were estimated using data subsamples of duration 40 s to 800 s.
The lag laterality score was used to compare lag severity to clinical variables. Because lag laterality values were not normally distributed, lag laterality was compared with categorical variables using a Mann-Whitney U test, and to continuous variables using Spearman’s rank test.
Resting state BOLD power analysis
The BOLD signal power across the low frequency range typically used for resting state FC (0.009–0.09 Hz) was computed on all ROI timecourses in all sub-acute subjects. ROIs were then subdivided into three categories: (1) ROIs partially or wholly within a lesion, (2) ROIs that show greater than 2 s of lag, and (3) all other ROIs. The average power spectrum was then computed for each category.
Correcting functional connectivity measures for hemodynamic lag
Hemodynamic lags theoretically distort FC measures in a manner that is potentially correctible. To address this question, corrected FC measures were computed by shifting regional timeseries according to the previously determined hemodynamic lags. In greater detail, for any pair of signals, one of the timeseries was shifted by the lag difference and this difference was rounded to the nearest TR to avoid timeseries interpolation. FC was then computed using the standard formula (Fisher z-transformed Pearson correlation
To determine if correcting lag improves FC, aberrancy of FC relative to controls was determined for all ROIs in all patients.
23
Functional connectivity aberrancy was first quantified for each connection (169-choose-2) by comparing to the mean and standard deviation for that connection in controls. Z-normed FC aberrancy was computed as
Results
To determine the topographic extent and biological correlates of hemodynamic lag following stroke, we performed a longitudinal study of a cohort of stroke patients (n-130) and age-matched controls (n-30). To assess whether the study sample was representative of a the larger stroke population, it was compared to a larger source population of 1209 patients. The study sample was well matched to the source population on stroke variables (etiology, tPA, mechanical thrombectomy, NIHSS in hospital), but showed some differences in demographics and clinical predisposing factors (age, race, coronary artery disease and atrial fibrillation) (Table S2). Further details of this comparison are reported in the supplement. Of the 130 patients studied, 107 had adequate R-fMRI and behavioral data. Of those, 87 had ischemic strokes and 15 had hemorrhagic strokes. Patients with ischemic stroke were further classified based on TOAST criteria. 24 Regarding ischemic subtypes, large-artery atherosclerosis was observed in 16 patients, cardioembolism in 12 patients; small-vessel occlusion in 8 patients, and undetermined etiology (two or more causes identified, stroke is cryptogenic, or evaluation is incomplete) in 45 patients.
Lag analysis reveals sizeable delays in the hemodynamic response
Lag in the resting BOLD signal was measured across the brain relative to the global gray matter signal as described in Figure 1. Figure 1(a) and (b) illustrates our approach for measuring lag cross-correlation in every voxel. Figure 1(c) shows the lag map for one subject. The subject’s lesion is shown in black and the voxel used in Figure 1(b) is circles. Lag severity was quantified by comparing the lag laterality – a global measure of lag severity – to the distribution of 24 healthy controls. At 1–2 weeks post-stroke, 32 out of 107 sub-acute stroke patients (30%) exhibited lag measures >2 SD of the control mean (∼95% confidence interval) and 19 out of 107 (17.8%) were >3 SD (99.7% confidence interval).
Lag laterality also was measured in voxels restricted to white matter; this quantity was highly correlated (r = 0.7221, P = 1 × 10⁻⁴) with lag laterality measured in gray matter voxels, although the magnitude of gray matter lag measures was larger (Figure S1, Supplementary material). We also computed the average lag difference over all homotopic ROI pairs. This quantity was significantly correlated with lag laterality as defined above (r = 0.55, P < 10−9).
Figure 2 illustrates hemodynamic lag in our cohort. Figure 2(a) illustrates lag maps obtained in five representative patients at the sub-acute period. Figure 2(b) shows a histogram of lag value frequencies measured in the set of 169 ROIs in all patients and all controls. By convention, negative shift values indicate a lead ahead of the reference signal and positive values indicate a lag behind it. Both groups exhibited ROIs that lead the gray matter signal ( Delay in the resting hemodynamic response (lag) is observed after stroke. (a) Lag maps for five sub-acute stroke patients overlaid on MP-RAGE. Lesion locations are shown in black. (b) Histogram of lag value frequencies measured in a set of 169 ROIs in both patients and controls. Both contain some regions that appear to lead the gray matter signal, but the patients show more regions that lag behind it than controls (shaded gray – 1.7% vs 0.2% of ROIs > +4 s). (c) To generate a group average, subjects were grouped by stroke arterial territory and the contralesional hemisphere was subtracted from the ipsilesional hemisphere. Average lag maps for two largest groups, middle cerebral artery (MCA), and posterior cerebral artery (PCA), are shown. (d) Lag maps at the one-year follow-up from the same patients shown in (a). Lag appears to largely resolve by 1year post-stroke onset in many but not all cases. (e) Lag laterality scores for all patients included in the study at all timepoints. Patients with only one timepoint are shown as a single circle. Patients are divided by lesion side to show the frequent correspondence with lag side.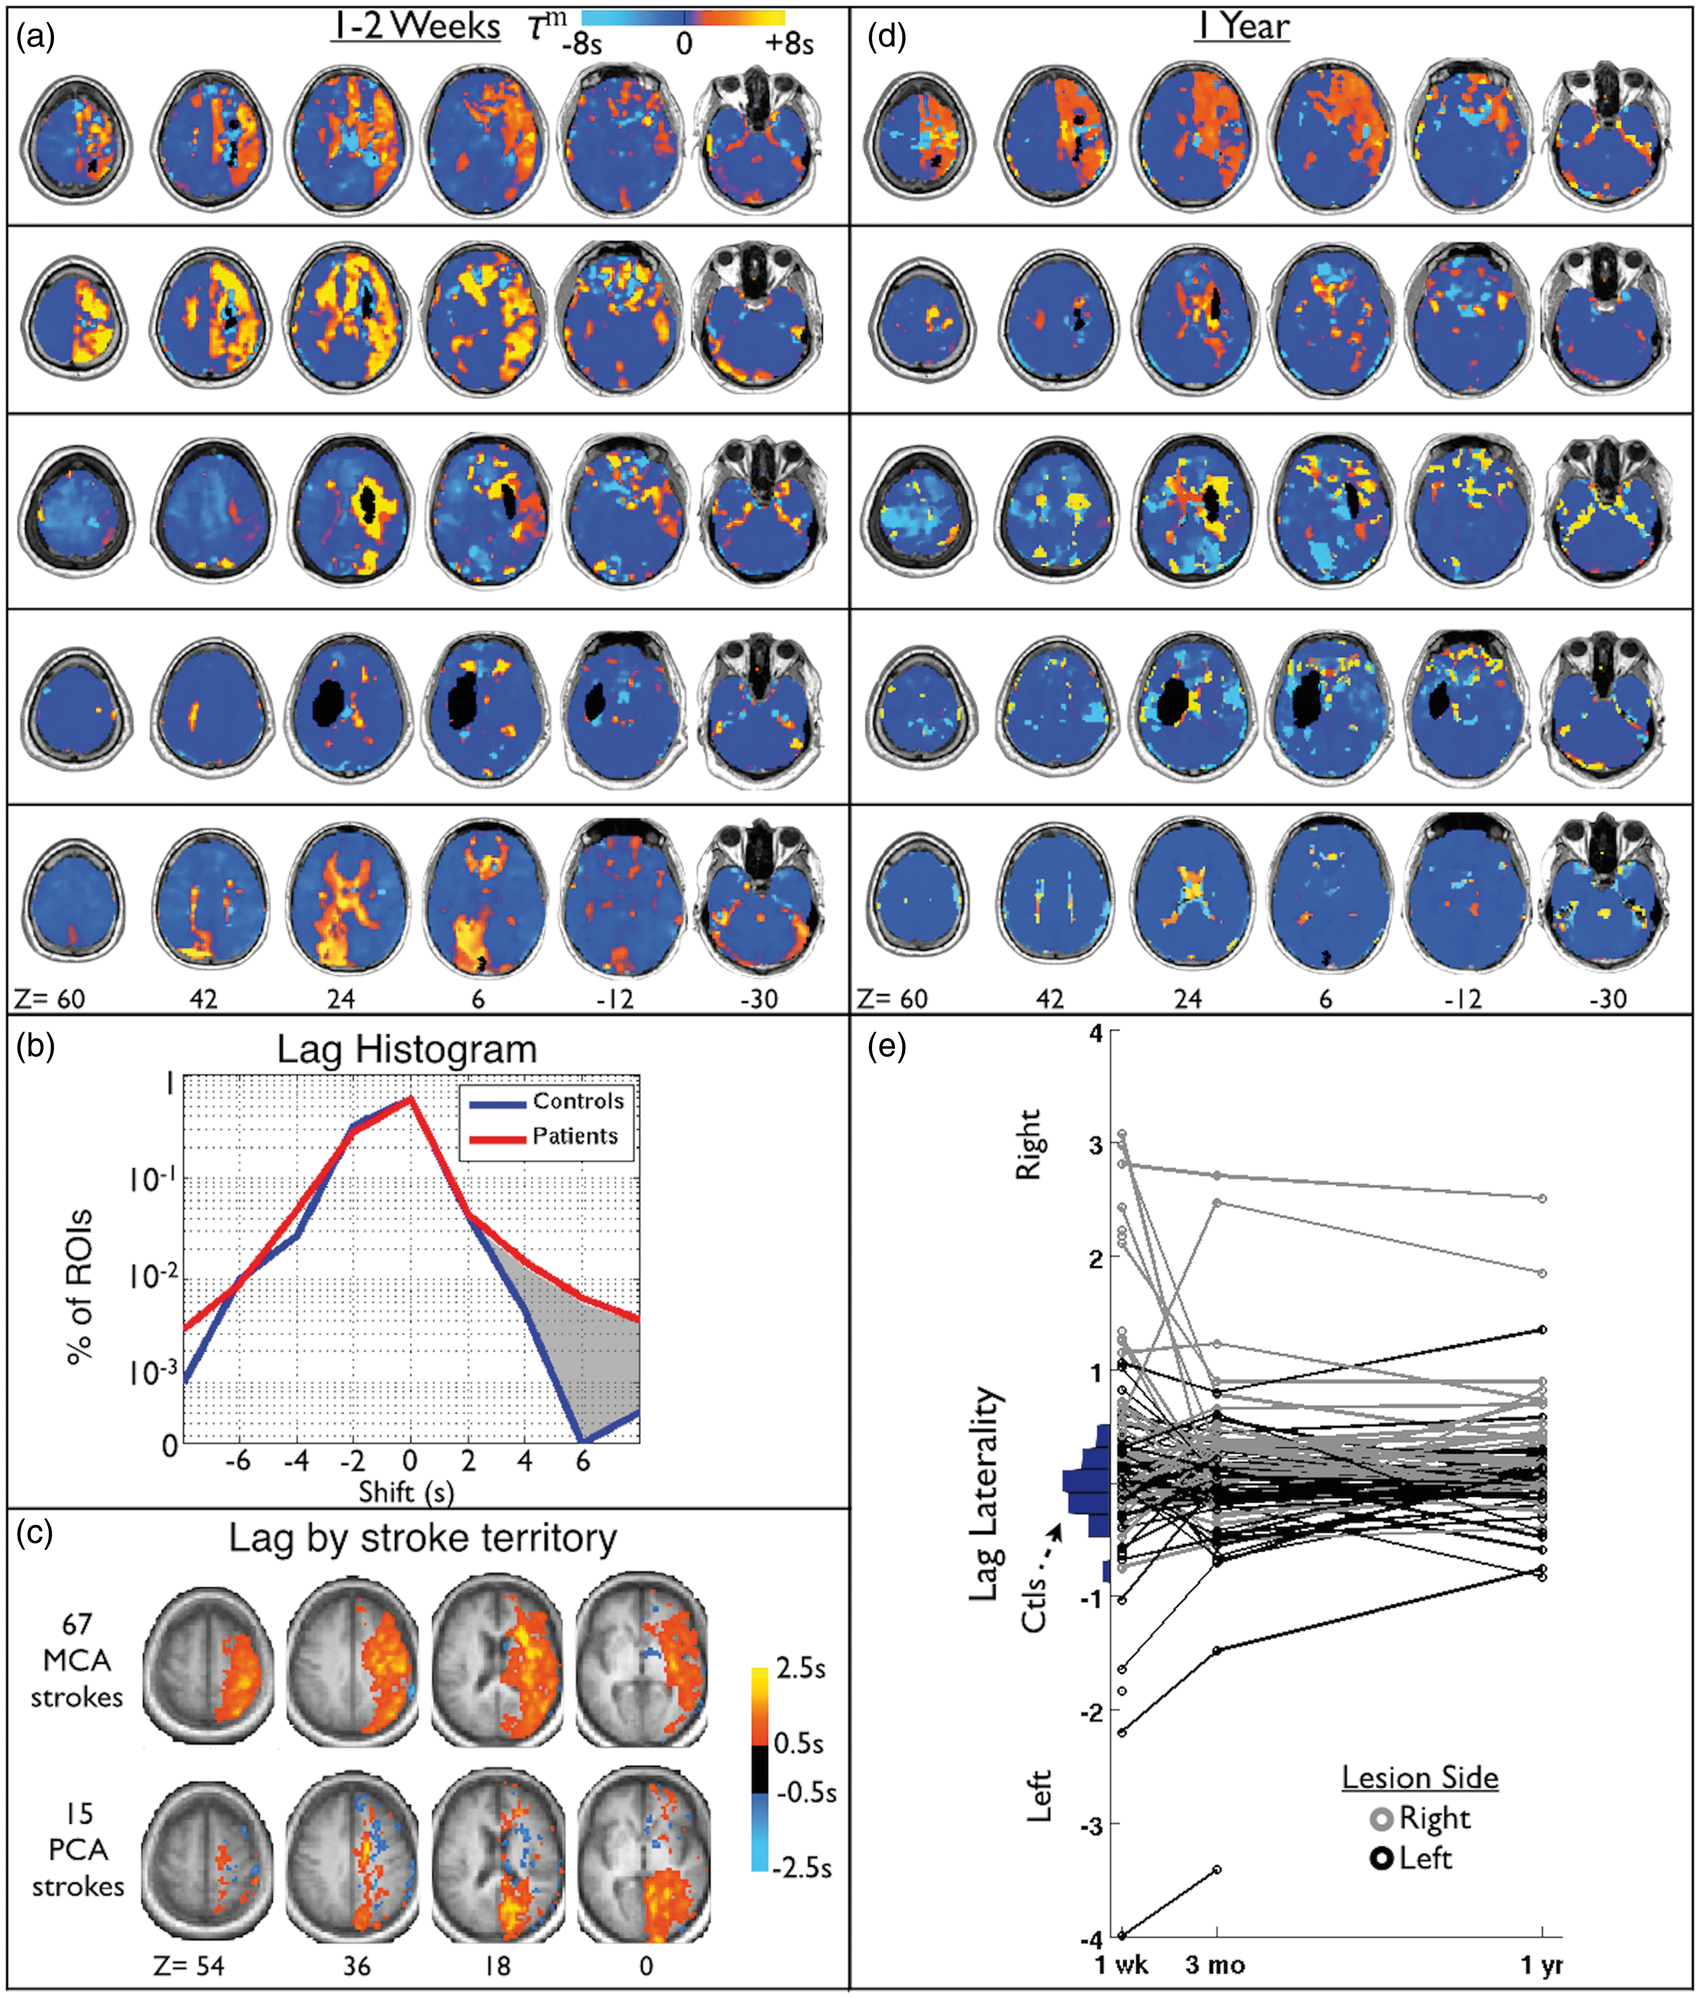
Clinical and behavioral correlates of lag.
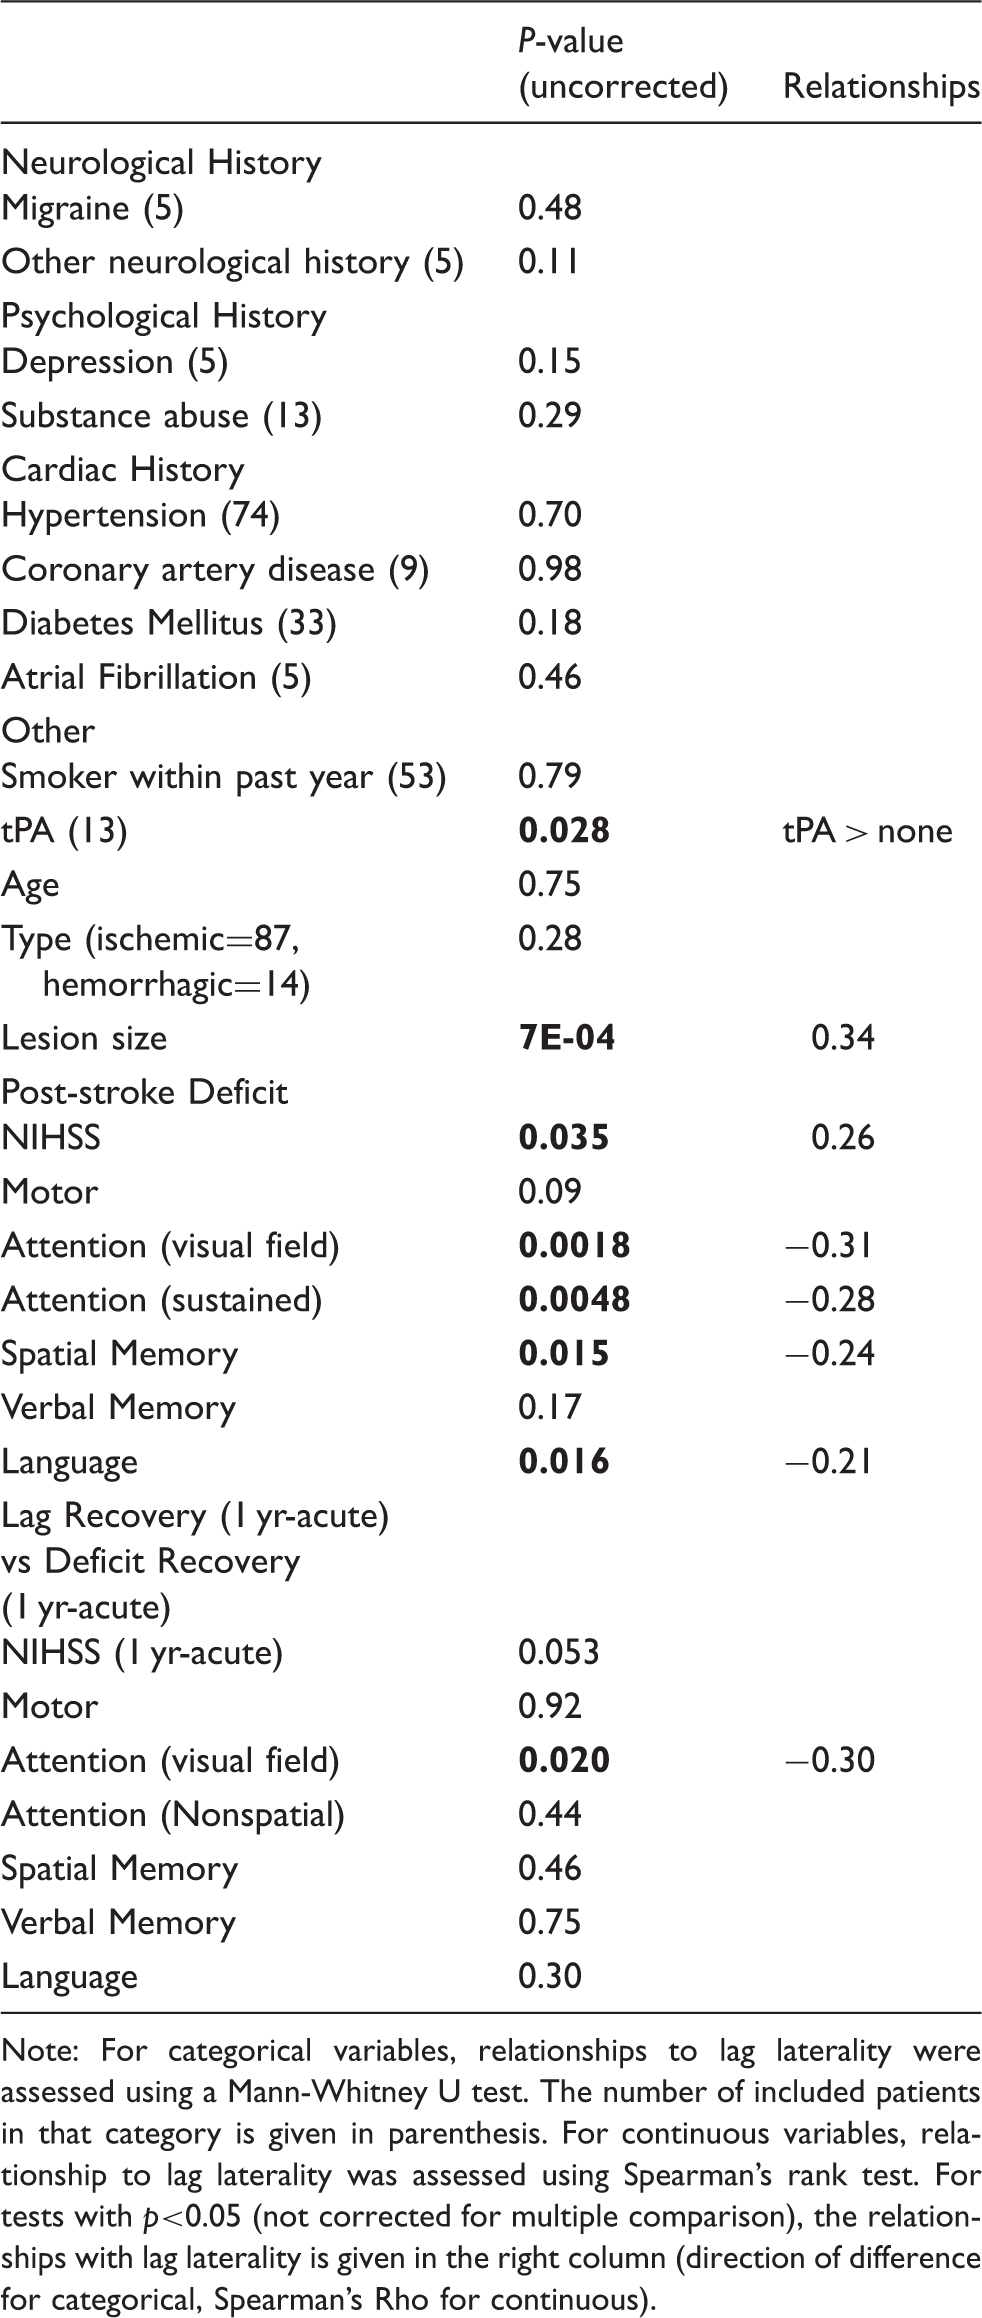
Note: For categorical variables, relationships to lag laterality were assessed using a Mann-Whitney U test. The number of included patients in that category is given in parenthesis. For continuous variables, relationship to lag laterality was assessed using Spearman’s rank test. For tests with p<0.05 (not corrected for multiple comparison), the relationships with lag laterality is given in the right column (direction of difference for categorical, Spearman’s Rho for continuous).
To exclude the possibility that eyes open/closed during the R-fMRI scan biased our results, we measured the percent of time with eyes open for each R-fMRI session. In the first R-fMRI session, patients maintained eyes open 66% of the time on average, and controls maintained eyes open 77% of the time. However, a two-way ANOVA found no significant effect of group (P = 0.846) or of timepoint (P = 0.677) on eyes open. Moreover, a Spearman’s correlation of eyes open with lag laterality measured at the sub-acute timepoint did not identify a significant relationship (r = 0.02, P = 0.8).
Lag recovery
Figure 2(d) illustrates lag maps for the same five patients at 1year follow-up. A variety of outcomes is evident, ranging from no change (top) to complete resolution (bottom row). Figure 2(e) shows lag laterality scores over all available data, illustrating the trend of lag over time for all patients. A vertical histogram of lag laterality scores in 24 age-matched controls is shown in blue on the left (mean = −0.046, SD = 0.268). The patient lag laterality scores are shown to the right, shaded by lesion side (left-black, right-gray). Figure 2(e) demonstrates that lag tends to occur on the side of the lesion and most often recovers over time. Only seven out of 86 (8.0%) patients at three months post-stroke and five out of 74 (6.1%) patients at one year showed lag laterality >3 SD of controls (Table S1).
Lag predicts performance deficits
Lag laterality – difference in lag values between the left and right hemisphere – provided an objective measure of lag severity that was compared to several clinical and demographic measures (Table 1). We did not find a significant correlation between lag and neurologic history (TIA, Migraine, other), psychiatric history (depression, substance abuse, other), cardiac history (hypertension, CAD, DM, other), and smoking history. None of the patients assessed received thrombectomy. And 12% (13) of patients received tissue plasminogen activator (tPA). Patients receiving tPA showed greater lag than those who had not (P = 0.028).
Next, associations between lesion type and characteristics and lag laterality were investigated. No significant different in lag was identified in hemorrhagic versus ischemic strokes (P = 0.28). Additionally, no difference was found between stroke subtypes defined based on TOAST criteria (ANOVA P = 0.13). However, lag laterality was correlated with lesion size (r = 0.34, P = 5.5 × 10⁻⁵).
Finally, lag laterality was compared to behavioral deficit. Lag laterality was correlated with overall deficit measured by NIHSS (r = 0.26, P = 0.035) and deficit in numerous behavioral domains; spatial attention (r = −0.31, P = 0.0018), sustained attention deficit (r = −0.28, P = 0.0048), spatial memory deficit (r = −0.24, P = 0.015), and language (r = −0.21, P = 0.016). Recovery of lag by one-year post-stroke was correlated with recovery of spatial attention (r = −0.30, P = 0.02). All P-values are not corrected for multiple comparisons.
Areas of lag show reduced blood flow
Figure 3 shows regional lag in stroke patients relative to regional cerebral blood flow (rCBF) and lag laterality relative to internal carotid artery occlusion. rCBF in areas of hemodynamic lag less than 1 s was, on average, 92.46% than that of controls. Areas with lag greater than ∼2 s showed significantly lower rCBF and a monotonic decrease in perfusion with increasing lag (Figure 3). An analysis of variance (ANOVA) showed an effect of carotid occlusion on lag (P = 8.32 × 10⁻⁴), with the ≥80% occlusion group showing greater lag than the ≤ 50% occlusion (t[58] = −3.76, P = 1.97 × 10⁻⁴) and 51–79% occlusion groups (t[11] = −2.25, P = 0.023).
Areas of lag show reduced blood flow. (a) A sample patient showing left hemisphere lag and corresponding areas of hypoperfusion on ASL. (b) The average blood flow as a percent of healthy controls is measured for ROIs and plotted as a function of lag in all 107 sub-acute scans. Areas with greater than 2 s of lag show a significant decrement in rCBF (relative to zero lag) and hypoperfusion increases as lag magnitude increased. (c) Doppler imaging of the internal carotid artery (ICA) on the affected side is categorized as ≤50%, 51–79%, or ≥80% occlusion and compared lag in the affected hemisphere.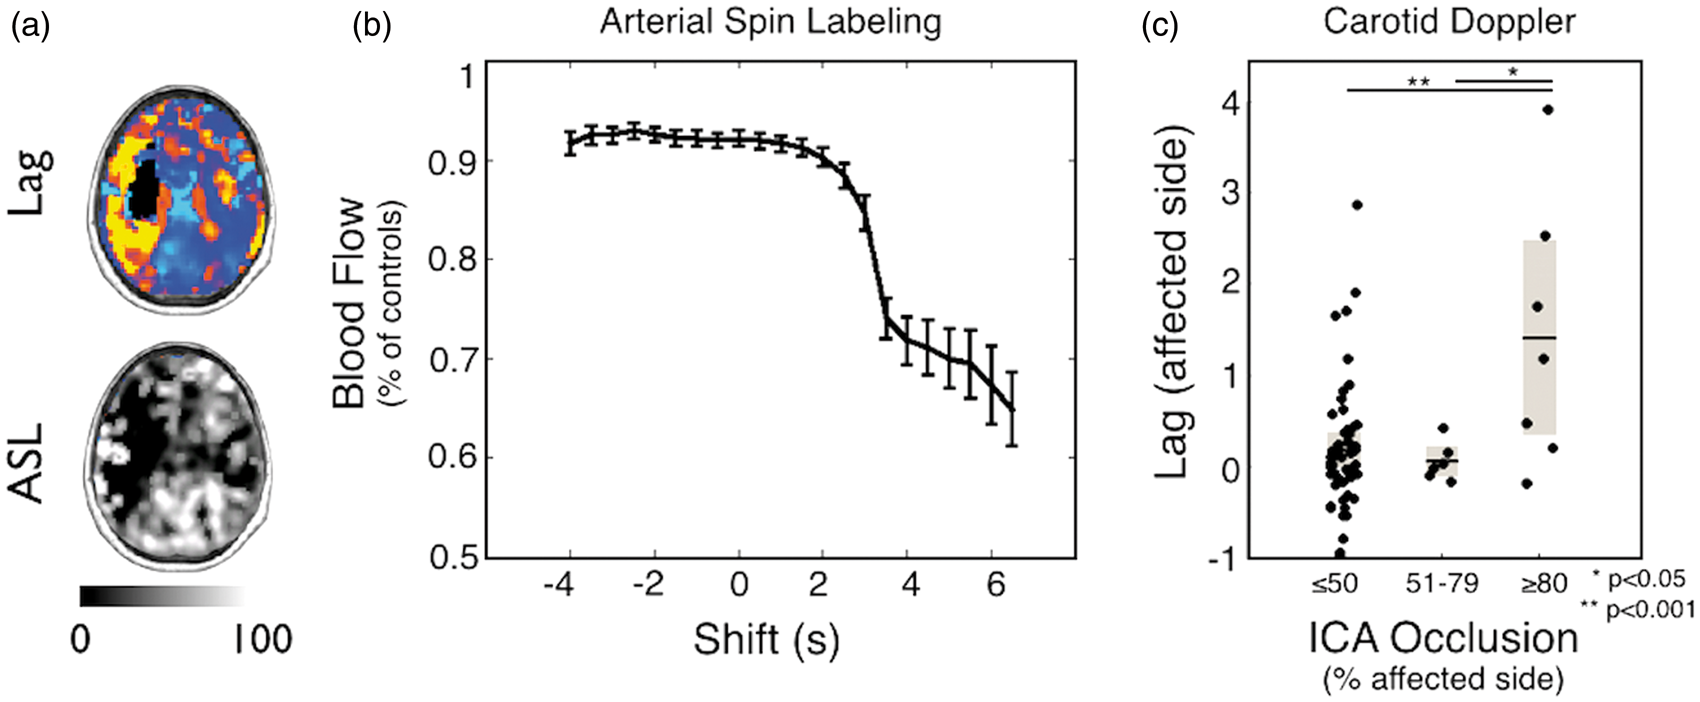
These results raise the question of whether hypo-perfusion in the acute post-stroke period recovers in parallel with lag. To address this question, we measured change in lag (1 year minus 2 weeks) versus change in rCBF for all ROIs showing lag >0 sub-acutely. Although a significant relationship was present between recovery of lag, and recovery of rCBF (Pearson’s r = −0.12; P = 0.039), the variance explained by this relationship was small (r2 = 0.015). This may be because overall, measures of perfusion did not change significantly between two weeks and one year post-stroke (two-week average = 85.7% of controls, one-year average = 86.4% of controls; paired t-test P = 0.3719). Thus, while a strong relationship between lag and rCBF is present sub-acutely, areas in which lag recovers do not necessarily return to normal perfusion.
Lag and resting state functional connectivity
A second goal of this study was to determine how lag affects measurement of resting state functional connectivity (FC). To this end, we explored how lag affects (1) properties of the BOLD signal, (2) measurement of functional connectivity using R-fMRI, and (3) FC-behavior relationships.
Altered BOLD signal power
R-fMRI BOLD signal characteristics were fundamentally altered in areas of lag (Figure 4). The 169 ROIs were divided in to three categories: no lag, lag, and lesion. Signal power was evaluated in the range of 0.009–0.09 Hz. The blue, red, and black lines show BOLD signal power in normal tissue, regions with >2 s lag, and lesion, respectively. Areas of lag showed significantly decreased power relative to no-lag tissue in the range of 0.046–0.09 Hz. In the lower resting state frequency range, power in areas of lag was similar to that of areas of lesion.
BOLD power spectra. ROIs with lag show significantly decreased power relative to ‘no lag’ ROIs in the upper part of the resting state range (0.046–0.09 Hz). Power in this range is closer to that of infarcted regions. Transparent boundaries depict SEM in average power.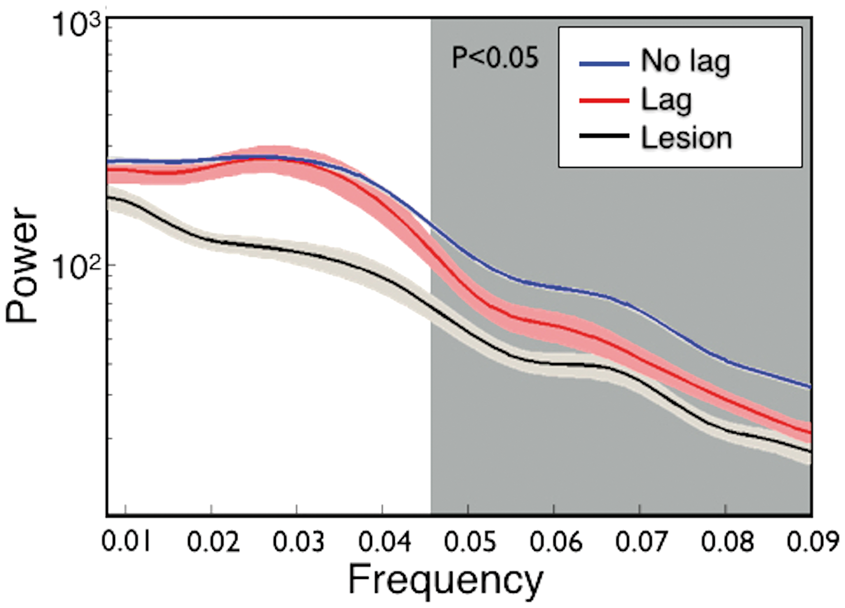
Lag profoundly disrupts functional connectivity but can be partially corrected
Analysis of functional connectivity (FC) revealed that hemodynamic lag considerably alters FC measures after stroke. Figure 5(a) shows seed-based correlation maps for four ROIs in different locations that showed >2 s of lag. The leftmost column shows the four ROIs overlaid on the lag maps. The second column shows the correlation map for each ROI. The third column shows correlation maps after correction by shifting the timecourse by the measured lag. The rightmost column shows the group average correlation map for the same four ROIs in the controls. Correcting timecourses for lag normalized the correlation maps to a considerable extent.
Lag disrupts functional connectivity but can be partially corrected. (a) Seed-based correlation maps for four ROIs in different locations that showed >2 s of lag. The leftmost column show the four ROIs overlaid on the lag maps. The second column shows the correlation map for each ROI. The third column shows the correlation map for each ROI after the courses have been shifted to align optimally with the global signal. The rightmost column shows the average correlation map for the same four ROIs in the controls. Note improved similarity between patient correlation maps and controls following correction. (b) Relationship between lag and FC aberrancy (before and after correcting for lag) across all 169 ROIs and 107 subjects. The red line demonstrates the average aberrancy and SEM for ROIs at different shifts. Correcting timecourses for lag makes the functional connectivity in those regions less aberrant (black line).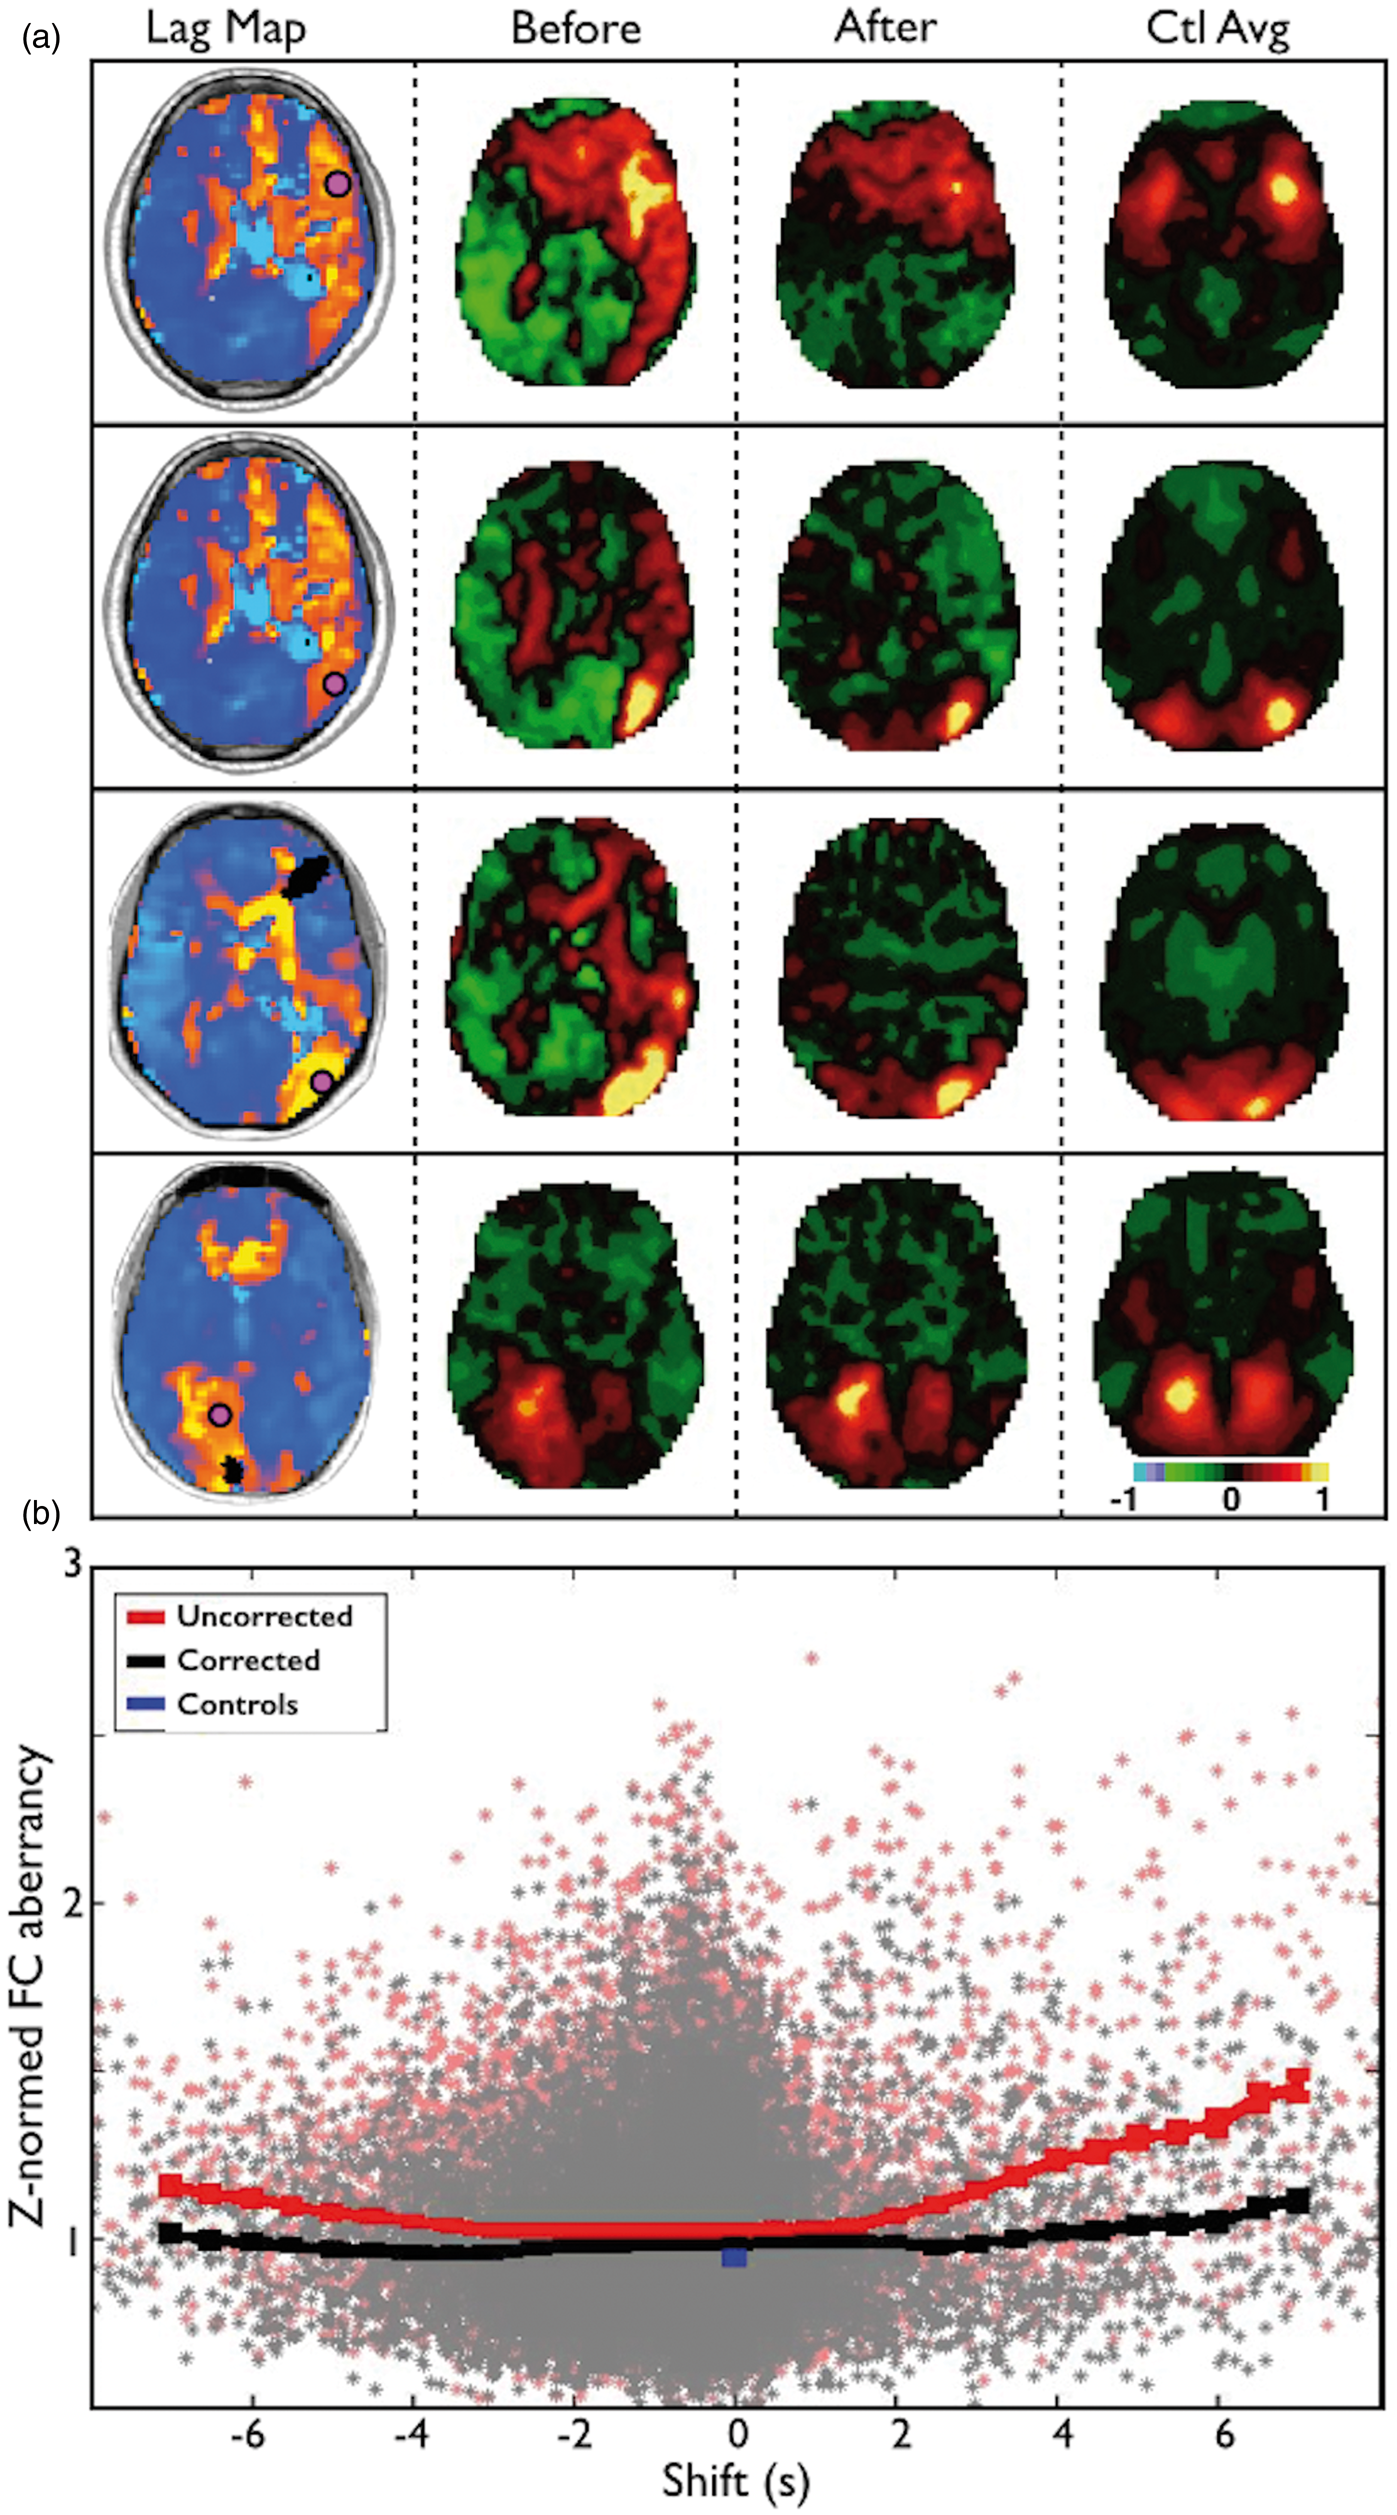
Figure 5(b) shows the relationship between lag and FC aberrancy, before and after correcting for lag, across all 169 ROIs in 107 sub-acute patients. The red line demonstrates that the degree of FC aberrancy monotonically increases with lag above 2 s. Shifting ROI timecourses to correct for lag makes the FC in those regions considerably less aberrant (black line). However, increased abnormality is still evident for lags >2 s even after correction. This result may reflect inherent changes in the frequency content of the BOLD signal in areas of lag (Figure 4).
Stroke FC–behavior relationships persist with lag correction
The observed relationship between lag and behavioral deficits raises important questions regarding previously observed FC–behavior relationships. To determine the effect of lag on previously established FC-behavior relationships, we measured FC–behavior correspondence in interhemispheric motor FC and motor function, and between interhemispheric dorsal attention network (DAN) FC and spatial neglect.
Figure 6(a) demonstrates that lag laterality measured in motor ROIs correlates with motor deficits. Thus, there exists a relationship between hemodynamic lag and behavior. Patients with motor lag laterality >1 s are shaded gray. Figure 6(b) shows that, as previously reported, motor network interhemispheric FC and motor function are highly correlated.
25
We repeated the FC analysis using the lag-corrected timeseries and found that the FC–behavior relationship persists after correction (Figure 6c). Finally, we excluded all subjects with motor lag laterality greater than ±1 s (21/117 subjects) and recomputed the FC–behavior correlation. Figure 6(e) to (h) demonstrates the same results comparing lag and FC in the dorsal attention network with spatial neglect. In both motor and attention networks, removal of subjects with severe lag eliminated the observation of interhemispheric anticorrelations. And in both cases, a robust FC-behavior relationship persisted (Figure 6(d) and (h)).
Stroke FC–behavior relationships persist after lag correction. (a/e) Comparison of lag laterality measured within motor ROIs versus motor deficit or within dorsal attention network ROIs versus neglect reveal a significant relationship between lag and behavior. Patients with motor lag laterality > 1 s are shaded gray. (b/f) Interhemispheric connectivity and function are highly correlated (Pearson’s correlation). (c/g) This relationship persists after lag has been corrected and (d/h) this relationship also persists when all subjects with within-network between-hemisphere lag > 1 s (21/107 for motor, 21/101 for dorsal attention) are excluded. Relationships in (a) and (e) were computed Spearman’s nonparametric rank test; all other relationships were measured with Pearson’s correlation.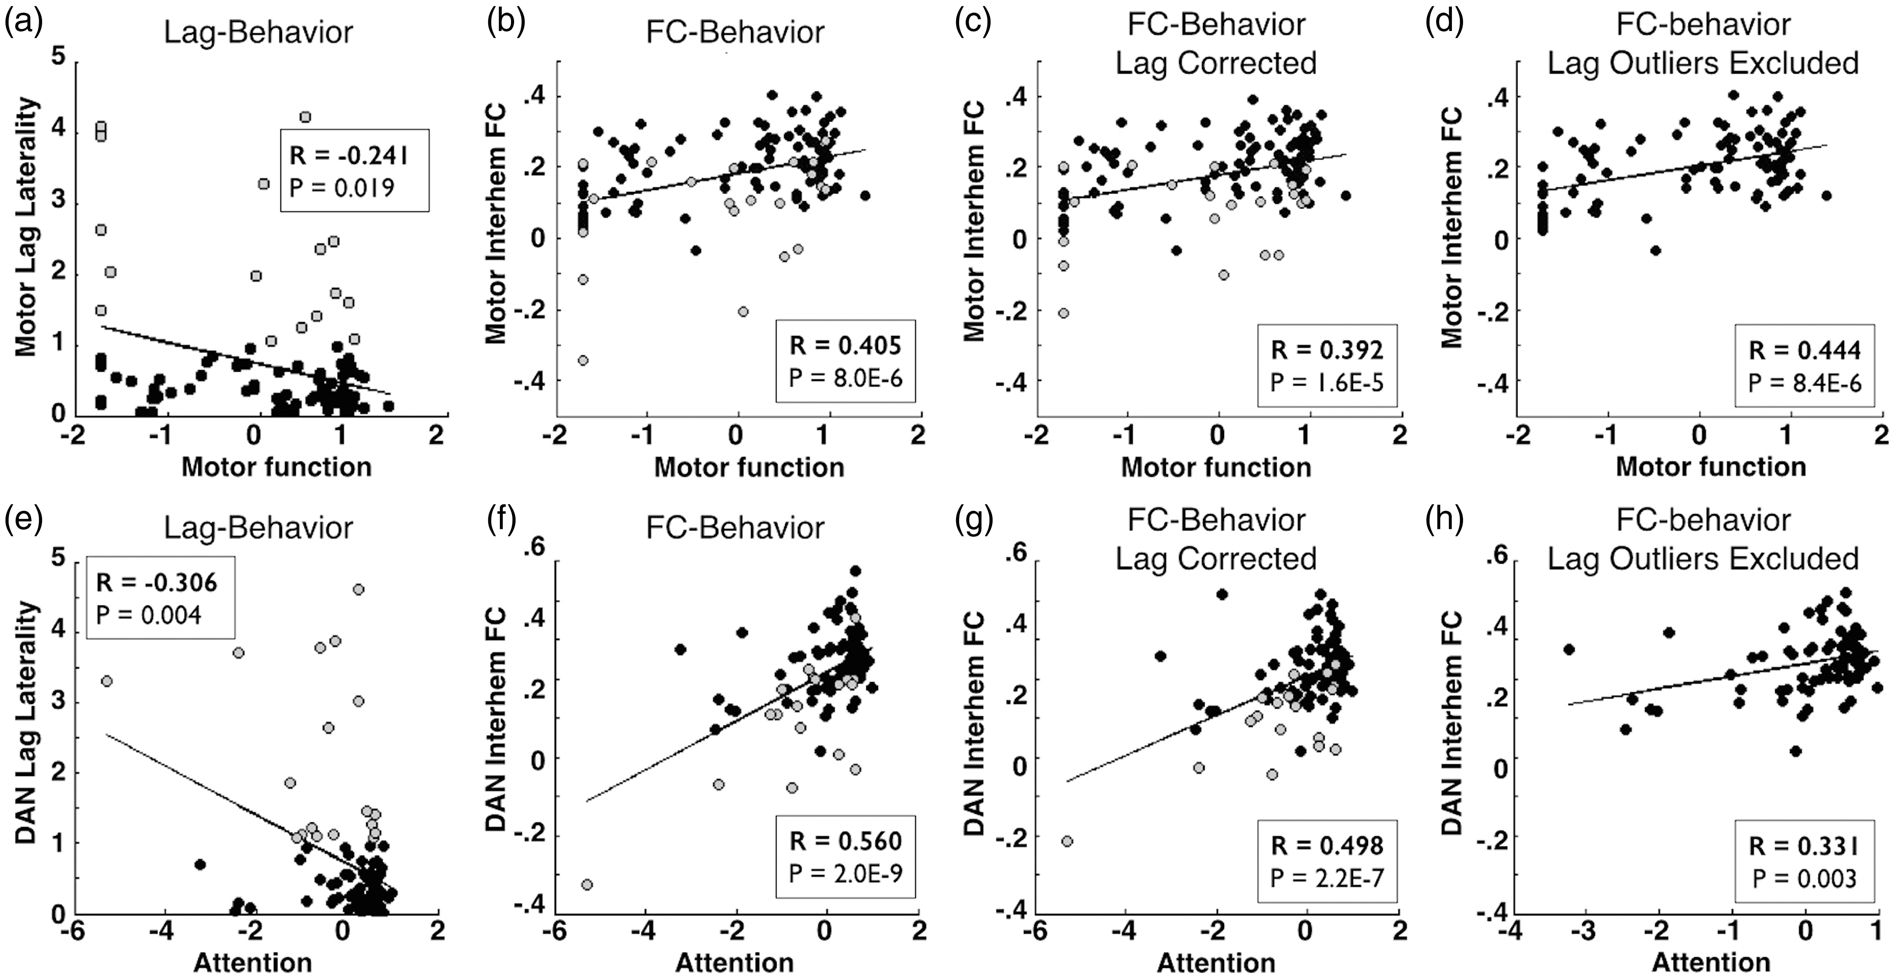
Discussion
Our work builds on previous observations of hemodynamic lag in task-based and resting state fMRI (R-fMRI) in stroke as well as other conditions associated with vascular abnormalities. We extend previous observations by exploring the prevalence of lag in a representative stroke cohort, examining the relationship of lag to rCBF, post-stroke motor deficits, lag changes over the course of recovery, and effects of hemodynamic lag on FC. Areas of hemodynamic lag can be identified in 30% of patients two weeks after stroke, but this fraction drops to closer to one in 10 by one-year post-stroke. Hemodynamic lag preferentially occurs in the vascular distribution of the infarct, and positively correlates with the size of the lesion. We did not observe a relationship between severity of lag and etiology of the infarct (hemorrhagic, ischemic, or ischemic subtype). However, we did observe that lag severity predicts deficit in numerous behavioral domains and that lag recovery predicts improvement in visual field attention deficit (hemispatial neglect). Finally, hemodynamic lag alters measures of FC. Lag-related distortions in FC correlation values can be partially, but not entirely, corrected by temporally shifting timecourses.
Our primary measure of lag was regional delays relative to a gray matter reference signal. Prior studies of hemodynamic lag have used various reference signals including the whole brain signal,9,10 homotopic regions, 26 and superior sagittal sinus. 27 We additionally measured lags between homotopic regions and found that lag laterality measured with a global gray matter references was correlated to lag laterality measured with homotopic reference (r = 0.55, P < 10−9). The gray matter tissue compartment defines a time series representing the hemodynamic response to neural activity averaged over the whole brain. Previous work has shown that subregions within the gray matter compartment normally exhibit lags in the range of 1 s relative to other gray matter regions, which most likely reflect neural rather than hemodynamic phenomenology. 22 Large lags not seen in healthy controls are reasonably attributed to hemodynamics.
Physiological implications
Observed lag following stroke could be caused by (1) cell-level microvascular damage that disrupts neurovascular coupling, (2) rerouting of collateral blood flow, (3) altered neural activity, or some combination of these. Prior evidence together with our findings suggests that cell-level microvascular damage is the most likely cause for hemodynamic lag. Impaired astrocyte and pericyte reactivity (neurovascular coupling) occurs in tissue that is reperfused following ischemic stroke.28,29 In fact, pericytes are more sensitive to ischemia than are neurons or astrocytes.30–32 Damage to pericytes 32 or astrocytes 33 can alter the HDR, suggesting that these cells likely play a role in perilesional hemodynamic changes. The higher rate of lag observed in patients that received tPA may occur because areas of transient ischemia that are reperfused as a results of the clinical intervention experience microvascular damage. Moreover, the observed decrease in BOLD signal power above 0.046 Hz (Figure 2c) may represent altered HDR kinetics. 0.046–0.09 Hz is the range of frequencies in the normal hemodynamic response to task-induced neural activity. 34 Damage to pericytes or astrocytes could therefore reduce signal power in this range and could additionally lead to temporal delay by acting as a low-pass filter.
Blood flow after stroke may be rerouted through newly recruited collaterals 35 with consequent changes in arterial transit time. Mean arterial transit time can be thought of as the static component of cerebral perfusion while the HDR represents responses to neural activity. Therefore, a previously reported association between hemodynamic lag and mean arterial transit time10,27 could suggest that lag is attributable to static blood flow changes. However, static changes alone do not account for hemodynamic lag of the presently observed large magnitudes (>2 s) because changes in transit time typically are on the order of less than 1 s. 36
Altered neural activity theoretically could contribute to observed hemodynamic lags. However, in our data, lags were observed in white matter (Figures 1–3 and 5), which reflect predominantly the static component of perfusion. Further evidence against a neuronal etiology has been obtained by prior studies of cerebrovascular disease patients with severely impaired BOLD fMRI responses to stimuli despite normal behavior37,38 and normal neuronal responses (measured with MEG). 39
Although hemodynamic lag is unlikely to reflect delayed neural responses, it is evident that neural function is affected in areas of hemodynamic compromise. 40 We observed a strong association between lag laterality (lag difference between hemispheres) and visual field bias (Table 1). This result is consistent with previous observations in cerebral microangiopathy patients linking delays in task evoked hemodynamic responses to performance deficits on a Stroop task. 41 Similarly, focal right hemisphere perfusion deficits have been documented in stroke patients with hemispatial neglect. 42 Thus, the available evidence suggests that perfusion deficits can lead to abnormal brain function. However, many questions remain regarding how hemodynamic disruption affects neural and cognitive function, both acutely and chronically.
Prognostic implications
Although the pathophysiology of resting state hemodynamic lags is uncertain, our results suggest that lag indexes hemodynamic disruption and potentially reversible tissue compromise. Following stroke, lag occurs in the vascular distribution of the infarct, and correlates with measures of clinical deficits, mean transit time9,10,27 and with hypoperfusion. Prior studies have linked hemodynamic failure to infarct extent43,44 and to risk of future ischemic stroke. 45 Measuring lag by R-fMRI is non-invasive and may have important prognostic utility. But, fully understanding the prognostic implications of resting state hemodynamic lag will require follow-up beyond our one-year endpoint.
We acquired 30 min of resting state data. In future studies, it should be noted that analyzing 400 s of high quality resting state data is sufficient to identify the existence of lag (Figure S2, Supplementary material). However, the reliability of lag maps continues to increase even after 20 min of resting state data acquisition.
Lag disrupts measurement of functional connectivity
Our results demonstrate that hemodynamic disruption following stroke produces artifactual FC effects. In addition to delay relative to the global signal, areas of lag showed significantly decreased BOLD signal power relative to no-lag tissue at frequencies above 0.046Hz. This observation implies that simply shifting timecourses to re-align with the global signal will not adequately correct quantitative measures of FC.
Recent studies have used FC analysis of R-fMRI data to study brain network reorganization following stroke.14,23,25,46xref ref-type="bibr" rid="bibr50-0271678X15614846"/>–58 Importantly, our data show that previously published post-stroke FC-behavior relationships persist even when subjects showing pathologic lag (delay of at least 1 second between affected and unaffected hemispheres) are removed from analyses. This observation confirms that post-stroke FC changes are not trivially caused by altered hemodynamics, but rather represent pathological alterations in neuronal communication and network structure. Excluding subjects with pathologic lag eliminated the observation of interhemispheric anticorrelations (while correcting lag often only decreases the magnitude of anticorrelations), suggesting that homotopic anticorrelation may be a useful indicator pathologic lag in other stroke FC data sets.
We observed that shifting timecourses to re-align with the global signal reduced FC changes caused by lag. However, we do not recommend this maneuver as a means of accounting for lag-related disruptions in future stroke FC-behavior studies. The observed decrease in resting BOLD signal power suggests that the signal in areas of lag is fundamentally altered. Thus, simply shifting timecourses will not adequately correct quantitative measures of functional connectivity.
Limitations
From the present study it is impossible to determine the relationship of stroke to lag, only that they co-occur in individual brains and in a common spatial distribution. The following limitations are noted.
Computation of hemodynamic lag undoubtedly includes measurement error. In particular, Figure 2(b) shows regions that lead the global gray matter signal by >2 s. This observation has been previously reported. 9 However, we assign no particular pathological significance to this phenomenon. Conversely, lag is considerably more prevalent in the stroke group than controls, lawfully follows vascular distributions, and correlates with clinical deficits. All of these lines of evidence suggest that regional lags indicate hemodynamic compromise.
Lastly, it is possible that the correlation between hemodynamic lag and hypoperfusion is inflated by the pulsed arterial spin labeling method. In PASL, an excitation pulse labels arterial blood in the carotid artery and then tissue saturation is measured after a delay (bolus arrival time). We used a bolus arrival time of 1100 ms. If areas of lag show elongated arterial arrival time, then the perfusion measurement may be occurring prior to the signal peak in those areas and thus appear artificially lowered.36,59 This phenomenon has been reported in stroke patients 60 and multi-delay ASL sequences have been developed to measure and correct it. 61
Conclusion
Our results suggest that hemodynamic lag can be measured non-invasively using R-fMRI, occurs frequently following stroke, and considerably disrupts measurement of functional connectivity. FC–behavior relationships remain even when subjects showing lag have been removed from analyses. Resting state lag only provides a glimpse into the disruption that has occurred at a cellular and microvascular level. This work raises important questions regarding the mechanisms and physiological implications of hemodynamic lag that will require further work and better experimental models.
Footnotes
Funding
The author(s) disclosed receipt of the following financial support for the research, authorship, and/or publication of this article: This study was supported by the National Institute of Child Health and Human Development Health award (5R01HD061117 to MC), the National Institute of Neurologic Disorders and Stroke (P30 NS048056 to AZS), and the National Institute of Health Medical Scientist training award and the American Heart Association Predoctoral Fellowship Award (5T32GM007200-39 and 14PRE19610010 to JSS).
Acknowledgment
Additional thanks to Lawrence Snyder, Anish Mitra, Tomer Livne, Adam Bauer, Beau Ances and Colin Derdeyn for conceptual guidance, to Nick Metcalf and Antonello Baldassarre for data processing, and to Sarah Krall and Tomer Livne for manuscript revision.
Declaration of conflicting interests
The author(s) declared no potential conflicts of interest with respect to the research, authorship, and/or publication of this article.
Authors’ contributions
LR oversaw acquisition of imaging and neuropsychological data. LR, JS, and AS processed and analyzed data. JS created and debugged the algorithm. JS, AS, LR, GS and MC participated in conceiving the study design, interpreting results, and writing and revising the manuscript.
References
Supplementary Material
Please find the following supplemental material available below.
For Open Access articles published under a Creative Commons License, all supplemental material carries the same license as the article it is associated with.
For non-Open Access articles published, all supplemental material carries a non-exclusive license, and permission requests for re-use of supplemental material or any part of supplemental material shall be sent directly to the copyright owner as specified in the copyright notice associated with the article.