
Abstract
Currently, a reliable method for real-time prediction of ischemia in the human brain is not available. Here, we took a first step towards validating non-invasive intraoperative laser speckle imaging (iLSI) for prediction of infarction in 22 patients undergoing decompressive surgery for treatment of malignant hemispheric stroke. During surgery, cortical perfusion was visualized and recorded in real-time with iLSI. The true morphological infarct extension within the iLSI imaging field was superimposed onto the iLSI blood flow maps according to a postoperative MRI (16 h [95% CI: 13, 19] after surgery) with three-dimensional magnetization-prepared rapid gradient-echo and diffusion-weighted imaging reconstruction. Based on the frequency distribution of iLSI perfusion values within the infarcted and non-infarcted territories, probability curves and perfusion thresholds of normalized cerebral blood flow predictive of eventual infarction or non-infarction were calculated. Intraoperative LSI predicted and excluded cortical ischemia with 95% probability at normalized perfusion levels below 40% and above 110%, respectively, which represented 73% of the entire cortical surface area. Together, our results suggest that iLSI is valid for (pseudo-) quantitative assessment of blood flow in the human brain and may be used to identify tissue at risk for infarction at a given time-point in the course of ischemic stroke.
Keywords
Introduction
The occurrence of ischemic brain lesions is a major complication during neurosurgical procedures. Intraoperative real-time monitoring of cerebral blood flow is in demand for immediate detection of ischemia. Here, threshold limits of cerebral perfusion could serve to directly determine brain tissue at risk of irreversible ischemic damage.1,2 Although radiotracer emission-computed tomography techniques such as PET 3 or SPECT 4 permit identification of specific metabolic and perfusion thresholds 5 and multimodal intraoperative imaging modalities such as dynamic perfusion CT or MRI perfusion studies are used to study cerebral hemodynamics offline,6–8 application of this technology for continuous, intraoperative online monitoring of tissue viability remains limited for obvious reasons.
Optical blood flow imaging by laser speckle contrast has been used extensively in experimental models of cerebral ischemia because of its ability to provide continuous real-time images of the spatial and temporal blood flow dynamics.9–13 More recently, intraoperative Laser Speckle Imaging (iLSI) was shown sensitive to blood flow changes in the human brain and feasible for non-invasive real-time monitoring of relative cerebral blood flow (CBF) within the cortical parenchyma.14–17 Importantly, iLSI can also be smoothly integrated into surgical workflow without requiring demanding logistics. At present, however, clinical validation of iLSI remains challenging due to the complex physics that relate the measured cerebral perfusion values to the underlying absolute CBF 18 and because information on perfusion is only obtained on the surface of the brain.
In this study, we took a first step towards validating iLSI by establishing laser speckle-specific perfusion thresholds for infarcted and non-infarcted cortical brain tissue in patients with malignant hemispheric stroke (MHS) and the clinical need for decompressive craniectomy (DC).
Materials and methods
Patient management
This study was approved by the local research and ethics committee of the Charité – Universitätsmedizin Berlin (EA4/109/07). Informed consent was obtained from the patient or legal representative. Twenty-two patients [n = 13 males, n = 9 females; median age 60.5 (range 29–82)] with subtotal or total middle cerebral artery infarction with or without infarction in the anterior or posterior cerebral artery territory and the clinical need for decompressive hemicraniectomy19,20 were included and treated according to the guidelines of the German Society of Neurosurgery. The initial neurological deficit was assessed using the Glasgow Coma Scale (GCS) and modified National Institutes of Health Stroke Scale (mNIHSS). The outcome was evaluated at six months using the modified Rankin Scale score (mRS).
For surgical decompression and to protect from brain swelling, all patients were anaesthetized with propofol and remifentanil and received a bodyweight-adapted dose of 50 mg/kg mannitol 30 min before skin incision, according to our institutional guidelines. To avoid movement of the optical imaging field and minimize hemodynamic fluctuations during the cortical perfusion measurement, the patients’ head was immobilized in a three-pin Mayfield clamp and a mean arterial blood pressure (MAP) of 85 mmHg was targeted and co-registered. By default, the end-expiratory carbon dioxide (CO2) concentration during surgery was maintained at a level corresponding to an arterial partial pressure of carbon dioxide (PaCO2) between 38 and 42 mmHg. Postoperatively, patients were transferred to our neurointensive care unit. Intracranial pressure (ICP) was continuously monitored and patients remained intubated and sedated until ICP was within normal ranges. A critical ICP threshold was defined as ICP > 20 mmHg for longer than 10 min and treated according to national and international guidelines with cerebrospinal fluid drainage, osmotic therapy and deep sedation.
Intraoperative Laser Speckle Imaging
After bone removal and durotomy, a laser speckle imager (MoorFLPI, Moor Instruments Ltd., Axminster, UK) was positioned perpendicular over the infarcted hemisphere with a distance of 300 mm and cortical perfusion in the arbitrary perfusion unit CBF-Flux was measured for 20 min.16,17 CBF-Flux was recorded within an 18 × 24 cm imaging field over the exposed cortical hemisphere with purpose designed data acquisition software (MoorFLPI measurement software, Version V3.0, Moor Instruments, Axminster, UK) at 25 Hz using a temporal filter of 100 frames per image resulting in a scan rate of 0.25 Hz to allow optimal spatial resolution (760 × 568 pixel, exposure time 8.4 ms) and minimize potential motion artifacts due to spontaneous rapid blood flow fluctuations. Identical focal lens settings and exposure times were maintained during all measurements. Direct illumination of the surgical field by light sources other than the laser light was avoided.
Magnetic resonance imaging
During MRI scanning, MAP was targeted at 85 mmHg. The total infarct volume was determined from matched diffusion weighted imaging (DWI) and fluid-attenuated inversion recovery (FLAIR) sequences of the MRI scans with the aid of iPlan Cranial surgical planning software (Brainlab, Feldkirchen, Germany). For volumetric analysis, the infarct volume was corrected for hemispheric swelling. For exclusion of significant hemodynamic mismatch at the time-point of MRI by perfusion-diffusion mismatch analysis, perfusion-weighted imaging was performed with a serial T2* weighted single-shot gradient echo-planar imaging sequence. Gadolinium-contrast agent (0.1 mmol/kg bw; Magnevist®; Schering) was injected as a bolus rate of 4–6 mL/s.
Image fusion of MRI and iLSI
To investigate the predictive value of iLSI blood flow measurements, cortical areas on the color-coded iLSI perfusion maps were categorized as infarcted or non-infarcted according to their DWI appearance on a postoperative MRI. To superimpose the true morphological infarct extension onto the intraoperative laser speckle blood flow maps, we first manually generated a three-dimensional (3D) slice-by-slice reconstruction of the cortical surface and the infarct volume based on the magnetization-prepared rapid gradient-echo (MP-RAGE) and DWI sequences (Visage Imaging 7 software, Visage Imaging, Berlin, Germany). Next, the 3D MP-RAGE and DWI infarct volume reconstructions were merged to visualize the extent of the infarcted cortical surface area (based on the cortical DWI signal change) within the 3D MP-RAGE reconstruction (Figure 1a). The merged 3D DWI/MP-RAGE reconstruction was then superimposed onto the gray-scale raw speckle images by using flattening techniques and anatomical point-by-point landmark matching (iPlan Cranial software, Brainlab, Feldkirchen, Germany; Adobe Photoshop CS5, Adobe Systems, San José, CA, USA) as described previously
16
and the outline of the cortical infarct extension was transferred from the gray-scale raw speckle images to the corresponding iLSI blood flow map (Figure 1b).
(a) Three-dimensional cortical surface reconstructions from the MP-RAGE dataset of the postoperative MRI (upper panel) with overlay of the cortical infarct extension according to the DWI signal change (lower panel). The dashed rectangle represents the corresponding area of intraoperative laser speckle blood flow imaging illustrated on the right. (b) Screenshots of intraoperative gray-scale raw speckle images (left panels) and corresponding blood flow maps (right panels) show a frontal area of suspected undisturbed perfusion next to potentially infarcted cortex. The online gray scale raw speckle images were used to compute the color-coded speckle contrast image. For this purpose, the speckle contrast k for any given square of 5 × 5 pixels was calculated and assigned to the central pixel of the square by the image acquisition software. This process was repeated across the entire optical imaging field of 568 × 760 pixels to obtain the processed color-coded blood flow map. The scale bars indicate the image intensity of the 8-bit gray scale raw speckle image (0–255) and the relative perfusion calculated in CBF-Flux (0–3500). The superimposed red and green surface areas show the true morphological infarct extension according to the DWI signal change in the MRI. (c) Gray-scale raw speckle image and color coded perfusion map after manual superimposition of regions of interest (ROIs) outside of the cerebral surface vasculature for calculation of cortical perfusion within the parenchyma of the infarcted and non-infarcted territory. For the purpose of standardization, all pixel areas within each ROI were normalized against the mean perfusion within the non-infarcted territory, defined as 100%.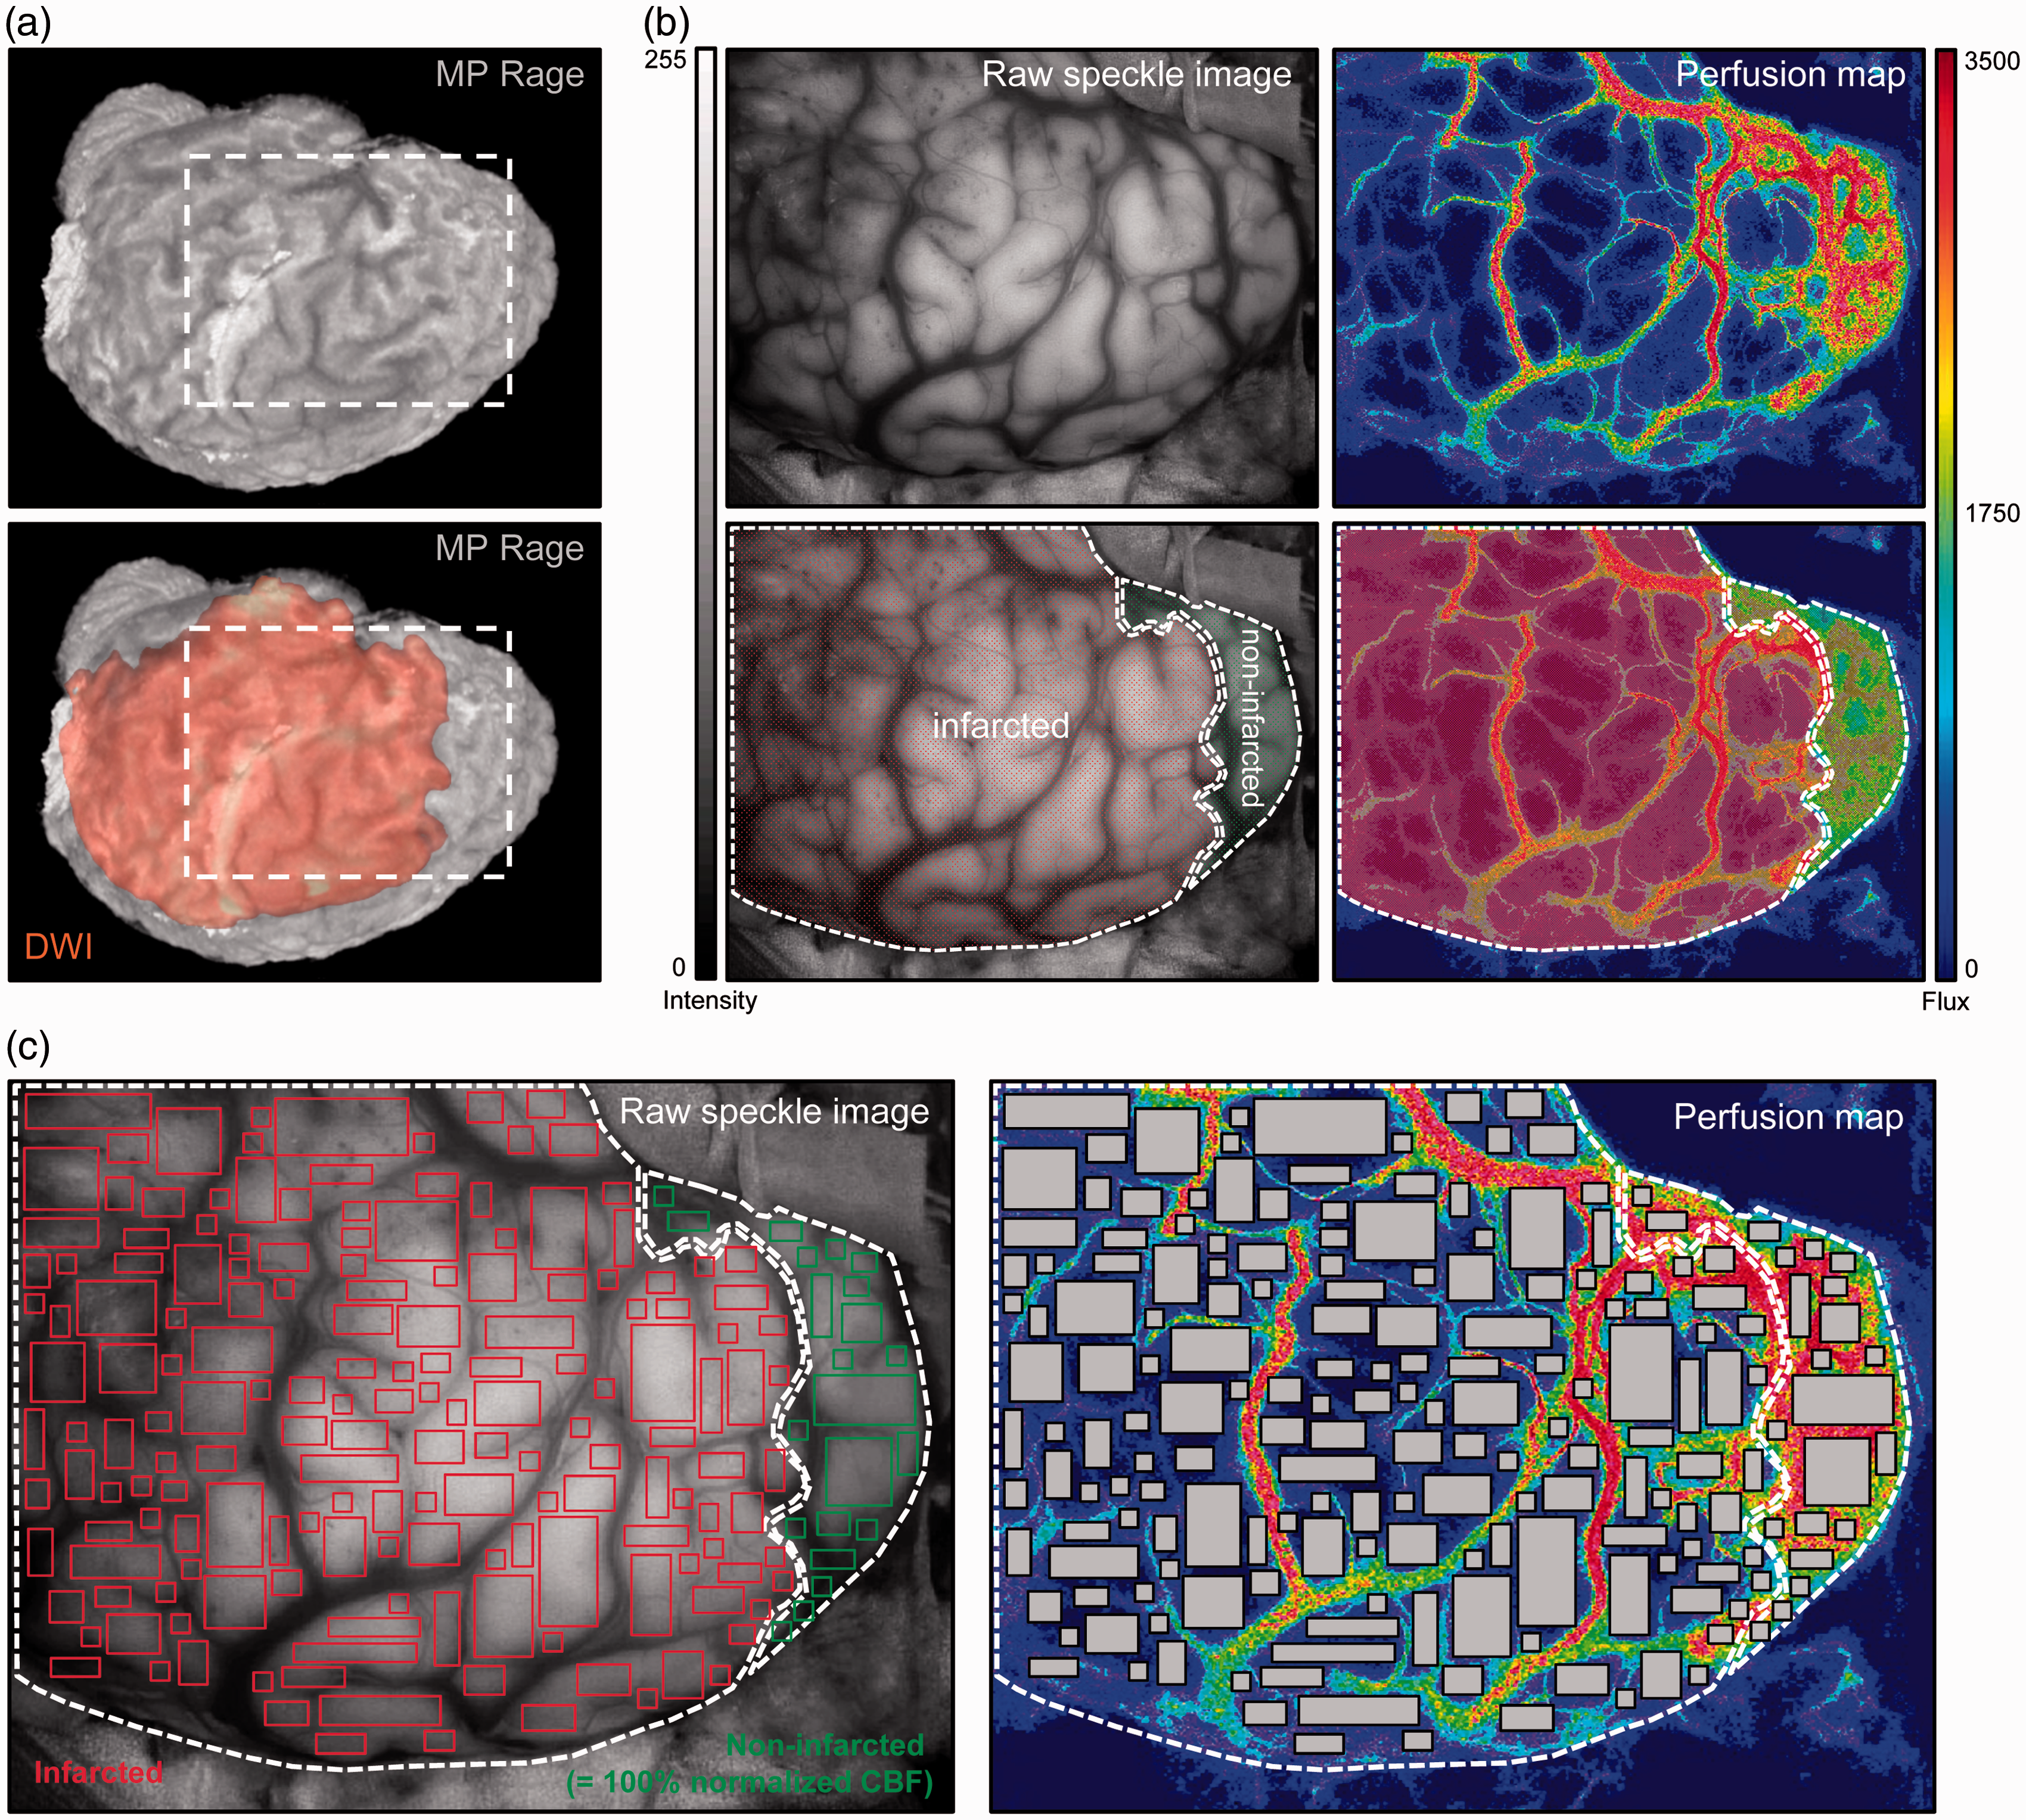
Image and data processing of laser speckle blood flow maps
Cortical perfusion within the iLSI imaging field was calculated from a 5-min steady-state iLSI measurement period without motion artifacts and a stable MAP between 85 and 90 mmHg. Equivalent to an iLSI scan rate of 0.25 Hz, this resulted in 75 consecutive laser speckle blood flow maps in each patient, from which the mean cortical perfusion was calculated.
The iLSI blood flow maps were deliberately analyzed under exclusion of the large surface vasculature of the brain. To define the boundaries of the parenchyma pixels analyzed, rectangular regions of interest (ROIs) in variable shapes and sizes were positioned within the cortical parenchyma to cover the entire area of the surgically exposed imaging field apart from the large cerebral surface vessels (Figure 1c) (MoorFLPI review software, Version V3.0, Moor Instruments, Axminster, UK). Within each ROI and patient, a pixel-by-pixel calculation of arbitrary cortical perfusion (CBF-Flux) was performed within the infarcted and non-infarcted areas. In each patient, CBF-Flux of each pixel area within the infarcted and non-infarcted territories was normalized in relation to the total mean CBF-Flux in the territory categorized as non-infarcted, which was defined as 100% (Figure 1c). 21 Next, normalized CBF values between 0% and 160% of all patients were grouped into bins of 5% for calculation of a mean CBF frequency distribution within the infarcted and non-infarcted regions.
Calculation of perfusion thresholds for infarct prediction
The algorithm for calculation of the perfusion thresholds for infarct prediction based on morphological outcome (defined by tissue appearance on the MRI) and normalized CBF (defined by normalized iLSI measurements) is illustrated in Figure 2. The threshold probability was determined in 5% incremental steps for normalized CBF values between 0% and 160%. The positive prediction curve as the proportion of morphologically infarcted cortex with normalized CBF values at or below a given threshold was determined by calculating the positive predictive value [PPV = a/(a + b)] at each incremental threshold step. Similarly, the negative prediction curve as the proportion of non-infarcted cortex with normalized CBF values at or above a given threshold was calculated by determining the negative predictive value [NPV = d/(c + d)] at each incremental threshold step. The point of intersection between the positive and negative prediction curves at a conventional probability level of 0.95 was used to identify the perfusion thresholds for infarct prediction or exclusion with 95% probability.
Schematic used to compute prediction curves for perfusion threshold limits from morphological outcome according to DWI appearance and normalized values of normalized CBF. The test threshold (dashed vertical line) is moved in 5% incremental steps between 0% and 160% of normalized CBF. At each step, the observed normalized CBF frequencies (a, b, c, d) are counted in each of the four cells. The positive and negative predictive values at each step are calculated as a/(a + b) and d/(c + d), respectively.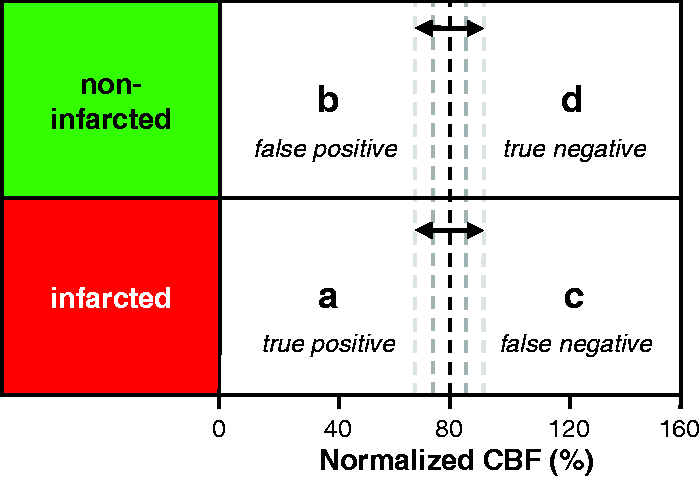
Percent distribution of normalized CBF values on the cortical surface
Following the identification of normalized iLSI-specific perfusion thresholds at a prediction rate of 0.95, we calculated the percentage of normalized cortical perfusion values on the cortical surface. For this purpose, the (percent) fractions of normalized cortical perfusion values below, between and above the determined thresholds were calculated based on the normalized CBF frequency distributions in the infarcted and non-infarcted tissue.
Statistics
Data was expressed as mean with 95% confidence interval (95% CI: lower limit, upper limit) or percentage, as appropriate. Statistics were performed with GraphPad Prism for Mac (Version 5.0f, GraphPad Software, San Diego, CA, USA).
Results
Summary of demographic and clinical patient data.
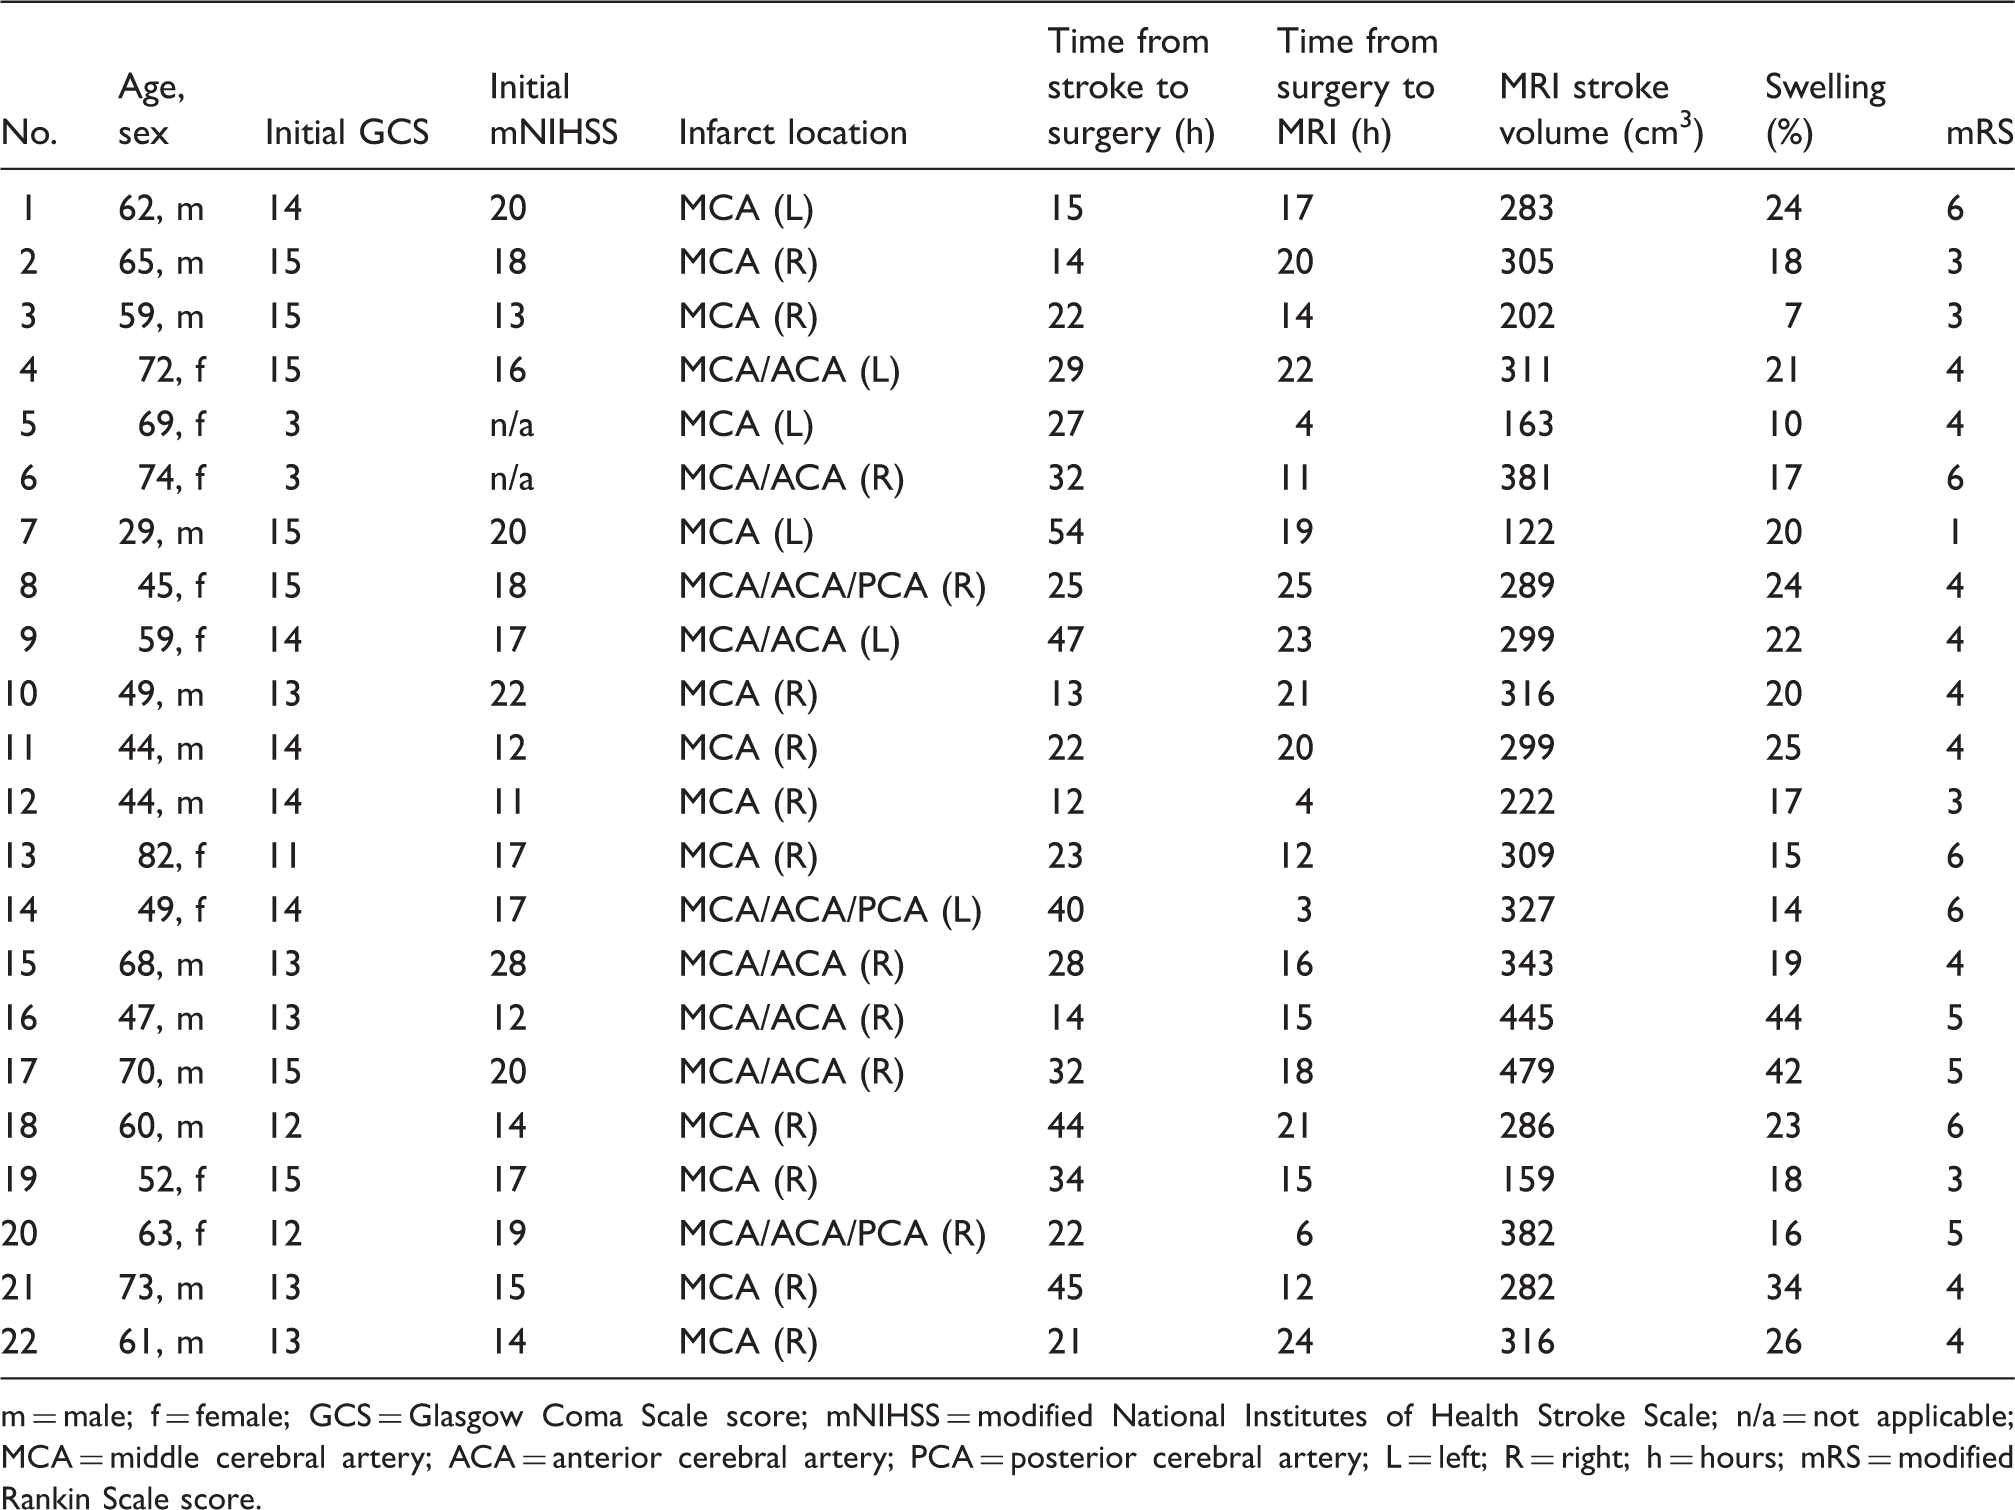
m = male; f = female; GCS = Glasgow Coma Scale score; mNIHSS = modified National Institutes of Health Stroke Scale; n/a = not applicable; MCA = middle cerebral artery; ACA = anterior cerebral artery; PCA = posterior cerebral artery; L = left; R = right; h = hours; mRS = modified Rankin Scale score.
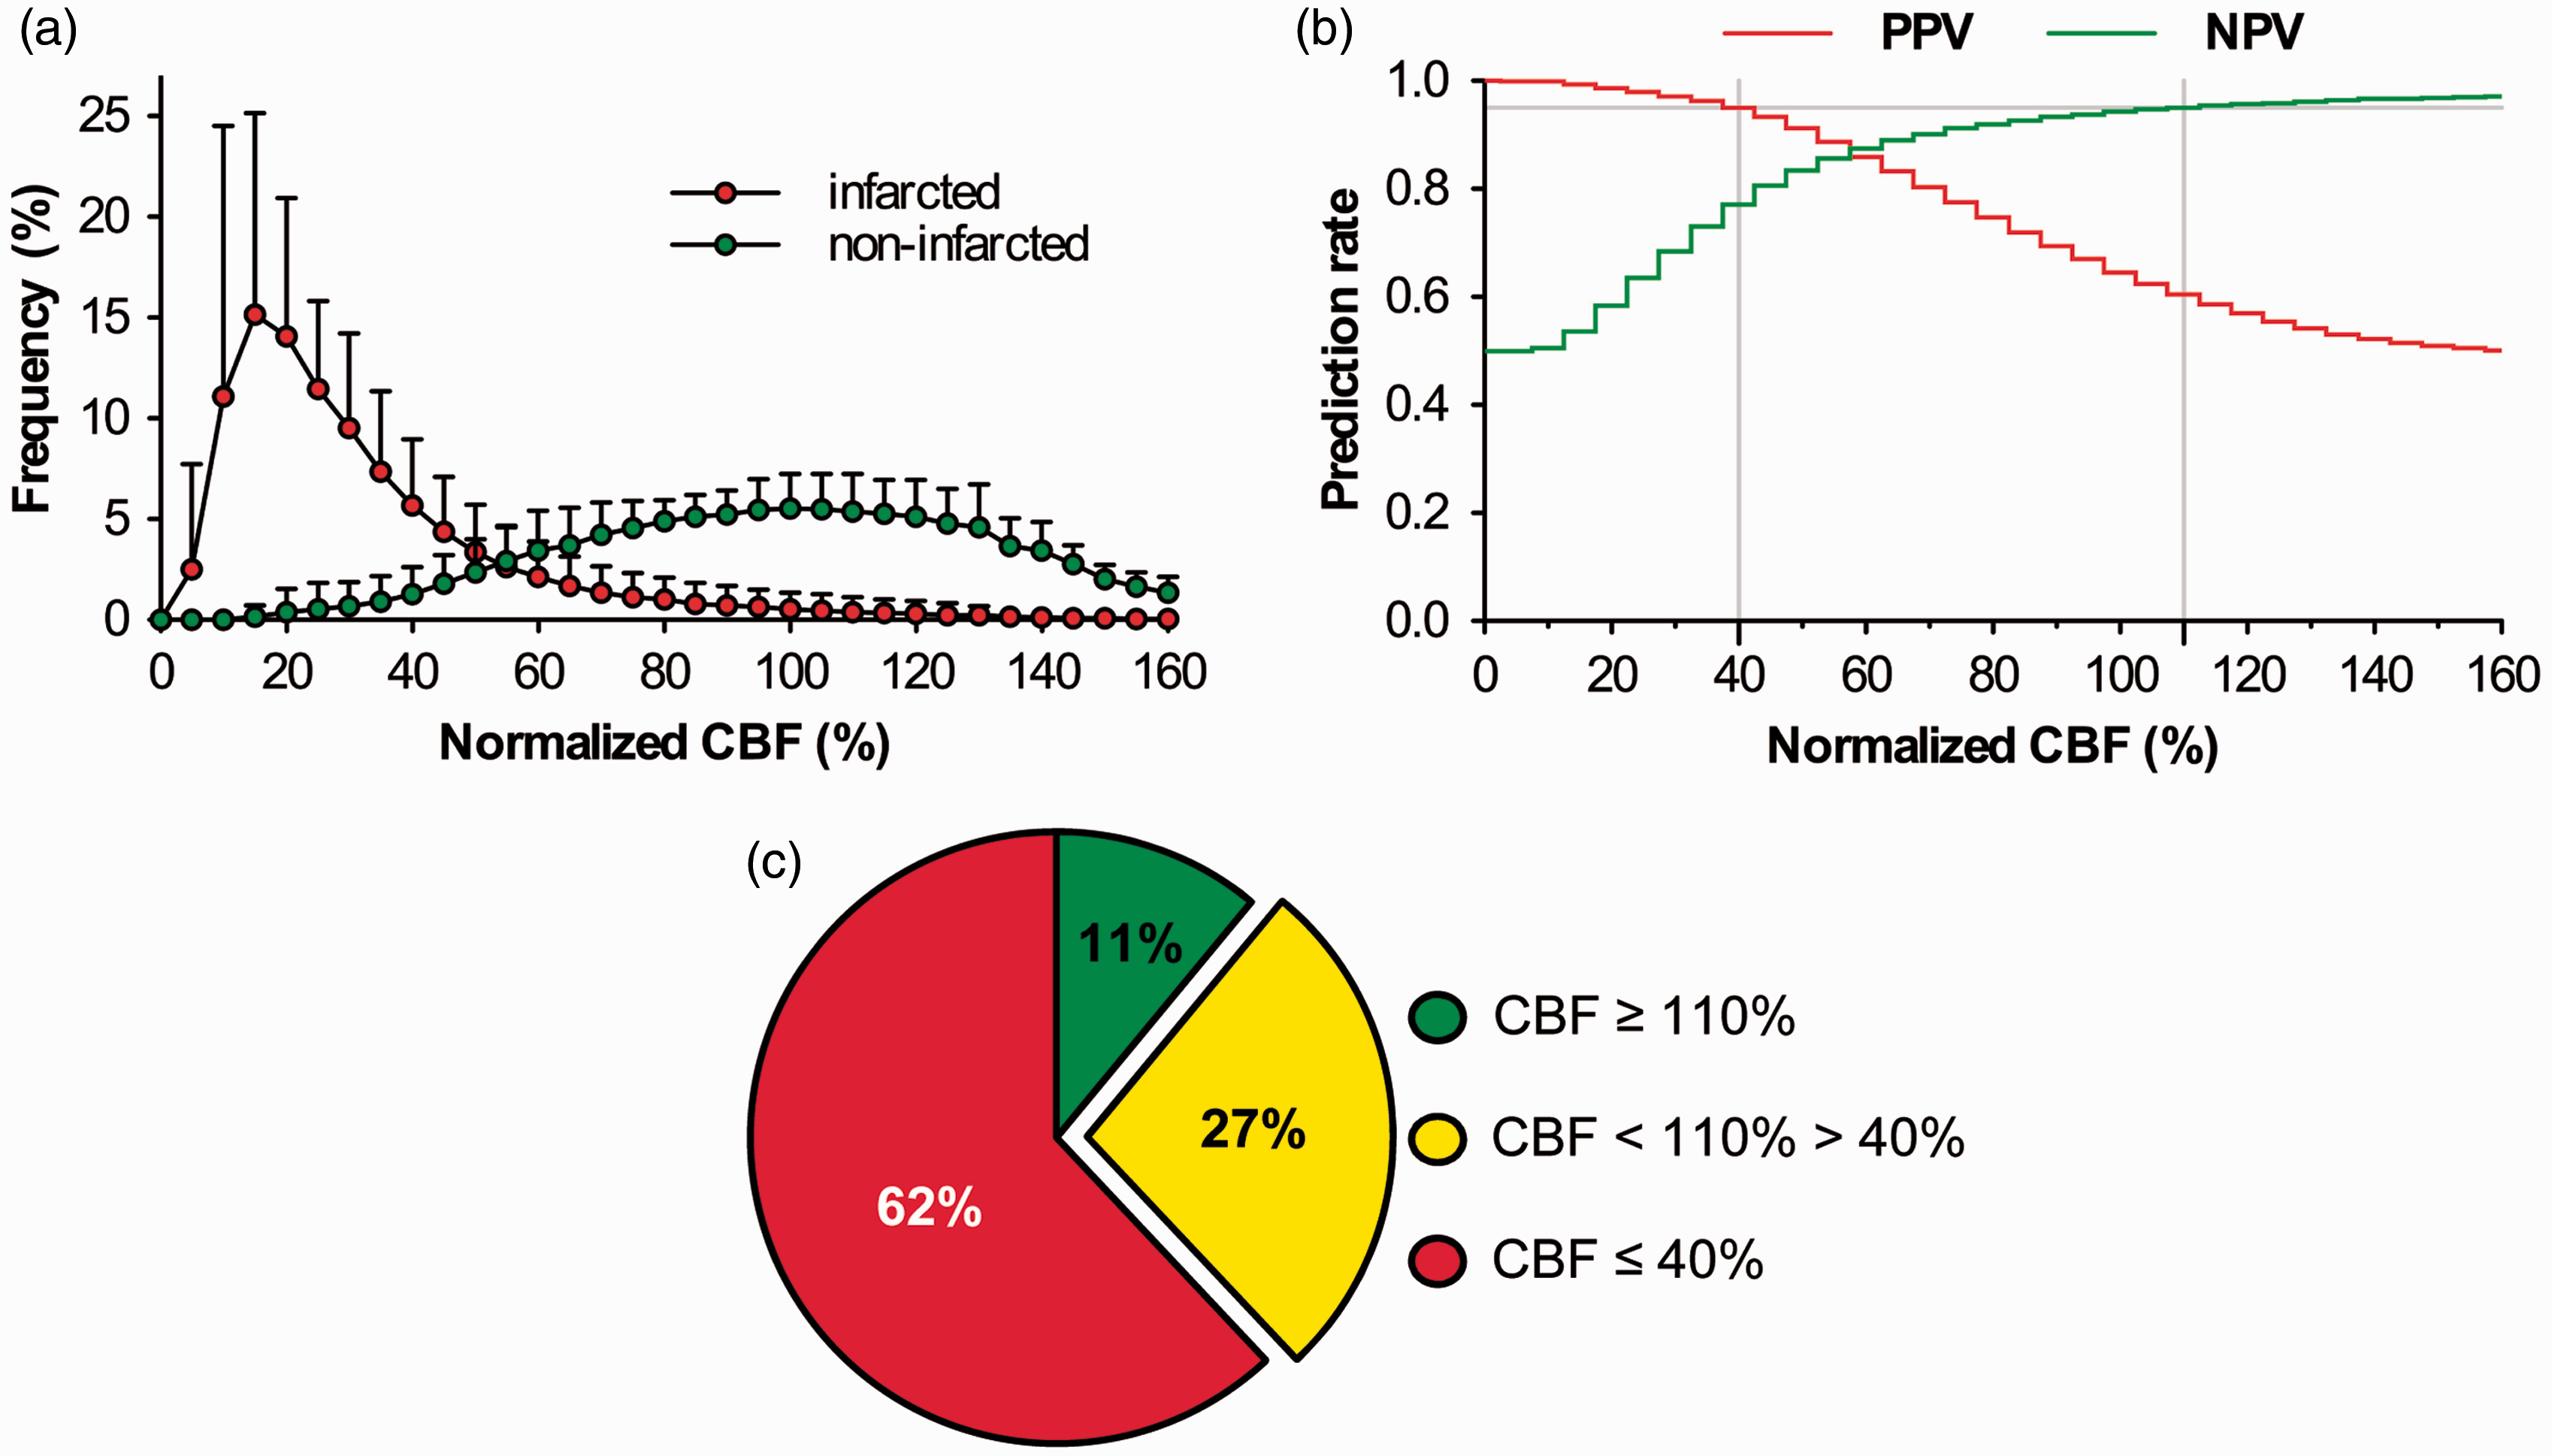
For data pooling of the iLSI measurements, each patient contributed a mean 57580 (95% CI: 49126, 66033) pixel areas in the infarcted and 16190 (95% CI: 9564, 22817) pixel areas in the non-infarcted territory, depending on the cortical extent of the infarct and the exposed cortical surface area following DC. The mean percentage of the infarcted and non-infarcted pixel areas in all patients was determined at 77% (95% CI: 69, 84) and 23% (95% CI: 16, 31), respectively (Figure 3). The frequency distribution of normalized CBF yielded a clear positive skew of eventually infarcted pixel areas of interest compared to a more symmetrical CBF distribution of non-infarcted volumes of interest (Figure 4a). The calculation of positive and negative prediction curves for infarction based on the relationship between normalized CBF and morphological outcome yielded prediction rates for eventually infarcted and non-infarcted tissue with 95% probability at perfusion thresholds ≤40% and ≥110%, respectively (Figure 4b). To get an idea to what extent iLSI may permit a representative estimation of eventual infarction or non-infarction in our patients, normalized CBF of all hemispheres was then divided into three groups according to the previously determined perfusion thresholds. The percentage analysis of normalized CBF values within our determined thresholds revealed that infarcted (≤40%) and non-infarcted (≥110%) perfusion values covered 62% respective 11% of the entire cortical surface area, whereas perfusion values between these thresholds accounted for 27% of the visualized cortex (Figure 4c). Thus, iLSI was able to provide a reliable (95%) prediction of cortical infarction or non-infarction for 73% of the cortical surface area compared to the 27% of brain tissue where perfusion values indicated a more uncertain prognosis in patients with MHS.
(a) Illustrative cases showing the distribution of infarcted (red) and non-infarcted (green) tissue in the in the gray-scale raw speckle images (left) from patients number 12 (upper panels) and 10 (lower panels) according to the DWI signal change in the MRI. The corresponding color-coded blood flow maps on the right allow clear visual identification of a sharp perfusion drop at the border of the infarcted surface area categorized by DWI (gray shaded area). (b) Bar graph illustrating the percentage of infarcted and non-infarcted pixel volumes imaged by iLSI. The dashed line and gray shaded area represent the mean and 95% confidence interval of the pixel areas within the infarcted territory of all patients. (a) Histogram showing the frequency distribution of normalized CBF in the affected hemisphere after perfusion analysis within the cortical parenchyma. Normalized normalized CBF values of each pixel area were grouped into bins of 5% ranging from 0% to 160% and the frequency distribution of these bins was calculated for morphologically infarcted and non-infarcted areas based on the DWI appearance of the postoperative MRI. (b) Probability curves for prediction of cortical infarction (positive predictive value; PPV) or non-infarction (negative predictive value; NPV) according to the algorithm shown in Figure 2. The point of intersection between the prediction curves and the y-axis at a prediction rate of 0.95 (gray lines) show the perfusion thresholds for prediction of infarction and non-infarction at 40% and 110%. (c) Percent distribution of normalized CBF values across the entire cortical surface area of all patients.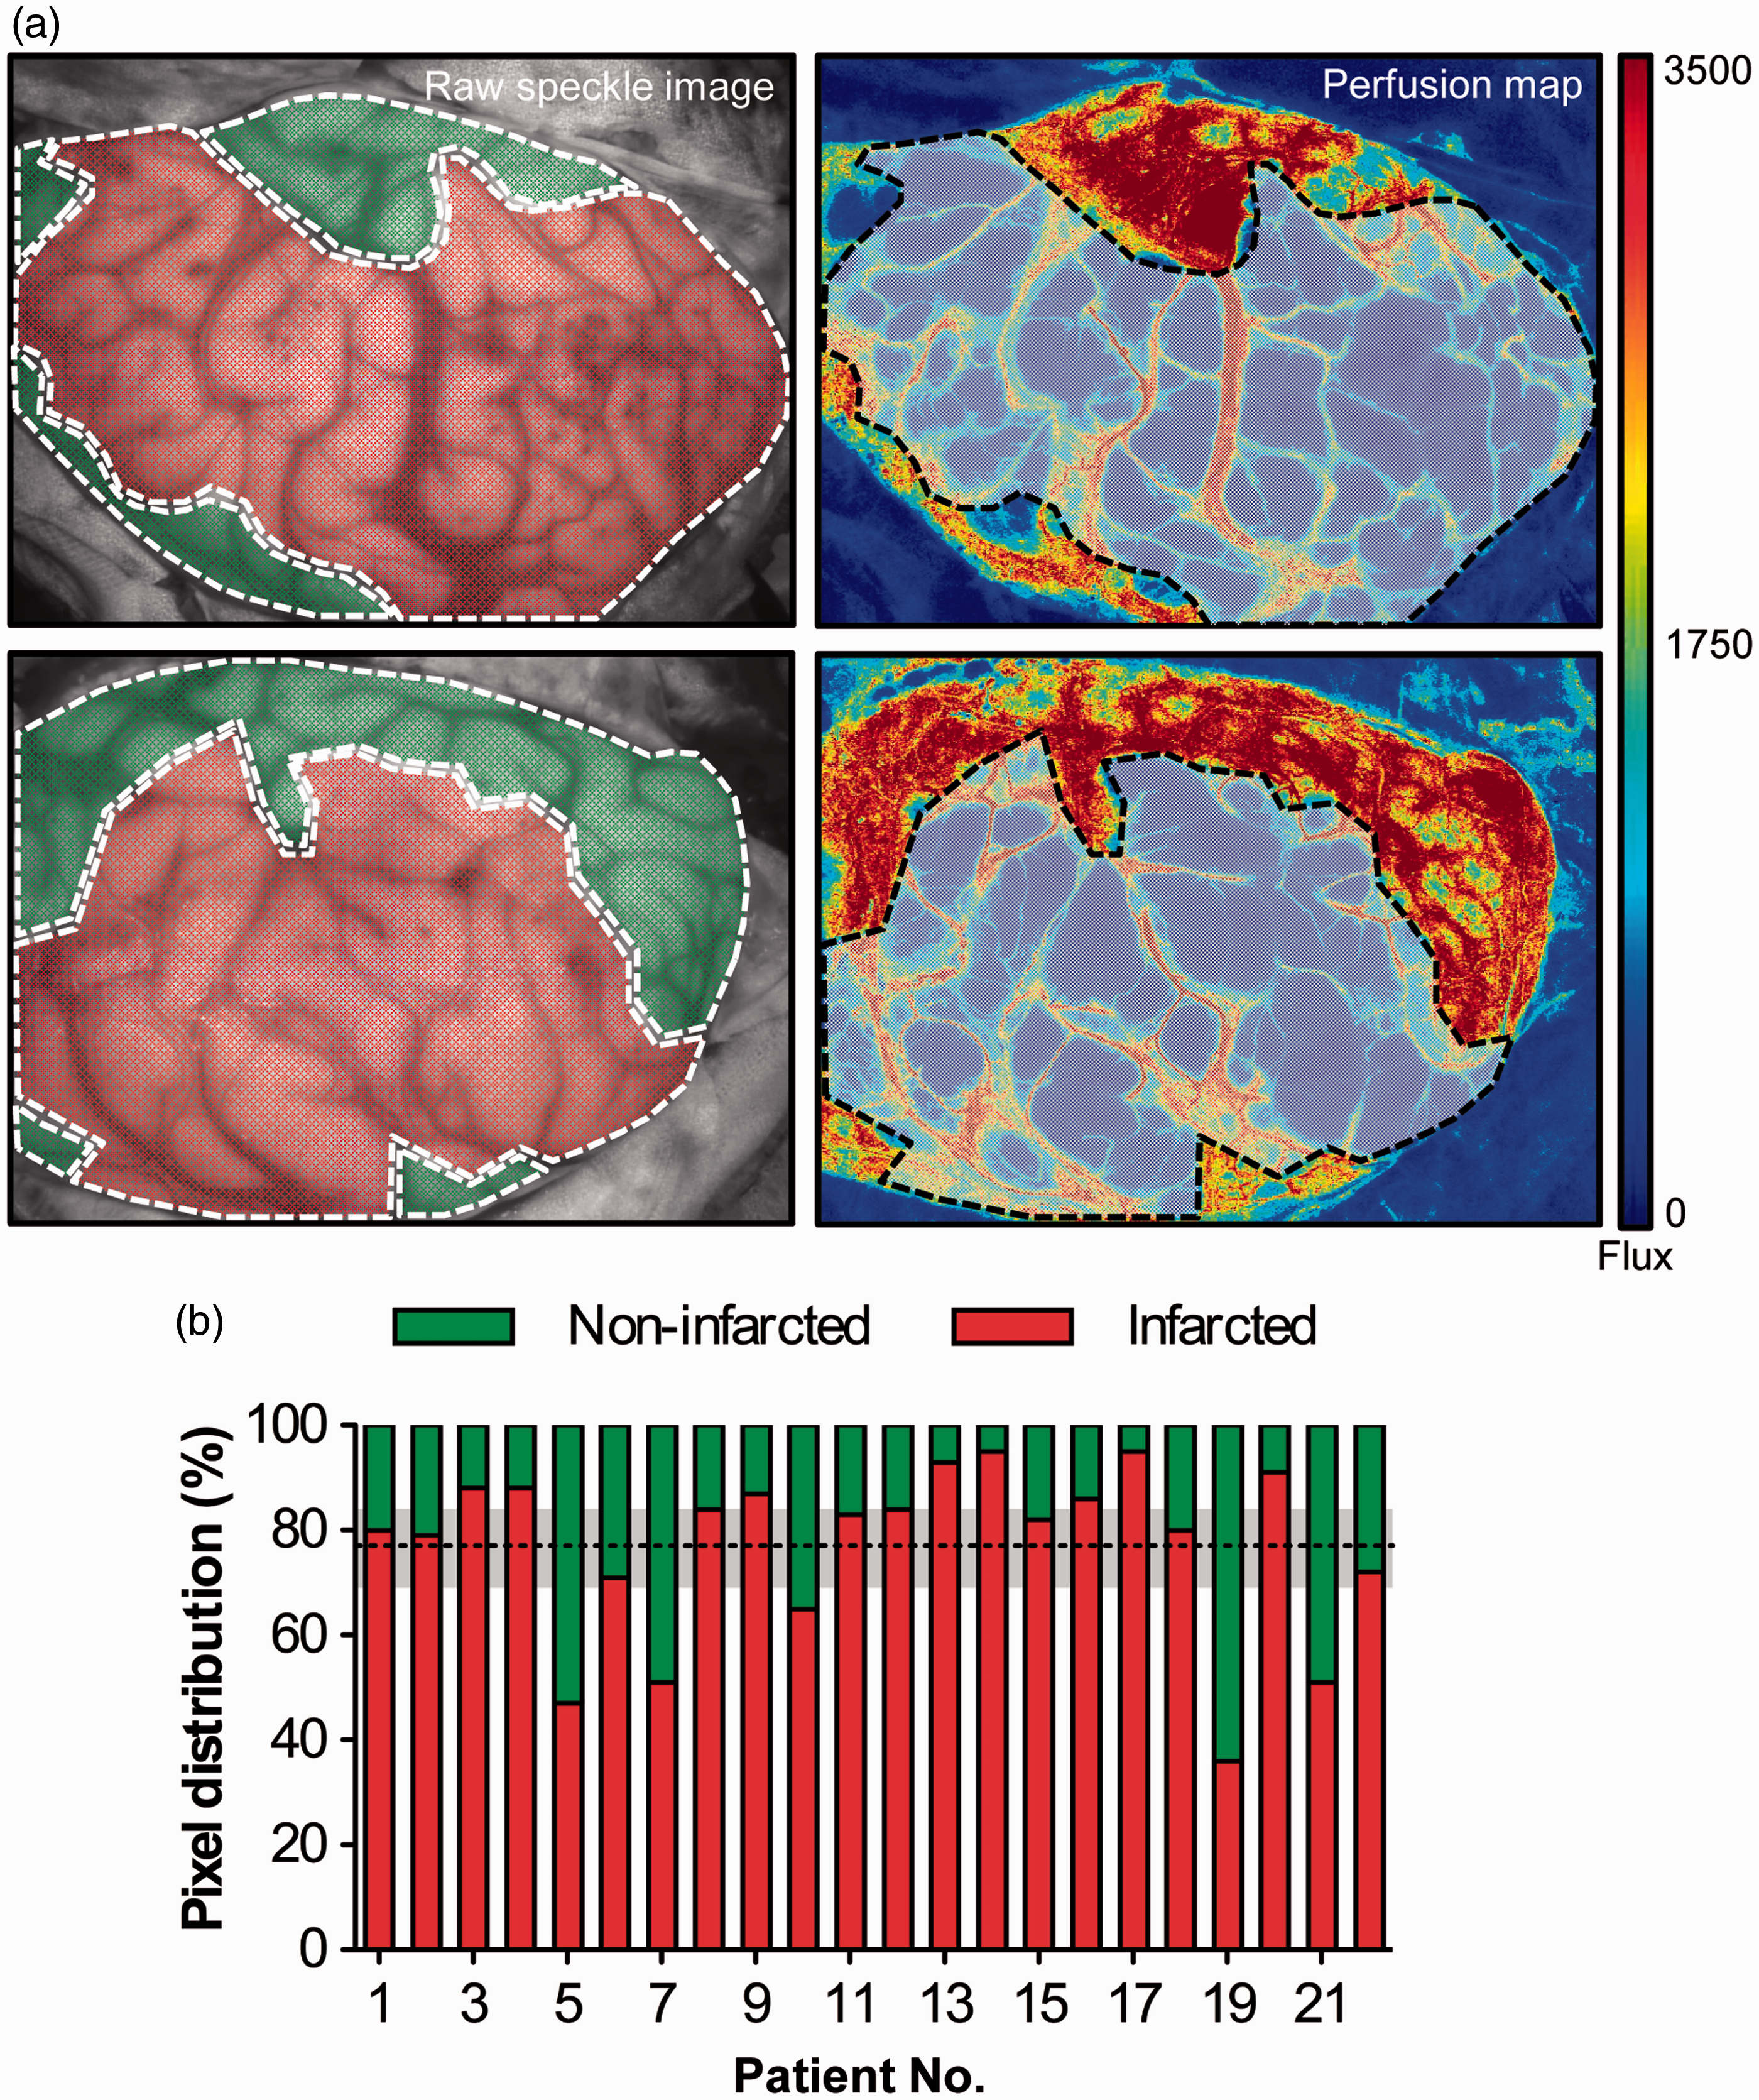
Discussion
With this study, we provide first evidence that laser speckle contrast imaging has the potential for intraoperative real-time identification of ischemia and prediction of eventually infarcted tissue in the human brain. Intraoperative LSI-specific perfusion thresholds ≤40% and ≥110% of normalized CBF predicted cortical infarction and non-infarction at follow-up MRI with 95% probability, which is in support of the hypothesis that standardized iLSI permits (pseudo-) quantitative assessment of relative CBF.
Infarct prediction in the human brain by laser speckle contrast imaging
The central tenet during most neurosurgical procedures is to preserve the flow of oxygenated blood to the brain. Despite various tools for direct or indirect cerebral perfusion assessment, such as near infrared spectroscopy (NIRS), Doppler, thermal diffusion or tissue oxygenation monitoring, surgeons rarely monitor perfusion continuously due to a lack of suitable methods for real-time blood flow assessment in high spatial–temporal resolution. Over a decade ago, substantial technological progress has been accomplished by the successful implementation of indocynanine-green videoangiography (ICG-V) for intraoperative real-time visualization of vessel patency and angiographic flow within the cerebral vasculature. 22 However, ICG-V remains invasive and the physical nature of the method does not permit continuous monitoring or quantitative assessment of perfusion and flow. 23 For this purpose, intraoperative laser speckle contrast imaging was recently shown suitable for continuous real-time blood flow and perfusion monitoring in a simple, fast and cost-effective manner with minimal disruption of surgical workflow and reduced infrastructure requirements.14–17,24,25 To date, however, the potential of iLSI to deliver quantitative information on relative perfusion with the possibility of immediately identifying tissue in danger of irreversible infarction during neurosurgical procedures has not yet been explored. Therefore, the present study was designed to characterize the prognostic value of iLSI by identifying critical iLSI-specific perfusion thresholds for prediction or exclusion of cortical infarction in the human brain.
For following reasons, we deliberately selected patients undergoing decompressive surgery for treatment of MHS: First, the large surgical exposure permitted visualization of blood flow and perfusion within a large optical imaging field. Second, apart from subcortical regions, the infarcted tissue volume in patients with MHS typically involves the cortical surface, which permits a simultaneous visualization of both infarcted and non-infarcted tissue within the same optical imaging field.16,24 This is necessary because LSI is limited by a low tissue penetration depth but also in order to allow normalization of the arbitrary laser speckle perfusion units (CBF-Flux) since the quantitative relationship between the speckle contrast pattern and the underlying blood flow is not completely understood. 26 A main factor limiting the extraction of quantitative data by LSI is the dependence of the speckle contrast on the exposure time of the camera. With increasing duration of the camera exposure time, the registered speckle contrast will eventually blur completely, suggesting high-flow speckle contrast values, whereas short exposure times will eventually register a frozen speckle pattern, suggesting low flow speckle contrast values. Naturally, such exposure bias remains a critical issue and cannot be completely excluded when using optical imaging tools. 27 To minimize this effect in our study, all iLSI measurements were deliberately performed with identical camera exposure times and laser wavelengths under standardized conditions.16,17,24 Presumably, this standardization also positively contributed to the clear distinction between the frequency distributions of eventually infarcted and non-infarcted iLSI pixel areas that we registered. Nevertheless, the quantitative accuracy of iLSI could be further improved by intraoperative implementation of multi-exposure LSI, 28 as recently demonstrated in quantitative monitoring of ischemic lesion evolution in rodent models of focal stroke.29,30
Also, motion artifacts from cardiac, respiratory and brain shifting activity can influence perfusion measurements in continuously acquired optical image sets. 27 In the present study, the following steps were taken to minimize motion artifacts as much as possible: first, blood pressure and PaCO2 during the iLSI measurement were maintained at a constant level. Second, spontaneous rapid hemodynamic fluctuations (i.e. the beat-to-beat cardiac variability) were accounted for by using a large-window moving average filter during the recording and by averaging the mean blood flow value from a 5-min iLSI recording period. Third, major motion artifacts (i.e. movement of the head or camera during the recording period) were minimized by deep anesthesia and rigid fixation of the head and iLSI camera setup.
Apart from standardization, perfusion assessment exclusively within the cortical parenchyma is essential for calculation of reliable iLSI-specific perfusion thresholds, particularly, since our analysis showed that even patients with large hemispheric infarction still exhibited sustained flow within the large surface vasculature of the morphologically infarcted territory. Clearly, such residual flow within the vasculature of the infarct may hamper the differentiability between infarcted and non-infarcted regions, which appears in line with previous findings 23 and underlines the importance of considering parenchymal perfusion rather than vascular flow when aiming to identify brain tissue at risk of infarction by laser speckle blood flow measurements.
Comparability and limitations of laser speckle and magnetic resonance imaging
The acute DWI-visible lesion has become a widely accepted modality for assessment of infarcted brain tissue following acute ischemic stroke,8,31–33 accepting that some of the abnormal DWI tissue has the potential to evolve.34,35 The amount of tissue with such uncertain prognosis is at least partially mirrored in the 27% cortical surface area with normalized CBF values between our threshold limits of 40% and 110% and underlines the high therapeutic potential of identifying salvageable tissue in best time. Indeed, we cannot completely exclude that this 27% fraction of perfusion values was influenced by the size of the surgical exposure and variable dimension of the infarct border within the optical imaging field. For this reason and to address whether tissue in this uncertain prognosis category could be part of the ischemic penumbra, we performed a supplemental perfusion analysis within a 1 cm peri-infarct rim extending from the infarct border into the infarcted and non-infarcted territories (Supplemental Figure I). Interestingly, despite the high spatial detail resolution noted throughout our measurements, iLSI failed to clearly identify distinct penumbral perfusion patterns (presumed to range between 40% and 110%) within both the infarcted and non-infarcted peri-infarct rims (Supplemental Figure II), suggesting on the one hand that iLSI in our current setup may not be sensitive enough for detection of penumbral flow but also demonstrating that a selection bias due to the variable size of the visualized infarct border appears unlikely in the patient population of the present study. Nevertheless, comparative studies of different imaging modalities have natural deficiencies related to several factors, for example the limited patient number and difficulty of performing demanding investigations in individual patients at different time points. The mean delay of 16 h between iLSI and MRI may have contributed to such deficiencies because it shifts the MRI study closer to the time of the final infarct extension. In the present clinical setting, however, a more immediate pre- or postoperative MRI study was not manageable due to logistical and human resource restraints. On the other hand, one of the main factors influencing ischemic lesion evolution particularly in early stages of infarct maturation are hemodynamic fluctuations. 36 Here, the delay between symptomatic stroke onset and surgery (28 h) and the delayed time-point of the MRI (16 h after surgery) may have minimized a potential perfusion mismatch during the intraoperative iLSI measurement and the postoperative treatment in our neurointensive care unit, since ischemic lesion evolution at more delayed stages of infarct maturation appears to be mainly influenced by factors other than hemodynamic fluctuations, such as excitotoxicity, metabolic changes, and spreading depolarizations, among others.16,24,36 The fact that we failed to detect a significant perfusion–diffusion mismatch in the postoperative MRI of our patients appears in line with this hypothesis. However, we cannot completely exclude that other factors, such as the use of vasopressors or antihypertensive medication, sedation, mechanical ventilation settings as well as ICP therapy through external cerebrospinal fluid drainage may have had an unrecognized global effect on CBF and ischemic lesion evolution during the postoperative care phase up to the time-point of the MRI, regardless of the negligible perfusion mismatch that we detected. A further problem is the accuracy of the iLSI/MRI co-registration, which may be impaired by motion artifacts or superficial fluid collections in the postoperative MRI, next to the natural curvature of the brain requiring the use of flattening techniques for image fusion. 16 Additionally, comparability may be hampered by technical reasons, such as differences in the temporal–spatial resolution, because pixel areas between iLSI and MRI are not identical. Most importantly, however, iLSI and MRI findings in acute cerebral ischemia are also defined by the different basic mechanisms they investigate, which on the other hand also provide valuable complimentary insight into the pathophysiological processes of ischemic stroke.
It is noteworthy, that the in-between perfusion range of 40–110% includes the initially defined (100%) baseline perfusion with presumed undisturbed perfusion. Possibly, this interference is due to the following reasons: first, the 100% baseline perfusion was classified according to the DWI/MRI non-infarcted territory and technological limitations, such as the delayed time-point of MRI, selection bias or an iLSI/MRI co-registration error may have partially accounted for this effect. Second, the 100% baseline perfusion was determined as the averaged perfusion value of all pixel areas within the non-infarcted territory, where upper and lower deviations of individual raw data perfusion values are naturally expected to occur. Third, the overlap is also directly associated with our pre-defined prediction rate cut-off of 0.95. Although selection of a large sample area for calculation of this baseline perfusion should therefore reduce the risk of selection bias and false negative results (determination of non-infarction with iLSI in the case of true infarction), most importantly, these overlapping perfusion levels underline the significance of critical data interpretation and selection of appropriate regions for baseline perfusion calculation, which later define the normalized perfusion values upon which the surgeon wishes to base clinical decisions.
Limitations and perspectives
From a surgical perspective, intraoperative workflow and handling could be further optimized by routine integration of the technology into the operating microscope. 15 As a main technical weakness, the shallow cortical penetration depth of LSI does not allow the surgeon to visualize perfusion in depth of the visually exposed surgical field. Importantly, we do not believe that a large exposure of simultaneously infarcted and non-infarcted tissue is necessary for routine application of the technology, because continuous perfusion imaging would allow the surgeon to define a “100% baseline perfusion” area at the beginning of the procedure within any optical imaging field, which could then be monitored over time so that critical perfusion changes predictive of infarction can be identified based on our pre-determined thresholds. Therefore, we believe that iLSI is a valuable tool to influence surgical decision-making and improve patient outcomes, since immediate detection of critically hypoperfused tissue can allow the surgical team to implement specific neuroprotective measures in real-time, such as replacement of microsurgical aneurysm clips in the case of inadvertent parent artery occlusion, direct grafting of an extracranial-intracranial bypass for flow augmentation to a compromised territory, irrigation of the surgical field with vasodilative agents (i.e. papaverine hydrochloride) in the case of microvascular spasm following vessel manipulation, deliberate induction of systemic hypertension and/or hyperoxygenation, as well as earliest establishment of postoperative treatment regimens in the case of an unrecoverable ischemic event.
In the future, clinical studies should focus on further increasing the quantitative accuracy of iLSI and aim at combining the technology with additional multimodal imaging components, such as PET and reflectometry, for example. 37 Importantly, this would provide additional dynamic spatial–temporal information on oxygen metabolism and glucose consumption in order to get a better understanding of this complex interaction in the context of perfusion changes and monitor the result of surgical interventions aimed at flow restoration with even greater effectiveness.
Footnotes
Funding
The author(s) disclosed receipt of the following financial support for the research, authorship, and/or publication of this article: This work has been supported by the Deutsche Forschungsgemeinschaft (DFG-WO 1704/1-1) and Bundesministerium für Bildung und Forschung (Center for Stroke Research Berlin, 01 EO 0801).
Declaration of Conflicting Interests
The author(s) declared no potential conflicts of interest with respect to the research, authorship, and/or publication of this article.
Authors’ contribution
NH, PV and JW conceived, designed, and supervised the trial. NH, JW, M-MM, AP and NS obtained and analyzed the data. NH wrote the first draft of the manuscript. All authors were involved in interpretation of the data and critical revision of the manuscript.
References
Supplementary Material
Please find the following supplemental material available below.
For Open Access articles published under a Creative Commons License, all supplemental material carries the same license as the article it is associated with.
For non-Open Access articles published, all supplemental material carries a non-exclusive license, and permission requests for re-use of supplemental material or any part of supplemental material shall be sent directly to the copyright owner as specified in the copyright notice associated with the article.