
Abstract
We recently showed that Alzheimer's disease patients have lower plasma concentrations of the phosphatidylcholines (PC16:0/20:5; PC16:0/22:6; and PC18:0/22:6) relative to healthy controls. We now extend these findings by examining associations between plasma concentrations of these PCs with cognition and brain function (measured by regional resting state cerebral blood flow; rCBF) in non-demented older individuals. Within the Baltimore Longitudinal Study of Aging neuroimaging substudy, participants underwent cognitive assessments and brain 15O-water positron emission tomography. Plasma phosphatidylcholines concentrations (PC16:0/20:5, PC16:0/22:6, and PC18:0/22:6), cognition (California Verbal Learning Test (CVLT), Trail Making Test A&B, the Mini-Mental State Examination, Benton Visual Retention, Card Rotation, and Fluencies—Category and Letter), and rCBF were assessed. Lower plasma phosphatidylcholine concentrations were associated with lower baseline memory performance (CVLT long delay recall task—PC16:0/20:5: −2.17–1.39−0.60 p = 0.001 (β with 95% confidence interval subscripts)) and lower rCBF in several brain regions including those associated with memory performance and higher order cognitive processes. Our findings suggest that lower plasma concentrations of PC16:0/20:5, PC16:0/22:6, and PC18:0/22:6 are associated with poorer memory performance as well as widespread decreases in brain function during aging. Dysregulation of peripheral phosphatidylcholine metabolism may therefore be a common feature of both Alzheimer's disease and age-associated differences in cognition.
Keywords
Introduction
Alzheimer’s disease (AD) affects one in nine Americans aged 65 and older, an estimate expected to triple by 2050. 1 Although recent proposals for incorporating neuroimaging and cerebrospinal fluid (CSF) biomarkers for the diagnosis of both clinical and presymptomatic AD represent a paradigm shift in the field,2–4 it is unlikely that CSF sampling and neuroimaging will be widely used for screening large numbers of at-risk elderly in primary care settings. 5 Blood biomarkers may be an acceptable alternative method of early disease detection enabling non-invasive and rapid screening of older individuals thereby accelerating the development of novel disease-modifying treatments by targeting those at greatest risk for AD. 6
Several recent studies highlight the promise of metabolomics technology for the identification of small molecule biomarkers in AD.7–9 Metabolites represent the end result of all complex regulatory processes present in a cell and are believed to serve as proximal reporters of biological processes typical of disease. 10 Using ultra-performance liquid chromatography (UPLC) coupled to mass spectrometry (MS-MS), we recently reported that the plasma concentrations of three phosphatidylcholines (PCs), i.e. PC16:0/20:5 (PC1620); PC16:0/22:6 (PC1622); PC18:0/22:6 (PC1822) were lower in AD patients relative to healthy controls. 11 Subsequently, Mapstone et al. 12 reported similar results suggesting that altered peripheral levels of some PCs may be candidate biomarkers of AD conversion.
The main aim of the present study was to extend our previous findings of altered plasma PC concentrations in AD by examining their associations with cognitive performance and resting state cerebral blood flow (rCBF), a measure of brain function, in non-demented older individuals. We performed these analyses using data from 125 participants in the Baltimore Longitudinal Study of Aging neuroimaging substudy (BLSA-NI), in whom we measured plasma concentrations of PC1620, PC1622, and PC1822 at three time points when cognition was also assessed. Based on our findings on the associations between plasma PC concentrations and cognitive performance, we then asked whether these metabolite concentrations are also related to baseline measures of rCBF in these individuals.
Materials and methods
Population
Begun in 1958, the BLSA is a prospective, ongoing cohort study of community-dwelling volunteer participants13,14 at the National Institute on Aging (NIA). In general, at the time of entry into the study, participants have no physical or cognitive impairment. Detailed examinations, including neuropsychological assessments and neurological, laboratory, and radiological evaluations, are conducted every two years. Since 2003, participants older than 80 years have received yearly assessments. Written informed consent is obtained at each visit, and the study is approved by the local institutional review board (IRB) and the NIA. Human research at the National Institutes of Health (NIH) is implemented in accord with the U.S. Department of Health and Human Services (45 CFR 46) and U.S. Food and Drug Administration (21 CFR 50 and 56) regulations for the protection of human subjects. The NIA IRB is part of the Human Subject Protection Program of the NIH.
The current study utilizes data from the BLSA-NI, which began in 1994.
15
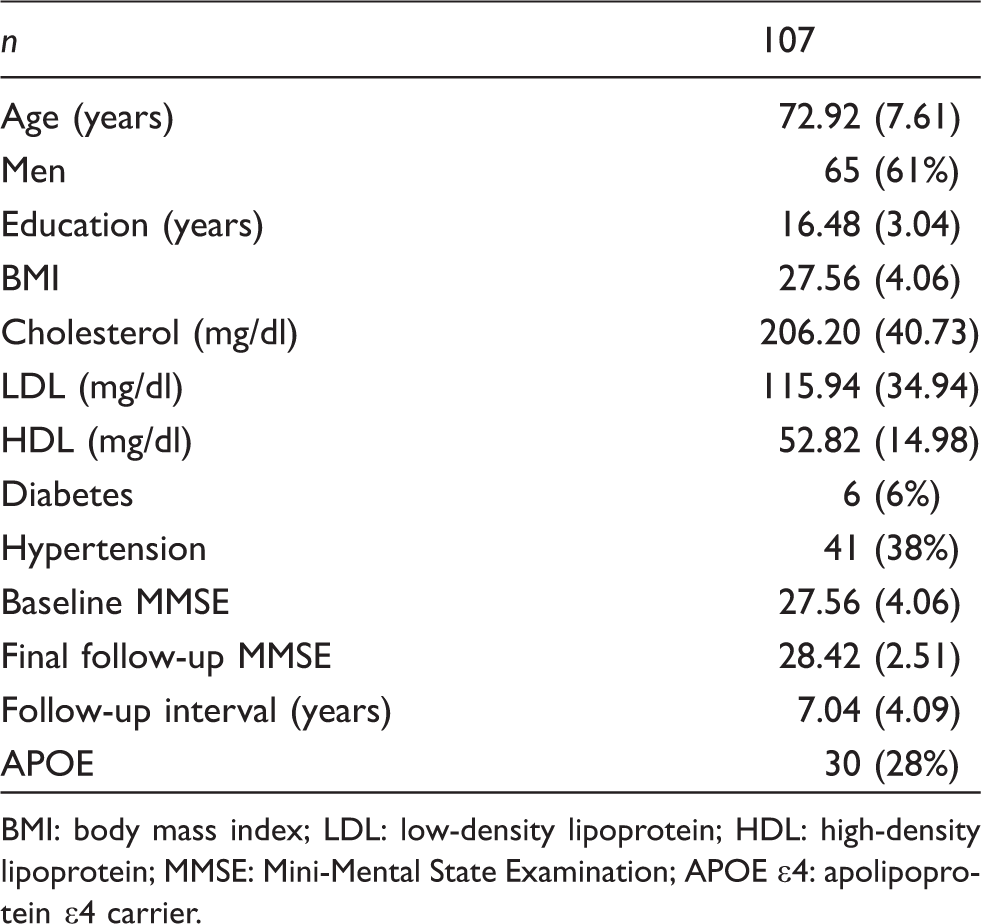
Figure 1 shows the study design. BLSA participants were initially prioritized for admission to the neuroimaging study based on health considerations and the amount of previous cognitive data available for each individual. At enrollment, participants were free of self-reported central nervous system disease (e.g. epilepsy, stroke, bipolar illness, dementia), severe cardiac disease (e.g. myocardial infarction, coronary artery disease requiring angioplasty or coronary artery bypass surgery), pulmonary disease, or metastatic cancer. Data from 107 of 125 eligible participants were used in the current report. All were non-demented at baseline and assessed with annual neuropsychological examinations (Table 1). By the third and final time point in this study, 23 participants had converted to mild cognitive impairment (MCI; n = 7) or AD (n = 16). Diagnoses of dementia and AD were based on DSM-III-R
16
and the NINCDS-ADRDA criteria,
17
respectively. The diagnosis of MCI was made according to Petersen criteria.
18
Experimental study design overview. As of 2014, 194 individuals have been enrolled in the BLSA-NI substudy. Plasma PC concentrations and cognitive assessments were used from 107 individuals in this study. Of the initial participants, 105 returned for a second follow-up visit and 76 returned for a third follow-up visit. At baseline, 15O water PET imaging was utilized to assess brain function in 71 of the original 107 participants. All individuals with eventual conversion to AD/MCI were excluded from the brain function analysis. Baseline participant characteristics reported as mean (±standard deviation) for continuous, frequency (%) for categorical variables, and median (interquartile ranges) for follow-up interval. BMI: body mass index; LDL: low-density lipoprotein; HDL: high-density lipoprotein; MMSE: Mini-Mental State Examination; APOE ɛ4: apolipoprotein ɛ4 carrier.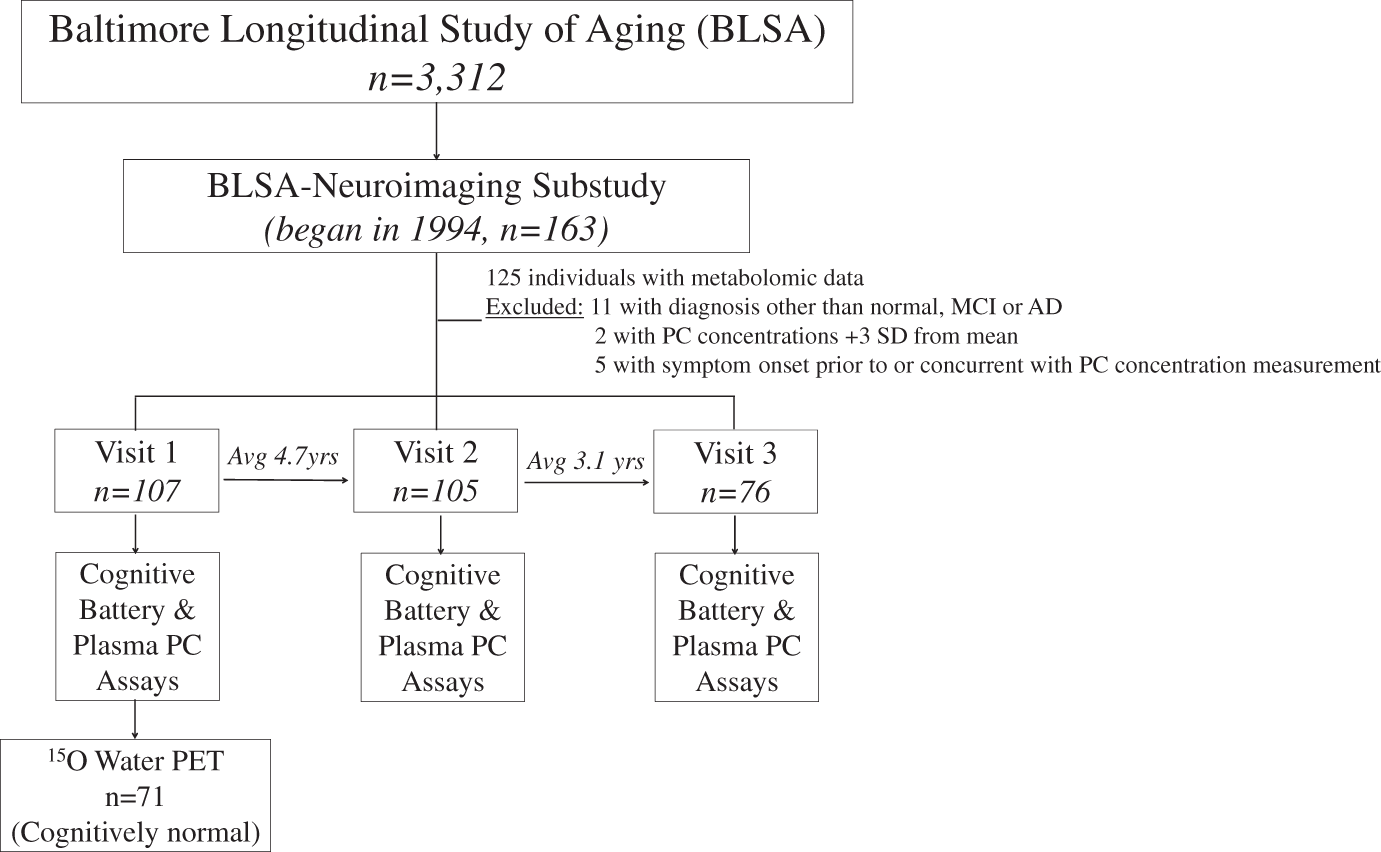
Plasma collection and pretreatment
PCs (i.e. PC1620; PC1622; PC1822) were measured in archived plasma samples collected at three separate time points for each participant: baseline, average 4.7 (±2.2) years from baseline and average 7.8 (±2.8) years from baseline (median 7.04 (±4.09) years). Plasma samples were collected from study participants after overnight fasting, aliquoted into 1.5-mL cryotubes in sodium ethylenediaminetetraacetic acid and stored at –80 ℃ until analysis. Samples were not subjected to any freeze–thaw cycles prior to analysis.
Phospholipid measurements
Twenty microliters of plasma were added to a glass liquid chromatography vial with a 400 μL insert (Chromacol, UK) followed by MS grade water (10 μL). Forty microliters MS grade methanol containing 10 μg/mL Margaric acid was added. Followed by 2 min vortex mix, 200 μL methyl tert-butyl○ ether (MTBE) containing 10 μg/mL tripentadecanoin was added. The sample underwent vortex mix for 1 h and then 50 μL water was added. After a final sample mix, the sample was centrifuged at 3000g for 10 min.
Metabolomics analysis on MTBE upper phase of sample extract was carried out by a UPLC coupled to Xevo QToF MS (Waters, Milford, USA). Chromatographic separation was achieved using an Agilent Poroshell 120 EC-C8 column (150 mm × 2.1 mm, 2.7 μm) at 55 ℃. Mobile phases consisting 10 mM ammonium formate in water (A) and 10 mM ammonium formate in methanol (B) were employed. With flow rate of 0.5 mL/min, a gradient was established with 0 min (75% B), 23 min (96% B), 36 min (100% B), 42 min (100%) followed by 9 min column equilibration (75% B) prior to each injection. The MS was operated in the positive ion mode with a capillary voltage of 3.2 kV and a cone voltage of 35 V. The desolvation gas flow was 800 L/hr, and the source temperature was 120 ℃. All analyses were acquired using the lock spray to ensure accuracy and reproducibility. Leucine enkephalin was used as lock mass (m/z 556.2771 and 278.1141) at a concentration of 200 ng/mL and a flow rate of 10 μL/min. Data were collected in the centroid mode over the mass range m/z 100–1000 with an acquisition time of 0.1 s a scan. Samples were analyzed in a randomized order in three batches with pooled plasma samples (quality control samples) being analyzed after every 10 samples.
Semiquantitation of lipid molecules from the PC lipid group followed the method described in our previous report. 11 The integrated peak areas of the three selected PCs and internal standard (IS; Tripentadecanoin) under the extracted exact mass chromatograms were obtained by using QuanLynx (Waters) by setting up an integration parameter file using the m/z and retention time for the four lipids. The integrated areas were normalized in R by quantile normalization and inverse transformed before application of the Empirical Bayes method, ComBat (Combating Batch Effects When Combining Batches of Gene Expression Microarray Data) to correct for any batch effects. 19 Ratios of the PCs to IS (CV (coefficient of variation) for IS=12%) were calculated.
Cognitive testing
All participants underwent detailed cognitive assessments using standardized protocols to assess memory, processing speed, executive function, global mental status, visual memory, visuo-spatial ability, and language fluencies.
Verbal memory
California Verbal Learning Test (CVLT) 20 assesses episodic verbal learning and memory. We assessed total number of words remembered across five learning trials (scored 0–96 words) and number of words remembered after a short and long delay (range, 0–16 words).
Processing speed
Trail Making Test A (Trails A) measures visual conceptual and visuomotor tracking, attention, sequencing, visual search and motor function. 21 Participants view a randomly arranged page of numbers and are asked to connect the numbers in sequential order as quickly and accurately as possible in 5 min. Scores are number of seconds taken to complete the task.
Executive function
The Trail Making Test B (Trails B) assesses visual conceptual and visuomotor tracking, attention switching, sequencing, mental flexibility, visual search and motor function. 21 Part B expands on Part A through the addition of letters in the random assortment of numbers. Participants connect the numbers and letters in a sequential fashion, alternating between number and letter as quickly and accurately as possible in 5 min. Scores are number of seconds taken to complete the task.
Global cognitive function
Mini-Mental State Examination (MMSE, range 0 (worst) to 30 (best)) 22 was administered to measure global cognitive function. Spelling “WORLD” backwards was used to assess attention.
Visual memory
The Benton Visual Retention Test (BVRT) is a test of memory for designs and visuo-constructional skills. 23 It consists of 10 stimulus cards, each displayed for 10 s and removed from sight. Participants are then asked to reproduce the card's design without a time limit. Scores consist of number of errors made on all 10 designs.
Visuo-spatial ability
The Card Rotation Test measures mental spatial rotation, a visuo-spatial function. 24 Participants view a sample line drawing of a geometric figure and eight alternatives that show the same drawing rotated in three dimensions. This test was repeated in 28 trials, and scores measured the number of correct responses made in 6 min after subtraction of incorrect responses.
Language fluencies
Category and Letter Fluency examine semantic and phonemic association fluency, respectively, as well as executive function.25,26 For Category Fluency, participants are asked to name as many animals, fruits, and vegetables as possible in 60 s. During the Letter Fluency task, participants are asked to say as many words as possible beginning with the letter F, A, or S in 60 s.
15O-water positron emission tomographic data acquisition
Of the original sample of 107 individuals, data from 71 participants were used in the final positron emission tomography (PET) analysis. Scans were concurrent with plasma sampling with an average 6.8 day difference between plasma sampling and PET imaging acquisition (range, 1–101 days). Those who eventually developed cognitive impairment during follow-up (i.e. AD or MCI; n = 23), had no resting state 15O-water PET scan (n = 9) or had a poorly acquired scan (n = 2) were excluded. Subsequent scans for the two individuals with poorly acquired scans were more than one year from plasma sample acquisition and were not used in our analysis.
Participants underwent a resting state PET scan corresponding to baseline PC measurement. Individuals were instructed to keep their eyes open and focused on a computer screen covered by a black cloth. Data were gathered on a GE 4096+PET instrument, and images were acquired for 60 s from the time the radioactivity detected in the brain surpassed a threshold level. PET measures of rCBF were obtained using (15O)water. For each scan, 75 mCi of (15O) water was injected as a bolus. Attenuation correction was performed using a transmission scan acquired before the emission scans.
Statistical analysis
Plasma PC levels and cognitive performance
Based on our previous work showing lower plasma PC concentrations in AD relative to healthy controls, 11 we expected a priori that increased PC levels would be associated with better cognitive performance in non-demented older individuals. We, therefore, standardized plasma PC concentrations and multiplied them by −1 so that negative regression coefficients represent associated decreases in cognition for each standard deviation (SD) decrease in the PC marker (SDs for PC1620, PC1622, and PC1822 were 0.15, 0.36, 0.17, respectively). Two outliers, assessed both visually and by the multi-variate outlier method by Hadi, 27 with baseline PC concentrations greater than three SDs away from the mean were excluded. As the main focus of the current study was to test associations between plasma PC concentrations and cognition during normal aging, we excluded cognitive scores from individuals converting to MCI/AD at the visit concurrent to symptom onset and subsequent visits.
Cross-sectional associations between plasma PC marker concentrations and cognitive performance at each visit were estimated using linear regression models. Longitudinal associations between PC concentrations and cognitive performance were examined using generalized linear mixed models to account for repeated measures within participants. Cross-sectional (between-subjects) versus longitudinal (within-subjects) effects were decomposed and contrasted by incorporating individual baseline PC and PC-change terms in the mixed models. Random intercepts were used with random slope variance structures examined in sensitivity analyses (similar results were found); robust Huber-White sandwich variance estimates were used throughout. Potential non-linear effects were examined using locally weighted scatterplot smoothing and appropriate spline models; non-linear associations were suggested visually (see Figures) but unsupported statistically. Primary adjusted models included baseline age, number of years of education, sex, and apolipoprotein E (APOE) ɛ4 carrier status. Analyses were performed using Stata 13 (StataCorp, College Station, TX).
Differences in plasma PC concentrations and cognitive performance between participants who remained cognitively normal and those who developed AD/MCI were analyzed with linear mixed models. Models assessing differences in plasma PC concentrations were adjusted for baseline age and sex. Models assessing cognitive measures were adjusted for baseline age, number of years of education, sex, and APOE ɛ4 carrier status.
Covariates
Age, sex, years of education, body mass index, medication use, and active diagnoses of hypertension, diabetes, or congestive heart failure were assessed and recorded at each visit. APOE ɛ4 genotyping procedures have been described previously. 28 Serum levels of low-density lipoproteins, high-density lipoproteins, triglycerides, and cholesterol were quantified from blood samples obtained after overnight fasting.
Sensitivity analysis
Primary models were re-estimated excluding (1) those with eventual conversion to AD or MCI, to examine whether AD pathology may affect associations of PCs and cognition, (2) those with incomplete information, to compare missing at random versus missing completely at random dropout assumptions, (3) those with CVLT scores 2 SD below the mean on any of the three measures, to examine potential floor effects from those with the poorest baseline cognitive measures.
Plasma PC levels versus resting state cerebral blood flow
Image preprocessing and analysis was performed using Statistical Parametric Mapping (SPM5; Wellcome Department of Cognitive Neurology, London, England). For each participant, PET scans were realigned and spatially normalized into standard stereotactic space and smoothed to a full width at half maximum of 12, 12, and 12 mm in the x, y, and z planes. To control for variability in global flow, rCBF values at each voxel were ratio adjusted to the mean global flow and scaled to a mean of 50 mL/100 g per min for each image.
To further investigate the plausible mechanism underlying the association between cognitive performance and PC concentrations, voxel-wise cross-sectional associations between resting cerebral blood flow and baseline PC concentrations were assessed. All analyses were adjusted for baseline age and sex. Significant correlations were based on both a statistical magnitude (p < 0.005) as recommended by the PET Working Group of the NIH/NIA Neuroimaging Initiative (http://www.nia.nih.gov/about/events/2011/positron-emission-tomography-working-group). We then applied an additional spatial extent threshold of >50 voxels within the regions meeting the statistical threshold of p < 0.005 to control for type 1 errors. We have previously used these thresholds in the same BLSA-NI sample to report on changes in resting state cerebral blood flow preceding the onset of cognitive impairment in participants eventually converting to AD/MCI.29–31 Given our previous findings that changes in rCBF precede cognitive impairment in converters to AD/MCI, 29 our primary analysis examining associations between plasma PC concentrations and rCBF was restricted to participants who remained cognitively normal throughout follow-up.
Results
Plasma PC levels versus cognitive performance
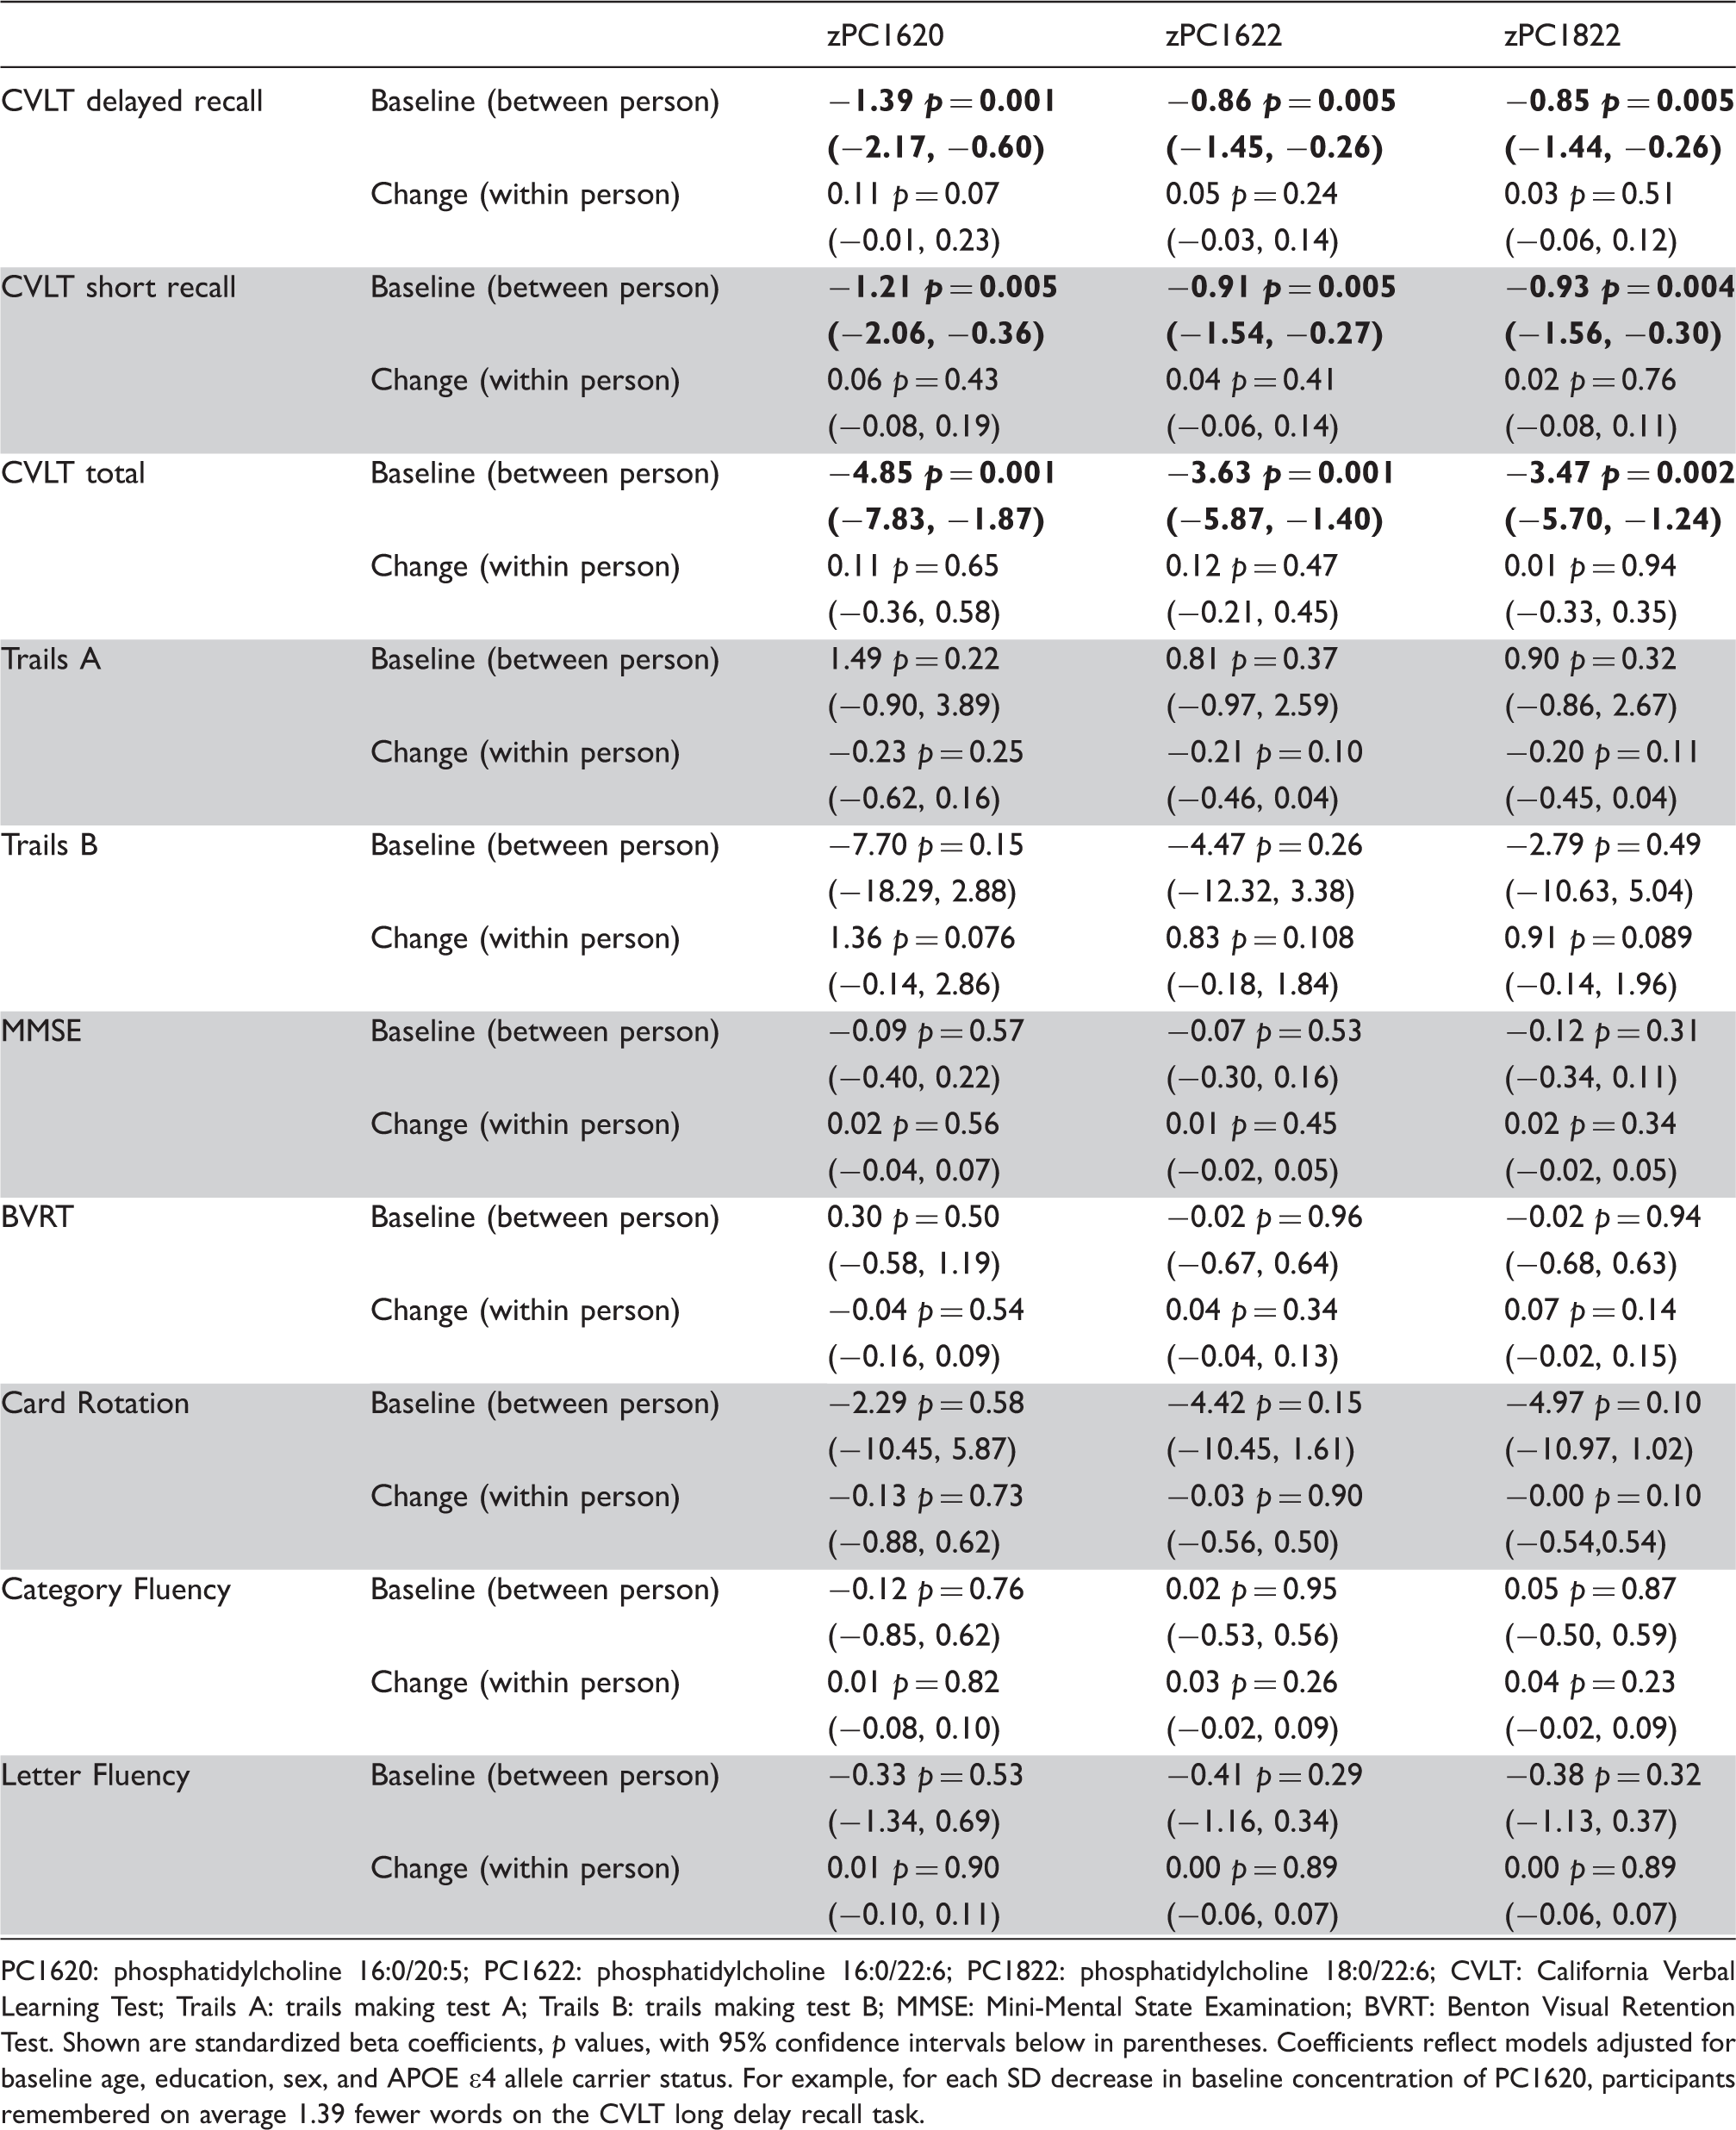
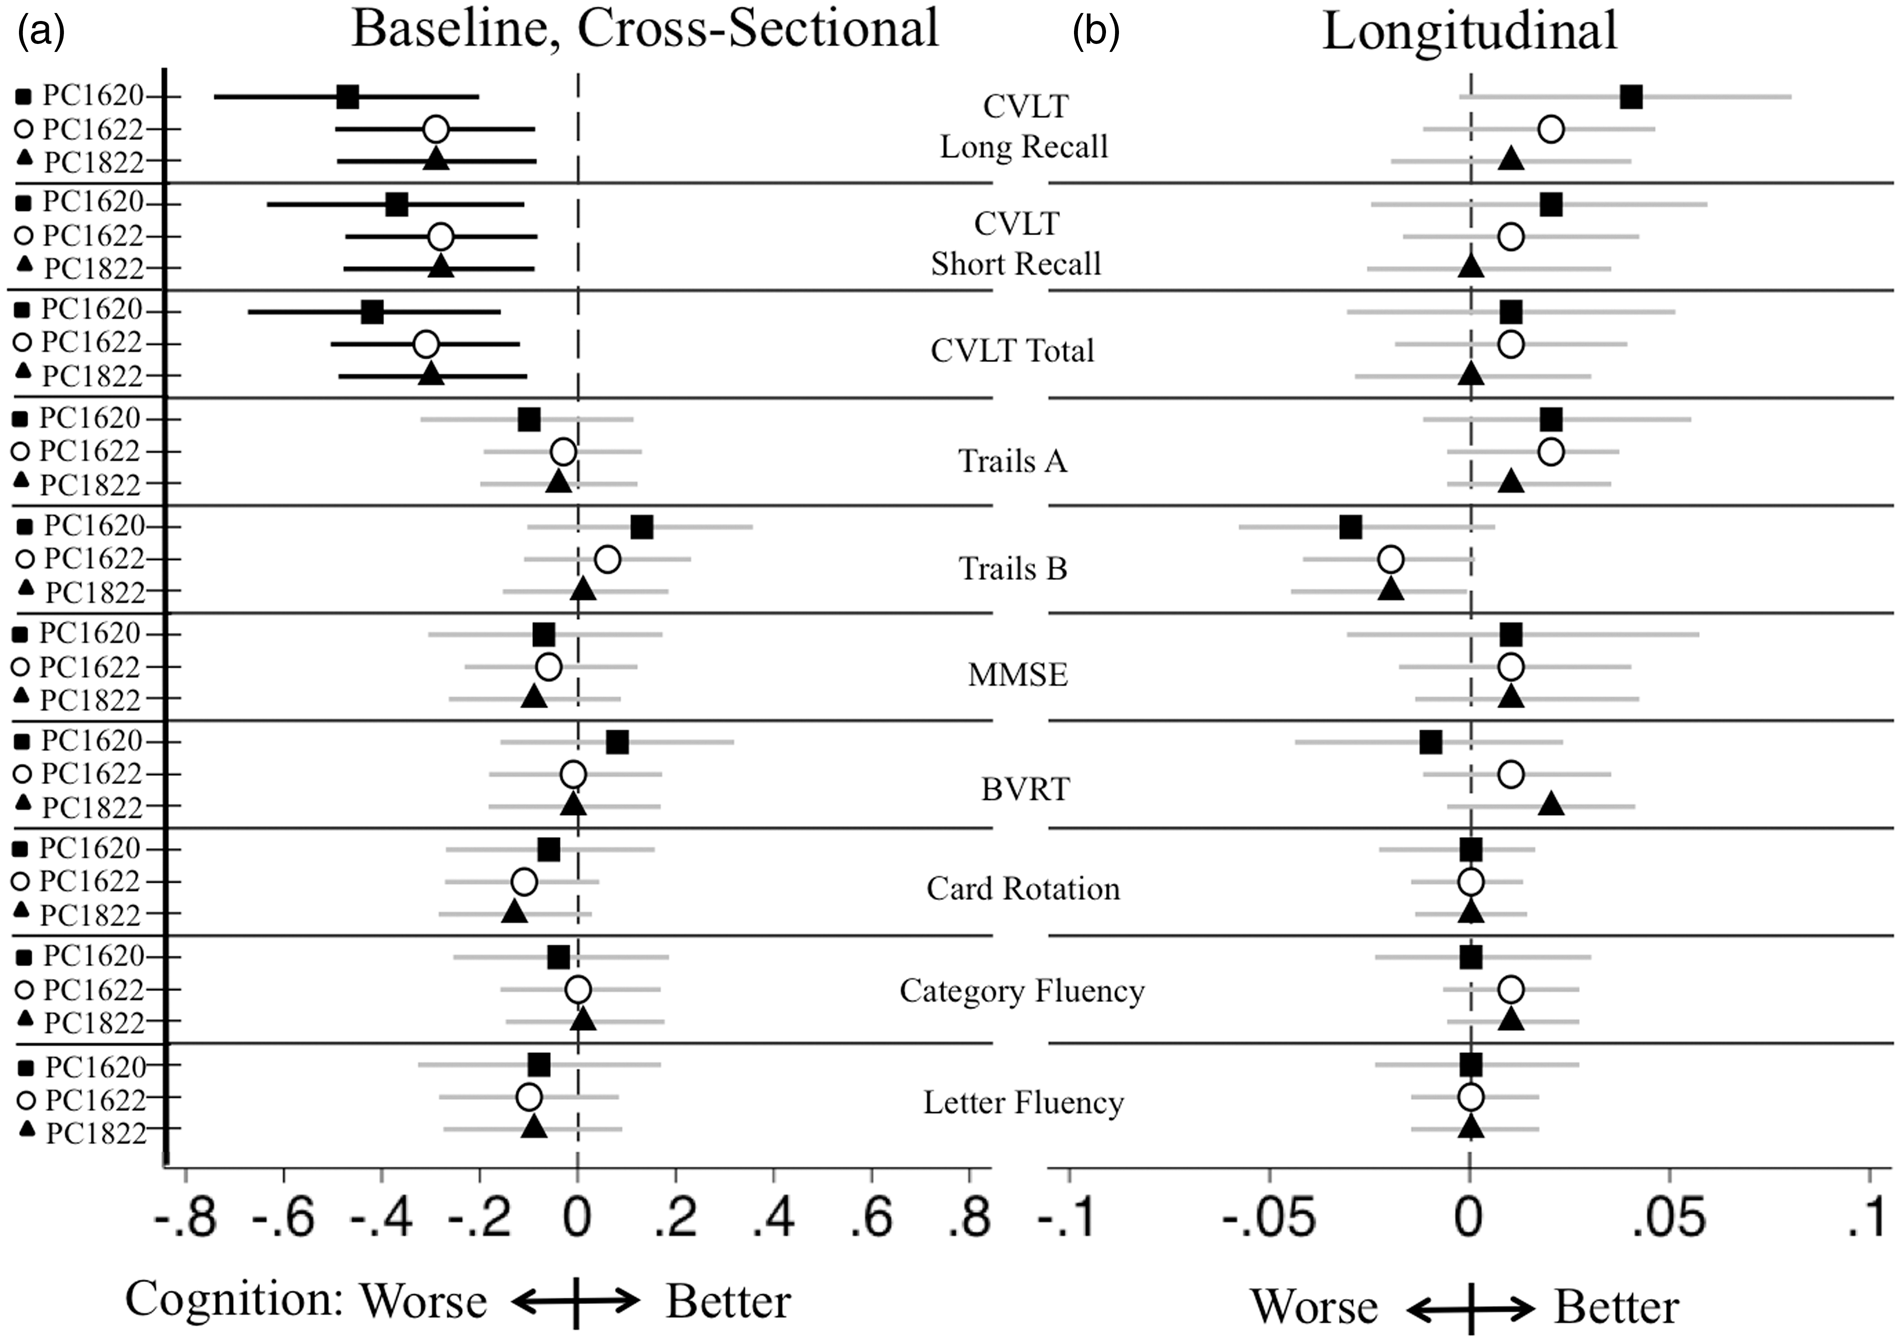
All individuals were cognitively normal at baseline. Lower baseline plasma concentrations of all three PCs were associated with lower baseline scores on all CVLT measures. Thus, for every SD decrease in baseline concentration of PC1620, participants remembered, on average, 1.39 fewer words on the CVLT long delay recall task (β with 95% confidence interval subscripts: PC1620: −2.17–1.39−0.60 p = 0.001, Figure 2, Table 2). Similar associations with memory performance were supported throughout for all three PCs with approximately one word reductions in both CVLT long and short delay recall and approximately 3–5 words reduction on the CVLT total recall for every SD decrease in baseline plasma PC concentrations (Table 2, Figure 3). We did not observe significant associations between baseline plasma PC concentrations and performance on the Trails A, Trails B, MMSE, BVRT, Card Rotation, or Fluencies (Category/Letter) tasks (Table 2, Figure 3).
CVLT long delay recall versus plasma PC concentrations. Associations of baseline plasma PC levels and raw CVLT verbal memory (a) at baseline and (b) over time. Solid lines are regression lines with shaded confidence bounds. Dashed lines are LOWESS non-linear smoothers (diagnostic check). The x-axis scale has been reversed to indicate associations with lower baseline PC levels as the x-axis progresses to the right. Relationships between cognitive performance and baseline standardized plasma PC concentrations. PC1620: phosphatidylcholine 16:0/20:5; PC1622: phosphatidylcholine 16:0/22:6; PC1822: phosphatidylcholine 18:0/22:6; CVLT: California Verbal Learning Test; Trails A: trails making test A; Trails B: trails making test B; MMSE: Mini-Mental State Examination; BVRT: Benton Visual Retention Test. Shown are standardized beta coefficients, p values, with 95% confidence intervals below in parentheses. Coefficients reflect models adjusted for baseline age, education, sex, and APOE ɛ4 allele carrier status. For example, for each SD decrease in baseline concentration of PC1620, participants remembered on average 1.39 fewer words on the CVLT long delay recall task. Baseline PC markers on standardized cognition. Effects of baseline standardized PC markers on standardized cognitive measures (a) at baseline and (b) over time, adjusted for baseline age, education, sex, APOE ɛ4 allele carrier status and participant identification number. Results reflect standardization of cognitive measures to ease comparison. Top left horizontal bar corresponds to −0.44 SD decrease in words remembered after a long delay for each SD decrease in baseline plasma PC1620 level during the CVLT cognitive test. This was reflected in Figure 1 as −1.3 fewer words remembered for every SD decrease in baseline plasma PC1620. Regression coefficients with lower and upper confidence limits are displayed graphically. Results supported statistically are displayed with black lines while those statistically unsupported are displayed with gray lines.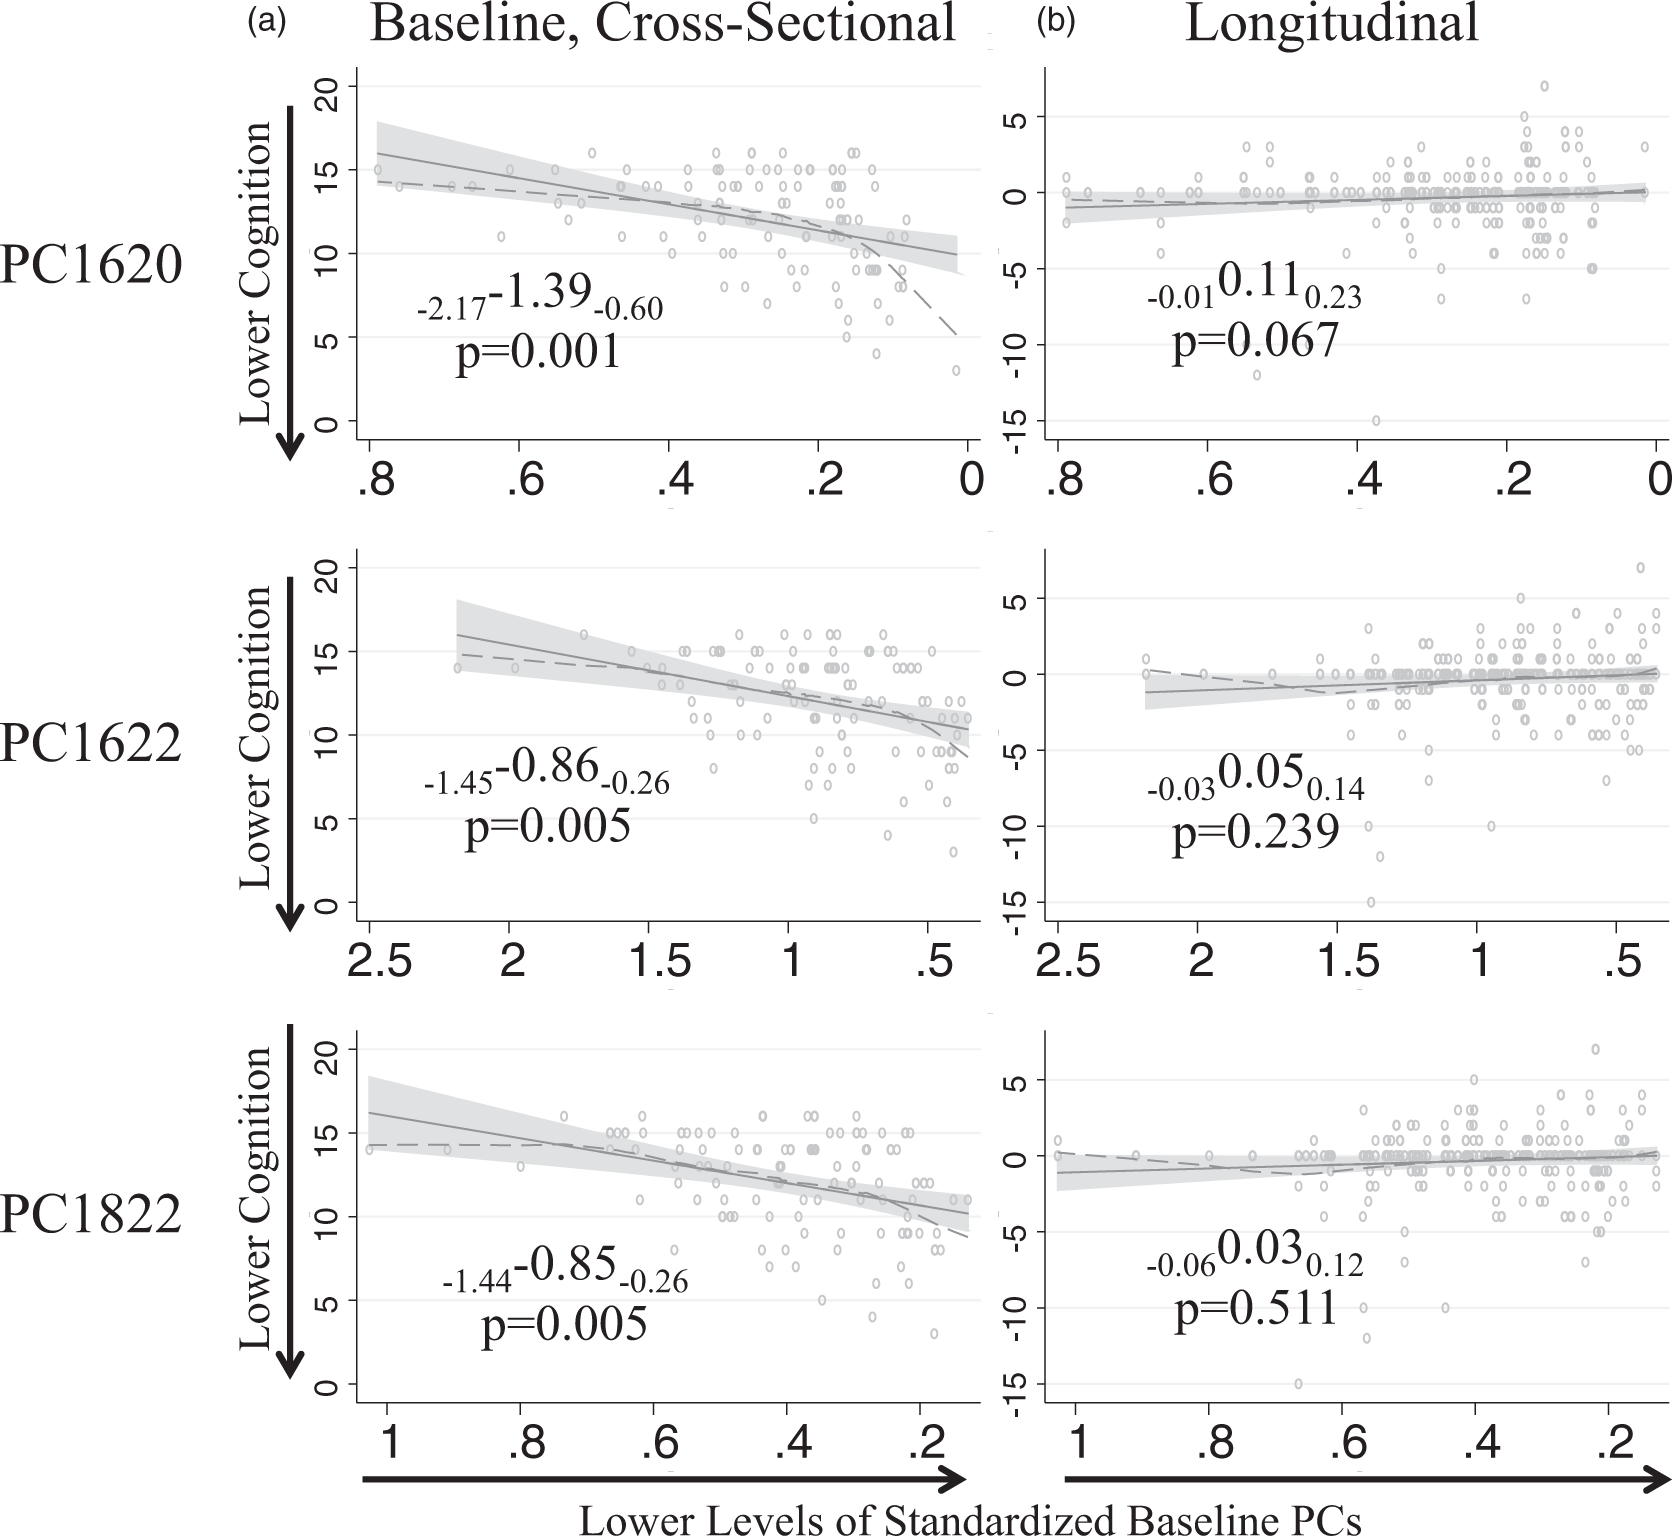
We observed similar results in cross-sectional analyses at subsequent visits. Thus, at visit 2, baseline levels of PC1620 and PC1822 were significantly associated with CVLT delayed recall scores with individuals remembering approximately one fewer word for every SD decrease in plasma concentration (PC1620: −1.54–0.99−0.45 p < 0.001 and PC1822: −2.16–1.09−0.01 p = 0.047). Similarly, at visit 3, lower baseline plasma PC1620 and PC1822 concentrations were significantly associated with lower verbal memory (CVLT delayed recall: PC1620: −1.56–1.03−0.49 p < 0.001 and PC1822: −2.35–1.30−0.25 p = 0.016; results not shown). Similar results were seen with CVLT total and short recall at both visit 2 and visit 3 (results not shown).
We did not observe associations between baseline plasma PC concentrations and longitudinal changes in cognitive performance (Figure 3). Similarly, there were no significant associations between longitudinal changes in PC concentrations and cognitive performance over time. Baseline cognitive scores in memory measures, Trails B, MMSE, BVRT, Card Rotation, and Category fluencies were significantly lower in those remaining cognitively normal compared to those with subsequent conversion to AD/MCI. PC concentrations at baseline and concentration trajectories over the study period did not differ between the two groups. Similarly, cognitive trajectories were not significantly different between the two groups in any of the cognitive measures examined (Supplementary Table 2). Sensitivity analyses excluding data at all available time points from individuals who eventually developed AD/MCI as well as those assessing the effects of missing data and outliers revealed similar results. Removing individuals with the poorest baseline cognition also gave similar findings. When adjusting for cardiovascular risk factors and serum lipid levels, results remained similar.
Plasma PC concentrations and rCBF
Primary regions showing lower brain activity (rCBF) with lower baseline PC concentrations.
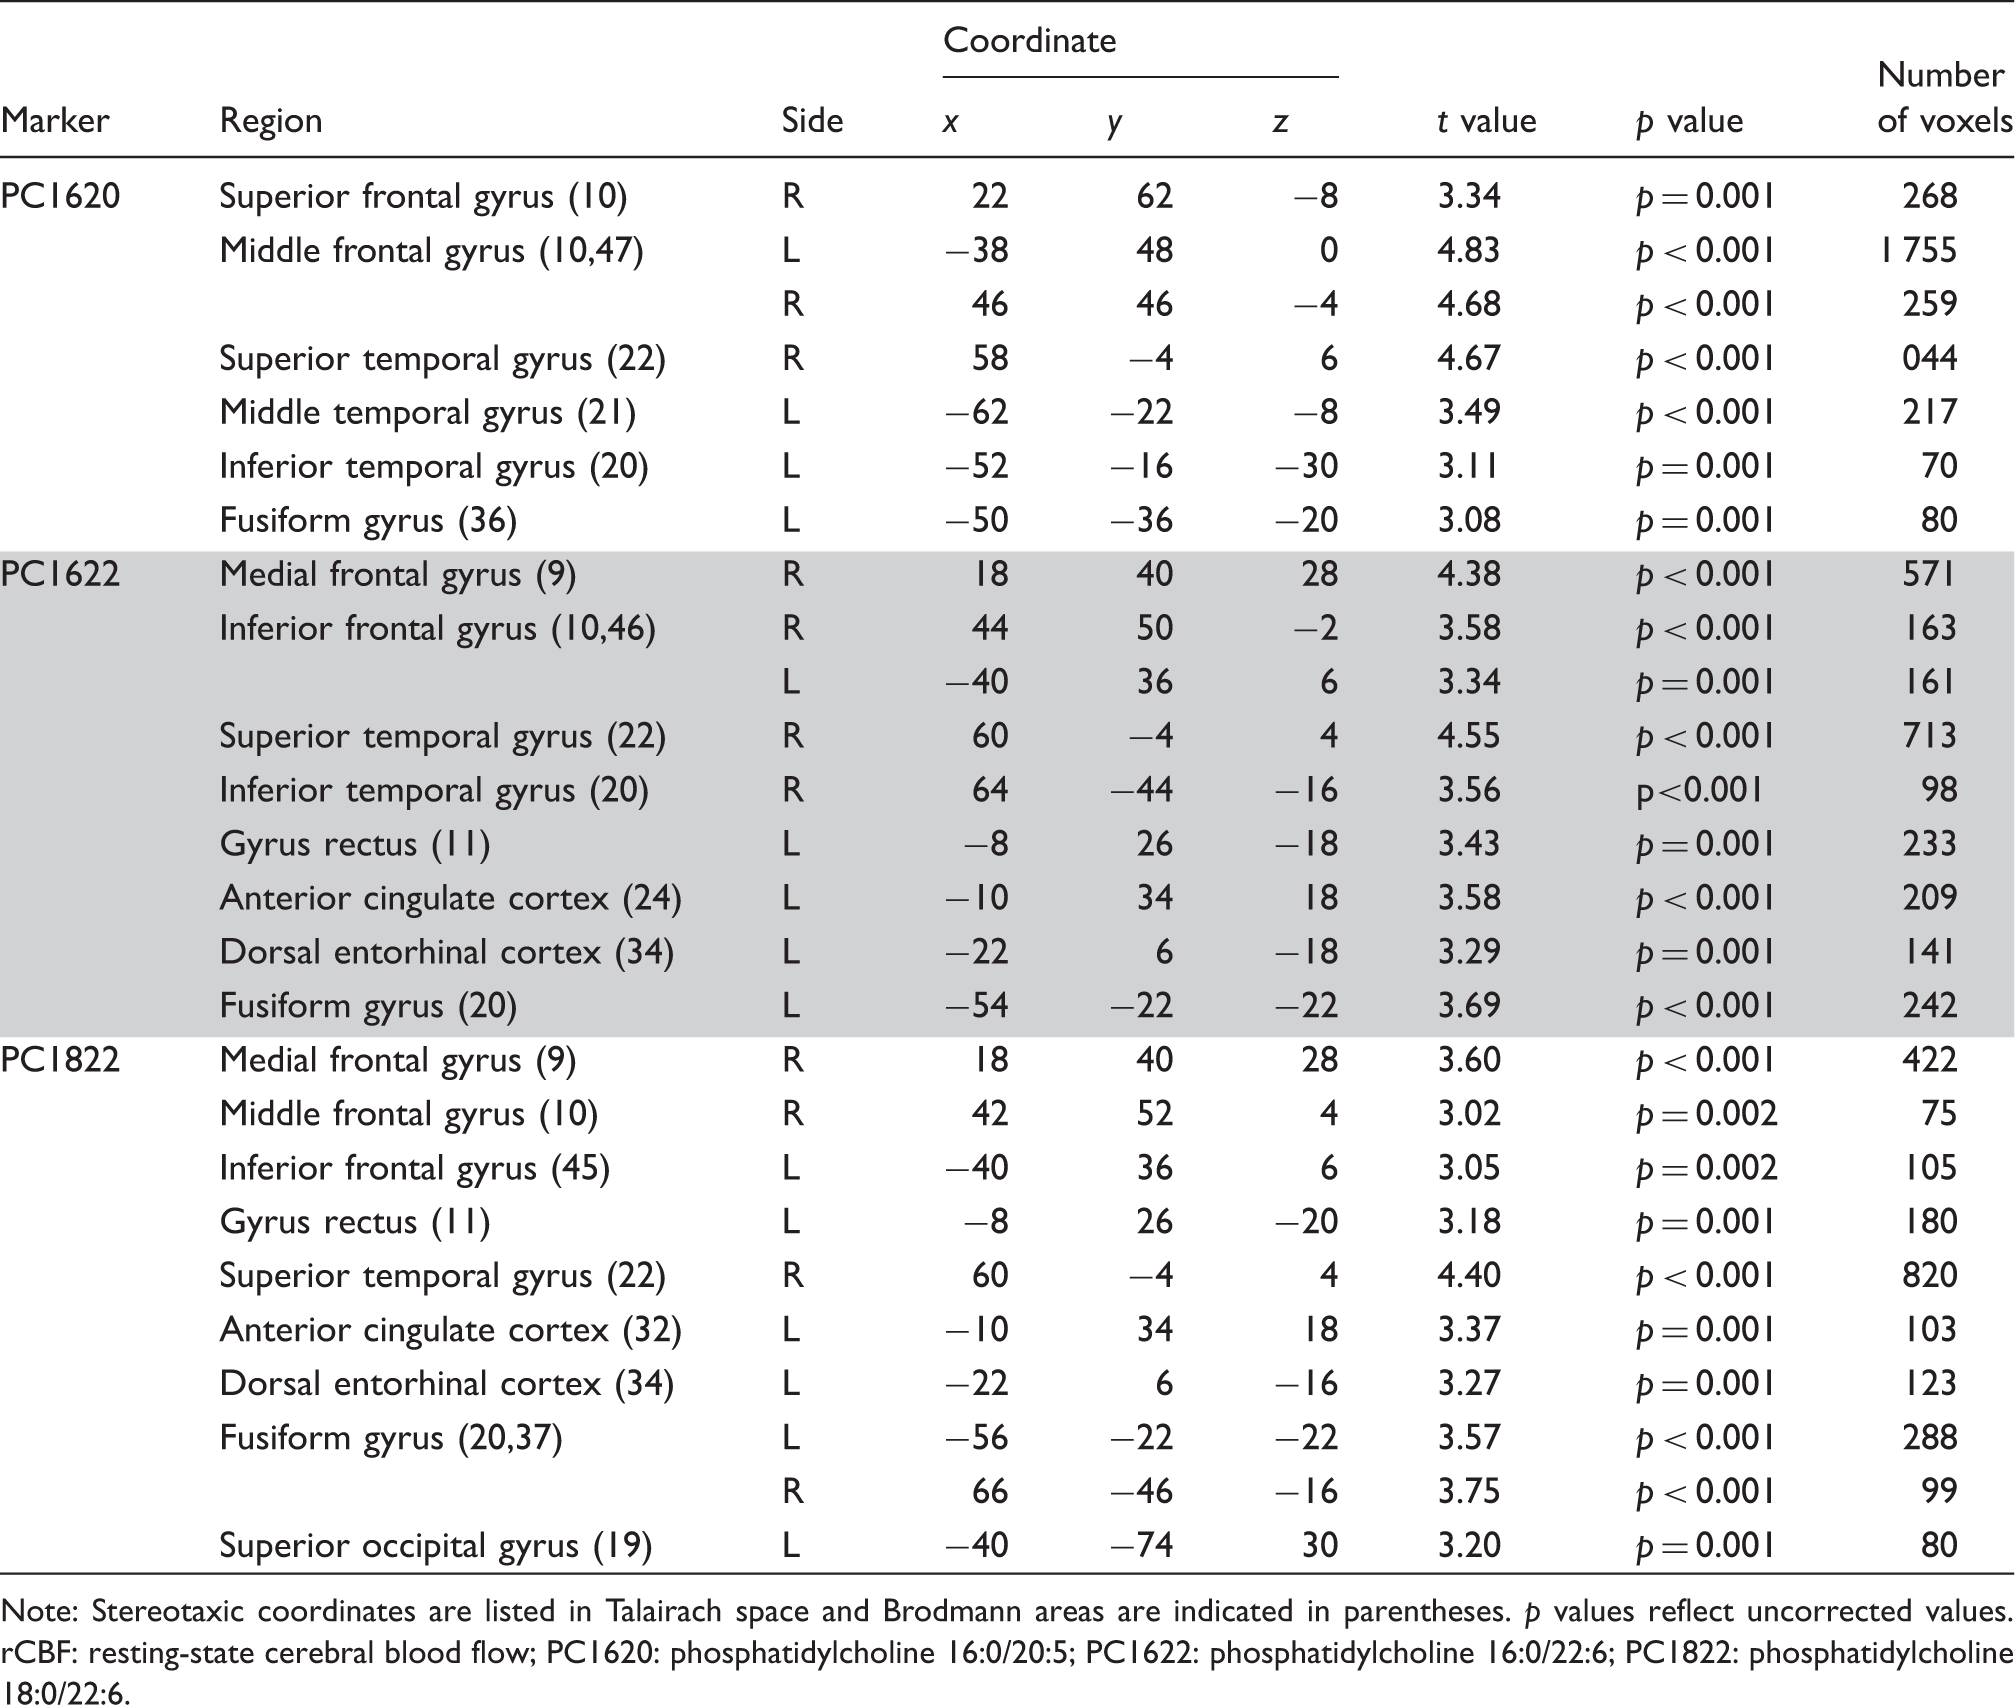
Note: Stereotaxic coordinates are listed in Talairach space and Brodmann areas are indicated in parentheses. p values reflect uncorrected values.
rCBF: resting-state cerebral blood flow; PC1620: phosphatidylcholine 16:0/20:5; PC1622: phosphatidylcholine 16:0/22:6; PC1822: phosphatidylcholine 18:0/22:6.
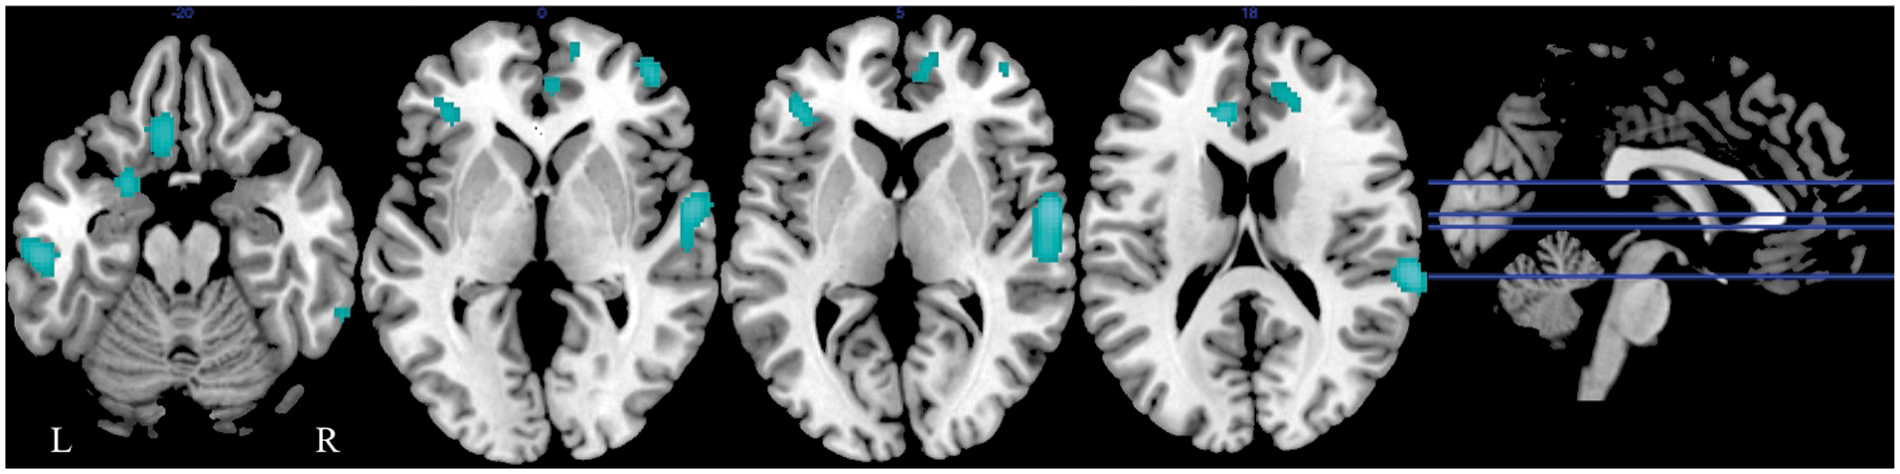
Associations between rCBF and plasma concentrations of PC1622 in cognitively normal older individuals. Plasma concentrations of PC1622 were entered in a voxel-based multiple regression analysis. Highlighted (blue) regions show significantly lower rCBF at baseline in association with lower plasma baseline concentrations of PC1622.
Discussion
In this study, our main aim was to extend our previous findings demonstrating a decrease in plasma concentrations of the PCs (PC1620, PC1622, PC1822) in AD patients relative to controls. 11 We, therefore, asked whether differences in plasma concentrations of these PCs were also related to cognitive performance and brain function during normal aging. We show that lower plasma concentrations of PC1620, PC1622, and PC1822 are indeed associated with poorer memory performance even in non-demented older individuals. Furthermore, lower plasma PC concentrations are also associated with decreased rCBF, an established marker of neuronal activity and brain function. 32 We find that lower plasma concentrations are associated with reduced rCBF in several cortical regions including association cortices mediating higher order cognitive processes.33–35 Together, our results suggest that altered peripheral concentrations of these PCs may be biomarkers of perturbed brain function during aging.
The finding that lower plasma PC concentrations are associated with lower memory performance in non-demented older individuals is important in the context of our recent results showing that AD patients have lower plasma concentrations of these PCs relative to healthy controls. 11 Our current findings extend our previous results and suggest that lower plasma concentration of these PC metabolites may also be related to age-associated changes in cognitive performance.
We also found that lower plasma PC concentrations are associated with widespread reductions in neuronal activity within several multi-modal association cortices. The results show that decreased neuronal activity in frontal, temporal, and occipital cortices occurs in relation to lower PC concentrations. Several of these regions, particularly the medial and lateral frontal cortices and the entorhinal cortex, are essential for maintenance of memory performance during aging.36–39 These findings support the associations observed between PC concentrations and cognitive function and suggest that peripheral levels of these small metabolites may reflect perturbations in brain function in older individuals.
Taken together with previous studies implicating small metabolites as biomarkers of AD,8,40–42 our current findings suggest that dysregulation of peripheral PC metabolism may be a common feature of both age-associated cognitive impairment as well as AD. While we have not carried out mechanistic studies to explain the observed associations between plasma PC concentrations and brain function, it is worth noting that a large body of evidence implicates PC metabolism in several key molecular pathways intrinsic to AD. These include cholesterol transport through high-density lipoproteins, neuroinflammation through arachidonic acid signaling, and amyloid precursor protein processing through phospholipase A2.43–45
Another plausible mechanism that may link lower PC concentrations in plasma with changes in brain function during aging may be through their role in metabolism of the n-3 polyunsaturated fatty acids (PUFAs), eicosapentaenoic acid, and docosahexaenoic acid (DHA). PCs serve as the major lipid pools into which dietary n-3 PUFAs are incorporated. 46 Several studies indicate that DHA may be neuroprotective both against AD as well age-related cognitive decline.47,48 While our metabolomics method is unable to directly quantify PUFA concentrations in plasma, our findings raise the possibility that alterations in plasma PC levels may influence brain function through their effects on DHA metabolism.
Some limitations of our study are worth noting. These include potential threshold effects associated with plasma PC concentrations. Diagnostic checks indicated a potential non-linear association at very low PC levels with even lower baseline cognition than predicted by a strictly linear function at the lowest PC levels. Our sample size precluded formal investigation of this non-linearity.
Moreover, our study design incorporating both plasma PC assays and 15O-water PET in the BLSA-NI sample resulted in a relatively short period of follow-up (∼7.8 years). In this highly educated and healthy sample of older individuals, longer follow-up duration may be required to observe robust age-related declines in cognitive performance and their associations with plasma PC concentrations.
In summary, we have shown that lower plasma concentrations of the candidate AD biomarkers PC1620, PC1622, and PC1822 are also strong predictors of concurrent memory performance and brain function even in non-demented older individuals. Our results provide further evidence implicating abnormalities of PC metabolism in early stages of memory impairment during normal aging.
Footnotes
Funding
The author(s) disclosed receipt of the following financial support for the research, authorship, and/or publication of this article: This research was supported by the Intramural Research Program of the NIH, National Institute on Aging, and by Research and Development Contract N01-AG-3-2124.
Acknowledgements
The authors would like to thank the BLSA participants, their families, and neuroimaging staff for their help and commitment to the study.
Declaration of conflicting interests
The author(s) declared no potential conflicts of interest with respect to the research, authorship, and/or publication of this article.
Authors' contributions
BNS designed the study, analyzed and interpreted the data, and drafted and revised the manuscript; KM acquired the data and revised the manuscript; YFC analyzed and interpreted the data and revised the manuscript; LBH acquired the data, interpreted the data, and revised the manuscript; MKT acquired the data and revised the manuscript; MK acquired the data and revised the manuscript; STL analyzed and interpreted the data and revised the manuscript; BGW interpreted the data and revised the manuscript; MEG designed the study, analyzed and interpreted the data, and revised the manuscript; CLQ designed the study, acquired the data, and revised the manuscript; MT conceived and designed the study, interpreted the data, and drafted and revised the manuscript.
References
Supplementary Material
Please find the following supplemental material available below.
For Open Access articles published under a Creative Commons License, all supplemental material carries the same license as the article it is associated with.
For non-Open Access articles published, all supplemental material carries a non-exclusive license, and permission requests for re-use of supplemental material or any part of supplemental material shall be sent directly to the copyright owner as specified in the copyright notice associated with the article.