
Abstract
Therapeutic hypothermia has emerged as the first empirically supported therapy for neuroprotection in neonates with hypoxic-ischemic encephalopathy (HIE). We used magnetic resonance spectroscopy (1H-MRS) to characterize the effects of hypothermia on energy metabolites, neurotransmitters, and antioxidants. Thirty-one neonates with HIE were studied during hypothermia and after rewarming. Metabolite concentrations (mmol/kg) were determined from the thalamus, basal ganglia, cortical grey matter, and cerebral white matter. In the thalamus, phosphocreatine concentrations were increased by 20% during hypothermia when compared to after rewarming (3.49 ± 0.88 vs. 2.90 ± 0.65, p < 0.001) while free creatine concentrations were reduced to a similar degree (3.00 ± 0.50 vs. 3.74 ± 0.85, p < 0.001). Glutamate (5.33 ± 0.82 vs. 6.32 ± 1.12, p < 0.001), aspartate (3.39 ± 0.66 vs. 3.87 ± 1.19, p < 0.05), and GABA (0.92 ± 0.36 vs. 1.19 ± 0.41, p < 0.05) were also reduced, while taurine (1.39 ± 0.52 vs. 0.79 ± 0.61, p < 0.001) and glutathione (2.23 ± 0.41 vs. 2.09 ± 0.33, p < 0.05) were increased. Similar patterns were observed in other brain regions. These findings support that hypothermia improves energy homeostasis by decreasing the availability of excitatory neurotransmitters, and thereby, cellular energy demand.
Introduction
Hypoxic-ischemic encephalopathy (HIE) is a leading cause of neonatal death and neurodevelopmental disability, including motor, sensorineural, and cognitive-behavioral impairments. 1 Following multiple randomized clinical trials2–7 and endorsements from the Eunice Kennedy Shriver National Institute of Child Health and Human Development (United States) 8 and the National Institute for Health and Clinical Excellence (United Kingdom), 9 therapeutic hypothermia (TH) is now standard of care for neuroprotection for neonates with HIE. Still, treatment effects are modest, and efforts to improve treatment efficacy would be improved with the availability of in vivo data detailing the effects of hypothermia in a clinical population.
Three decades ago, magnetic resonance spectroscopy (MRS) demonstrated that brain injury in neonatal HIE is an evolving process. 10 Acutely, hypoxia-ischemia disrupts mitochondrial metabolism, leading to a rapid depletion of adenosine triphosphate (ATP) and phosphocreatine, high energy phosphates necessary for vital cellular functions, and a concomitant build-up of lactic acid and other anaerobic metabolites.11–14 Clinically, resuscitation restores cerebral blood flow and oxygenation, and in most cases, allows for the recovery of ATP and phosphocreatine to baseline. 10 However, in neonates with HIE, this latent period is followed ∼8–24 h later by a period of secondary energy failure stemming from an accumulation of excitatory amino acids, intracellular calcium, cytotoxic edema, free radicals and reactive oxygen species, and, at the core, a progressive failure in mitochondrial metabolism (for a review, see Johnston et al. 15 ).
Laboratory research has shown that hypothermia has significant effects on energy metabolism,16,17 mitochondrial membrane potential,18,19 and the availability of excitatory amino acids 20 and reactive oxygen species. 21 However, most of these effects have been documented in animal models whereby hypothermia is applied concurrent with or immediately following hypoxia-ischemia—i.e. acutely, when the neuroprotective effects of hypothermia are maximized. Far less is known about the effects of hypothermia during the latent period or early phase of secondary energy failure, ∼6–78 h after birth—the window for hypothermia in clinical practice. Yet, such data would not only allow for a more tailored approach to the delivery of hypothermia in neonates with HIE, but also foster the development of early biomarkers that could be used to direct adjuvant neuroprotective therapies toward the neonates who are most likely to benefit.
The aim of this study was to interrogate the effects of hypothermia on cerebral metabolism in human neonates with HIE. Using 1H-MRS, we quantitated the concentrations of key metabolites related to energy metabolism, neurotransmission, and antioxidant mechanisms during hypothermia and after rewarming. We hypothesized that hypothermia would exert broad effects on metabolites known to be involved in energy utilization, neurotransmission, and oxidative stress.
Methods
All procedures were approved by the Children’s Hospital Los Angeles (CHLA) Institutional Review Board and written consent was provided by a parent prior to their child’s participation in the research study.
Patient selection and recruitment
Between April 2012 and January 2015, 40 term neonates (gestational age ≥36 weeks) undergoing TH for HIE were prospectively recruited from the Newborn and Infant Critical Care Unit (NICCU) at CHLA for this observational research study. Per clinical protocol, whole-body hypothermia was initiated within 6 h after birth and maintained using a blanket cooling device (Blanketrol III, Cincinnati Subzero Medical) programmed to maintain rectal temperature at 33.5 ± 0.5℃. Patients were excluded from the research study if they had major congenital anomalies or required high frequency oscillatory ventilation, extra-corporeal membrane oxygenation support, or had other clinical conditions deemed unsafe for in-house transport to the magnetic resonance imaging (MRI) suite. Demographic and clinical outcome data were coded from the electronic medical record.
Of the 40 infants prospectively enrolled, seven were ultimately too unstable to undergo MRI during hypothermia, and thus, were excluded from the study. Additionally, two infants were retrospectively excluded, because they were later confirmed to be suffering from a congenital infection (n = 1) or be an infant of a substance abusing mother (n = 1). Data presented below represent the final sample (n = 31).
MR acquisition
Neonates underwent MRI once during hypothermia (median: 61.0 h after birth; interquartile range: 46.0–68.8 h) and again at least 24 h after rewarming (median: 139.3 h after birth; interquartile range: 116.5–187.0 h). During the first MRI, whole-body hypothermia was maintained using the same blanket-cooling device as above, modified with extension tubing.22,23 Rectal temperature was continuously monitored throughout both examinations and recorded via an MR compatible temperature probe (Invivo Corporation, Gainesville, FL).
Clinical and demographic characteristics.
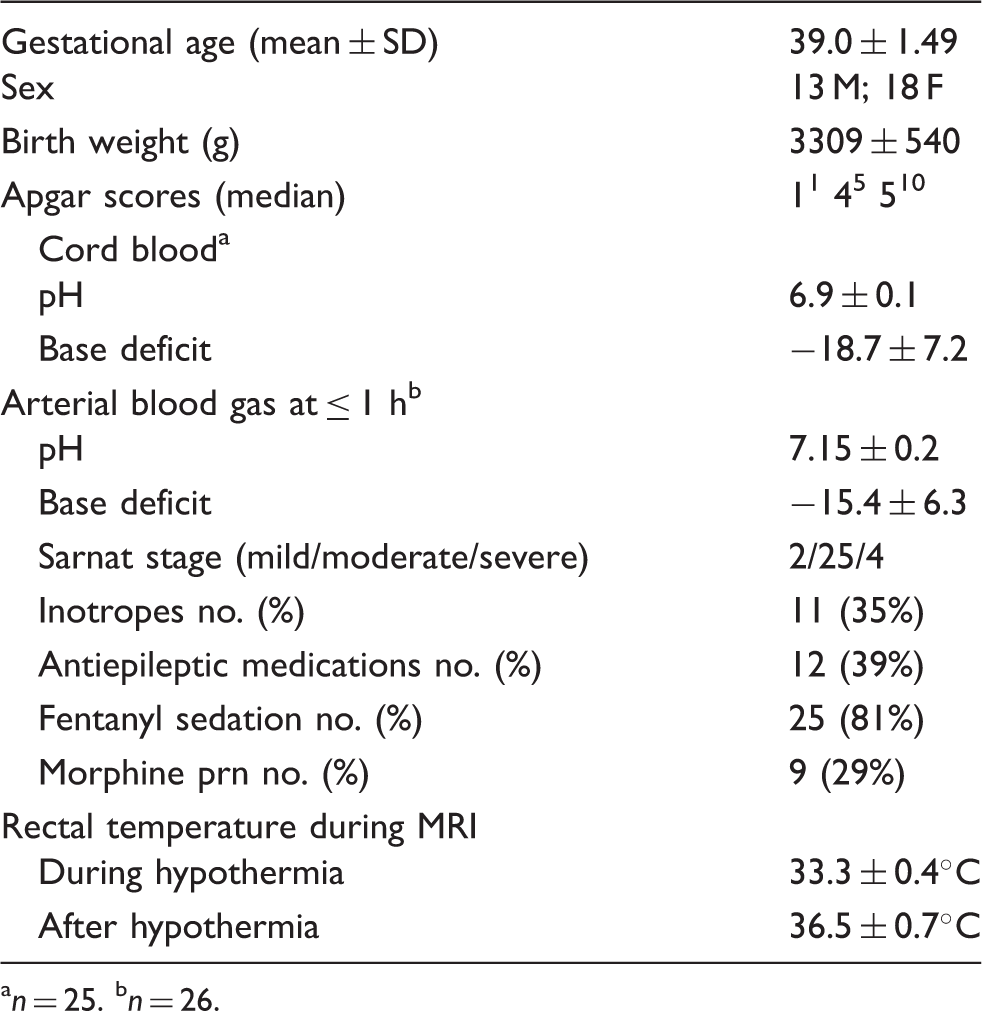
n = 25.
n = 26.
1H-MRS data were acquired using a single-voxel point resolved spectroscopy sequence (PRESS; TR = 2 s; TE = 35 ms; 128 signal averages; voxel size: ∼3 cm3) localized to the left thalamus, right basal ganglia, medial cortical grey matter and left parietal white matter on axial, sagittal and coronal T2-weighed images (Figure 1). (Note that the left parietal white matter region of interest was added to the imaging protocol after the tenth neonate.) These regions were selected a priori because they are known areas of vulnerability to hypoxia-ischemia in neonates and corresponded to the central (thalamus/basal ganglia/perirolandic cortex) and peripheral/watershed (white matter) patterns of brain injury in neonatal HIE.
24
Finally, conventional T1-weighted, T2*-weighted, and diffusion-weighted images were acquired and reviewed by a neuroradiologist, together with the T2-weighted images, for evidence of acute infarction, hemorrhage or other brain injury. The total examination time was approximately 1 h.
Overview of 1H-MRS acquisition. 1H-MRS spectra were acquired using a short-echo (TE 35 ms) PRESS sequence as shown here on a single neonate during hypothermia (note the high signal posterior to the occiput on the sagittal T2-weighted images, which arises from the water in the cooling blanket). MRS voxels (black boxes) were positioned in the (a) left thalamus, (b) right basal ganglia, (c) medial frontal-parietal cortical grey matter, and (d) left parietal white matter on axial, coronal and sagittal T2-weighted images. The acquired MRS spectra (raw, unsmoothed) are shown to the right of the localizer voxels. Metabolite concentrations were quantitated from these spectra in LCModel.
25
(For reference, the prominent metabolites associated with each peak are labeled in Figure 5).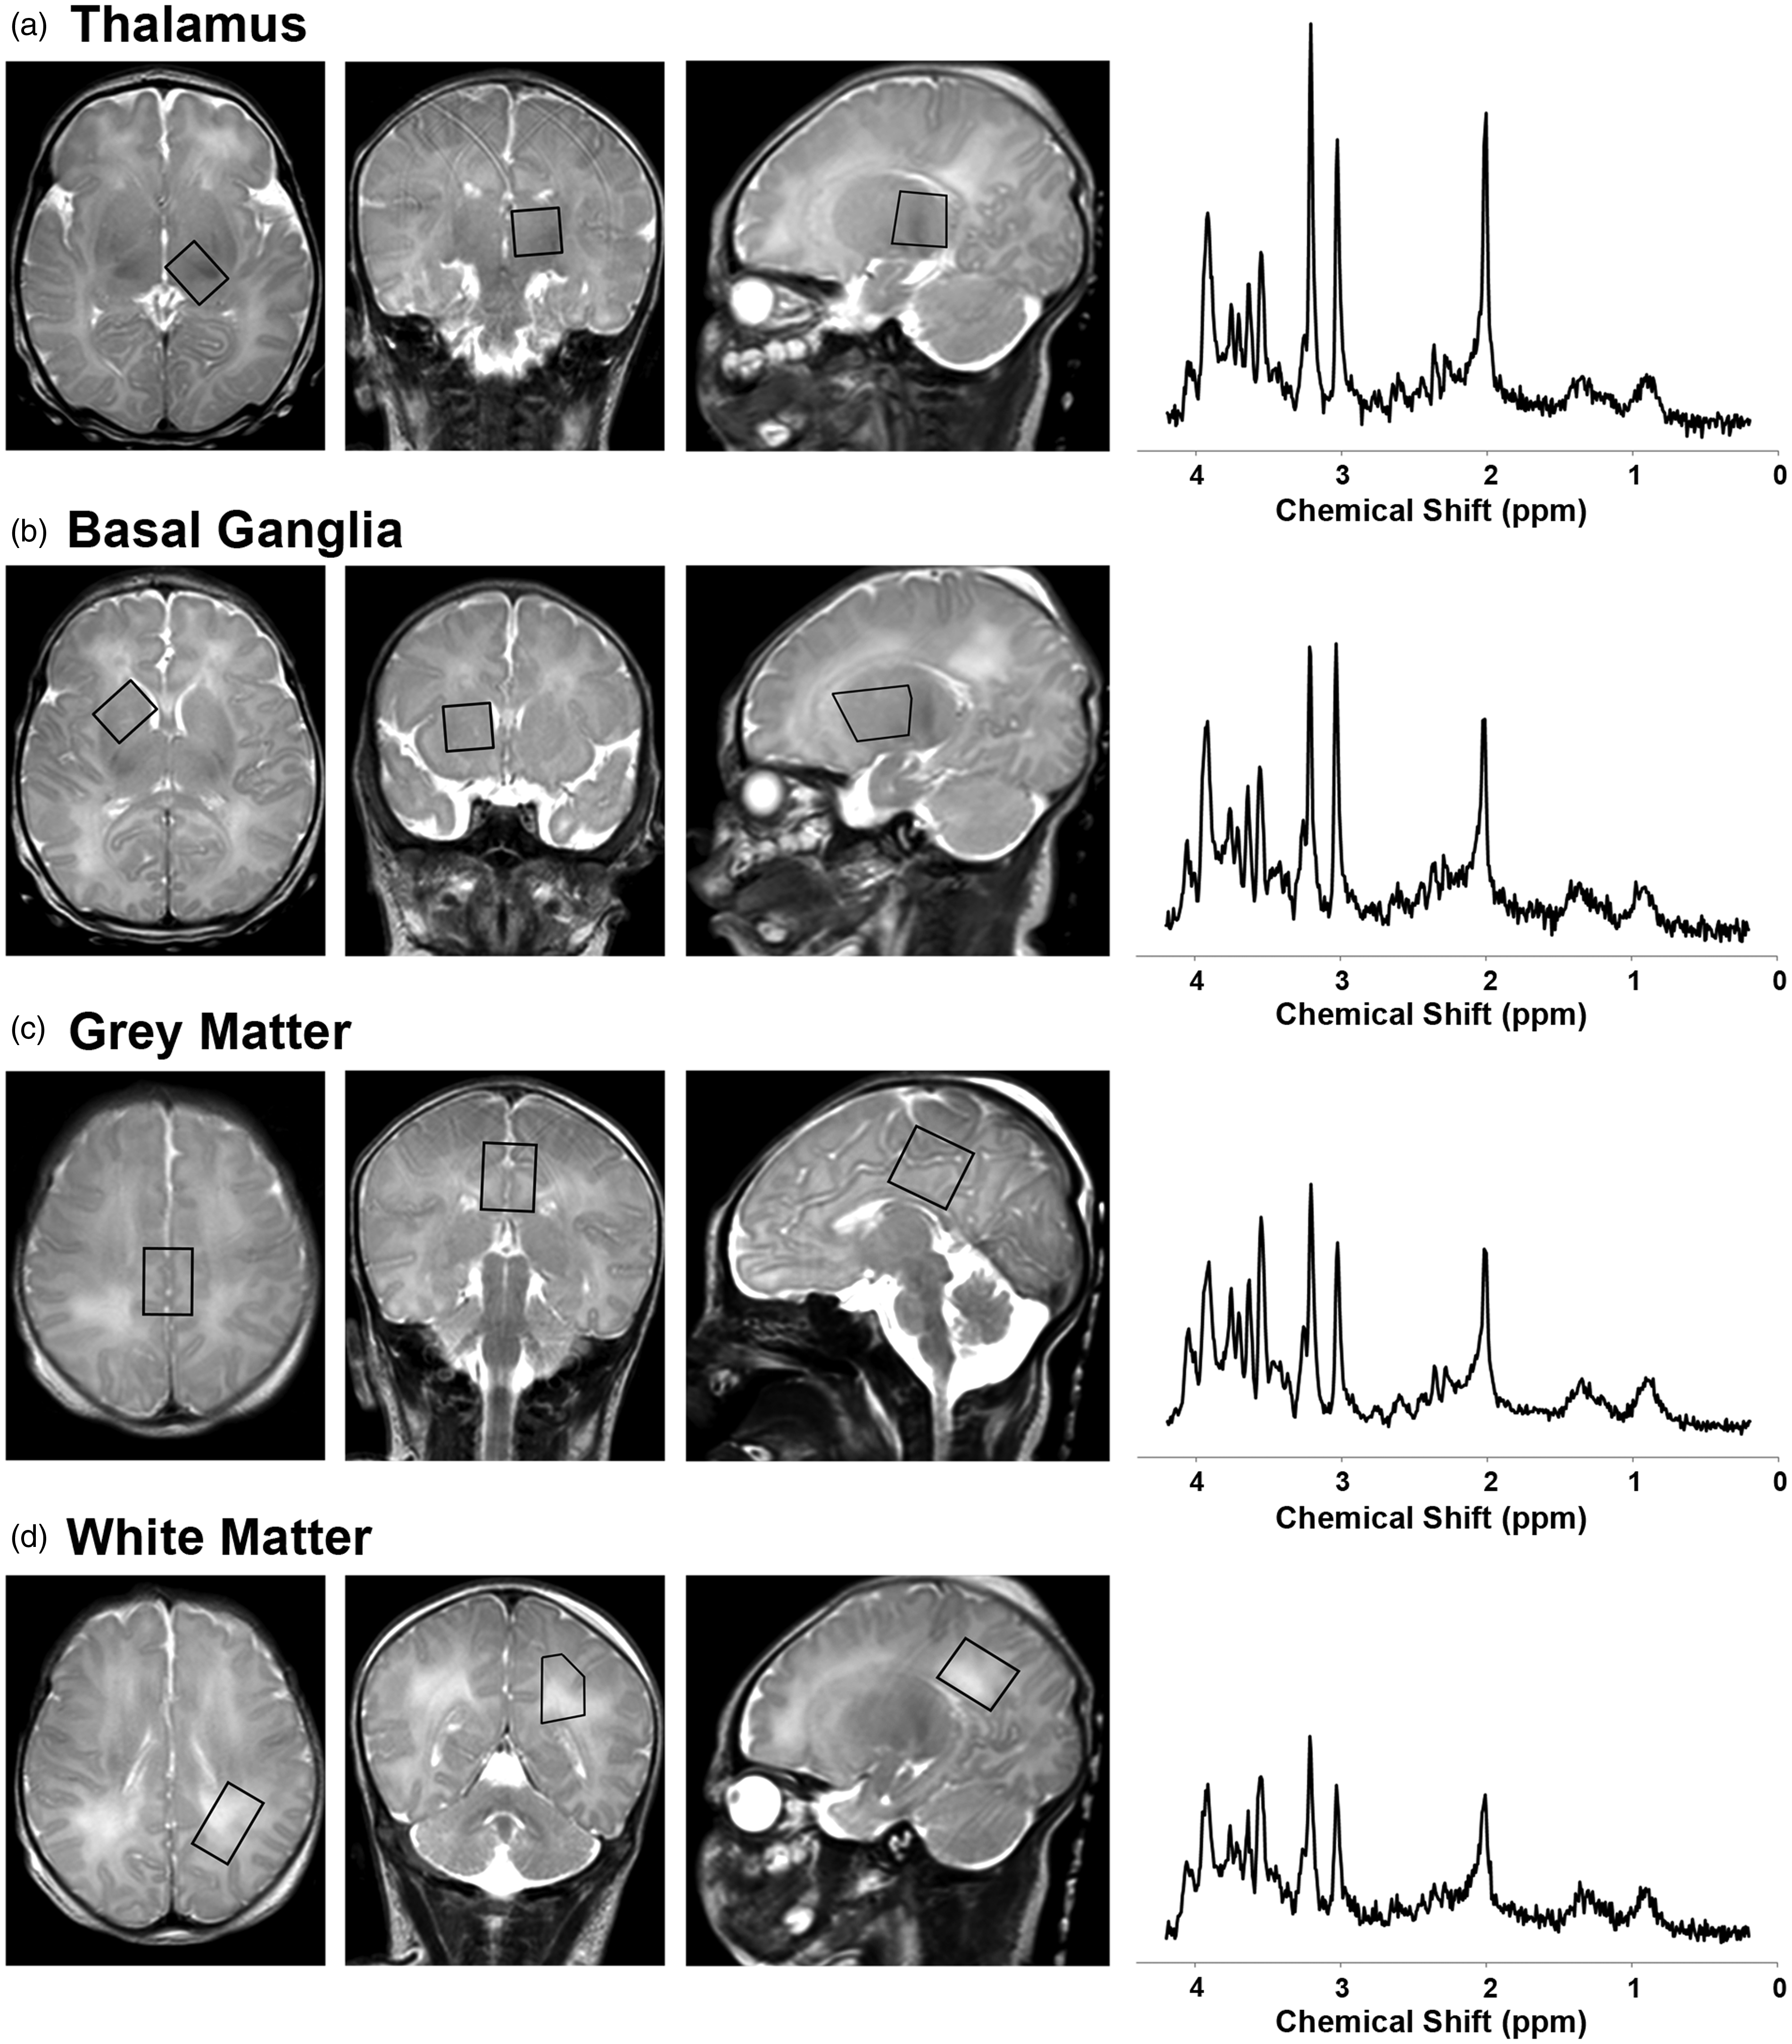
MRS data processing
Examples of 1H-MRS spectra are provided in Figure 1. Metabolite concentrations were estimated using commercially available and fully automated LCModel software (V6.3-1 C). 25 This software applies zero-order and first-order corrections for phase, estimates a baseline, corrects for ppm shift and eddy currents as needed, and determines metabolite concentrations, without user interaction. Data were fitted with linear combinations of 45 model spectra of known concentration, which included: phosphocreatine, free creatine, glucose, citrate, lactate, alanine, N-acetyl-aspartate (NAA), acetoacetate, acetone, β-hydroxybutyrate, glutamate, glutamine, γ-aminobutyric acid (GABA), n-acetyl-apartyl glutamate (NAAG), glycine, taurine, and glutathione (i.e. metabolites of interest), as well as acetate, carnitine, cysteic acid, ethanolamine, fucose, glycerophosphocholine, phosphocholine, 2-hydroxyglutarate, myoinositol, phosphoethanolamine, propylene glycol, pyruvate, scyllo-inositol, succinate, threonine, guanadinoacetate, CH3-protons (lipids), CH2-CH2- protons (lipids), CH = CH-protons (lipids), polyunsaturated fatty acids, and macromolecules at ∼0.9, 1.2, 1.4, 1.7, and 2.0 ppm (see below for further details on metabolites of interest).
For quantitation, the unsuppressed water signal was used as a concentration reference, with tissue water content estimated at a standardized value (86%, i.e. 47.8 M) based on published reference data 26 (see also Figure S2 from Bluml et al. 27 ). To ensure reliability, spectra of poor quality were excluded a priori based on stringent thresholds for linewidth (< 0.05 ppm, i.e. < 6.4 Hz) and signal to noise (≥10), which resulted in 5 out of 210 acquired spectra being excluded from analyses. For most metabolites, Cramér Rao Lower Bounds (CRLB) were <50%, and generally <20%, including phosphocreatine, free creatine, glucose, lactate, NAA, glutamate, glutamine, aspartate, NAAG, taurine, and glutathione (Table S1). However, a few metabolites, which were present in low concentration, had higher CRLB values (>50%), including citrate, acetoacetate, acetone, β-hydroxybutyrate, GABA, and glycine. These were retained in all subsequent analyses because higher CRLB values only serve to decrease statistical power and increase the risk of a type II error (failing to reject a false null hypothesis); there was no increased risk of type I error (falsely rejecting a true null hypothesis). However, caution is warranted as actual concentrations for these metabolites could be higher or lower than the values reported in the tables below.
Metabolites
Phosphocreatine and free creatine, which generate partially overlapping signals at ∼3.02 and 3.94 ppm (Figure S1), are metabolically inert compounds, critical for cellular energy homeostasis.
28
In situations of increased energy demand, phosphocreatine functions as a cellular energy reserve by transferring its high-energy phosphate to ADP to maintain cellular ATP levels in a reversible reaction catalyzed by creatine kinase:

Glucose, which generates two small, complex peaks at ∼3.43 and 3.8 ppm, is the primary fuel for energy metabolism in the human brain and vital for the synthesis of many neurotransmitters, including glutamate, aspartate, and GABA. 29 Under physiologic conditions, most cerebral glucose is metabolized aerobically, yielding carbon dioxide and water, or used in biosynthetic processes; however, in healthy neonates as much as 5% of glucose may be metabolized anaerobically to lactate. 30
Lactate and alanine, which generate doublets at ∼1.33 and 1.48 ppm, respectively, are byproducts of anaerobic metabolism, which help maintain glycolysis, and in turn, ATP production when oxidative phosphorylation is insufficient, such as in the setting of hypoxia-ischemia. 31
Citrate, which generates a multiplet centered at ∼2.6 ppm, is an intermediate product of the tricarboxylic acid (TCA) cycle.
NAA, which generates a prominent peak at ∼2.02 ppm as well as complex signals between ∼2.3 and 2.8 ppm, is synthesized in the mitochondria of neurons and axons from the amino acid aspartic acid and acetyl-coA.32,33 Although NAA is widely considered a marker for neuronal/axonal integrity, 34 in this study, it is more appropriate to regard it as a marker of mitochondrial activity.
Acetoacetate (∼2.26 and 3.46 ppm), acetone (2.2 ppm), and β-hydroxybutyrate (1.2 ppm) are ketone bodies generated during the metabolism of fatty acids. Although typically non-detectable with MRS under physiological conditions due to inherently low concentrations, in healthy neonates, approximately 10% of cerebral oxidative metabolism stems from the consumption of ketone bodies.30,35,36
Glutamate, which generates complex signals at ∼2.36, 3.76, and 2.08 ppm (Figure S2), is the principal excitatory neurotransmitter in the human brain. 37 It is synthesized from α-ketoglutarate, an intermediary in the TCA cycle, and is itself, an intermediary in the synthesis of GABA. 38 It is estimated that as many as 60–70% of synapses in the mammalian brain utilize glutamate as their primary neurotransmitter. 37
Glutamine, which generates complex signals at ∼2.45, 3.78 and 2.15 ppm, is an intermediary metabolite in multiple pathways supporting energy metabolism and neurotransmission. Under normal, physiological conditions excess glutamate released into the synaptic cleft is readily transported into perisynaptic astrocytes and converted to glutamine, which in turn, may be transported back into neurons and converted back into glutamate, i.e. the glutamate–glutamine cycle. Additionally, in astrocytes, glutamine can be synthesized from glucose or other energy substrates or utilized for energy metabolism or utilized as a precursor for the synthesis of glutathione. 39
Aspartate, which generates complex signals at ∼2.7 and 3.9 ppm, is an excitatory neurotransmitter. Like glutamate, it is synthesized from a TCA-cycle intermediary, oxaloacetate.
GABA, which generates multiplets centered at ∼1.89, 2.3, and 3.01 ppm, is generally regarded as the principal inhibitory neurotransmitter 40 ; however, in fetal and neonatal brains, GABA can function as an excitatory neurotransmitter triggering depolarization rather than hyperpolarization in the postsynaptic cell. 41
NAAG, which generates a small peak at approximately 2.04 ppm, is the most abundant neuropeptide in the brain. Although the functions of NAAG are incompletely understood, NAAG binds to R3 metabotropic glutamatergic receptors on astrocytes and likely provides signals about the state of neurostimulation or changing requirements for vascular energy supply. 42
Glycine, which generates a singlet at ∼3.56 ppm, is an inhibitory neurotransmitter predominantly localized to the spinal cord and subcortical regions 43 ; however, it is also required as a co-agonist N-methyl-D-aspartate (NMDA) receptors, suggesting that it also plays a key role in excitatory neurotransmission and excitotoxic brain injury. 44
Taurine, which generates a multiplet centered at ∼3.35 ppm, is widely regarded as an inhibitory neurotransmitter 45 and osmolite.46,47
Glutathione, which generates a series of multiplets centered at ∼2.15, 2.55, 2.96, and 3.78 ppm, is an endogenous antioxidant.
Statistical analyses
Statistical analyses were performed using SPSS Software Version 21 (IBM Corporation) and carried out separately for each region of interest (thalamus, basal ganglia, cortical grey matter and white matter). Paired t tests were used to compare metabolite concentrations during and after TH. A p value of < 0.05 was considered statistically significant. Effect size was calculated using Cohen’s d, which can be interpreted as small (≥0.2), medium (≥0.5), or large (≥0.8). 48
Results
Clinical and demographic data for the study cohort are summarized in Table 1. Overall, the characteristics of this sample are similar to those in the large-scale clinical trials for TH,2,4,6,7 with the exception that there are fewer infants here with severe Sarnat-stage HIE due in large part to the confounding fact that those infants are more often clinically too unstable to undergo MRI during hypothermia.
Energy reserves were higher during hypothermia while aerobic and anaerobic metabolism were reduced
There were large effects of hypothermia on energy metabolites. Specifically, during hypothermia, phosphocreatine concentrations were increased by ∼20% in the thalamus, basal ganglia and cortical grey matter and by 50% in the cerebral white matter as compared to after rewarming, while free creatine concentrations were reduced by a similar degree (Figure 2; see also Table S2 for exact values, including means, standard deviations, and effect size for each contrast). Similarly, glucose concentrations were reduced by 22% in the thalamus while lactate was reduced by ∼16% in the basal ganglia and white matter during hypothermia. NAA was reduced by 5–10% in all four regions. Β-hydroxybutyrate concentrations were reduced slightly in the grey matter, but elevated in the white matter, during hypothermia relative to after rewarming. There were no differences in the concentrations citrate, acetoacetate, acetone, or alanine (Table S2).
Energy metabolite concentrations during hypothermia versus after rewarming. Mean concentrations of (a) phosphocreatine, (b) free creatine, (c) lactate, and (d) NAA measured during hypothermia (light grey bars) and after rewarming (dark grey bars) are shown above, stratified by brain region. Error bars indicate ± standard error of the mean. ***p < 0.001; **p < 0.01; *p < 0.05; ns: non-significant; TH: therapeutic hypothermia.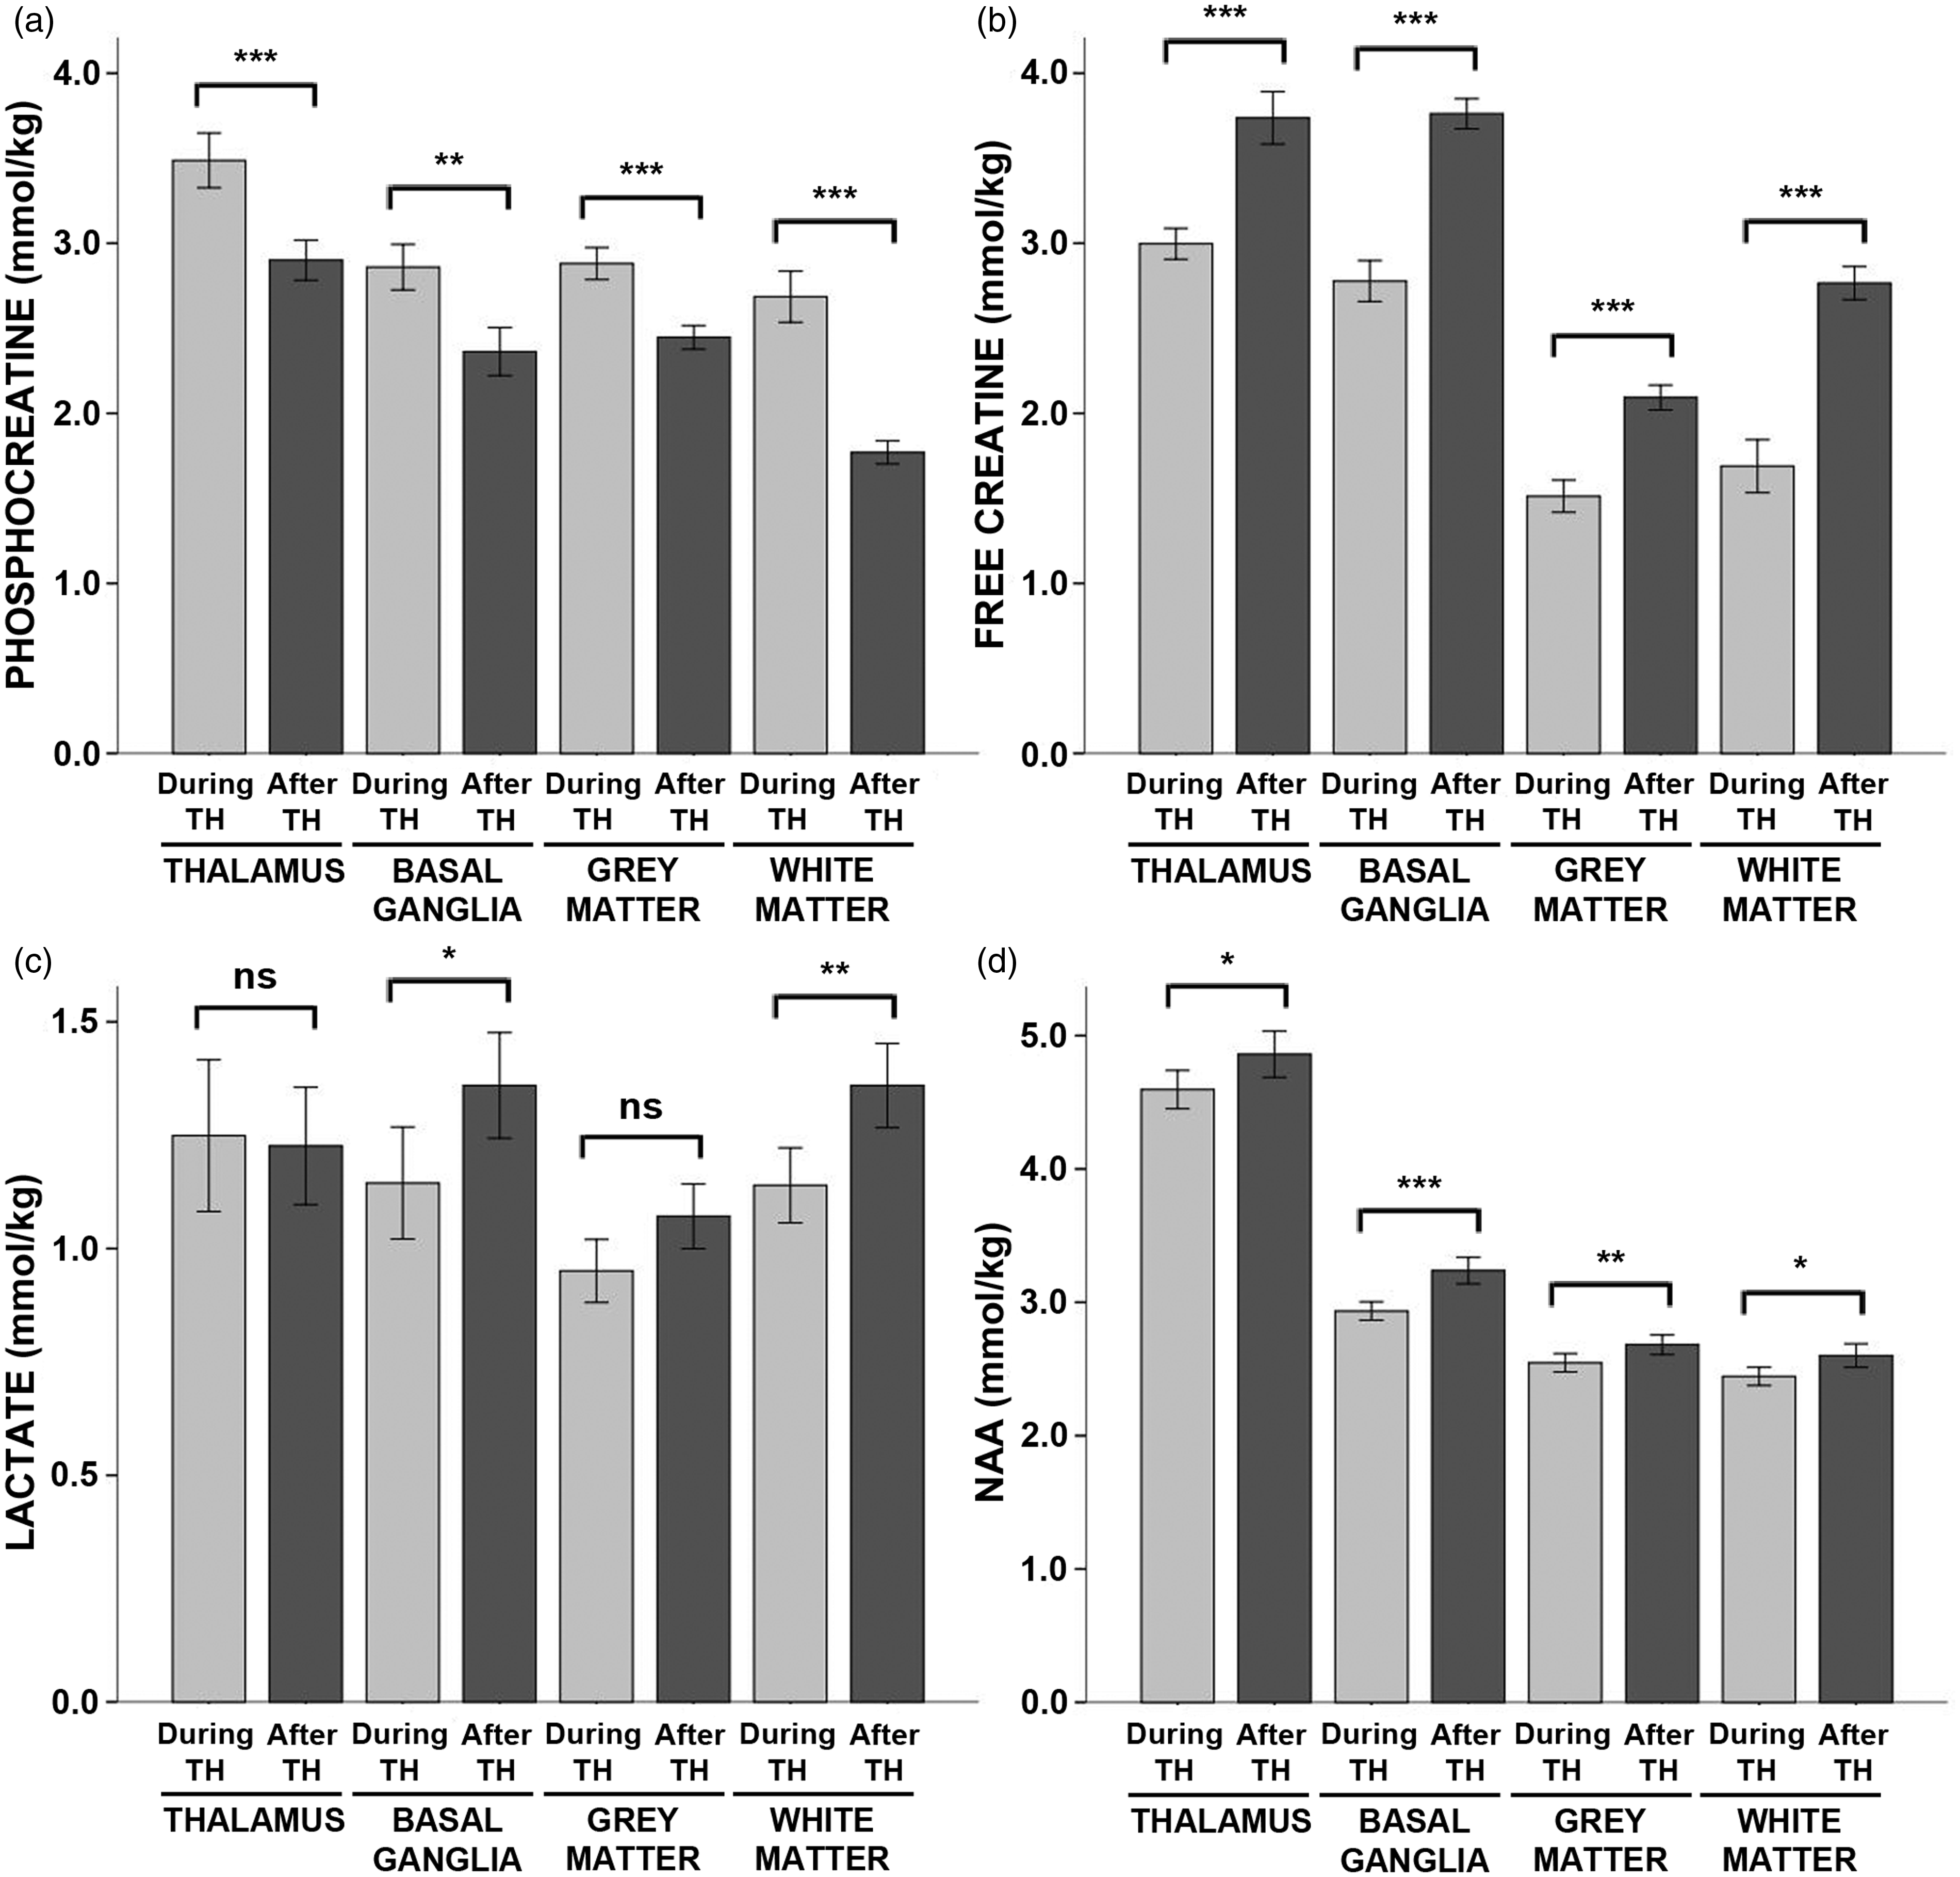
Excitatory neurotransmitter concentrations were reduced during hypothermia
As expected, there were large effects of hypothermia on neurotransmitter concentrations. Glutamate was reduced by ∼20% across all regions during hypothermia as compared to after rewarming (Figure 3, see also Table S3). Likewise, GABA was reduced by ∼20% in the thalamus and basal ganglia and by 11% in the cortical grey matter. Aspartate was reduced by ∼11% in the thalamus and the cortical grey matter, and glycine was reduced by 37% in the cortical grey matter.
Neurotransmitter concentrations during hypothermia versus after rewarming. Mean concentrations of (a) glutamate, (b) GABA, (c) aspartate, (d) glycine, (e) NAAG, and (f) taurine measured during hypothermia (light grey bars) and after rewarming (dark grey bars) are shown above, stratified by brain region. Error bars indicate ± standard error of the mean. ***p < 0.001; **p < 0.01; *p < 0.05; ns: non-significant; TH: therapeutic hypothermia.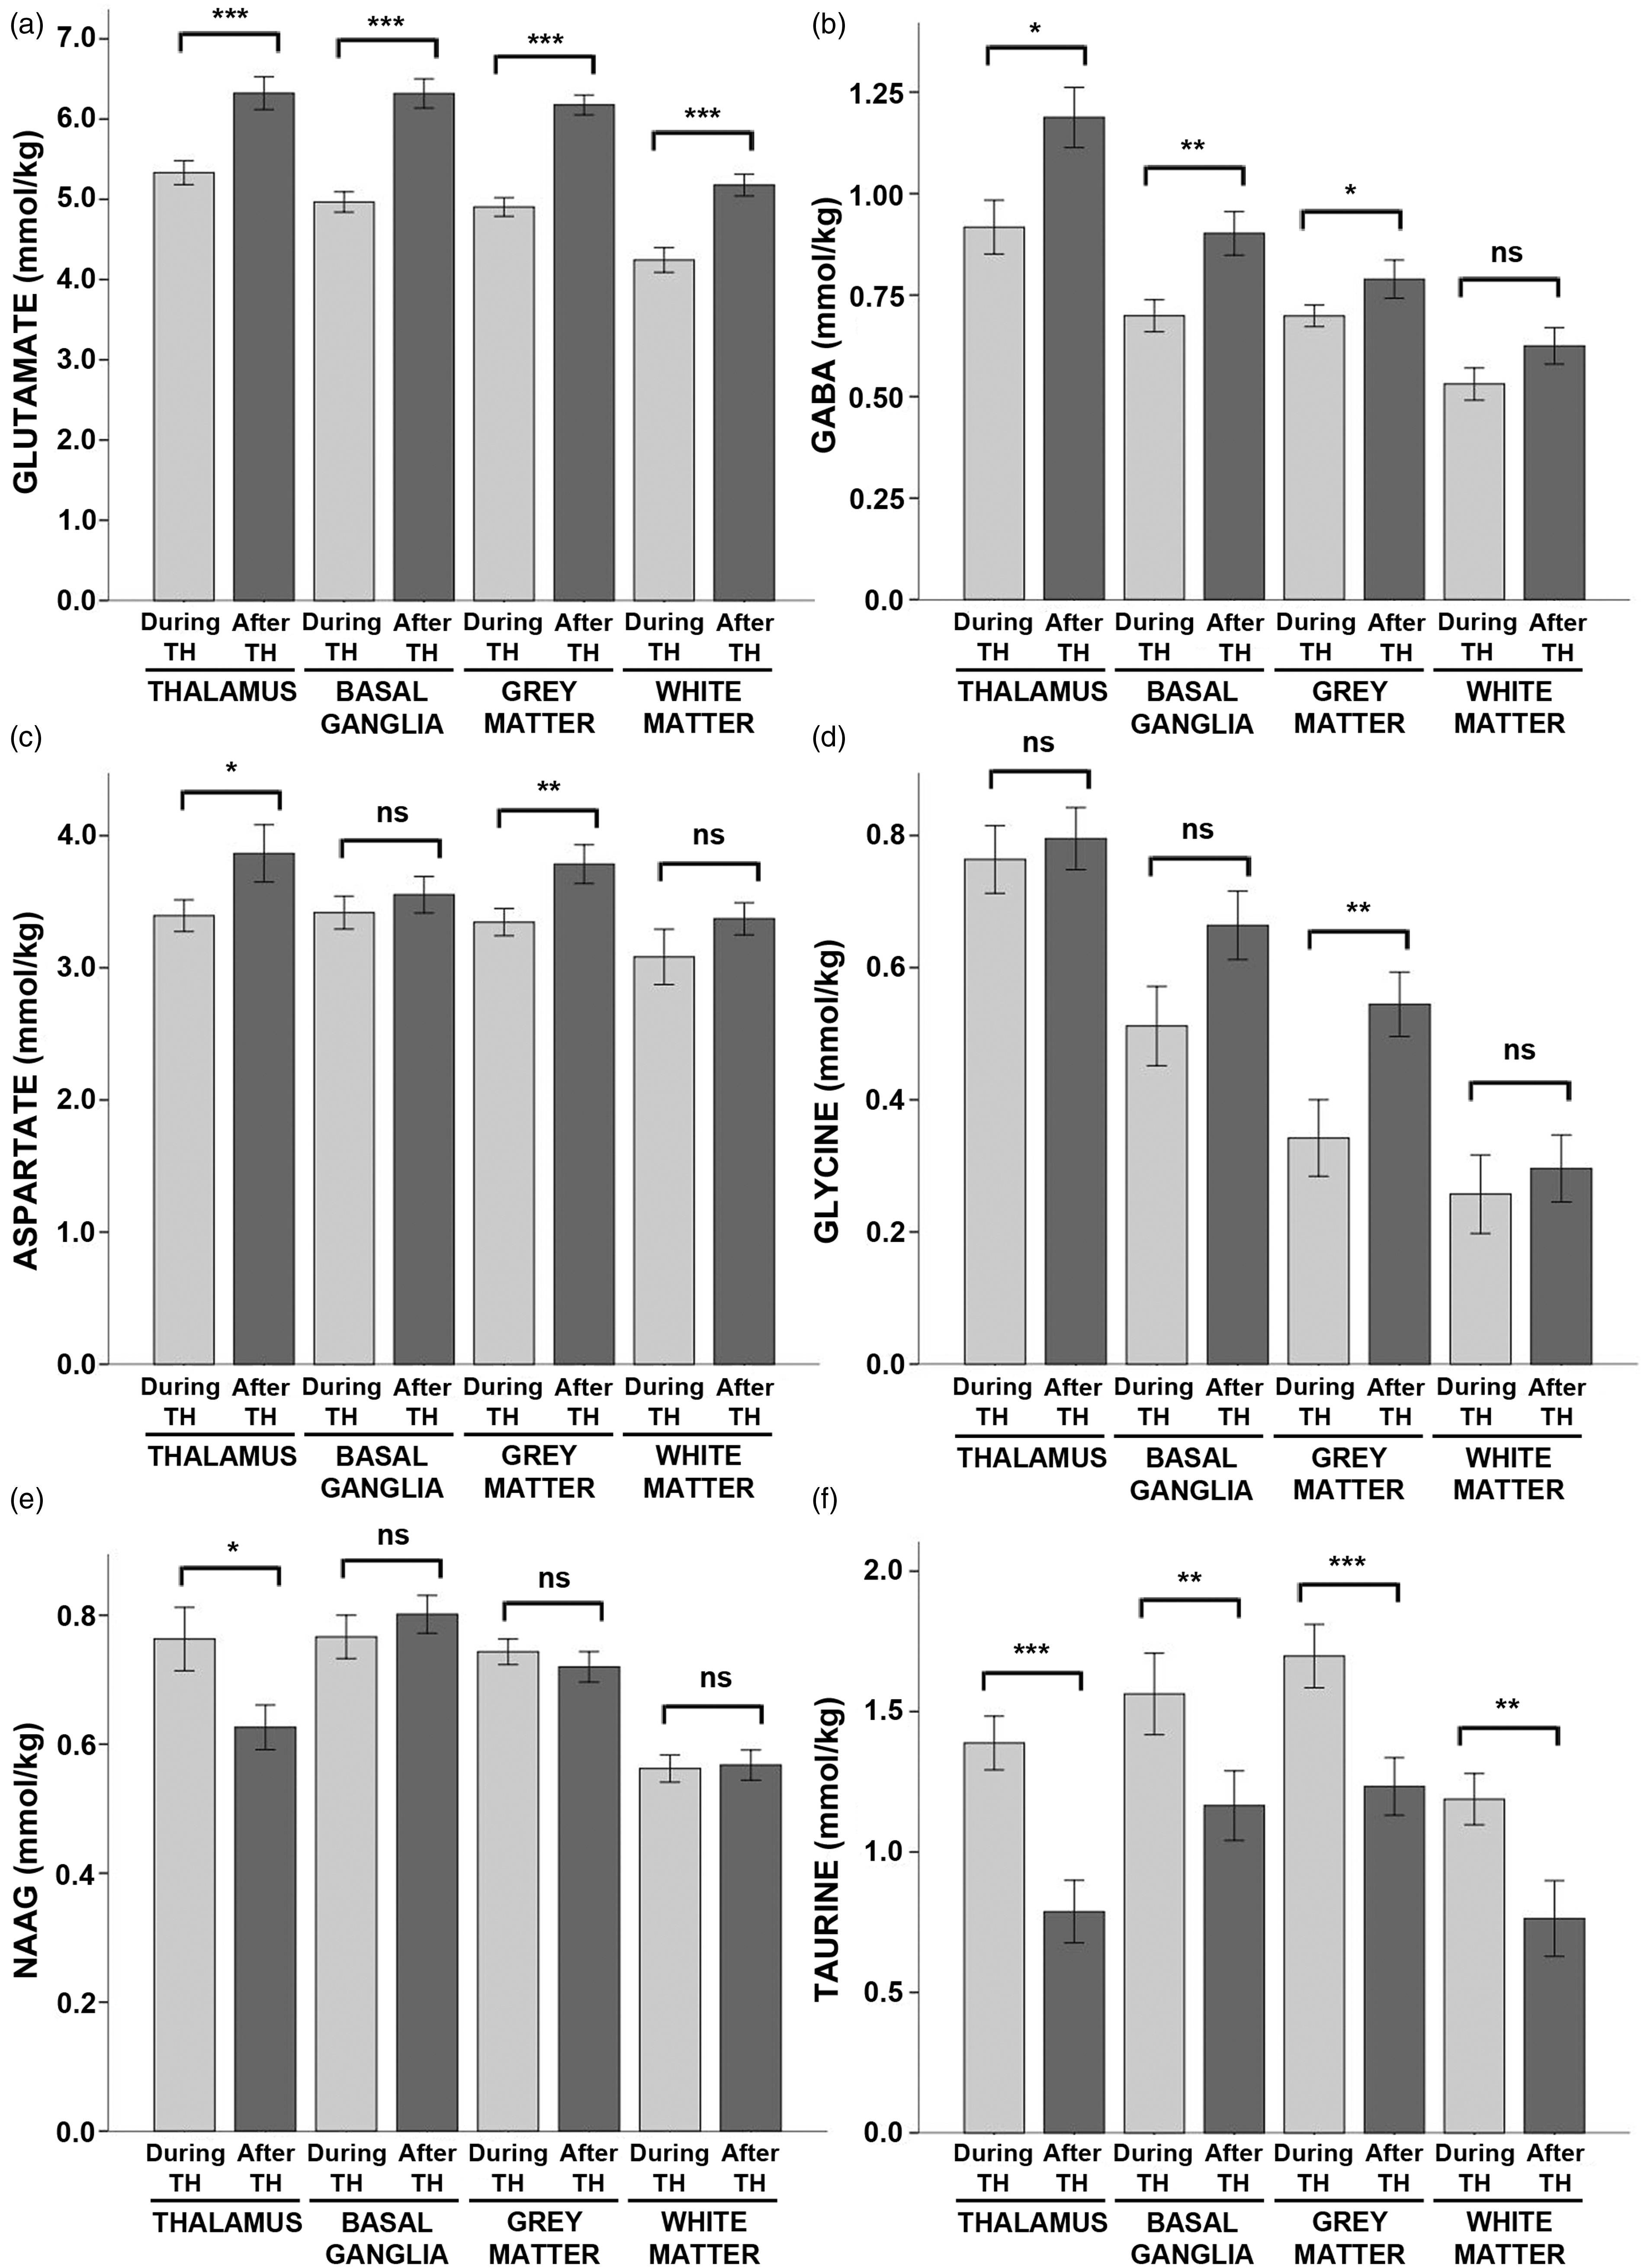
In contrast, taurine was markedly increased during hypothermia in all regions, ranging from ∼35% in the basal ganglia and grey matter to 57% in the white matter and 76% in the thalamus. NAAG was elevated by 22% in the thalamus during hypothermia.
Antioxidant concentrations were elevated during hypothermia
Glutathione concentrations were elevated by 7% during hypothermia in the thalamus and by 13% in the white matter (Figure 4). However, there were no significant effects of hypothermia on glutathione concentrations in the basal ganglia or cortical grey matter (Table S4).
Glutathione concentrations during hypothermia versus after rewarming. Mean concentrations of glutathione measured during hypothermia (light grey bars) and after rewarming (dark grey bars) are shown above, stratified by brain region. Error bars indicate ± standard error of the mean. ***p < 0.001; **p < 0.01; *p < 0.05; ns: non-significant; TH: therapeutic hypothermia.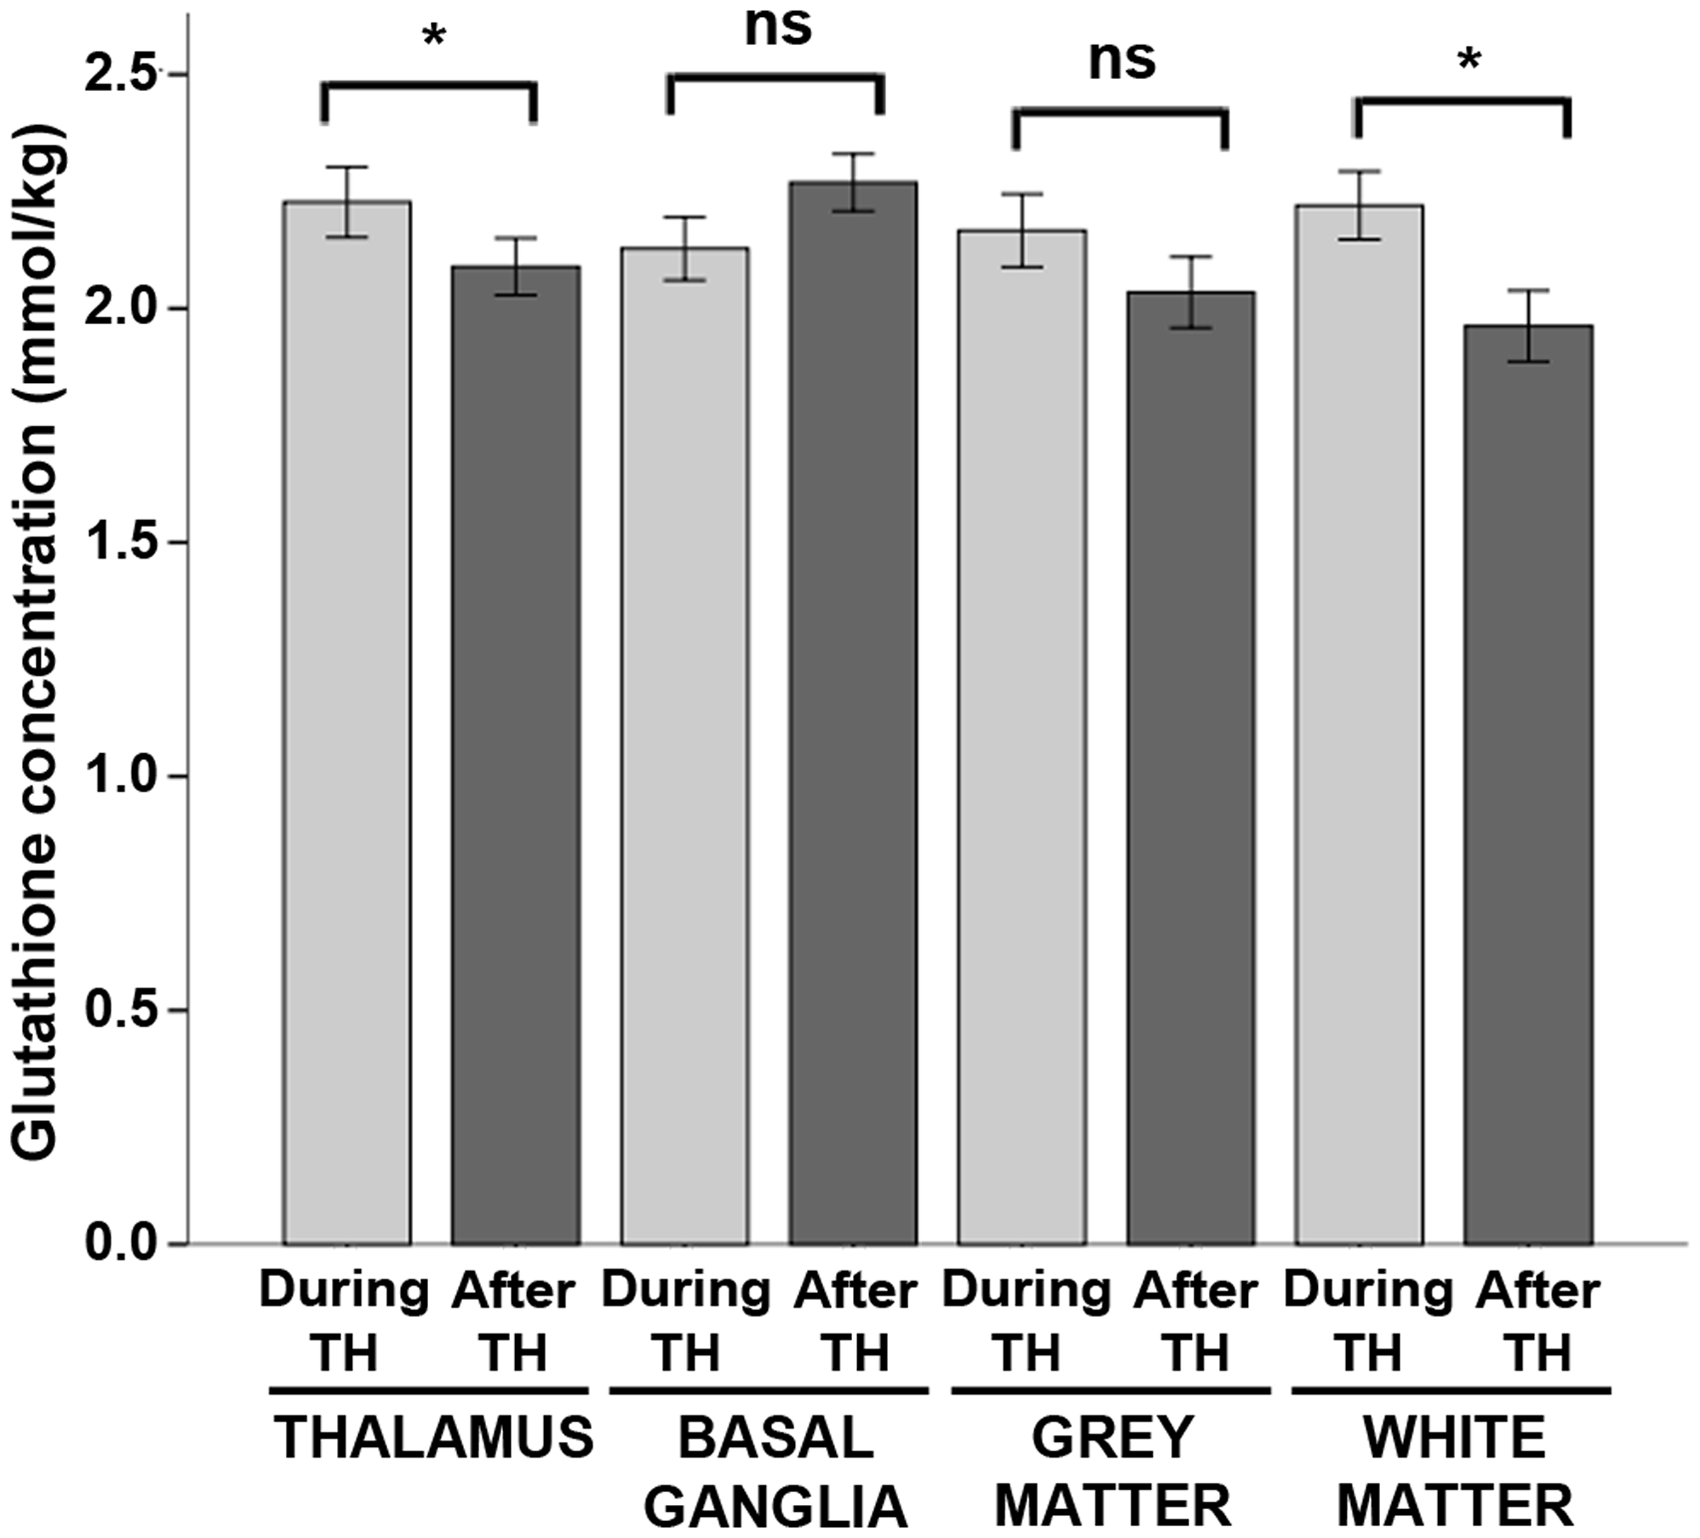
Discussion
The primary aim of this study was to characterize the effects of hypothermia on cerebral metabolism in human neonates with HIE. Using serial 1H-MRS, we contrasted the concentrations of key energy metabolites, neurotransmitters, and antioxidants during and after hypothermia. As summarized in Figure 5, we found that phosphocreatine concentrations were significantly higher during hypothermia as compared to after rewarming, while free creatine, NAA, and excitatory neurotransmitters, such as glutamate, were reduced.
The effect of hypothermia on cerebral metabolism in neonates with HIE. To illustrate the most prominent effects of hypothermia, we calculated a difference spectrum by first averaging all spectra acquired in the thalamus during hypothermia (blue) and after rewarming (red) and then subtracting the resultant spectra. The difference spectrum (black) clearly demonstrates that phosphocreatine concentrations were higher during hypothermia, while glutamate, creatine, and choline (a membrane metabolite not analyzed in the present study) were reduced. For reference, the prominent metabolites associated with each peak are labeled above. PCr: phosphocreatine; Cr: creatine; Glu: glutamate; Gln: glutamine; Glyc: glycine; Ins: myoinositol (not analyzed); Glc: glucose; Tau: taurine; Cho: choline (not analyzed); GSH: glutathione; GABA: γ-aminobutyric acid; Asp: aspartate; NAAG: n-acetyl-aspartyl-glutamate; NAA: n-acetyl-aspartate; Lac: lactate; Lipids: lipids; MM: macromolecules.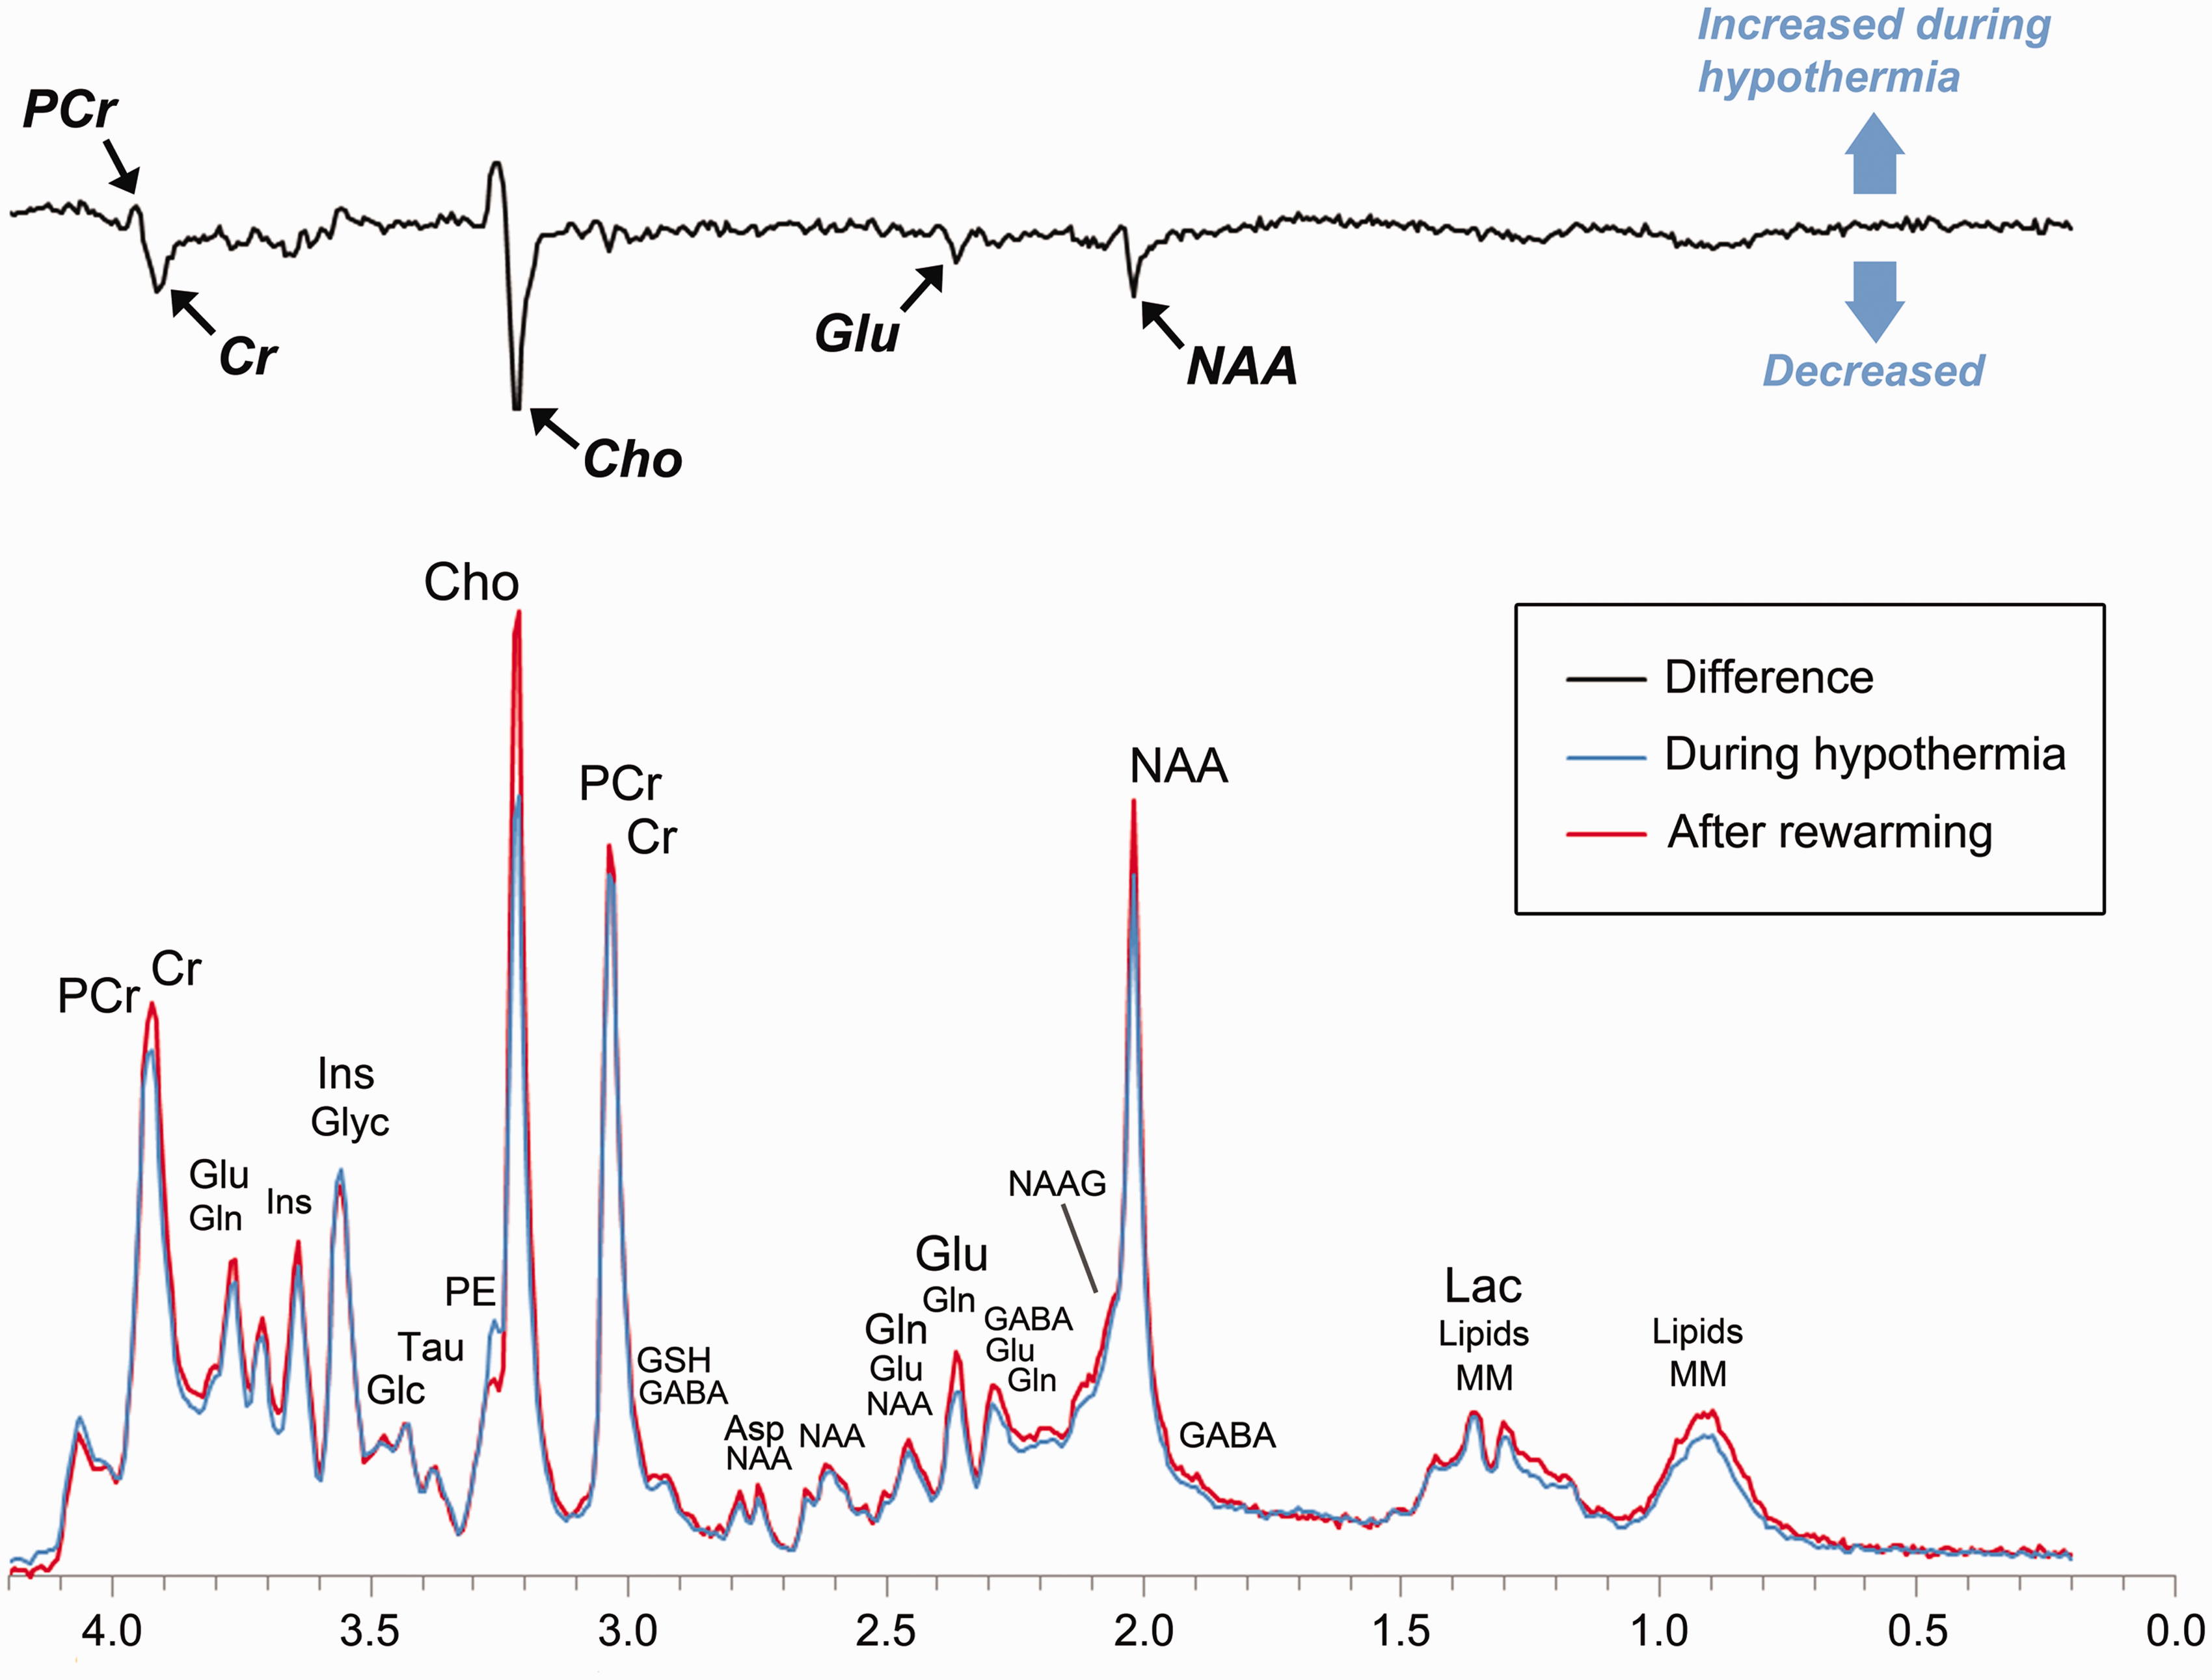
Phosphocreatine plays a key role in cellular energy homeostasis by supplying high energy phosphates for the synthesis of ATP from ADP, in essence, buffering large fluctuations in ATP synthesis and utilization. 28 Additionally, phosphocreatine, together with ATP, regulates energy metabolism by inhibiting the phosphorylation of fructose-6-phosphate during glycolysis. 49 In neonatal HIE, phosphocreatine concentrations fall during the period of secondary energy failure10,12–14 while anaerobic and aerobic glycolysis rise, stimulated by the energy deficit.12,13,50 Multiple studies have shown that hypothermia decreases the cerebral metabolic rate for glucose and oxygen.16,17,51,52 Still, it remains a paradox as to whether or how reducing energy metabolism (i.e. ATP production) engenders neuroprotection during the latent phase of HIE. 53
Here, we show for the first time that phosphocreatine concentrations were increased by ∼20% or more during hypothermia as compared to after rewarming in neonates with HIE. At the same time, lactate concentrations were typically lower—reaching statistical significance in the basal ganglia and white matter—while glucose concentrations were nominally lower in the thalamus during hypothermia. Most important, we observed significant reductions, ∼11–35%, in the concentrations of glutamate, glutamine, GABA, and aspartate during hypothermia. Glutamate and aspartate are synthesized directly from TCA cycle intermediates, and prior studies have established that their rate of synthesis is stoichiometrically coupled to the rate of energy metabolism. 29 Thus, in line with animal models,16,18,20 our data suggest that a key effect of hypothermia is not only a reduction in energy metabolism, but also a reduction in the synthesis of glutamate and other excitatory neurotransmitters.
Critically, a decrease in excitatory neurotransmitters is expected to not only exert a neuroprotective effect by mitigating excitotoxicity, but also inhibit seizure activity, or at least decrease the likelihood of seizures relative to after rewarming, which is consistent with clinical and laboratory observations.54–56 Perhaps most substantially, because neurotransmission consumes between one-third and one-half of the brain’s energy, 57 a reduction in excitatory neurotransmission should, in effect, reduce energy utilization. In short, our results suggest that hypothermic neuroprotection is achieved, at least in part, by realizing a specific balance between energy metabolism and neurotransmission.
Finally, in line with animal models, 58 we observed a marked increase, ∼35–75%, in taurine concentrations during hypothermia. Taurine is widely regarded as an inhibitory neurotransmitter 45 and an osmolite. 46 However, recent laboratory studies have shown that taurine can increase mitochondrial function in the setting of glutamate excitotoxicity and thereby act as an endogenous neuroprotective agent.59,60 Although our methods do not allow us to discern the specific effects of taurine, they do suggest that further research may be warranted to determine whether taurine facilitates neuroprotection in neonates with HIE.
Finally, we observed a modest effect of hypothermia on glutathione. At term equivalency, most antioxidants are underexpressed relative to their adult concentrations and do not respond to oxidative stress as robustly as in the adult brain. 61 However, elevations in glutathione peroxidase have been observed in the white matter at term-equivalency, 62 and we found a modest elevation in glutathione concentration in the white matter during hypothermia, as well as in the thalamus. Further research is needed to determine whether adjuvant therapies such as recombinant erythropoietin or melatonin, which are proposed to increase antioxidant mechanisms, 15 allow for a more robust effect on glutathione in neonates with HIE.
This study reports on cerebral metabolism during and after TH. In an earlier report, we demonstrated that there is variability in cerebral temperature across patients and brain regions during hypothermia and after rewarming. 22 It remains to be determined whether long-term neurodevelopmental outcomes can be enhanced by optimizing hypothermia protocols to achieve targeted brain temperatures in neonates with HIE. Furthermore, neurodevelopmental follow-up is ongoing in the present cohort. Accordingly, while our findings are in line with previous animal models, our interpretation of these results in relation to neuroprotection is limited at the present time.
In MRS, the visualized peaks typically represent overlapping signals arising from more than one cerebral metabolite with many metabolites contributing to more than one peak. In practice, reliable quantitation of individual metabolites is facilitated by the fact that no two metabolites generate identical resonances. Moreover, in high-quality datasets, small differences in chemical shift can be exploited, yielding reliable quantitation even in situations where metabolite resonances partial overlap (see Figures S1 and S2). To ensure reliability of our metabolite quantitation, we used stringent empirical standards for spectra quality (linewidth <0.05 ppm and signal to noise ≥10) and excluded spectra a priori that did not meet those standards. This approach, together with the inherent advantages of 3 T, which increases signal to noise by ∼50% over 1.5 T and doubles spectral resolution, allowed for the separate quantitation of key cerebral metabolites, including phosphocreatine and free creatine, in a clinical setting, and thus, demonstrates the feasibility of this technique for application in clinical trials.
Conclusions
In the last decade, clinical research has established the utility of MRS for predicting long-term disability in neonatal HIE.63–65 Building on this, we used modern MRS techniques to show a significant effect of TH on phosphocreatine concentrations, as well as glutamate, GABA, glycine, taurine, NAAG, lactate, free creatine, and NAA in neonates with HIE. These results, which are in line with animal models,16,18,20 support that hypothermia helps mitigate secondary energy failure by decreasing the availability of excitatory neurotransmitters (thereby suggesting a key mechanism for decreasing cellular energy demand). Given advances in MR technology, including the wide availability of 3 T MR systems and commercial software for metabolite quantitation, these results demonstrate the potential for using 1H-MRS, acquired during therapy, as an early biomarker to evaluate and contrast potential neuroprotective therapies in human clinical trials.
Footnotes
Funding
The author(s) disclosed receipt of the following financial support for the research, authorship, and/or publication of this article: the Gerber Foundation and the Rudi Schulte Research Institute. The funders had no role in study design, data collection and analysis, decision to publish, or preparation of the manuscript.
Acknowledgement
The authors would like to thank all of the families who took part in this research and our colleagues in the Newborn and Infant Critical Care Unit (NICCU) and the Department of Radiology at Children’s Hospital Los Angeles, including Robert Giesler, Lisa Villanueva, Daisy Zazueta Peña, Julia Castro, and all of the nurses, respiratory therapists and MR technologists whose efforts make this work possible.
Declaration of conflicting interests
The author(s) declared no potential conflicts of interest with respect to the research, authorship, and/or publication of this article.
Authors’ contributions
Conceived and designed experiments: JLW, T-WW, CM, PF, AP, SB; Performed the experiments: JLW, T-WW, AJR, CM, PF, DV, EH, MDN, SB; Analyzed the data: JLW, SB; Interpreted the data: JLW, T-WW, AP, SB; Contributed reagents/materials/analysis tools: SB; Wrote the manuscript: JLW; Provided edits to the manuscript: all authors.
References
Supplementary Material
Please find the following supplemental material available below.
For Open Access articles published under a Creative Commons License, all supplemental material carries the same license as the article it is associated with.
For non-Open Access articles published, all supplemental material carries a non-exclusive license, and permission requests for re-use of supplemental material or any part of supplemental material shall be sent directly to the copyright owner as specified in the copyright notice associated with the article.