
Abstract
Although lacunar infarction accounts for approximately 25% of ischemic strokes, collateral blood flow through anastomoses is not well evaluated in lacunar infarction. In 111 lacunar infarction patients, we analyzed diffusion-weighted images, perfusion-weighted images, and blood flow on dynamic four-dimensional angiograms generated by use of Signal Processing In NMR-Software. Blood flow was classified as absent (type 1), from periphery to center (type 2), from center to periphery (type 3), and combination of type 2 and 3 (type 4). On diffusion-weighted images, lacunar infarction was found in the basal ganglia (11.7%), internal capsule (24.3%), corona radiata (30.6%), thalamus (24.3%), and brainstem (9.0%). In 58 (52.2%) patients, perfusion-weighted image showed a circumscribed hypoperfusion, in one (0.9%) a circumscribed hyperperfusion, whereas the remainder was normal. In 36 (62.1%) patients, a larger perfusion deficit (>7 mm) was observed. In these, blood flow was classified type 1 in four (11.1%), 2 in 17 (47.2%), 3 in 9 (25.0%), and 4 in six (16.7%) patients. Patients with lacunar infarction in the posterior circulation more often demonstrated blood flow type 2 and less often type 3 (p = 0.01). Detailed examination and graduation of blood flow in lacunar infarction by use of dynamic four-dimensional angiograms is feasible and may serve for a better characterization of this stroke subtype.
Introduction
Lacunar infarction (LI) accounts for up to 25% of acute ischemic strokes 1 and is defined as a small subcortical ischemic lesion located in the basal ganglia, thalamus, internal capsule, corona radiata, or brainstem caused by occlusion of a single perforating artery usually due to lipohyalinosis or microatheroma.2,3 The maximal diameter is classically defined as <15 mm. However, there is a large variety of lacunar lesion size definitions 4 and more recently, a lesion size <20 mm has been introduced in clinical studies. 5 The clinical presentation usually comprises five typical so-called lacunar syndromes although about 20 different lacunar syndromes have been reported. 3
In patients with acute ischemic stroke, slow collateral blood flow through anastomoses is regarded as an essential condition enabling the survival of potentially salvageable brain tissue but little is known about collateral blood flow between the small perforating arteries of the brain. The existence of anastomoses between the perforating arteries has been examined in meticulous pathoanatomical studies.6–15 Even a higher frequency of anastomoses between the perforating arteries in the posterior circulation has been reported. 12 Comparable conventional angiography, 16 CT, 17 or MRI studies 18 are sparse and limited to the demonstration of larger perforating branches because of the relatively low resolution. While conventional angiography is the gold standard to characterize the extent of collateral blood flow in large vessel occlusion, 19 its ability to demonstrate corresponding changes in acute LI is very limited due to the small diameter of the perforating arteries and their branches. Furthermore, conventional angiography is usually reserved for patients with large vessel occlusion undergoing endovascular treatment. In the last decade, a large variety of CT and MRI-based approaches for the assessment of collateral blood flow has been investigated. 20 Among these, dynamic 4D angiograms derived from dynamic susceptibility contrast (DSC) perfusion raw images have been introduced recently. 21 Meanwhile, they have been used not only in middle cerebral artery occlusion but also in posterior cerebral artery and basilar artery occlusion. 22 Another study demonstrated a good correlation between collateralization grades based on dynamic 4D angiograms in comparison to conventional angiography findings in middle cerebral artery occlusion. 23
In this case series of patients with acute LI admitted to our hospital, we aimed to investigate (1) the frequency and further characteristics of a perfusion deficit in LI, and (2) the ability of dynamic 4D angiograms generated from perfusion-weighted raw images to demonstrate collateral blood flow in LI, (3) to classify patterns of collateral blood flow in LI, (4) to correlate the observed patterns of collateral blood flow with established perfusion maps such as cerebral blood flow (CBF), and cerebral blood volume (CBV), and (5) to compare patterns of collateral blood flow in LI in the anterior and posterior circulation.
Material and methods
Patients
From a prospectively maintained MRI report database (January 2005 to February 2015), we identified 140 patients with acute subcortical infarction who underwent a standard stroke MRI protocol including perfusion-weighted image (PWI) within 24 h after onset of symptoms. In 117 (83.6%) ischemic stroke patients, no other potential etiology of ischemic stroke than LI could be detected. The remaining patients were excluded from the analysis because of large artery atherosclerosis or cardioembolism coexisting as other possible cause of ischemic stroke. Further 6/117 (5.1%) patients were excluded from the analysis due to intravenous thrombolysis before MRI. The demographic details and clinical presentation were abstracted from the case records. Standardized clinical workup included assessment of cardiovascular risk factors, extra- and transcranial Doppler-/duplex sonography, 24 h electrocardiogram monitoring, and transthoracic or transesophageal echocardiography as well as laboratory tests according to stroke unit standard requirements in Germany. 24 The study was approved by the local institutional review board (Medizinische Ethikkommission II der Medizinischen Fakultät Mannheim). Patient consent was not required due to the retrospective nature of the study and the lack of patient interaction.
MRI studies
Sequence parameters of DWI and PWI at the department’s MRI scanners.
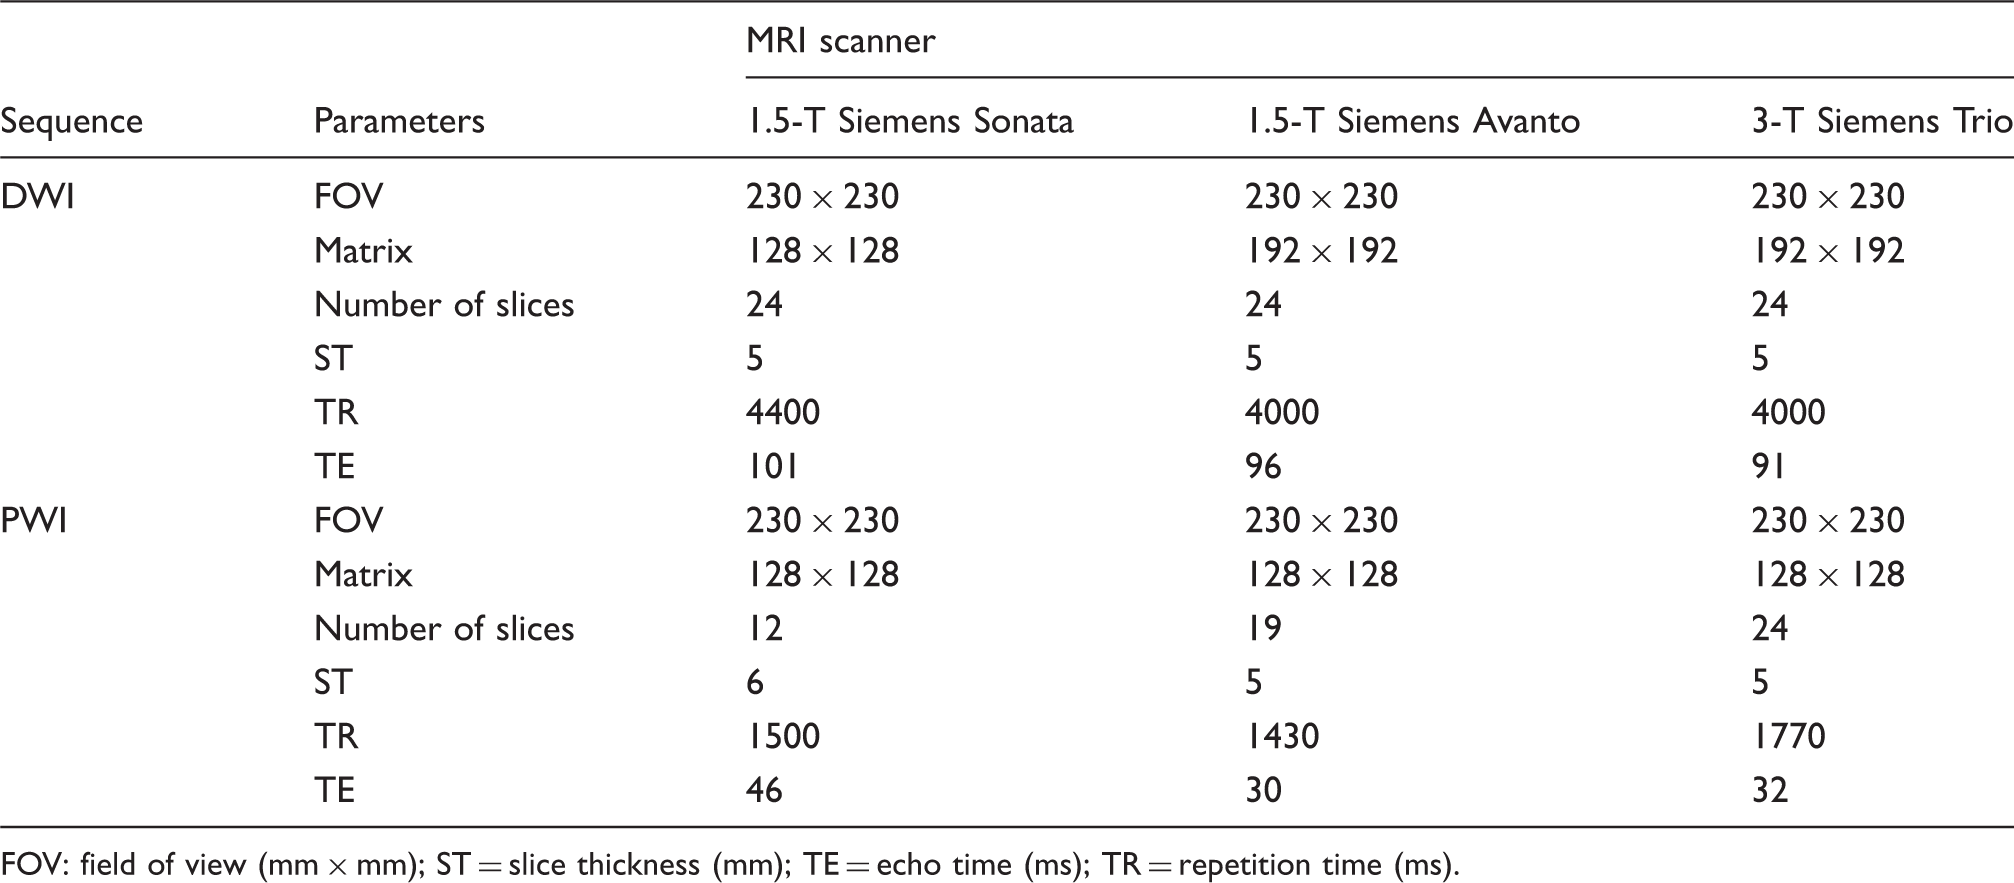
FOV: field of view (mm × mm); ST = slice thickness (mm); TE = echo time (ms); TR = repetition time (ms).
Postprocessing
Perfusion maps
The postprocessing of the perfusion-weighted raw images was performed by a specific software, Signal Processing In NMR (SPIN, The MRI Institute for Biomedical Research, Detroit, USA). 25 Deconvolution with singular value decomposition was used to create quantitative maps of mean transit time (MTT), CBF, and CBV. The position of the arterial input function was automatically determined by using the maximum concentration (Cmax), relative time to peak (TTP), and first moment MTT (fMTT). The concentration–time curve for arteries has short fMTT, short TTP, and high Cmax. Twenty voxels, which best fitted these properties, were selected. Then the concentration–time curves of these voxels were averaged, smoothed, and truncated to avoid the second pass of the tracer.
Dynamic 4D angiograms
Furthermore, perfusion-weighted raw images were used to create a dynamic angiographic representation of blood flow as described recently. 21 For this purpose, the baseline prebolus image was subtracted from each frame of the raw perfusion data as in digital subtraction angiography by use of the subtract series function in SPIN.
MRI analysis
FLAIR images and dynamic 4D angiograms were analyzed by two independent raters (AF and BM, both with eight years of experience in neuroimaging) blinded to the other MRI sequences and clinical information. Cases with discrepancies were re-reviewed by both readers and discussed until a consensus was reached.
Infarction localization and size
Acute ischemic lesions in the basal ganglia, thalamus, internal capsule, corona radiata, or brainstem were classified as LI attributable to single perforating artery occlusion if the maximal diameter was 20 mm on DWI. Maximal ischemic lesion diameter on DWI as well as maximal diameter of the perfusion deficit on PWI was measured by use of OsiriX, a multidimensional image navigation and display software. 26 Furthermore, the area of the DWI lesion on the slice corresponding to the PWI slice used for generation of dynamic 4D angiograms was measured.
Perfusion maps
First PWI was analyzed visually in order to obtain information on hemodynamic alterations, calculated TTP images demonstrating the delay of the contrast agent arrival in the brain parenchyma were used for visual analysis. Time-to-peak maps were classified as showing a normal perfusion pattern or areas of hyper- or hypoperfusion. Furthermore, the perfusion maps were also quantitatively assessed by use of SPIN: a region of interest (ROI) covering the hypoperfused area was placed on the generated maps (TTP, MTT, CBF, CBV) and mirrored to the contralateral unaffected hemisphere. Finally, ratios between the physiological estimates (TTP, MTT, CBF, CBV) of the lesion and of the contralateral mirror ROI were determined. Due to the limited spatial resolution, the analysis of perfusion maps was limited to perfusion lesions with a diameter >7 mm. Furthermore, the area of the PWI lesion on the slice used for generation of dynamic 4D angiograms was measured.
Dynamic 4D angiograms
The presence of blood flow on dynamic 4D angiograms was assessed using a newly implemented blood flow classification for LI: type 1 (no blood flow visible), type 2 (blood flow from the periphery to the center), type 3 (blood flow from the center to the periphery), and type 4 (combination of type 2 and type 3). For a detailed graphic illustration, see Figure 1. Due to the limited spatial resolution, the analysis of dynamic 4D angiograms was limited to perfusion lesions with a diameter >7 mm.
Schematic illustration of collateral blood flow pathways and corresponding collateral blood flow types on dynamic 4D angiography in lacunar infarction due to small perforating artery occlusion: (1) Anterograde collateral blood flow via an anastomosis between the main stems of two perforating arteries. (2) Retrograde collateral blood flow via small anastomoses at the precapillary level. Type 1: no blood flow visible. Type 2: blood flow from the periphery to the center. Type 3: blood flow from the center to the periphery. Type 4: combination of type 2 and type 3.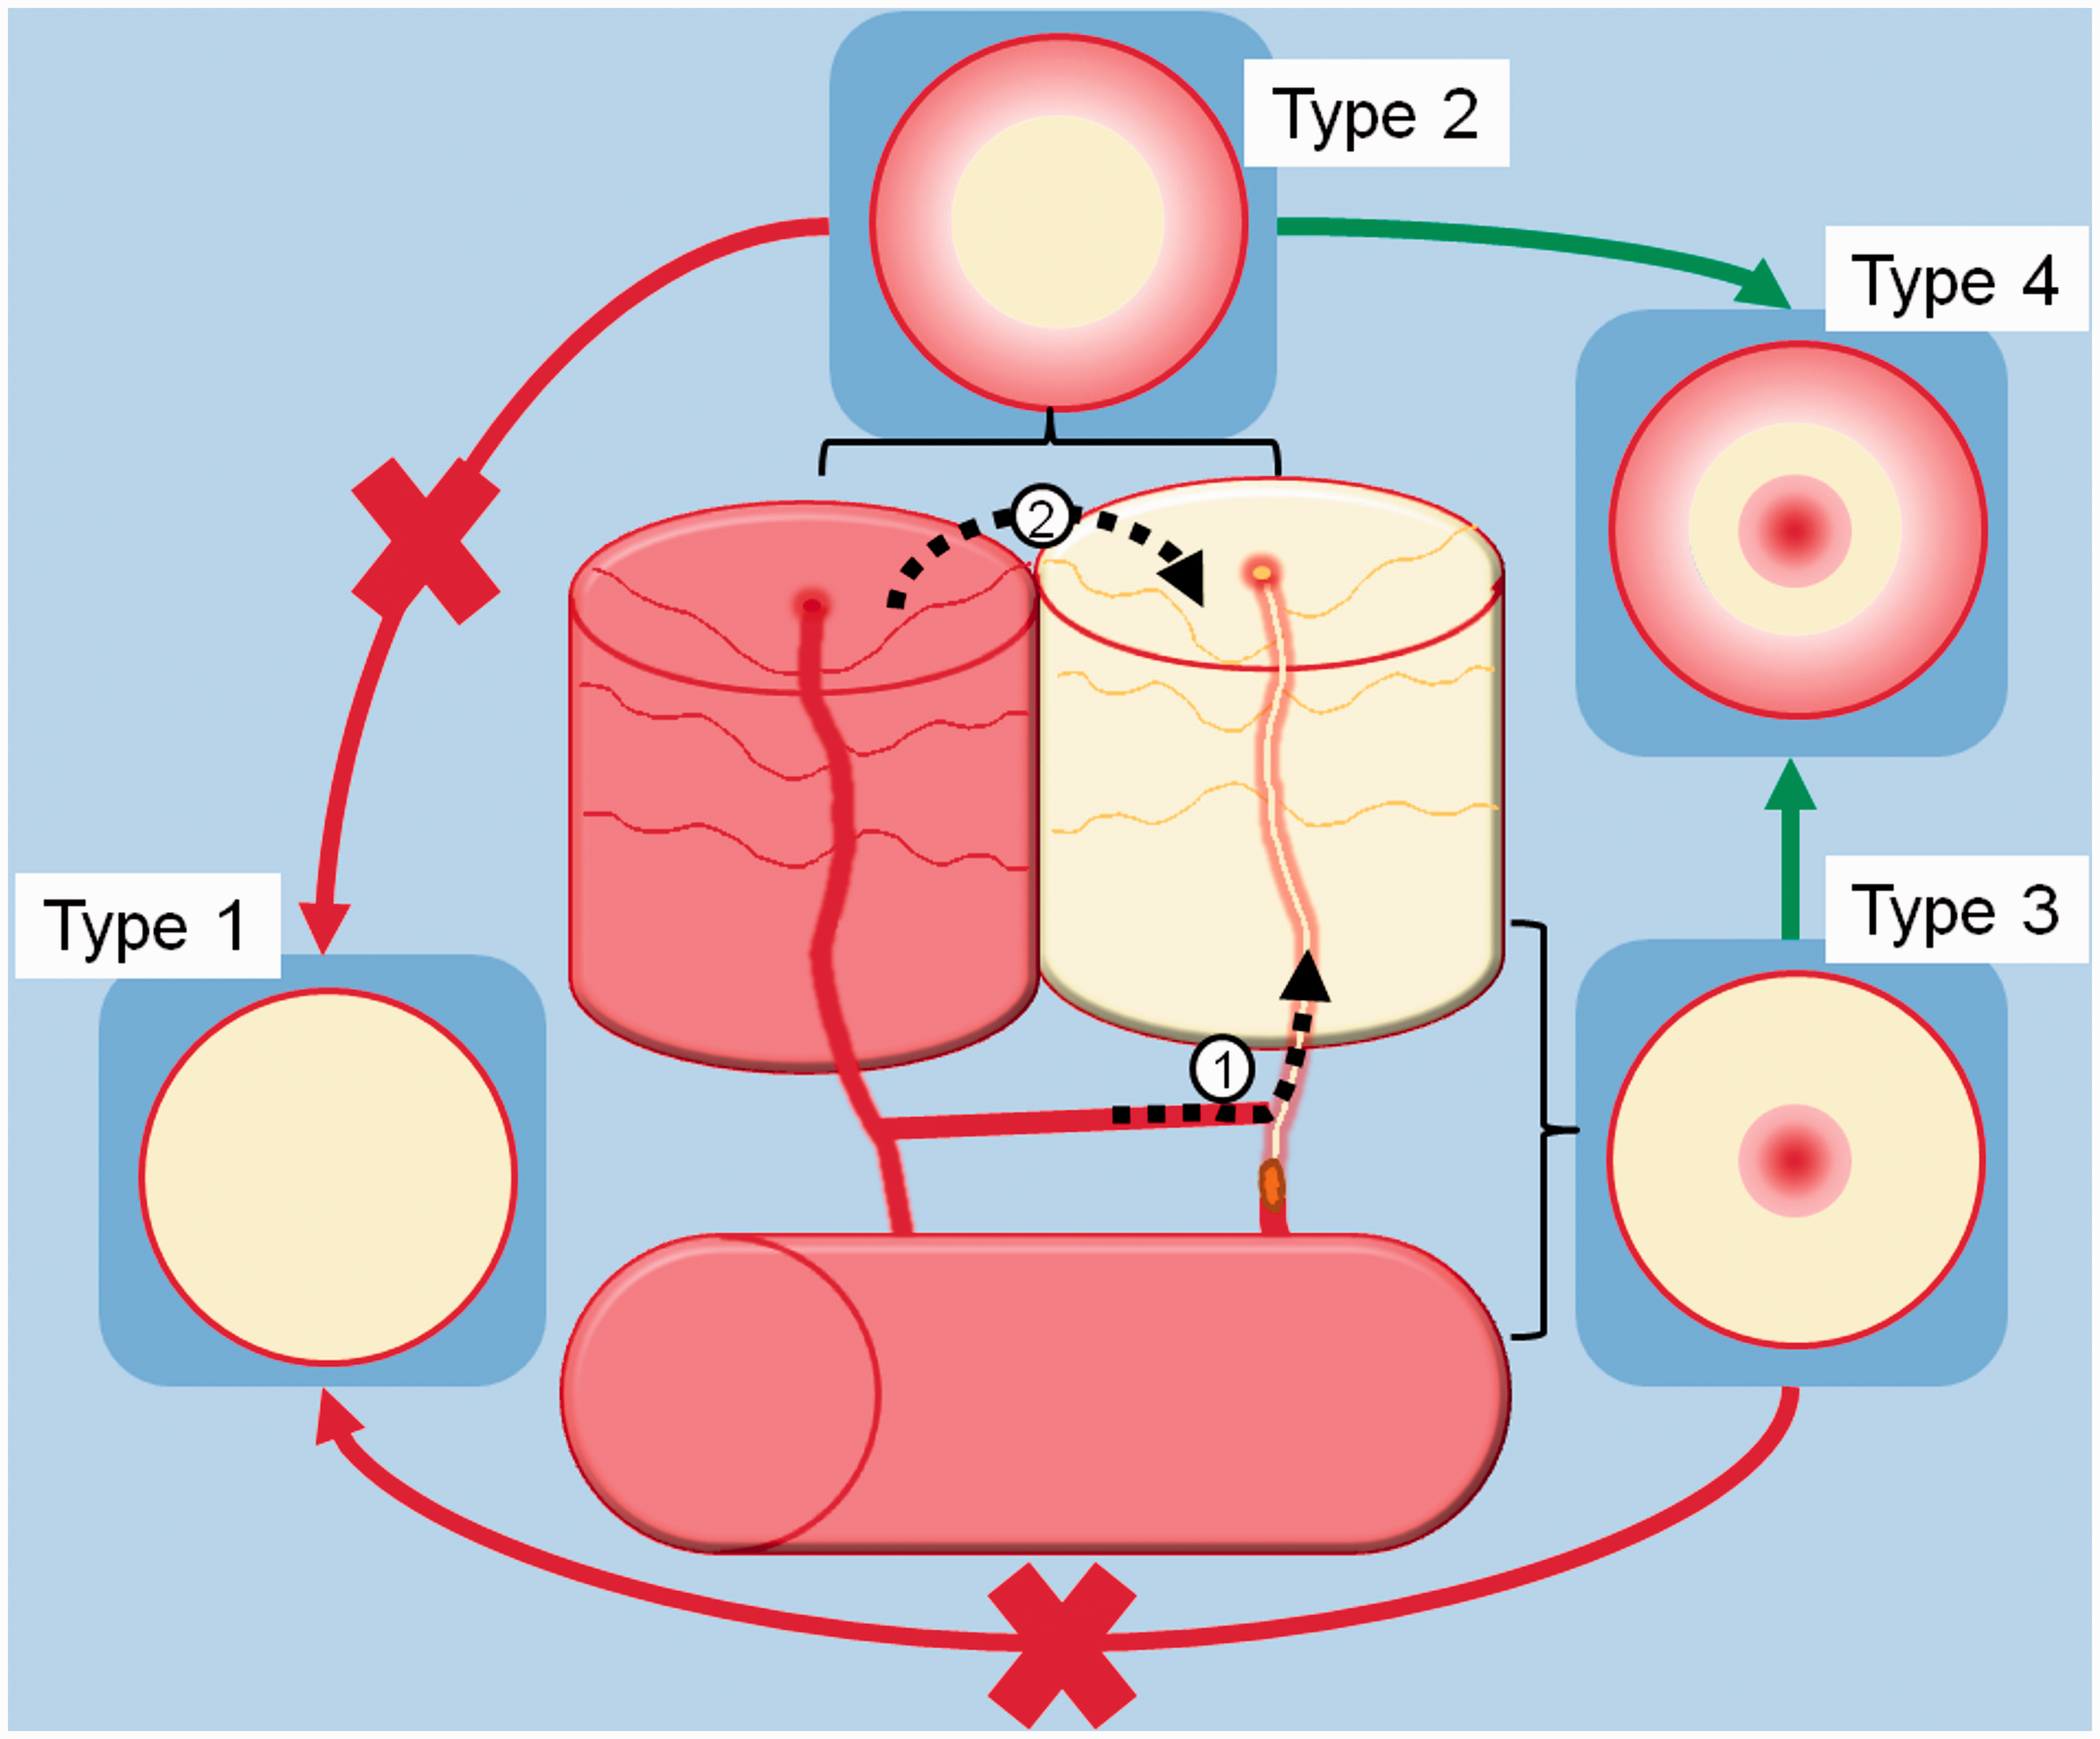
Statistical analysis
All statistical analyses were performed using Statistical Product and Service Solutions (SPSS) statistics for Windows (Release 17.0; SPSS, Chicago, IL, USA). Descriptive data were analyzed by use of Chi-square tests and the Mann–Whitney U Test as appropriate. Comparison between patients with LI in the anterior and posterior circulation was performed using Chi-square tests and the Mann–Whitney U Test as appropriate. Comparison of lesion size on DWI and PWI was performed using the Mann–Whitney U Test or the Wilcoxon Test as appropriate. Interrater reliability for the blood flow pattern in LI prior to consensus was assessed using the Cohen kappa coefficient (κ). Differences in TTP, MTT, CBF, and CBV ratios between the different blood flow types were analyzed by use of the Kruskal–Wallis test. All statistics was performed with a 0.05 level of significance.
Results
Baseline characteristics and clinical presentation
Demographics, clinical symptoms, and MRI findings in patients with LI in the anterior (AC) and posterior circulation (PC).
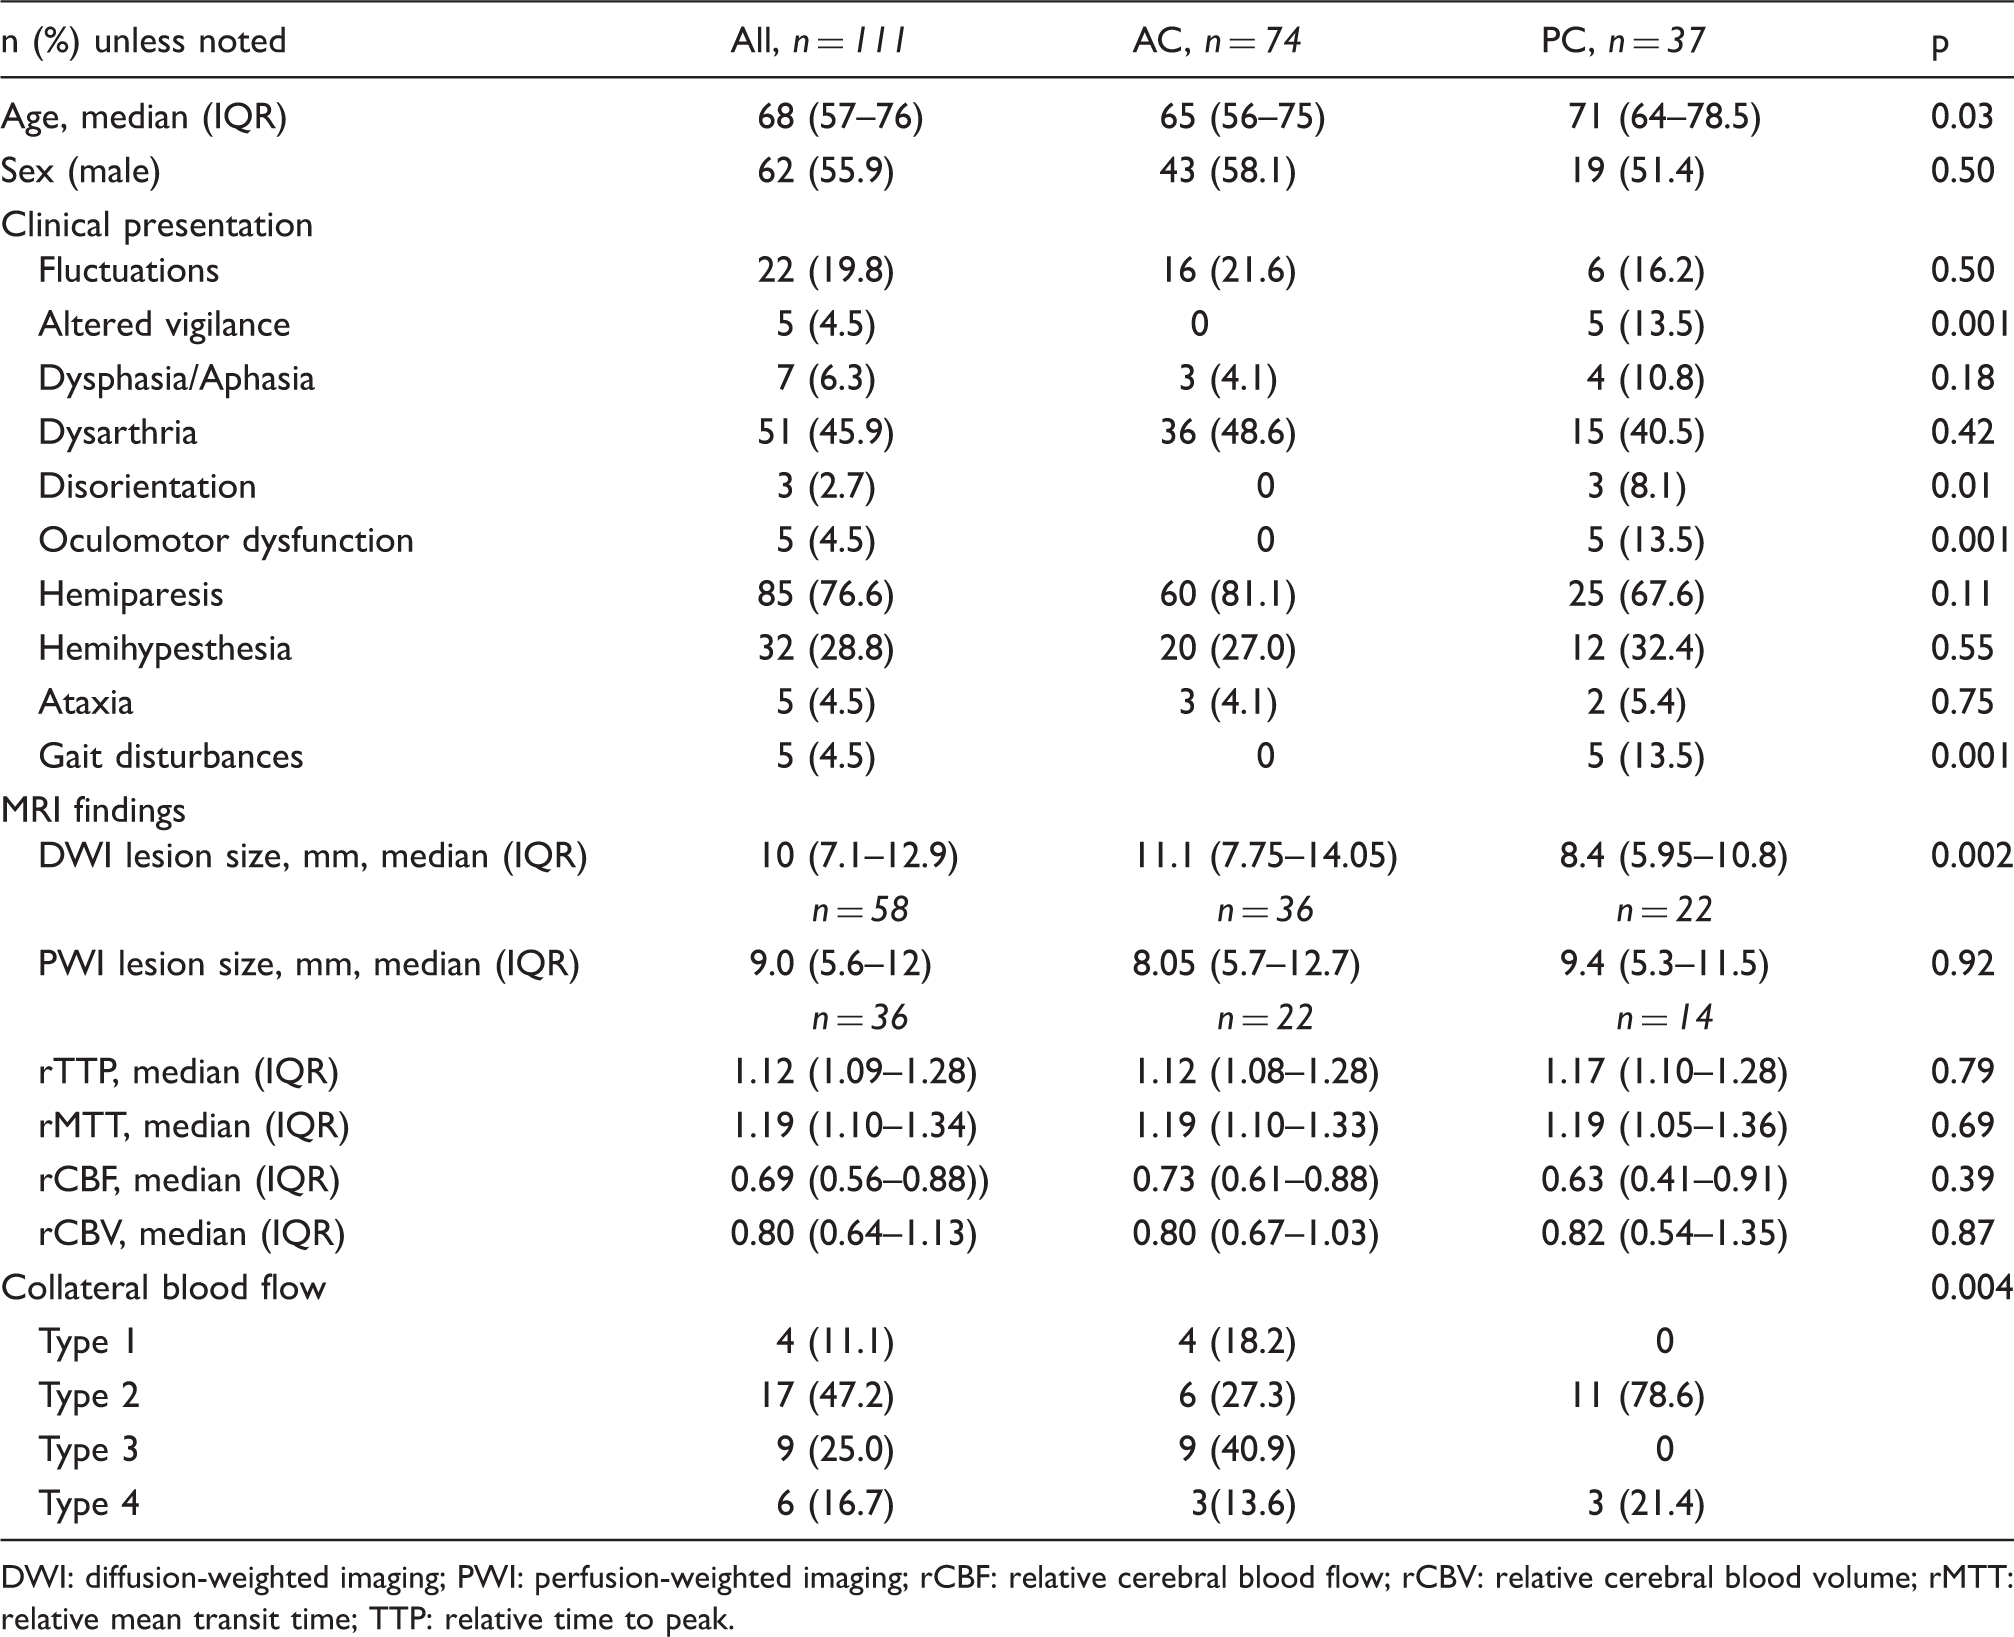
DWI: diffusion-weighted imaging; PWI: perfusion-weighted imaging; rCBF: relative cerebral blood flow; rCBV: relative cerebral blood volume; rMTT: relative mean transit time; TTP: relative time to peak.
MRI analysis
Diffusion-weighted imaging
Diffusion-weighted imaging demonstrated an acute ischemic infarction in the basal ganglia in 13 (11.7%), internal capsule in 27 (24.3%), corona radiata in 34 (30.6%), thalamus in 27 (24.3%), and brainstem in 10 (9.0%) patients. Figure 2 shows exemplary cases for each location. Ischemic lesions were attributed to the anterior circulation in 74 (66.7%) patients and to the posterior circulation in 37 (33.3%) patients. The right side was affected in 51 (45.9%) patients, the left side in 57 (51.4%) patients while in three (2.7%) patients bilateral thalamic infarctions in the territory of the paramedian arteries were found. On initial DWI, the ischemic lesions had a median diameter of 10 (IQR 7.1–12.9) mm. In comparison, patients with LI in the anterior circulation demonstrated significantly larger ischemic lesions on DWI (median diameter of 11.1 (IQR 7.75–14.05) mm) than patients with LI in the posterior circulation (median diameter of 8.4 (IQR 5.95–10.8) mm, p = 0.002).
Examples of acute lacunar infarction (LI) in typical locations on DWI and associated perfusion alterations. (a) Acute LI in the right basal ganglia (putamen) on DWI and corresponding area of hypoperfusion on PWI. (b) Acute LI in the right internal capsule on DWI and corresponding area of hypoperfusion on PWI (arrow). (c) Acute LI in the right corona radiata on DWI and corresponding area of hypoperfusion on PWI (arrow). (d) Acute LI in the right thalamus on DWI. Perfusion-weighted imaging shows a corresponding area of hyperperfusion (arrow). (e) Acute LI in the right pons and corresponding area of hypoperfusion on PWI (arrow).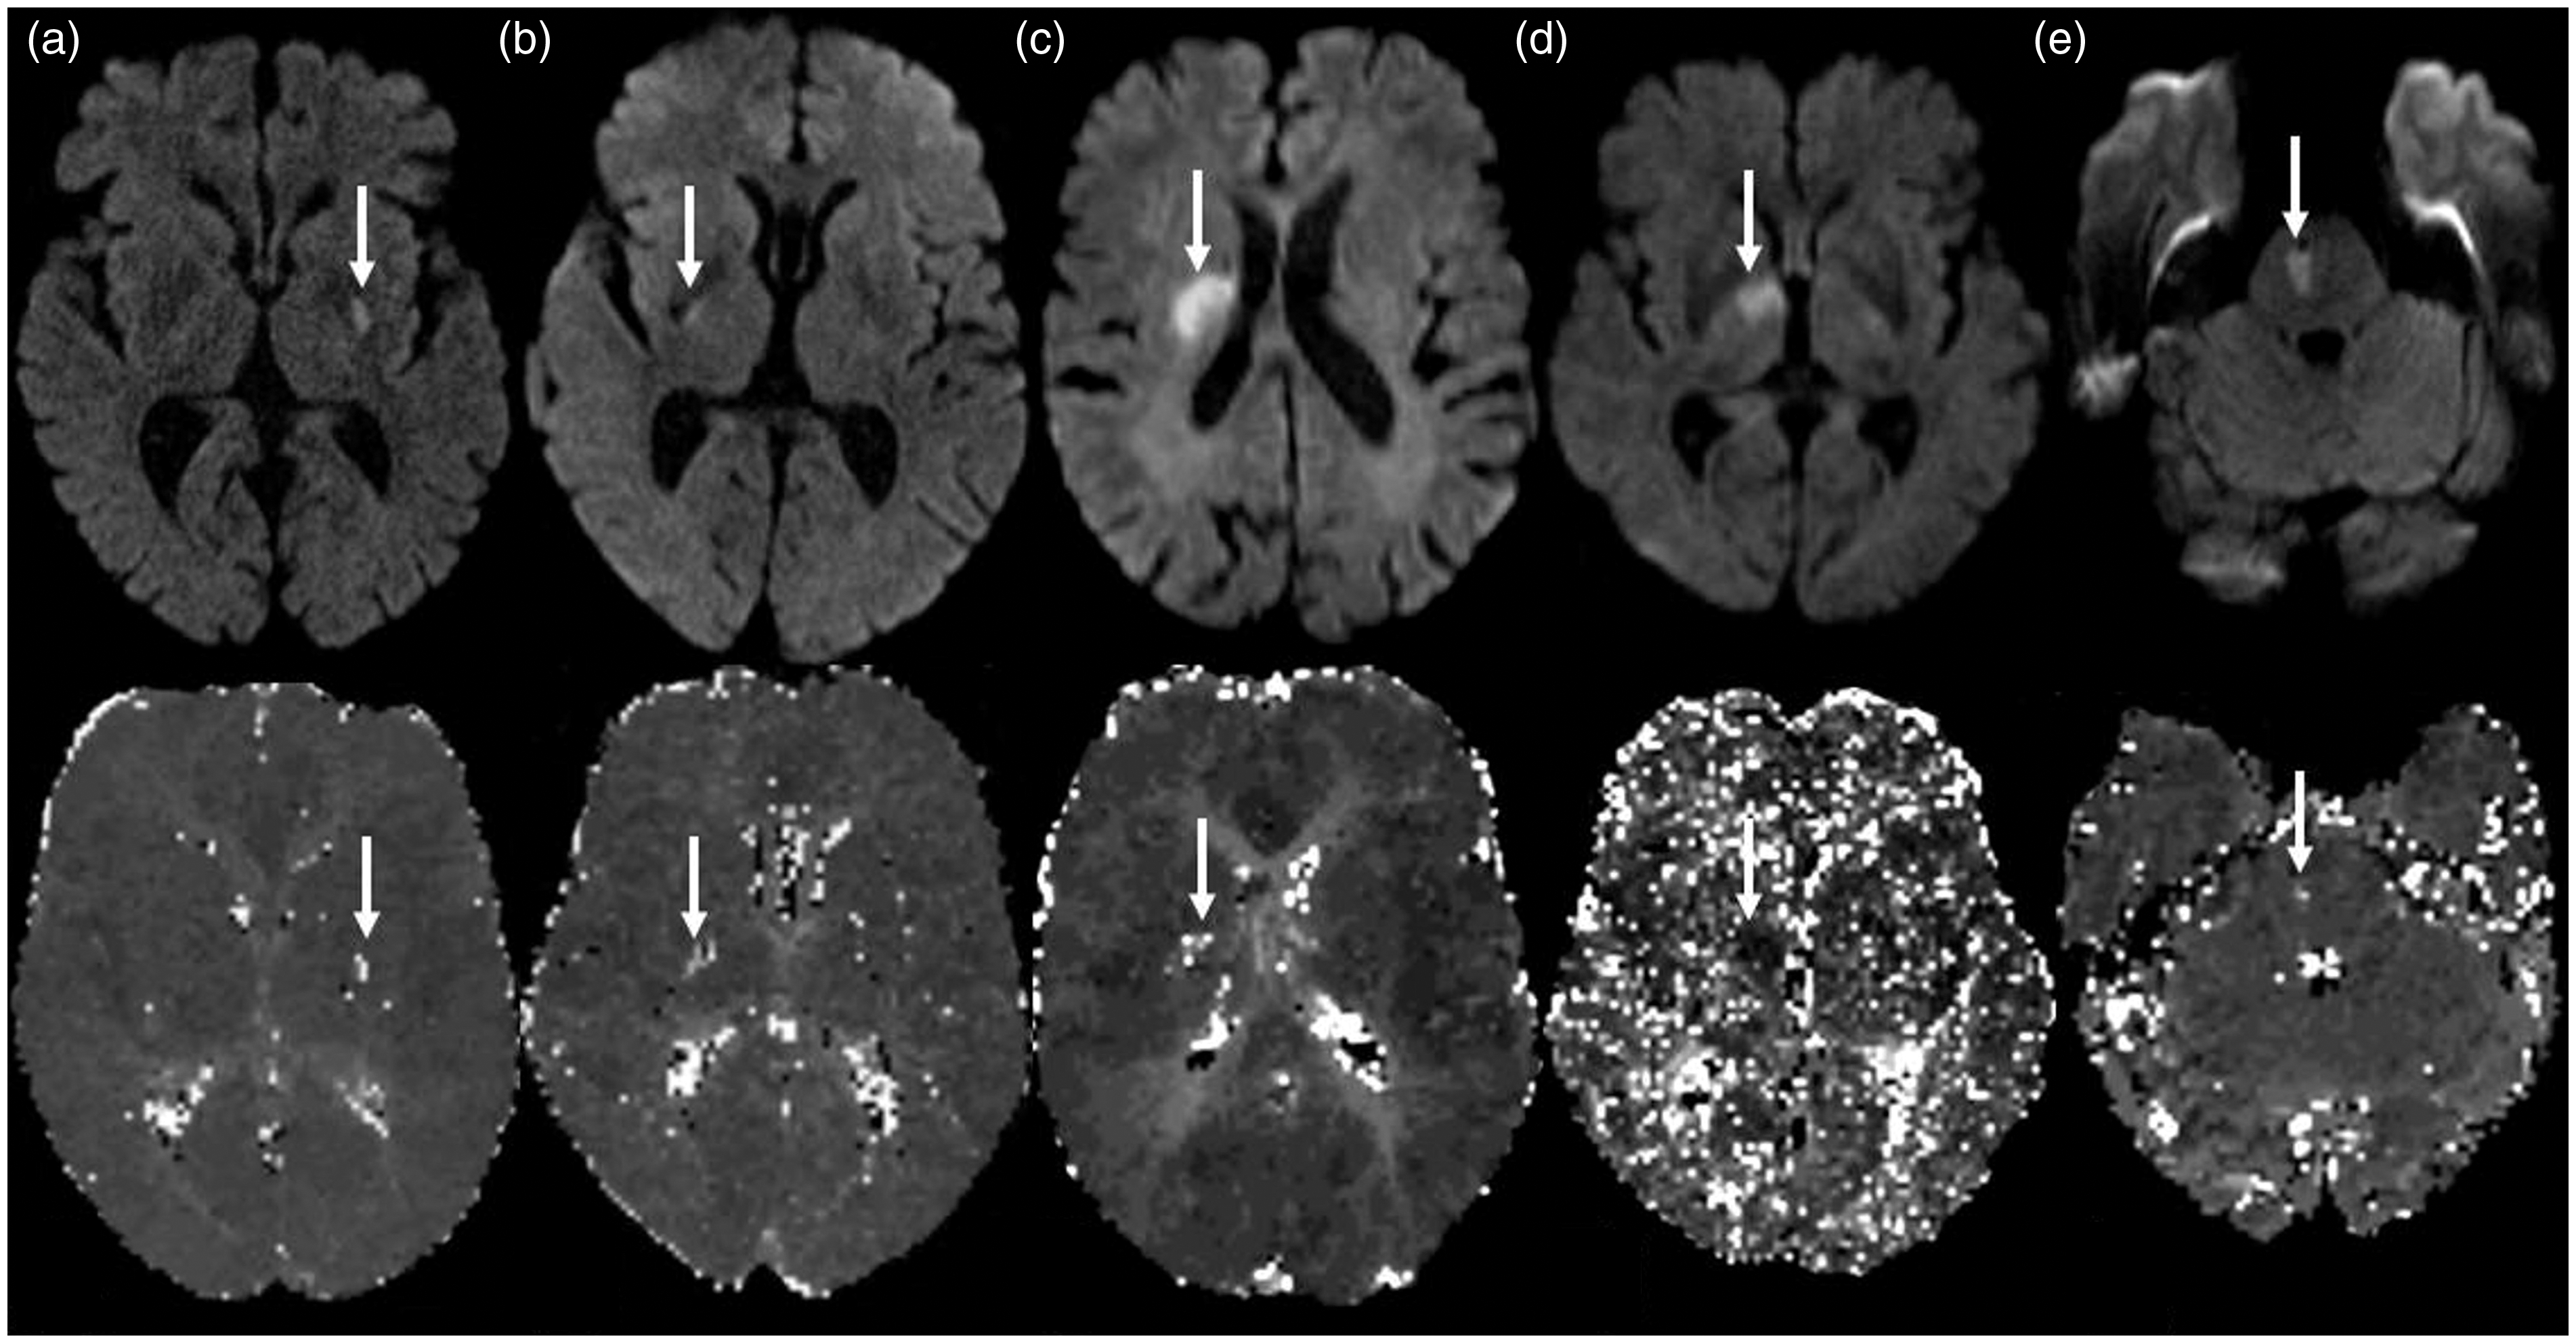
Perfusion weighted imaging
Perfusion weighted imaging showed a circumscribed hypoperfusion in 58 (52.2 %) patients, a corresponding area of hyperperfusion in one (0.9%) patient whereas the remaining perfusion studies were normal. Figure 2 shows exemplary cases for each perfusion pattern. Median time between onset and MRI did not differ between patients with or without a circumscribed hypoperfusion on PWI (304 (IQR 208.5–488) min versus 337.5 (IQR 263.8–594.25) min, p = 0.44). The areas of circumscribed hypoperfusion had a median diameter of 9.0 (IQR 5.6–12) mm. In 40/58 (69.0%) patients the ischemic lesion on DWI was larger than the corresponding perfusion deficit on PWI, while in the remainder the perfusion deficit on PWI was larger than the ischemic lesion on DWI. Median time between onset and MRI did not differ between both groups (300 min (IQR 207.75–430.25) versus 360.5 (IQR 198.75–553.75) min, p = 0.59).
Overall, the ischemic lesion of DWI was significantly larger than the corresponding perfusion deficit on PWI (p = 0.001). In 22 (37.9%) the area of hypoperfusion was smaller, and in 36 (62.1%) larger than 7 mm in diameter. The frequency of an area of hypoperfusion on PWI did not differ significantly between LI in the anterior (36/74 (48.6%)) and posterior circulation (23/37 (62.2%), p = 0.18). However, frequency of a perfusion deficit differed markedly between infarction localizations: basal ganglia in 10/13 (76.9%), internal capsule in 15/27 (55.6%), thalamus in 20/27 (74.1%), corona radiata in 11/34 (32.4%), and brainstem in 3/10 (30.0%) patients (p = 0.003). With regard to the median diameter of the perfusion deficit on PWI, no significant differences were observed between patients with LI in the anterior (8.05 (IQR 5.7–12.7) mm) and posterior circulation (9.4 (IQR 5.3–11.5) mm, p = 0.92).
Overall, the median TTP, MTT, CBF, and CBV ratios were 1.12 (IQR 1.09–1.28), 1.19 (IQR 1.10–1.34), 0.69 (IQR 0.56–0.88), and 0.80 (IQR 0.64–1.13), respectively. Regarding TTP, MTT, CBF, and CBV ratios, there were no significant differences between patients with LI in the anterior and posterior circulation. For details see Table 2.
Dynamic 4D angiograms
With regard to the predefined types of blood flow in LI, 4/36 (11.1%) patients demonstrated type 1 (no blood flow visible), 17/36 (47.2%) patients type 2 (blood flow from the periphery to the center), 9/36 (25.0%) patients type 3 (blood flow from the center to the periphery), and 6/36 (16.7%) patients type 4 (combination of type 3 and type 4). Figure 3 shows exemplary cases of each pattern. Interrater reliability for blood flow patterns in LI prior to consensus was substantial (κ = 0.69, p < 0.001). No significant differences in TTP (p = 0.90), MTT (0.15), CBF (p = 0.45), and CBV ratios (p = 0.53) in patients with blood flow in LI type 1, type 2, type 3, or type 4 were observed. The same holds true for the median diameter (p = 0.71) and area of the ischemic lesion on DWI (p = 0.98) as well as the median diameter (p = 0.91) and area of the perfusion deficit on PWI (p = 0.08). Compared to patients with LI in the anterior circulation, patients with LI in the posterior circulation significantly more often had collateral blood flow type 2 and less often type 3 (p < 0.001). For details see Table 2.
Examples of collateral blood flow types in lacunar infarction on dynamic 4D angiograms. (a) Type 1 (no blood flow visible). (b) Type 2 (blood flow from the periphery to the center). (c) Type 3 (blood flow from the center to the periphery). (d) Type 4 (combination of type 2 and type 3).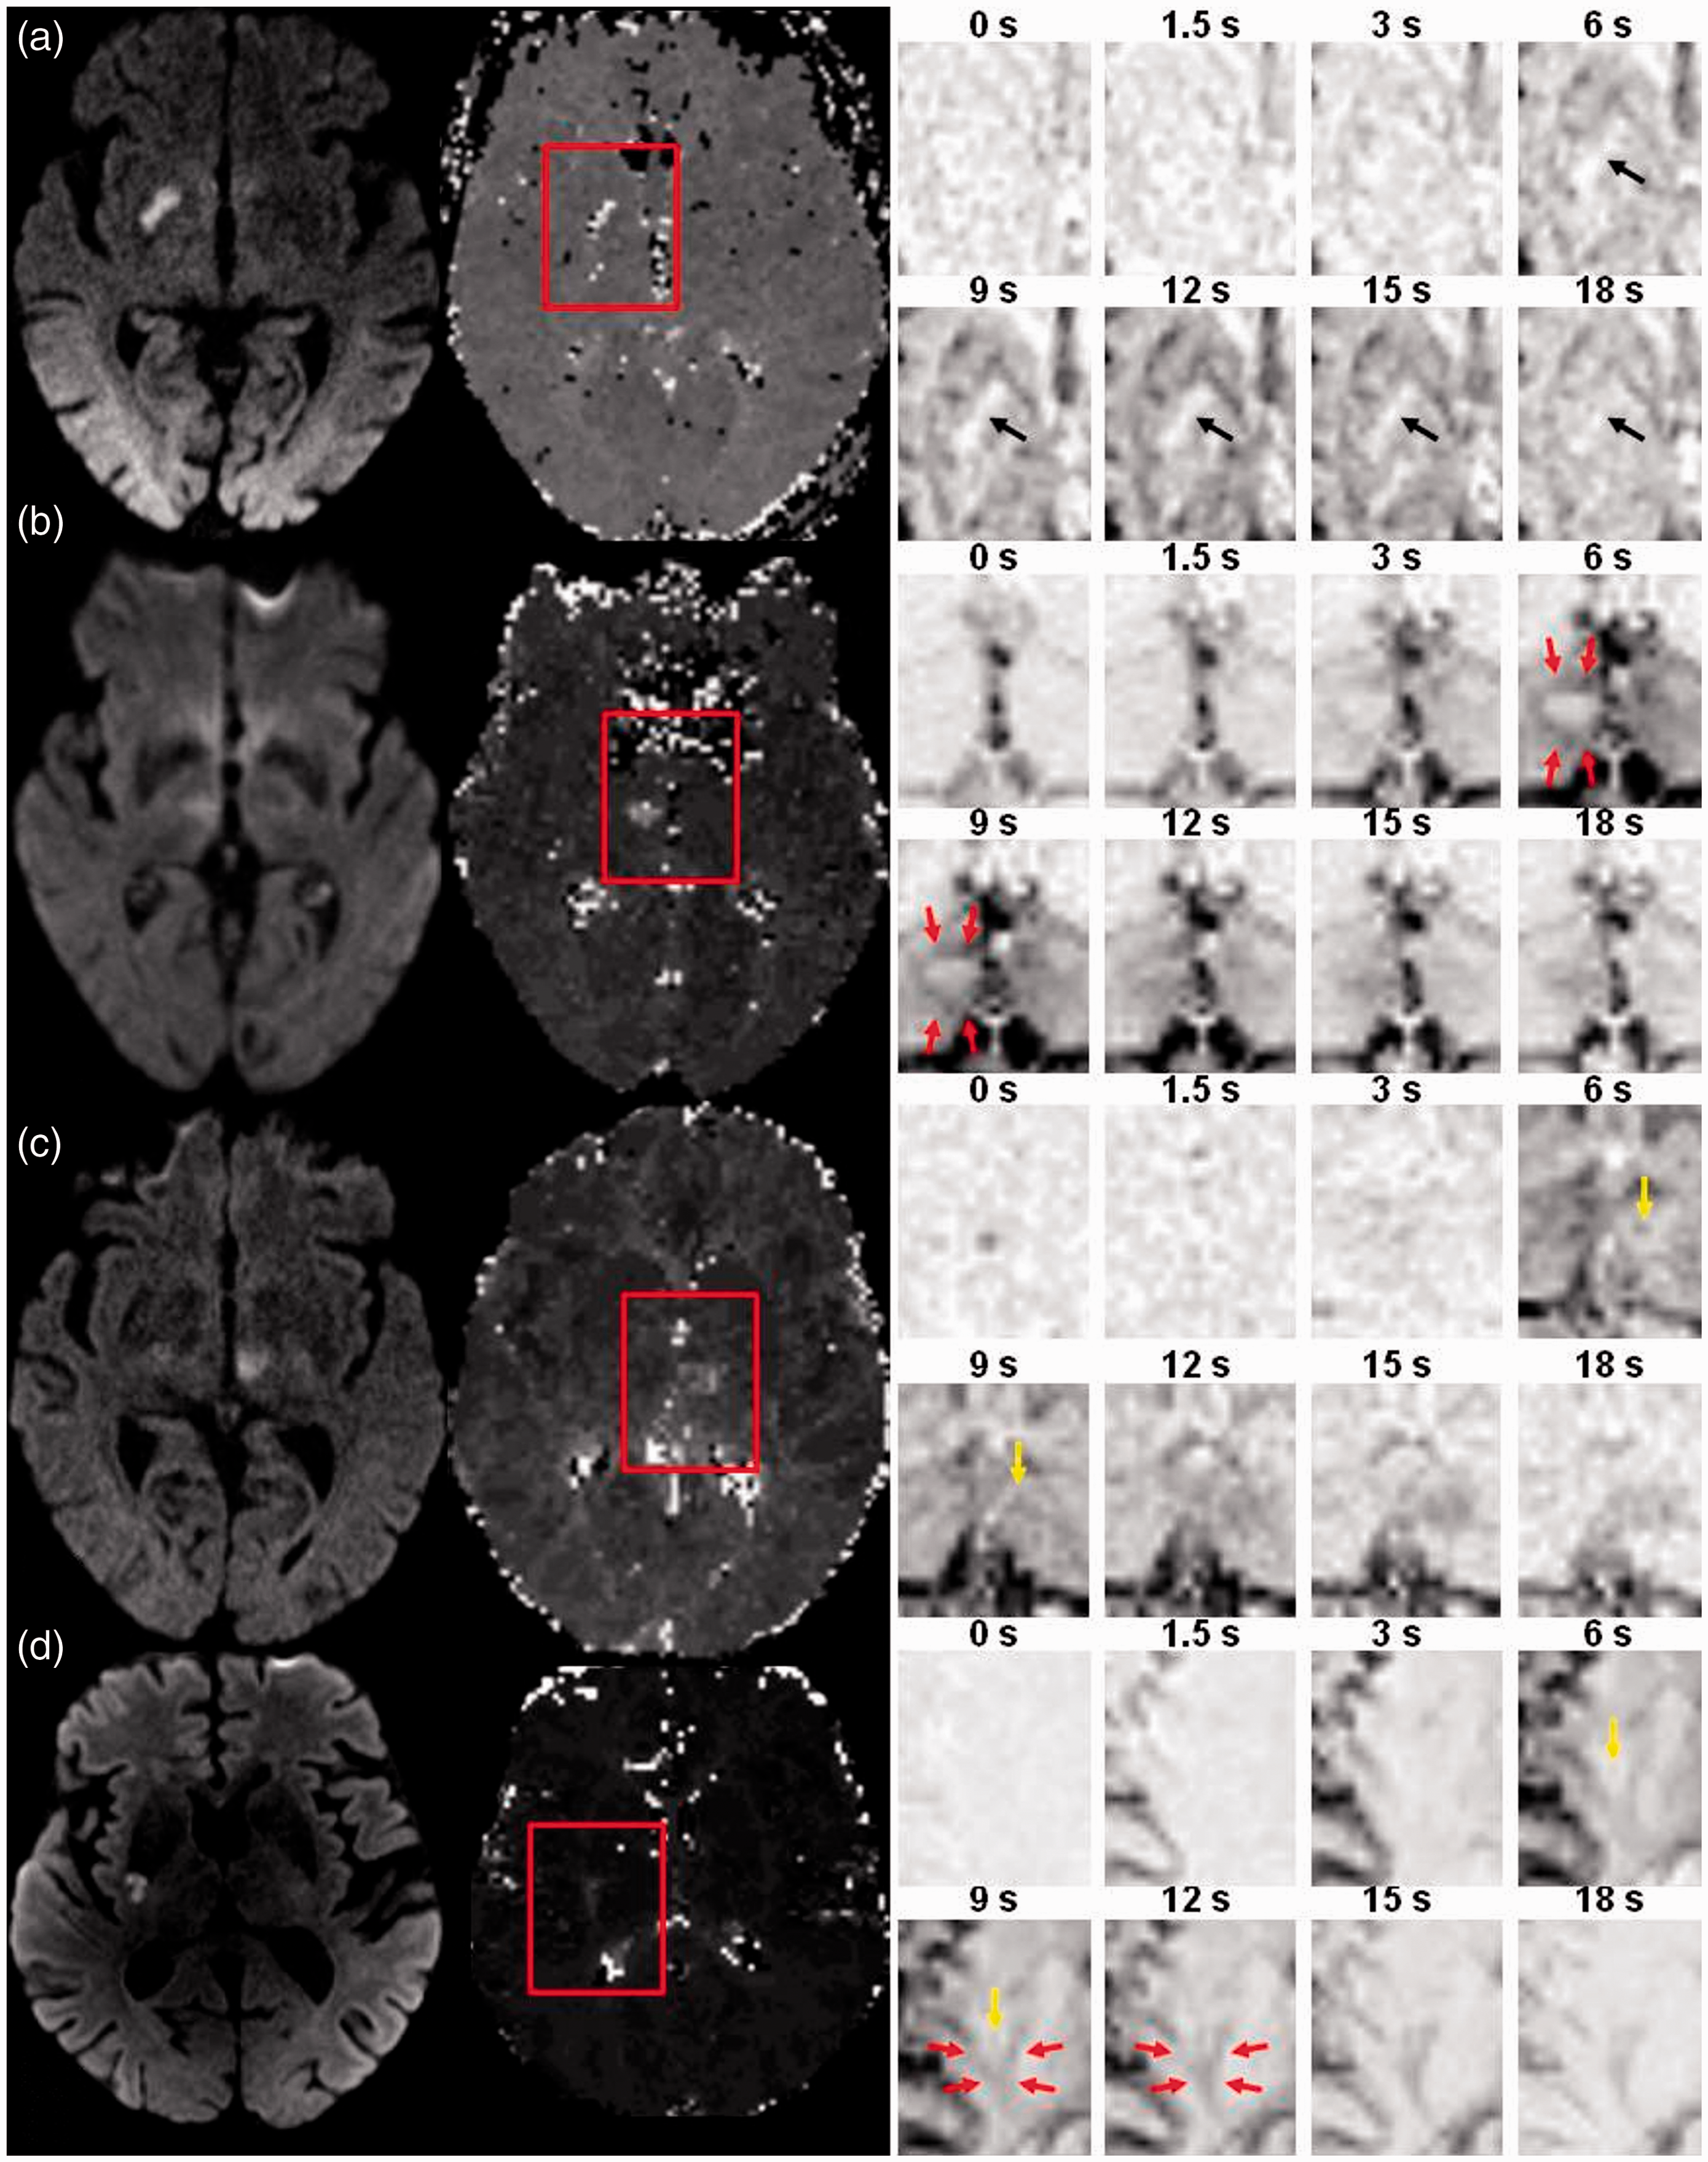
Discussion
The exact underlying pathomechanism in LI is still unexplained and the relevance of perfusion abnormalities as demonstrated in several case reports and smaller case series remains unclear.27–29 The present study describes three novel and essential findings in LI: (1) a perfusion deficit on PWI is present in only about half of patients and in about two-thirds it is smaller than the ischemic lesion on DWI, (2) by use of dynamic 4D angiograms different collateral blood flow types can be identified, and (3) hyperperfusion also may be a rare finding.
Overview of CT and MRI studies examining perfusion alterations in LI.
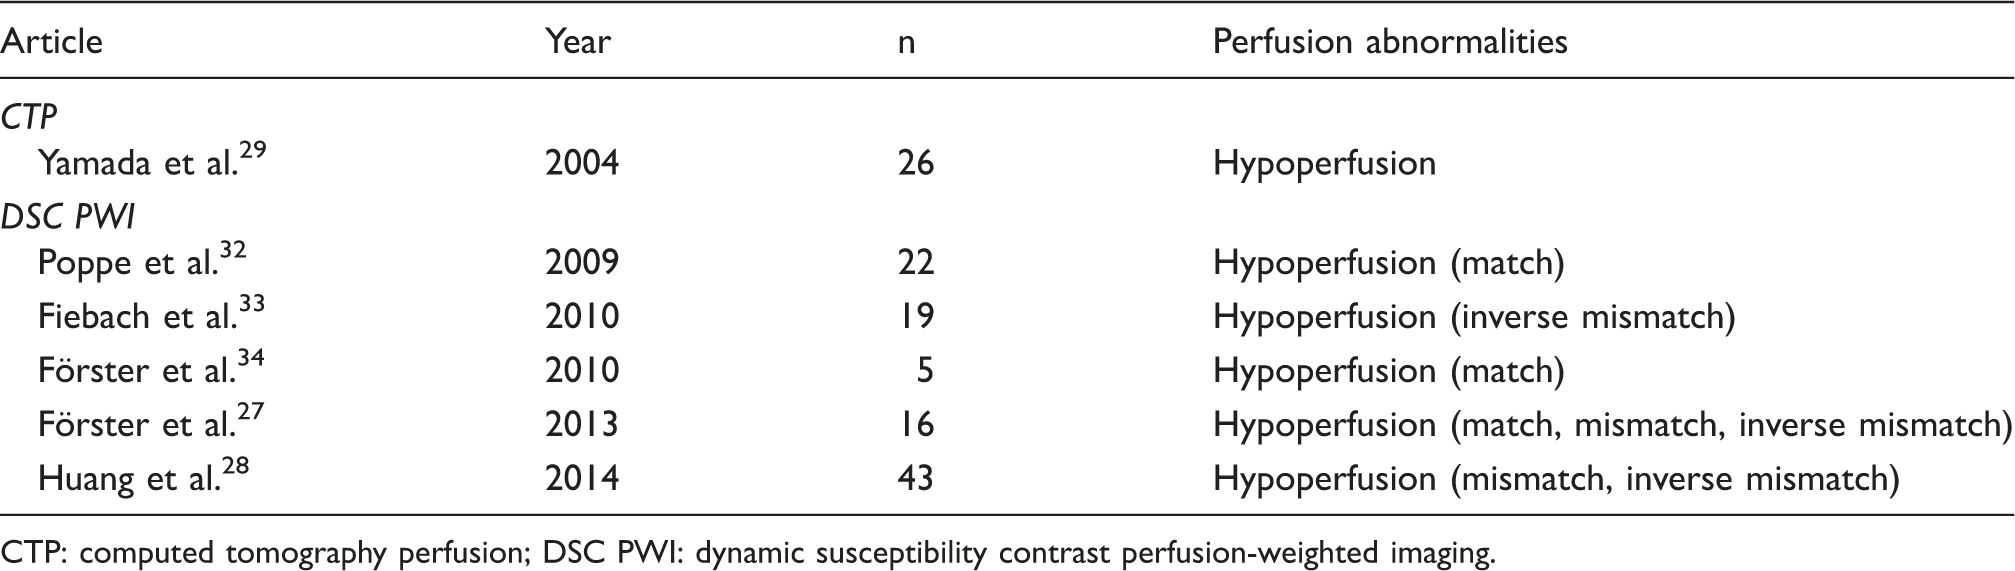
CTP: computed tomography perfusion; DSC PWI: dynamic susceptibility contrast perfusion-weighted imaging.
A longer time from onset to MRI could be associated with a higher frequency of recanalization and consequently absence of a perfusion deficit. Nevertheless, neither in earlier studies29,31,32 nor in the present one has a significant difference in time between onset and perfusion imaging in patients with and without a perfusion deficit been observed. While this appears counterintuitive on first glance, this may be at least partly explained by persistent hypoperfusion in a subset of cases with persistent occlusion or stenosis of the perforating artery.2,35
Also, the varying percentage of anatomical localizations could be another reason for the differing frequencies of a perfusion deficit in LI. In the present study, a perfusion deficit was much more common in LI in the basal ganglia, internal capsule, and thalamus than in the corona radiata and brainstem. Since, the perforating arteries supplying the latter have smaller diameters 36 and the site of occlusion is a well-known factor influencing recanalization with higher recanalization rates in vessels with smaller diameter, 37 it seems plausible that a perfusion deficit can be observed less frequently in the corona radiata and brainstem.
Another explanation for lacunar lesions without or only small perfusion deficit might be perivascular edema-mediated lesions, in which there is no occlusion but the tissue around the vessel is damaged by edema fluid. 38 Some authors also suggested a different underlying pathomechanism in small subcortical infarction with ischemic lesion growth beyond the hypoperfused area possibly induced by cytotoxic mechanisms at the border of the tissue damage. 33 This hypothesis would explain the large number of patients with a PWI deficit smaller than the ischemic lesion on DWI. Another explanation might be the partial recanalization of a previously occluded perforating artery or a collateral blood flow from adjacent vascular territories.
Finally, a limitation of perfusion MRI is the restricted spatial resolution and susceptibility to bone artifacts especially in the posterior fossa. Thus, small and very small areas of hypoperfusion could have been missed due to methodological reasons, especially in the brainstem.
The observation of a DWI–PWI mismatch in LI patients associated with neurological deterioration in the clinical course in two recently published clinical studies implies some kind of collateral blood flow in these cases.27,28 Interestingly, the existence of anastomoses between small perforating arteries at different levels of the vascular tree was demonstrated already in a number of different pathoanatomical studies several years ago. In several comprehensive pathoanatomical studies, the presence of anastomoses between the extracerebral segments of major perforating arteries of the anterior circulation supplying the basal ganglia, internal capsule, and corona radiate,6,7,10,15 as well as of the posterior circulation supplying the hypothalamus, 11 mesencephalon and thalamus,8,9,13 and brainstem 14 has been assessed meticulously. In the anterior circulation, Feekes and colleagues also evaluated the existence of anastomoses at the precapillary level between different neighboring arteries by injection of two different fluorescent dyes. 39
In the present study, we observed four different types of blood flow in LI on dynamic 4D angiograms. While some patients demonstrated no relevant blood flow at all (type 1), in the remainder a filling of the vascular territory from the periphery to the center (type 2), from the center to the periphery (type 3), or a combination of both (type 4) was found. Type 1 most likely represents the lack of anastomoses paralleled by an absence of collateral blood flow at all. Interestingly, this type was observed in only 3.6% of the patients suggesting that the absence of anastomoses and collateral blood flow between the perforating arteries of the brain is rather the exception than the rule. Type 2 in turn most likely reflects collateral blood flow from adjacent vascular territories via small anastomoses at the precapillary level as described in the pathoanatomical studies of Feekes et al. 39 In the perfusion CT scan-based study of Yamada et al., a similar pathomechanism has been hypothesized with preservation of CBF in LI via the microcirculation from the surrounding brain tissue. 29 Similarly, in type 4 the blood flow component from the periphery to the center of the perfusion lesion might represent collateral blood flow from neighboring vascular territories via these small anastomoses. In the present series, blood flow from the periphery to the center seems to be the most common pattern of collateral blood flow in LI either isolated in type 2 (47.2%) or in combination with type 3 blood flow in type 4 (13.9%). Furthermore, this type of blood flow has been observed more often in LI in the posterior circulation in comparison to LI in the anterior circulation. While the explanation of the observed collateral blood flow types 1 and 2 is rather easy, in type 3 and 4 a more detailed consideration seems to be necessary. In type 3 the observed blood flow pattern with filling of the vascular territory from the center to the periphery may be attributable to collateral blood flow via anastomoses between the main stems of two perforating arteries. On the other hand, the observed blood flow pattern might also represent delayed antegrade blood flow across an incomplete vessel occlusion or a circumscribed narrowing of the perforating artery as described previously. 35 Thus, in type 3 collateral blood flow and slow antegrade blood flow seem to be indistinguishable and the same holds true for the central blood flow component in type 4. This might also explain the higher frequency of type 3 in LI in the anterior circulation compared to LI in the posterior circulation which stands in contrast with the observation of Marinkovic and colleagues that anastomoses between the main stems of two perforating arteries are far more common in the posterior circulation. 12 Considering the results of the aforementioned pathoanatomical studies, it seems plausible to reason that blood flow type 3 as well as the central blood flow component in type 4 are probably due to delayed antegrade blood flow in most cases of anterior circulation LI. In contrast to this, in posterior circulation LI both blood flow pathways might still be possible.
Another interesting finding of the present study is the corresponding hyperperfusion in one patient with LI in the right thalamus. While hyperperfusion has been described in patients with large artery occlusion such as anterior or middle cerebral artery occlusion 40 and even in patients with basilar artery occlusion 34 after successful recanalization, to our best knowledge no reports on hyperperfusion in LI have been published until today. Although hyperperfusion is usually observed in regions of completed infarction, it has been assumed that hyperperfusion does not contribute to worse clinical outcome. 40 However, in LI this phenomenon seems to be a rather rare finding with a frequency of less than 1% in this study.
The present study has several limitations. First, this is a retrospective study of moderate sample size. However, to our knowledge this is the largest study on perfusion alterations in LI until now. The rather small number of acute LI patients undergoing PWI collected over a time period of more than 10 years possibly reflects the low appreciation of PWI in LI in daily clinical routine. Second, because of the limited spatial resolution of DSC PWI only perfusion deficits with a diameter larger than 7 mm were analyzed on dynamic 4D angiograms. Thus, the results cannot be generalized to all cases of LI. Third, the study was performed with different MRI scanners and different imaging sequences. However, the MRI sequences, in particular the PWI sequences, have been customized for optimal comparability in daily clinical routine and consequently are generally comparable. Fourth, we did not perform an intrasubject registration of DWI and PWI to a target common space. However, in none of the larger studies focusing on LI and PWI such a registration of DWI and PWI has been performed. Thus, this should not affect the results in general and in turn might facilitate comparison of the different study results. Fifth, our study lacks a gold standard for the assessment of collateral blood flow through anastomoses between small perforating arteries of the brain. However, given the benign clinical course in most cases and the low mortality of patients with LI, neither conventional selective angiography nor autopsy seems to be suitable as diagnostic method for comparison. Finally, the diagnosis of LI is based on the clinical syndrome, characteristic MRI findings, and the exclusion of competing etiologies like cardioembolism or large vessel disease. Since the underlying vascular lesion could only be determined by neuropathological examination, some uncertainty remains regarding the final diagnosis.
In conclusion, dynamic 4D angiograms are feasible to demonstrate different types of collateral blood flow in acute LI and consequently may serve for a better characterization of this stroke subtype and support treatment decisions in daily clinical practice. However, this should be confirmed in larger data sets and serial MRI examinations including PWI.
Footnotes
Funding
The author(s) received no financial support for the research, authorship, and/or publication of this article.
Declaration of conflicting interests
The author(s) declared no potential conflicts of interest with respect to the research, authorship, and/or publication of this article.
Authors’ contributions
AF, BM: contributed equally to this work. AF: study concept and design, data acquisition, statistical analysis, manuscript preparation, manuscript editing. BM: literature research, data acquisition, data analysis, manuscript preparation, manuscript review. JB: data acquisition, data analysis, manuscript preparation, manuscript review. MAZ: data acquisition, manuscript preparation, manuscript review. HW: data acquisition, data analysis, statistical analysis, manuscript preparation, manuscript review. HUK: data acquisition, manuscript preparation, manuscript review. CG: data analysis, manuscript preparation, manuscript review