
Abstract
Cylindrospermopsin (CYN) is a toxic metabolite globally documented in aquatic environments, including human supply water sources. Adsorption onto activated carbon (AC) has emerged as a promising and cost-effective advanced technique to remove this cyanotoxin in water treatment utilities. In this context, this work aims to assess the influence of AC's surface chemical composition on kinetics and equilibrium behavior of CYN adsorption. For that, a pristine AC was synthesized by chemical activation with H3PO4 and then submitted to two different post-activation treatments: treatment under the reflux of a HNO3 solution (ACOx); heat treatment under inert atmosphere at 850 oC (ACHT). The modified ACs showed quite different contents of acidic oxygenated groups, which amounted 1.66 and 0.45 mmol g−1 for ACOx and ACHT, respectively. Despite its lower porosity and specific surface area, ACHT presented better kinetic and capacity for CYN adsorption, which suggests that the presence of acidic oxygenated functional groups hinders CYN adsorption at the studied conditions. Also, a full-scale adsorption column breakthrough was estimated by rapid small-scale column tests with granular ACHT and ultrafiltered superficial water collected from Paranoá Lake.
Keywords
Introduction
Cylindrospermopsin (CYN) is a toxic metabolite produced by a variety of cyanobacteria that inhabits freshwater bodies such as lakes, rivers, and water supply reservoirs. CYN is the second most recorded cyanotoxin worldwide and it has been identified in Europe, North America, South America, Central America, Asia, and Oceania (Scarlett et al., 2020) with average concentrations varying from 1 to 10 µg L−1 (Chiswell et al., 1999; Yang et al., 2021). In Brazil, data from the Information System for the Human Supply Water Quality Surveillance (SISAGUA) and the National System of Information on Water Resources (SNIRH) reported CYN concentrations of 1.02 µg L−1 up to 43.5 µg L−1 in supply sources of 13 states throughout the Brazilian territory (Rosado, 2022). Although CYN can occur naturally, the input of nutrients from human activities (wastewater and agricultural runoff) has favored the occurrence and growth of CYN-producing species in aquatic environments (Yang et al., 2021).
The toxicity effects of CYN include multiple organ damage, mainly affecting liver functioning, being associated with acute hepatotoxicity in humans (Adamski et al., 2014). Several toxicological studies also suggest that CYN is a potential genotoxic, neurotoxic, carcinogenic, and endocrine disruptor metabolite (Ohtani et al., 1992; Rzymski and Poniedziatek, 2014; Terao et al., 1994; Wiegand and Pflugmache, 2005). Therefore, the World Health Organization (WHO) set provisional guideline values for water quality as follows: 0.72 µg L−1 for lifetime drinking-water, 3.0 µ L−1 for short-term drinking-water, and 6.0 µg L−1 in water intended for recreational activities (WHO, 2020). In Brazil, the Ministry of Health established a maximum CYN concentration of 1 µg L−1 in potable water (Ordinance GM/MS 888 of 4 May 2021), following the guidance of WHO.
CYN are highly soluble zwitterion alkaloids containing a tricyclic guanidine combined with a hydroxymethyl-uracil, with an average molecular weight of 415.43 Da and pKa equal to 8.8 (Onstad et al., 2007). The molecule is stable in water under different conditions of light and temperature (Norris et al., 1999) and four structural variants of CYN can occur naturally: 7-epi-CYN, 7-deoxy-CYN, 7-deoxy-desulfo-CYN, and 7-deoxy-desulfo-12-acetyl-CYN (Wimmer et al., 2014).
Comparatively to other cyanotoxins, CYN has a higher solubility (Bormans et al., 2014; Rucker et al., 2007), hence its removal from water in conventional water treatment plants (WTPs) represents a big challenge, and advanced methods such as nanofiltration (Chorus and Welker, 2021), advanced oxidative processes (Capelo Neto and Newcombe, 2017; Ferreira et al., 2021) and adsorption (Ho et al., 2011; Ho et al., 2008; Liu, 2017) are required. Amongst the available technologies, adsorption onto activated carbon (AC) can represent a cost-effective, simple, and sustainable alternative. Remarkably, the production of ACs from biomass residues such as coconut shells, fruit stones (peach, olive, etc), and residual wood stands out as a promising avenue for addressing economic and environmental challenges by repurposing agroindustry waste, fostering circular economy principles, minimizing carbon footprint, and promoting resource efficiency (Abbas et al., 2020).
Notwithstanding, there are scarce works concerning CYN adsorption on ACs or even other adsorbents. Most of the existing works are primarily focused on the influence of the adsorbent pore morphology on the adsorption performance of powdered ACs (PACs) (Fonseca et al., 2019; Liu, 2017; Mariano et al., 2014; Mashile et al., 2019). To the best of our knowledge, there are no studies related to the effects of the chemical surface composition on CYN adsorption. Furthermore, since PACs are inappropriate to be used in fixed-bed adsorption columns, the lack of studies concerning granular activated carbon columns (GACs) gives rise to a gap in the discussions on the functionality and practicality of fixed-bed adsorption systems and the potential for adsorbent regeneration.
Given the discussions above, the present study aims to: (i) evaluate the viability of using ACs produced from a national agroindustry waste (coconut shell) as adsorbents to remove CYN from water intended for human supply; (ii) assess the influence of AC chemical surface composition on the efficiency of the material for CYN adsorption; (iii) provide initial insights on the employment of GAC columns for CYN removal by using rapid small-scale column test (RSSCT), therefore paving the way for more advanced discussions regarding the practical applicability of AC fixed-bed systems, such as installation costs, application, and adsorber regeneration.
Materials and methods
ACs synthesis and characterization
A granular mesopore-rich AC (AC54) was synthesized by H3PO4 chemical activation of a sample of 14–20 mesh dried coconut shell endocarp (Cocos nucifera) as described elsewhere (Prauchner and Rodríguez-Reinoso, 2012). Shortly, the feedstock particles were impregnated with H3PO4, and the impregnated material was carbonized up to 450 °C (2 °C min−1, 2 h). Then, the carbonized material was washed with heated distilled water to remove the chemical, leaving behind a pore network. In order to obtain a material with considerable mesopore content, a relatively high ratio P/precursor was employed, 0.54.
Two ACs with different acidity degree were prepared by submitting AC54 to: an oxidative treatment with HNO3; a heat treatment under inert atmosphere. The former was performed by stirring AC54 with a 1.0 mol L−1 HNO3 solution at 75 °C for 1 h, followed by rinsing out until constant pH. In turn, the heat treatment was performed at 850 °C for 2 h under N2 (2 °C min−1; 100 mL min−1) in a horizontal tubular furnace. The resulting materials were identified as ACOx and ACHT, respectively.
Batch adsorption assays
Batch assays were performed in order to obtain the kinetic and isotherm curves of CYN adsorption onto pulverized ACOx and ACHT adsorbents. The assays were conducted in triplicate, at constant temperature (22 °C) and pH (6.5), using bench-scale reactors, following the D3860-98 ASTM standard (2014). CYN solutions with initial concentration of ∼15 µg L−1 were prepared by spiking ultrapure water (Milli-Q Reference water purification system, C79625, Merck Millipore, Darmstadt, Hesse, Germany) with CYN standard stock solution (purity > 95%) (Eurofins/Abraxis, Warminster, PA, USA). This initial concentration was chosen based on typical average CYN levels found in freshwater Brazilian reservoirs (Rosado, 2022). AC suspensions (1 mg mL−1) were initially prepared using CO2-free ultrapure water, which was set under a vacuum of −600 mmHg overnight to degas AC pores.
Then, the AC suspension was added into 300 mL of CYN solution in the proportions needed to result in the desired AC dosages. For all the assays, the solution was kept at constant rotating agitation of 190 rpm. Once finished the contact time, the supernatant was filtered using a 0.22 μm membrane and the CYN remaining concentration was measured. For the kinetic studies, an AC dosage of 8 mg L−1 was used. This value was chosen because it showed to be appropriate to: (i) give rise to adsorption equilibrium times in the range of some tens of minutes; (ii) promote appreciable CYN adsorption at equilibrium, but with equilibrium concentrations that were high enough to ensure an adequate solute detection by the employed analytical method. In turn, for the equilibrium studies, AC dosages of 2, 3, 4, 5, 6, and 7 mg L−1 were used, with a contact defined on the kinetics results.
Kinetic data were fit to nonlinear pseudo-first-order (PFO), pseudo-second-order (PSO), and intraparticle diffusion (IP) models. In turn, the isotherms were fit to nonlinear Langmuir, Freundlich, and Redlich-Peterson models. The fits to the models were done using the Origin 2023 software.
The mass of CYN adsorbed per unit mass of AC was determined by Equation 1:

Rapid small-scale column tests
RSSCT involves a fixed-bed simplified method to predict pilot-scale or full-scale systems’ performance using a small-sized particle adsorbent column (Crittenden et al., 1991). RSSCT has been widely used in numerous studies to assess the potential of fixed-bed adsorption systems for removing specific substances diluted in water, especially microcontaminants (Canteli et al., 2014; Cantoni et al., 2021; Franco et al., 2018; Merle et al., 2020; Poddar, 2013; Schaefer et al., 2020; Zietzschmann et al., 2014).
The smaller particles result in improved mass transfer and shorter empty bed contact time (EBCT), hence, faster tests. Large- and small-scale hydrodynamic characteristics and mass transfer phenomena are expected to be the same by scaling down parameters such as particle size, hydraulic loading, column length, and operation time.
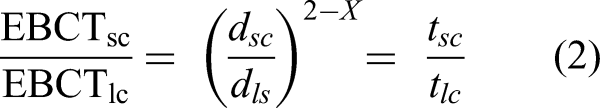
The scaling factor express the ratio of the particle's mean diameter of small and large scales (Equation 2) (Crittenden et al., 1991). Also, the design of an RSSCT presumes that intraparticle diffusivity is dominant mass transfer phenomenon and can vary with the GAC particle's diameter. For a constant intraparticle diffusivity approach, the diffusivity of the adsorbent is assumed independent of the adsorbent particle size (X = 0); in contrast, for a proportional intraparticle diffusivity design, intraparticle diffusivity is considered linearly dependent on the adsorbent particle size (X = 1).
Duplicate RSSCTs were performed using the ACHT adsorbent, which demonstrated the best performance in previous batch adsorption studies, following the D6586-03 ASTM Standard (2008). Ultrafiltered water from the Water Treatment Plant (WTP) of Lago Norte in Brasilia, Federal District, Brazil, was used. CYN extract was obtained from the cell lysis of Raphidiopsis raciborskii cyanobacteria strains cultivated at the Environmental Sanitation Laboratory of the University of Brasília, aiming an initial CYN concentration of ~15 µg/L. The pH of the matrix water was adjusted to 6.5 before adding the CYN extract. Prior to each assay, the initial CYN concentration and turbidity of the study water were determined after sampling.
Before RSSCTs, AC samples were crushed, sieved, and dried for 4 h at 150 °C, then boiled with 40 mL ultrapure water for 10 min to remove air from the pores. Subsequently, the samples were put aside for cooling in a desiccator for at least 12 h.
The small column system setup (Figure 1) was composed of two 100 L polyethylene water tanks (1: study water, 9: treated effluent); a peristaltic pump (3) with an adjustable flow to maintain the downward flow throughout the operation; low-density polyethylene piping (2,6); a polytetrafluoroethylene column (7); a manometer (4); and galvanized steel connections and valves (5: upstream sampling point, 8: treated effluent sampling point).
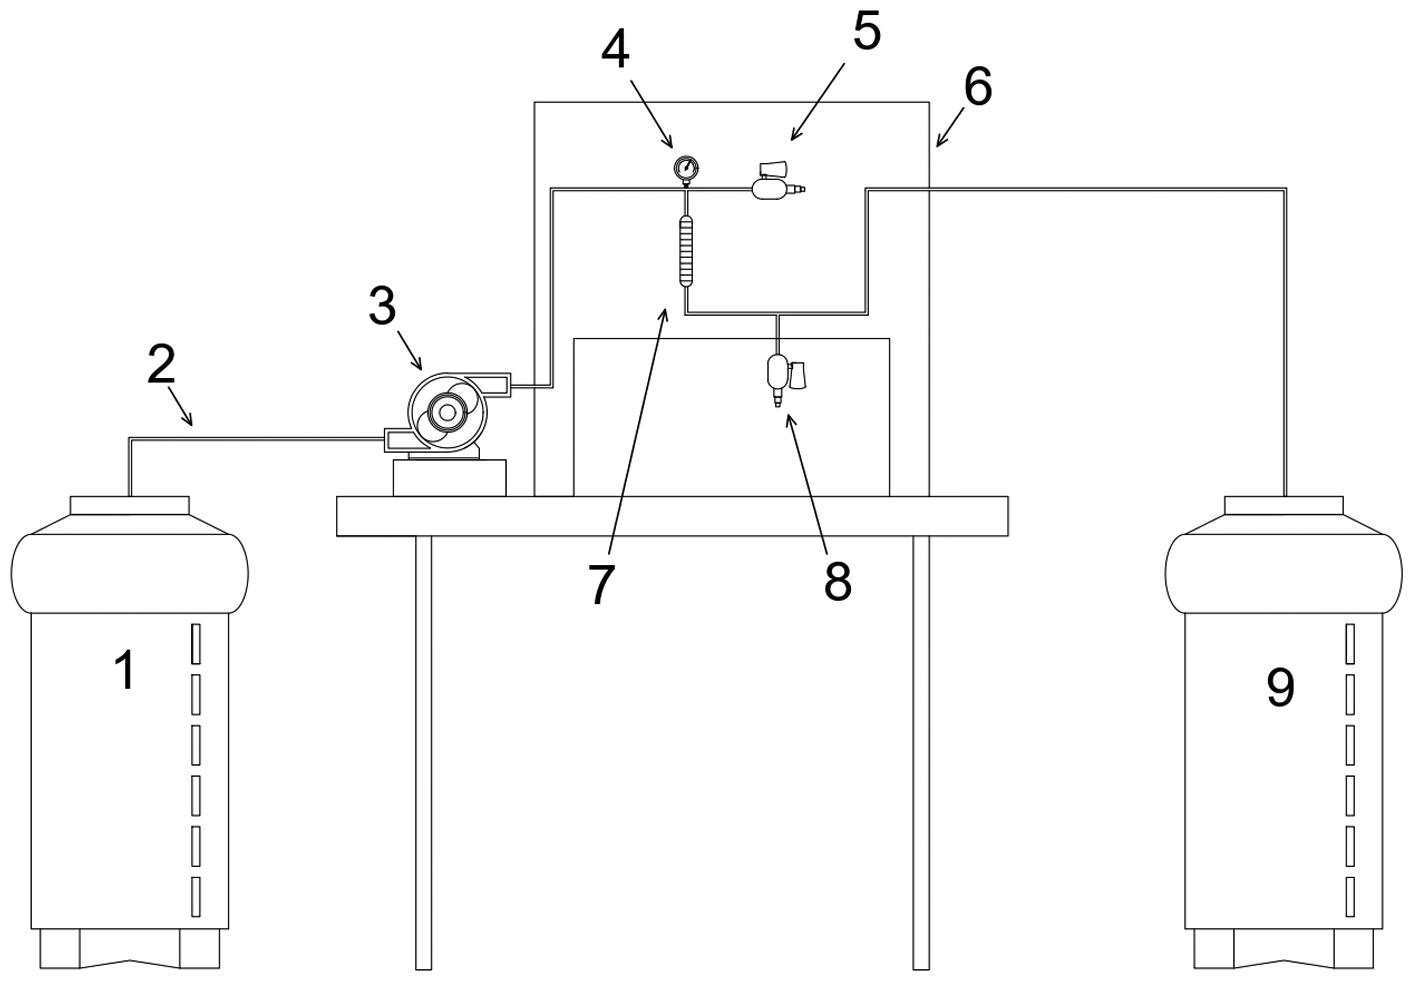
Setup of the experimental RSSCT system.
Glass wool and a 100-mesh stainless steel mesh (0.149 mm) held by a rubber sealing ring fixed the AC bed to the column. The effluent outlet was kept closed throughout the column filling to prevent the return of air to the AC pores.
The RSSCT column was designed aiming to provide a column diameter/GAC particle diameter ratio above 50 (∼53), which is advisable to avoid channeling (ASTM, 2008). Furthermore, the approach considered a proportional diffusivity (X = 1 in Equation 2), which is considered suitable when assessing the adsorption of organic compounds in RSSCT (Summers et al., 1995).
Table 1 summarizes the column features and operational parameters. The real-scale column parameters were chosen for post-filtration GAC adsorbers (Chowdhury et al., 2012).
Design parameters of the real-scale and RSSCT GAC columns.
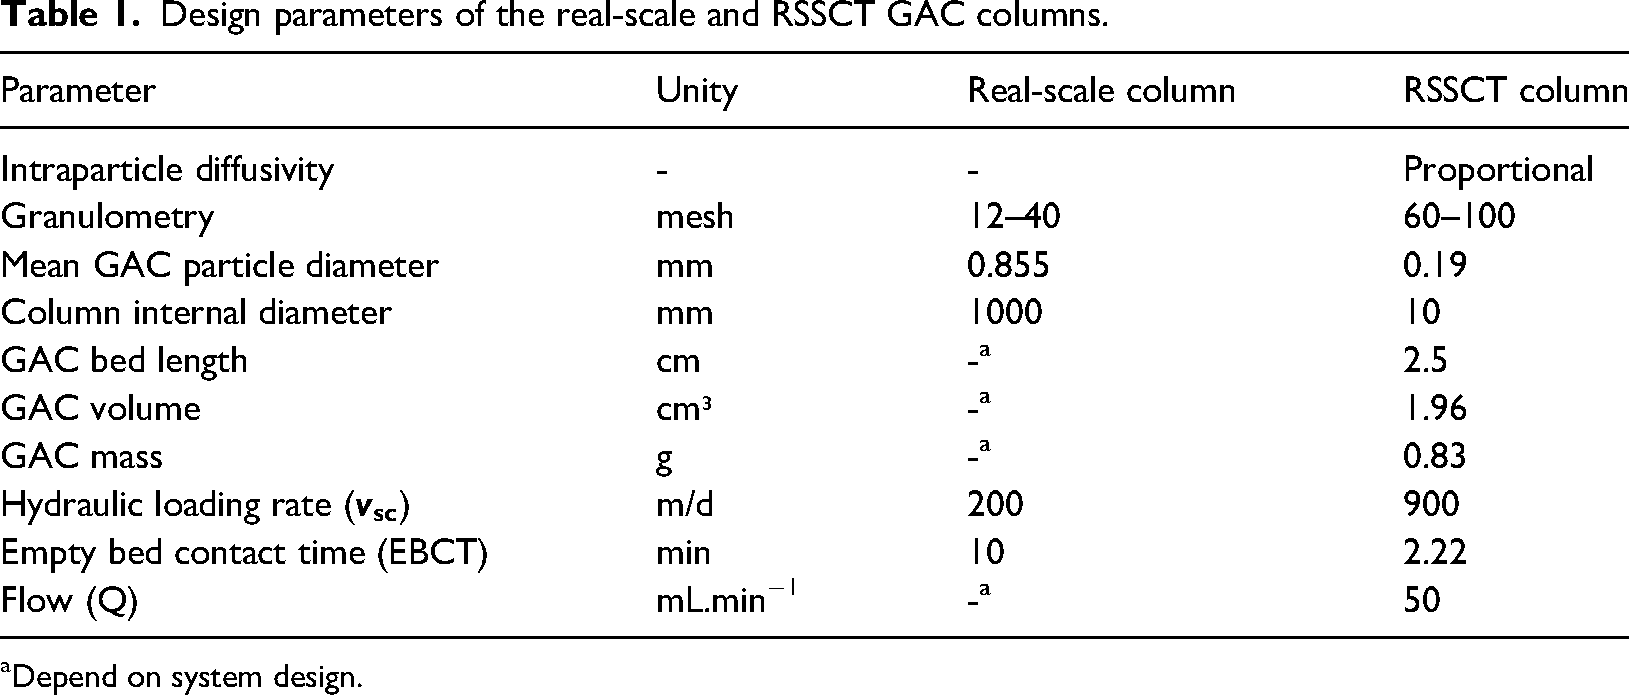
Depend on system design.
The system was initially operated for 30 min with ultrapure water to eliminate remaining air bubbles before starting the assays with CYN solution. After starting the column operation, effluent water from column was sampled in defined time intervals to determine the CYN's remaining concentration. Effluent pH and turbidity were also monitored at the effluent sampling point. The breakthrough time was considered that in which the CYN's remaining concentration was higher than 1 µg L−1, as established by the Brazilian Health Ministry.
Then, real-scale column operation time was calculated by Equation 3:
Analytical methods
The textural characterization of the produced ACs was performed from N2 adsorption–desorption isotherms (77 K) obtained using a Quantachrome Nova 2200e gas sorption equipment (Boynton Beach, FL, USA). The specific surface area (SBET) and micropore volume (Vmic; pore width below 2.0 nm) were determined by applying the Brunauer–Emmett–Teller and Dubinin–Radushkevich equations, respectively. The volume of liquid N2 adsorbed at the relative pressure of 0.95 (V0.95) was considered to be the sum of the volume of micro and mesopores (Vmes; pore width in the range of 2.0–50 nm). Thus, Vmes was determined as the difference between V0.95 and Vmic. The pore size distribution curves (PSD-N2) were generated from the N2 adsorption isotherms using the software Autosorb 1 and the nonlinear density functional theory.
The types of oxygen-containing groups present on the ACs surface were identified through Thermal Programmed Desorption coupled to Mass Spectrometry (TPD/MS). The analyses were performed by heating the sample (10 °C min−1) under argon gas flow (10 cm3 min−1) in an AMI-90R equipment from Altamira Instruments (USA). The released gases were continuously detected with a quadrupole mass spectrometer model Dymaxion from Ametek. The zero-charge point (PZC) (Park and Regalbuto, 1995), zeta potential (Zetasizer—Nano ZS90) (Malvern Analytical, USA), and total acidity (Boehm, 1994) of the modified ACs were also determined.
The CYN concentration in water was determined by high-performance liquid chromatography (Agilent 1200 Series, Agilent Technologies, Palo Alto, CA, USA) coupled to mass spectrometry (3200 QTRAP, Sciex, Toronto, ON, Canada) following the procedure proposed by Ferreira et al. (2021).
Results and discussion
ACs characterization
Textural characterization
Figure 2(a) shows the N2 adsorption/desorption isotherms of the synthesized ACs. For the unmodified AC (AC54), the isotherm is a hybrid of I(b) and IV types according to the IUPAC classification, which are typical of micro and mesoporous adsorbents, respectively (Thommes et al., 2015). Type I(b) isotherms are characterized by a high N2 uptake at quite low pressures (p/p0 < ∼0.05) due to the filling of narrow micropores (pore width < 0.7 nm; ultramicropores) where overlapping of adsorption potentials from adjacent pore walls takes place. Furthermore, the occurrence of a relatively wide “knee” is attributed to the filling of larger micropores (pore width in the range of 0.7–2.0 nm; supermicropores) up to around a p/p0 of 0.2. In turn, type IV isotherms show a continuous increase of adsorption up to near the saturation pressure due to the formation of multiple layers and the occurrence of capillary condensation in mesopores (Marsh and Rodriguez-Reinoso, 2006).

(a) N2 adsorption/desorption isotherms for the synthesized activated carbons (closed symbols: adsorption; open symbols: desorption); (b) respective pore size distribution-N2 curves.
The presence of a hysteresis loop at p/p0 around 0.4 confirms the presence of mesopores in the AC54 sample. The observed hysteresis presents intermediate aspects between H3 and H4 types according to IUPAC classification, which are characteristic of slit-shaped pores (Thommes et al., 2015).
The above-reported findings are confirmed by the PSD-N2 curve (Figure 2(b)) for AC54, which has considerable portion located at both micropore and mesopore regions, and by the data of pore morphology (Table 2): Vmic and Vmes were 0.753 and 0.355 cm³ g−1, respectively. As result of the well-developed porosity, SBET was high, 1666 m2 g−1.
Data of pore morphology and tap density of the synthesized ACs.

Measured by gently tapping a weighted number of grains in a graduate cylinder.
As shown by the isotherms (Figure 1(a)), the PSD-N2 curves and the data of pore morphology (Table 2), both the modified ACs (ACOx and ACHT) showed considerably lower porosity and SBET than the unmodified material (CA54). For example, V0.95 decreased from 1.108 to 0.821 and 0.724 cm³ g−1, respectively. In the case of the oxidative treatment with HNO3, this behavior can be attributed to the formation of oxygenated groups that can block the entry of pores and/or the collapse of pore walls (Gokce and Aktas, 2014; Qiu et al., 2023). In turn, in the case of the ACHT sample, the verified reduction of porosity and specific surface area occurred because the post-activation thermal treatment was carried out at higher temperature (850 °C) than that reached during the activation procedure (450 °C), which led to the shrinkage of the particles and, consequently, to a reduction of porosity (Wan Daud and Houshamnd, 2020). Nevertheless, it is worthy to mention that the three synthesized ACs yet showed a similar mesopore fraction (Vmes/V0.95) of around 30%.
Chemical characterization
Table 3 shows that, as expected, the oxidative treatment with HNO3 and the thermal treatment at 850 oC rendered ACs with quite different acidity degree. ACOx showed a content of acidic groups equal to 1.66 mmol g−1, while for ACHT the value was only 0.45 mmol g−1. Consequently, ACOx showed a lower PZC (3.5) and a more negative zeta potential (−27.1 mV) than ACHT (the respective values for the latter were 6.1 and −9.82 mV).
Chemical characteristics of the modified ACs.

pH point of zero charge.
Figure 3(a) and (b) show the CO2-TPD and CO-TPD profiles for the HNO3-treated AC sample, ACOx, which present intense emissions. The CO2 profile was deconvoluted into five peaks centered at around 320, 410, 530, 640, and 785 °C. According to the works of Vivo-Vilches et al. (2014), Li et al. (2011), and Razdyakonova et al. (2015), these peaks indicate the presence of strong carboxylic acids (CA′), weak carboxylic acids (CA″), carboxylic anhydrides (CAn), and lactones (Lac′ and Lac″), respectively. The CO profile was also deconvoluted into five peaks. The small two first ones, at 310 and 410 °C (Figure 4(b)), are attributed to the decomposition of the CO2 released by carboxylic acids (CA′ and CA″, respectively) into CO. This decomposition can occur (i) by the catalytic action of the AC surface or (ii) by the fragmentation of CO2+ ion into CO+ ion after electron beam action in the mass spectrometer (Kalijadis et al., 2011). The third CO peak, around 550 °C, is assigned to the decomposition of carboxylic anhydrides (CAn), which releases CO2 and CO simultaneously. The fourth peak, at 650 °C, is associated to phenolic groups (Ph). Finally, the peak at around 750 °C is attributed to neutral or slightly basic groups such as ketones, quinones, and ethers (Ce/Qu/Et). These TPD results show that the high acidity of the ACOx sample is due mainly to the presence of carboxylic acids, anhydrides, lactones, and phenols.

CO2-TPD (a,b) and CO-TPD (c,d) profiles of unmodified activated carbon, AC54.

Profile of the CYN's remaining fraction in adsorption kinetic assays with the modified ACs. The error bars represent the standard deviation of measurements for CYN's remaining fraction of two separate batches.
Regarding the ACHT sample, one could expect that their TPD profiles would not present neither CO2 nor CO emissions below 850 °C because this material had already been heat treated up to this temperature and, therefore, existing groups must have been previously decomposed. However, the TPD profiles revealed considerable emissions of both CO2 (Figure 3(c)) and CO (Figure 3(d)) below 850 °C. The CO2 profile showed a relatively intense peak centered at 390 °C, attributed to carboxylic acids (CA), and another smaller one centered around 560 °C, mainly credited to the desorption of lactones (Lac). Above 600 °C, there is a similar pattern of CO2 and CO emissions, with deconvoluted peaks centered around approximately 700 °C and 710 °C. The similarity between the CO2 and CO TPD profiles suggests that the emissions are due to the decomposition of some kind of more stable anhydrides (An). Finally, some emission of CO took place at around 800 °C, which is assigned to ketones, quinones and/or ethers (Ce/Qu/Et). These results and discussions showed that the acidity verified for the CAHT sample (Table 3) can be attributed mainly to the occurrence of carboxylic acids formed by the reaction of the thermally as-treated material with the atmospheric air.
Adsorption kinetics
Figure 4 shows the curves of the remaining fraction of CYN (C/C0) as a function of time during the kinetics tests. Despite its smaller volume of pores and specific surface area, ACHT promoted faster CYN adsorption and higher toxin removal at equilibrium. For example, ACHT removed almost 50% of CYN in the first hour and around 80% after 2 h of contact. Likewise, ACHT reached the adsorption equilibrium in nearly half the time needed for ACOx.
Figure 5 shows the fit of the kinetics experimental data to the nonlinear form of PFO and PSO models. For both ACs, the experimental data showed an adequate fit to both models, with R² > 0.9, being the fit slightly better to the PSO model (Table 4). According to the data of Figure 4, ACHT presented greater PFO and PSO adsorption rate constants (k1 = 0.014 min−1 and k2 = 0.083 mg µg−1 min−1) than ACOx (k1 = 0.0051 min−1 and k2 = 0.0046 mg µg−1 min−1). In addition, the maximum amount of CYN adsorbed (qe) estimated from both models were higher for ACHT (1.61 and 1.78 µg mg−1) than for ACOx (1.18 and 1.32 µg mg−1).

Fit of nonlinear PFO and PSO kinetic models for CYN adsorption.
Equations of the PFO, PSO, and intraparticle diffusion models and respective parameters values determined from the fitting of the experimental kinetic data for CYN adsorption.

qt: amount adsorbed at a given time t; qe: amount adsorbed at equilibrium; k1: PFO rate constant; R2: coefficient of determination; RSS: residual sum of the squares; k2: PSO rate constant; kd1 and kd2: intraparticle diffusion rate coefficients for the phases 1 and 2; C1 and C2: intercept that represents the boundary layer thickness for the phases 1 and 2, respectively (mg g−1).
IP fits (Figure 6) exhibited two linear sections, called as phases 1 and 2. The phase 1 extended over around the first two hours for both ACs, followed by phase 2. According to Campos et al. (2018) and Kajjumba et al. (2019), the phase 1 may correspond to diffusion in the film, affected by boundary layer, whereas in phase 2, IP controls the CYN transport, comprising pore and surface diffusion. For both ACs, the rate constant kd2 was higher than kd1 (Table 4), revealing that the IP step was the main factor limiting the toxin mass transfer, especially in the stages nearing equilibrium.
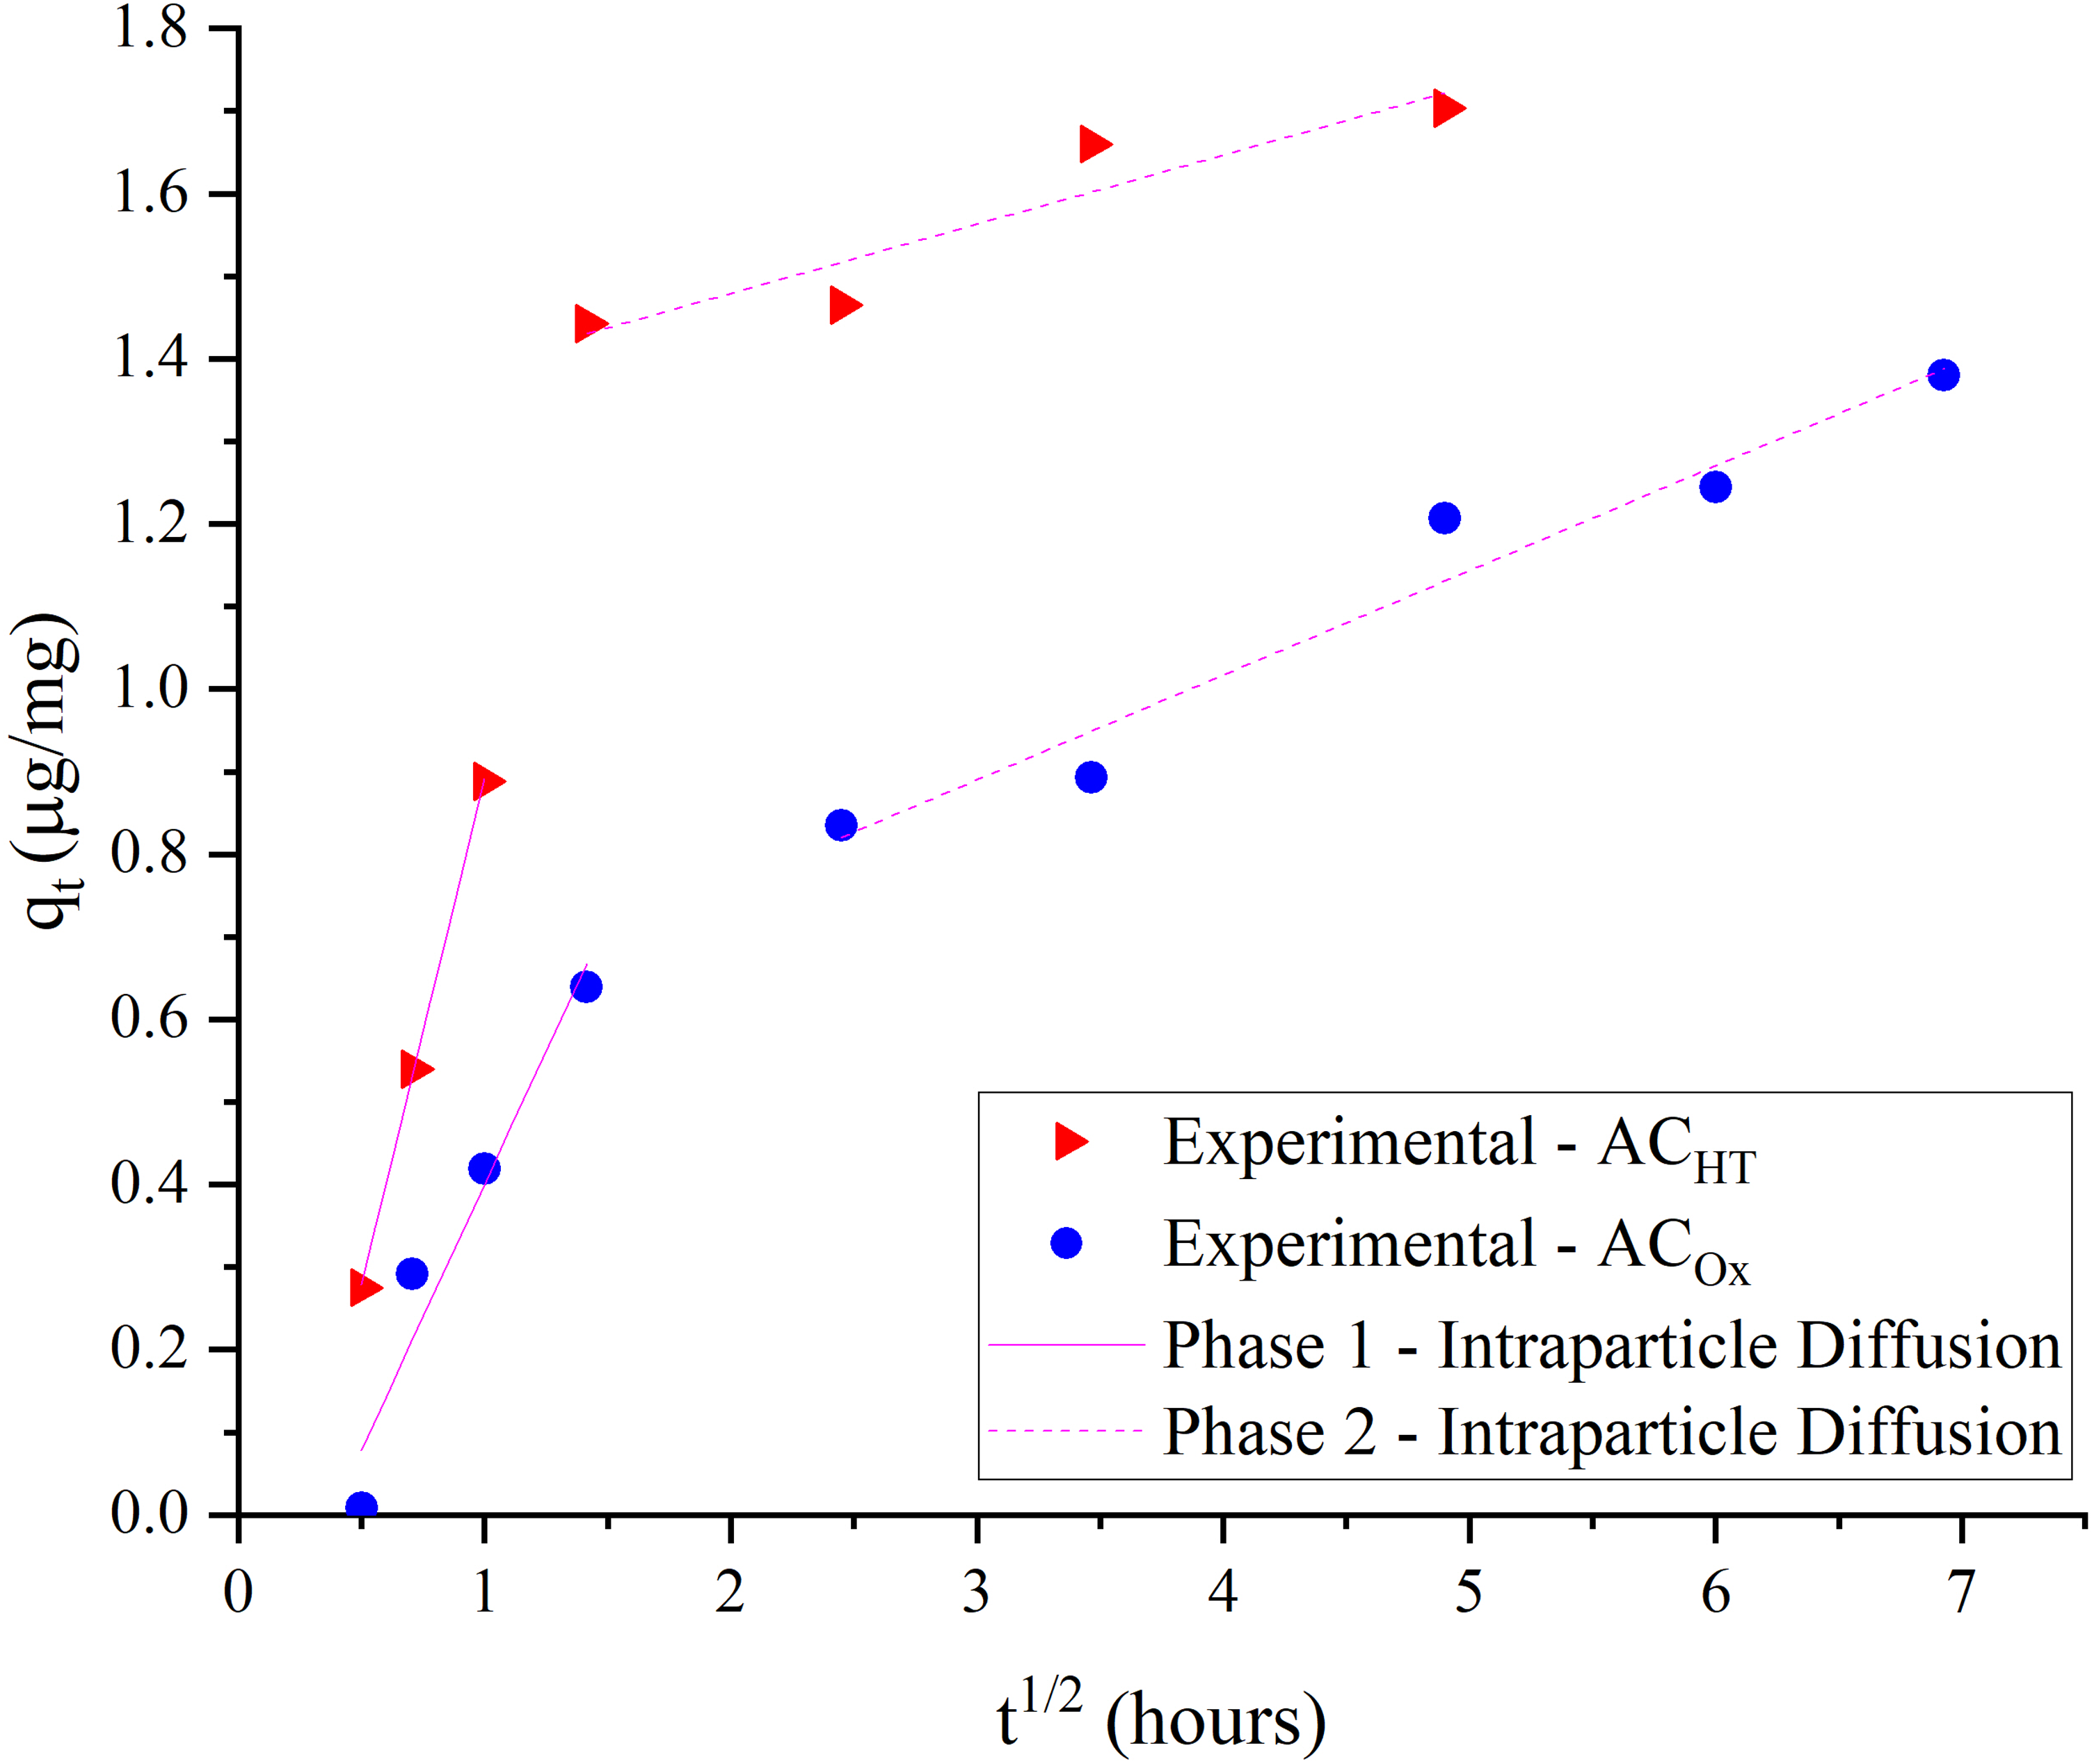
Intraparticle diffusion fit for CYN adsorption onto ACOx and ACHT.
Adsorption isotherms
Based on the results obtained from the kinetic assays, 24 and 48 h were selected as appropriate contact times to carry out the equilibrium adsorption experiments onto ACHT and ACOx, respectively. For all the employed AC dosages, ACHT showed significantly higher CYN removal (Figure 7). For a carbon dosage of 7 mg L−1, for example, the removal for ACHT and ACOx were ∼ 90 and ∼ 70%, respectively.

CYN removal as a function of the applied carbon dosage. The error bars represent the standard deviation of measurements for CYN's remaining fraction of two separate batches.
Figure 8 depicts the experimental CYN adsorption isotherms and the corresponding fits to the Langmuir, Freundlich, and Redlich-Peterson models. The data fitted relatively well to all these models, with R² always greater than 0.94 (Table 5). The best fit was verified for the Langmuir model (R² was 0.95 and 1 for ACHT and ACOx, respectively), which suggests that the adsorption process is better described by the formation of a monolayer on an energetically homogeneous surface, without cooperative interaction between adjacent adsorbed molecules. Adjusting the Redlich-Peterson model corroborates these results, with values of β close to 1 (Hall et al., 1996; Ray et al., 2020).

Nonlinear regression fit of equilibrium data to isotherm models for ACOx and ACHT.
Equations of the Langmuir, Freundlich, and Redlich-Peterson models and respective parameters values determined from the fitting of the experimental data for CYN equilibrium adsorption.

Ce: equilibrium concentration; qe: adsorbed amount; R2:coefficient of determination; RSS: residual sum of the squares; qmax: adsorption capacity; KL: Langmuir adsorption constant; RL: separation factor, calculated as (1 + KL C0)−1; KF: Freundlich adsorption capacity constant; 1/n: adsorption intensity constant from Freundlich; KR and aR: constants of the Redlich-Peterson isotherm; β: exponent of the Redlich-Peterson isotherm.
In a similar way as verified in the kinetic studies, the adsorbent ACHT also showed better performance than ACOx for CYN adsorption in the equilibrium tests. For ACHT, the Langmuir adsorption capacity (qmax), the Langmuir adsorption constant (KL), and the Freundlich adsorption capacity constant (KF) were 2.52 µg mg−1, 1.93 L µg−1, and 1.77 μg mg−1 L1/n μg−1/n, respectively, while the corresponding values for ACOx were 1.90 µg mg−1, 0.76 L µg−1, and 1.13 μg mg−1 L1/n μg−1/n.
By reordering the Langmuir equation, it is possible to obtain an equation that permits to estimate the AC dosage (D) needed to reduce the initial CYN concentration from a given initial value (C0) to another target concentration (Ce) (Equation 4). For example, it permits to predict that ACHT and ACOx dosages equal to 8.5 and 16.6 mg L−1 are needed to reduce the CYN concentration from 15 µg L−1 (the initial concentration employed in the present work) to 1 µg/L, the maximum concentration permitted by the Brazilian Health Ministry Consolidation Ordinance n. 888 (2021) for human water supply. These results illustrate very well the importance of tailoring the surface chemical composition of the AC to be used.
Freundlich and Langmuir isotherm parameters in CYN adsorption studies onto activated carbons in ultrapure water matrix (data reported in the literature).

Not provided.
In turn, Liu assessed the CYN adsorption onto various ACs and fitted the data to the Freundlich model. The wood-based AC showed the best performance amongst all, with the highest KF (µg mg−1 L1/n μg−1/n). The author attributed the best performance of this AC to its highest mesopore volume, which would promote a more efficient toxin diffusion throughout the pore network. The kF values obtained by Liu were all considerably higher than those observed for ACHT and ACOx in the present work.
Rapid small-scale column tests
Figure 9 depicts the breakthrough curves obtained from RSSCTs performed with the modified carbon ACHT, as this material demonstrated the best performance on bench-scale adsorption assays.

CYN breakthrough curves obtained in RSSCT tests performed with CYN-spiked ultrafiltered Paranoá Lake water matrix. The error bars represent the standard deviation of measurements for CYN's remaining fraction of two separate tests.
RSSCT columns operated for roughly 16 h; the operation was interrupted as the upstream pressure rose 2 bar, leading to water leakage in the column's feeding piping and AC bed destabilization.
RSSCT columns reached the breakthrough after treating a water volume equivalent to 4384 bed volumes at the first batch and 3806 at the second, resulting in an average of 4095 bed volumes. Thus, CYN residual concentration in the effluent from a full-scale GAC column designed for a 10 min EBCT would exceed the level of 1 µg L−1, established by the Brazilian Health Ministry Consolidation Ordinance n. 888. (2021), at 28 days (Equation 3).
In turn, the calculated average length of the RSSCT column's mass transfer zone (Equation 5) was 1.95 cm, indicating a notable 78% utilization of the AC bed. Additionally, the breakthrough curves exhibited a less steep slope during the initial stages of the tests, followed by a gradual rise in the effluent concentration of CYN. This behavior suggests the presence of extensive mass transfer zones along the length of the bed (Çeçen and Aktas, 2011).
To our knowledge, Antonietti and Ginoris (2022) are the first and only to have evaluated CYN removal in fixed-bed adsorber columns. The authors proposed predicting the CYN breakthrough curve of full-scale post-filtration adsorption columns onto wood-based GAC using the homogeneous surface diffusion model (HSDM) along with the methodology of short bed adsorber tests (SBAs) to obtain the mass transfer coefficients, Kf and Ds, essential parameters for simulating the full-scale column operation using the HSDM model. The SBA tests were conducted using wood-based AC with an average particle size of 0.855 and used an aqueous matrix CYN-spiked ultrafiltered surface water with 100 µg L−1 concentration. The Kf and Ds parameters were equal to 9 × 10⁻⁶ m s−1 and 3 × 10⁻¹⁶ m² s−1, respectively.
Antonietti e Ginoris also conducted simulations by varying the EBCT and observed a correlation between EBCT time and the lifespan of the adsorbent. Specifically, an increase in EBCT time resulted in more extended breakthrough. The optimal carbon utilization rate was found to be 0.43 kg m−³ for an EBCT of 10 min, achieving a breakthrough time of 183.6 h. Though, direct comparisons between RSSCTs and HSDM model simulations are not possible due to the inherent differences in such methodologies.
In sum, RSSCT tests proved to be a practical approach for assessing adsorption breakthrough behavior in GAC columns, especially when optimizing adsorption processes for water treatment applications.
Conclusions
Two ACs with different content of oxygenated functional groups were attained. Despite its lower porosity and specific surface area, the AC with low acidity (ACHT) presented better kinetics and capacity for CYN adsorption than the adsorbent with elevated acidity (ACOx). These results suggest that the presence of acidic oxygenated functional groups hinders CYN adsorption, at least at the studied conditions. In contrast, the use of a nearly neutral AC such as ACHT (PZC 6.1) favors the interaction of the adsorbate with the material surface, which supposedly takes place mainly through hydrophobic dispersive interactions.
RSSCT allowed for estimating a breakthrough of approximately 28 days for a full post-filtration adsorber column designed with 10 min-EBCT, an average grain diameter of 0.855 mm and an operation hydraulic load of 200 m d−1. The design was tailored to effectively treat ultrafiltered surface water with a CYN concentration of 15 µg L−1.
The results presented in this study are very promising for using AC as adsorbent for CYN removal from water. However, further studies should be conducted to validate the type of proportional intraparticle diffusivity assumed in the RSSCTs. Additionally, conducting small-scale column tests with variations in critical design parameters, such as surface application rate, average diameter of AC grains, EBCT, and toxin concentration, is highly recommended. These tests will allow the optimization of the full-scale design for enhanced performance and efficiency in toxin removal within practical water treatment applications, as well as, provide data to thoroughly assess the application and regeneration costs associated with employing GAC columns for CYN removal.
Footnotes
Acknowledgments
We acknowledge the University of Brasília for providing the means to develop this research and for the financial support. The authors also thank CAESB for providing the base water matrix. We acknowledge Daniel V. Cárdenas and the staff of the Environmental Sanitation Laboratory and the Materials and Fuels Laboratory of the University of Brasilia for their cooperation.
Author contributions
Conceptualization: H.RN., M.J.P, and Y.P.G.; methodology: H.R.N, M.J.P, and Y.P.G.; validation: H.R.N., M.J.P., and Y.P.G; formal analysis: H.R.N., M.J.P., and Y.P.G.; investigation: H.R.N.; data curation: H.R.N., M.J.P., and Y.P.G.; writing—original draft preparation: H.R.N.; writing—review and editing: M.J.P. and Y.P.G.; supervision: Y.P.G. and M.J.P.; project administration: Y.P.G.; funding acquisition: Y.P.G. All authors have read and agreed to the published version of the manuscript.
Data availability
All data generated or analyzed during this study are included in this published article. No AIF related data was generated in this study.
Declaration of conflicting interests
The authors declared no potential conflicts of interest with respect to the research, authorship, and/or publication of this article.
Funding
The authors disclosed receipt of the following financial support for the research, authorship, and/or publication of this article: This research was partially funded by the Post-Graduate Provost Board (DPG) of the University of Brasília grant numbers 0004/2021 and 0010/2023. The author’s Scholarship granted Coordination for the Improvement of Higher Education Personnel (Capes), grant number 88887.495602/2020-00.