
Abstract
In this study, natural clay, iron oxide, and iron powder were combined to develop low-cost iron mixed porous pellet adsorbent for arsenate and arsenite removal from aqueous solution in batch experiments. The augmented simplex centroid mixture design was applied to obtain the optimum proportion of each constituent. Higher correlation coefficient of the models (R2 > 0.95), good distribution of residuals, and lower values of p value (<0.05) indicated that the method is suitable for determining the optimum mixture proportion. Extensive decrease of both arsenate and arsenite adsorption occurred in the alkaline condition (pH > 9). Kinetic and isotherm experimental data of both arsenate and arsenite were well described by the pseudo-second order and Sips models, respectively. The maximum adsorption capacity of arsenate and arsenite derived from Sips model were 13.33 and 19.06 mg/g, respectively. The separation and heterogeneity factors showed that both arsenate and arsenite were favorably adsorbed. Among coexisting anions, phosphate significantly showed negative effect on the adsorption of either arsenate or arsenite. The adsorbent could be effectively reused for several times after its regeneration and was considered as non-hazardous material after adsorption.
Introduction
Contaminated water causes sickness or death for millions of people, especially those living in developing countries. Toxic pollutant is one of the major sources of contamination and among of the most highly toxic and carcinogenic elements is arsenic (As). The United State Environmental Protection Agency (US EPA) considers it the number 1 toxin in its list of prioritized pollutants and the International Agency for Research on Cancer categorizes it as a Class I human carcinogen (Ng et al., 2003). Arsenic, either resulting from natural processes or anthropogenic activities, has polluted drinking water sources in more than 70 countries and has put more than 100 million people worldwide at health risk (Brammer and Ravenscroft, 2009; Sigdel et al., 2016). The health problem related to excessive and long-term exposure to arsenic contaminated water is commonly termed arsenicosis including skin issues, cancers (skin, kidney, bladder, and lung), diabetes, cardiovascular disease, adverse pregnancy outcomes, and neurological problems (Jezequel and Chu, 2006; Sharma et al., 2014). More than 2.5 million people can develop arsenicosis in the next 50 years (Glocheux et al., 2013). Due to its potential for adverse health consequences, the World Health Organization has decreased the maximum contaminant level of arsenic in drinking water from 50 ppb to 10 ppb (Masih et al., 2009).
Drinking arsenic contaminated water is a main pathway for the toxin to enter the human body since arsenic lacks taste, color, and odor (Mondal et al., 2013; Sharma et al., 2014). Normally, arsenite (As(III)) and arsenate (As(V)) are the common forms presented in natural water. As(V) predominates in oxygen-rich environments like surface water, whereas As(III) favors and predominates in reducing environments like groundwater and more toxic than As(V) (Genc-Fuhrman et al., 2005; Katsoyiannis and Zouboulis, 2002). As(III) is possibly oxidized to As(V) via various methods and generally a pretreatment is applied before any treatment. However, pretreatment can consume lots of time, add additional cost, and produce toxic by-products. So, removing both As(III) and As(V) from contaminated water is preferred. Among arsenic treatment techniques, adsorption is a more suitable and promising method due to its low-cost, high uptake performance, simple operation and maintenance, scale flexibility, and sludge-free generation (Masih et al., 2009; Sabbatini et al., 2009). Arsenic removal efficiency through adsorption significantly depends on the nature and characteristic of an adsorbent that can either be natural or synthetic materials such as commercial and synthetic activated carbons, agricultural products or by-products, industrial by-products or wastes, and metal oxides (Mohan and Pittman, 2007). Currently, developing a low-cost and effective adsorbent with natural materials has gained more attention because of the cost reduction and plausibility of a real application.
Natural clay is popularly used as an adsorbent for removing pollutants owing to its large surface area, abundance and availability, low-cost, recycled ability, and non-toxicity (Kumrić et al., 2013; Sdiri et al., 2011; Srinivasan, 2011). However, natural clay expresses low adsorption efficiency toward arsenic most probably due to negative charge on its surface. Hence, applying natural clay to support metal oxides to enhance the adsorption capacity is needed. Of the metal oxides, iron oxide and elemental iron are well known for high affinity and adsorption capacity to arsenic and widely used to remediate arsenic from water; however, application in powder forms of those metal oxides expresses a difficulty of liquid and solid separation after adsorption process and it is very expensive to synthesize for large scale application (Bhowmick et al., 2014; Dousova et al., 2009; Sigdel et al., 2016). Clay supported metal oxides has been proved to remove some pollutants through various studies such as Pb(II) and Zn(II) removal by ceramisite produced from bentonite, iron powder, and activated carbon (Yuan and Liu, 2013); As(V) adsorption on adsorbents made from clay, iron oxide, and starch (Chen et al., 2010); Cr(VI) and As(V) removal by zero-valent iron and iron oxide-coated sand adsorbent (Mak et al., 2011); As(III) and As(V) removal by montmorillonite-supported zero valent iron (Bhowmick et al., 2014); and As removal by iron mixed ceramic pellet (Shafiquzzam et al., 2013). However, application of a systematic method to determine optimal proportion of each material for more effective adsorbent to remove both As(III) and As(V) is still limited.
The present study mainly aimed to develop porous pellets produced from natural clay to support iron oxide and iron powder to be a low-cost and effective adsorbent for both As(III) and As(V) removal from water. The augmented simplex centroid mixture design was applied to optimize the proportion of each constituent for the high response adsorption efficiency. The new optimized porous pellet adsorbent was characterized and also investigated for As(III) and As(V) adsorption in term of kinetics, isotherms, effect of solution pH, effect of coexisting anions, regeneration and leaching test.
Materials and methods
Materials and chemical reagents
Natural clay used in this study was collected from Dankwian District, Nakhon Ratchasima 30000, Thailand. The clay was cleaned with deionized (DI) water to remove debris and large particles, dried at 104 ± 1℃ for 24 h, crushed and sieved to achieve the particle size passing through a 200-mesh (<75 µm) sieve. Iron oxide powder (Fe2O3 > 95%, Himedia, India) was supplied by Italmar chemical supply company (Thailand). Iron powder (Fe > 96%, Xuzhou First Chemical Co., Ltd.) was purchased from a local supply store. Rice bran powder (chemical composition: P2O5 53.744 wt.%, K2O 17.316 wt.%, SO3 12.828 wt.%, MgO 7.569 wt.%, SiO2 5.362 wt.%, and CaO 2.237 wt.%) was obtained from a local grinding mill. As(V) and As(III) stock solutions (100 mg/L) were prepared by dissolving appropriate amount of Na2HAsO4·7H2O and NaAsO2 (Sigma Aldrich), respectively. NaCl, NaNO3, NaHCO3, Na2CO3, Na2SO4, and NaH2PO4 were used to prepare for anion solutions of chloride (Cl−), nitrate (
Adsorbent development
The porous pellet adsorbent was developed from mixing natural clay (NC), iron oxide powder (Fe2O3), iron powder (IP), and rice bran powder (RB) at a specific mass proportion with DI water. The ratios of NC:Fe2O3:IP were selected by the mixture design method and the mass proportion of RB was constantly kept at 15% of the total mass. The prepared powders were uniformly mixed with addition of water to form a paste. The paste was continually stirred and pressed into long cylindrical shape with 1–1.5 mm in diameter by a plastic syringe. The long pellet was cut into 1–2 mm in length, placed in clean crucibles, dried at 60℃ for 24 h, and further heated at 600℃ for 1 h in a muffle furnace to carbonize and produce pores. After cooling down, the finished product was kept in a dry and clean container for further experiments.
Mixture design and statistical analysis
Mixture design approach is a type of experimental design used for analyzing the relationships between mixture components and responses, and for determining the best proportions of mixture components to obtain a final product in accordance with the target (BahramParvar et al., 2015). The proportion of a component in the mixture must be between 0 and 1 and the sum of the proportion of all mixture components is equal to 1 (Rosales et al., 2015). In this study, a three component augmented simplex-centroid mixture design was used to formulate different mixtures of independent variables, i.e. NC (X1, wt.%), Fe2O3 (X2, wt.%), and IP (X3, wt.%), and to assess the relationship of the mixtures to the responses, As(V) and As(III) adsorption efficiency (Y1 and Y2, respectively). For the aspect of economy and being a binder, the amount of NC should be used more than others, i.e. Fe2O3 and IP serving as active site providers to the adsorbent. Therefore, constraints on individual component were applied and selected to be 50% < X1 < 90%, 5% < X2 < 45%, and 5% < X3 < 45% in the form of X1 + X2 + X3 = 100%. Totally, 10 different mixture design points were obtained and illustrated in Figure 1. The general polynomial function of the mixture models is represented by the following equation (Scheffe, 1963):
The overall instinct design points based on the three-component augmented simplex-centroid design.

Batch adsorption study
Batch mode was employed to conduct adsorption experiments that were carried out at room temperature (25 ± 1℃) in acid washed 60 mL polyethylene bottles with an agitation speed of 150 rpm on a horizontal mechanical shaker (New Brunswick Scientific, Canada). For kinetic study, a series of adsorption between 10 g/L of adsorbent and 10 mg/L of either As(V) or As(III) solution (pH = 7 ± 0.1) was prepared and shaken for 0 to 72 h. While shaking, samples were taken at preset time intervals. Isotherm experiments were performed with As(V) or As(III) concentration ranging from 0.5 to 100 mg/L. Effect of solution pH was conducted by varying pH from 3 to 11. Effect of coexisting anions were investigated using 10 g/L of adsorbent and 10 mg/L As(V) or As(III) solution (pH = 7 ± 0.1) containing 0.1, 1, and 10 mM of Cl−,


Adsorbent regeneration and arsenic leaching test
In order to observe the potential reuse of the adsorbent, three consecutive regeneration cycles were conducted. The adsorbed adsorbent of 10 g/L was dispersed in 25 mL of 1 M NaOH and shaken for 24 h. The desorbed adsorbent was washed several times with DI water and then reused to remove 10 mg/L of As(V) or As(III). Leaching of either As(V) or As(III) from the adsorbed adsorbent was examined using the US EPA Toxicity Characteristic Leaching Procedure (TCLP). The adsorbed adsorbent was mixed with the TCLP extraction fluid (5.7 mL of glacial acetic acid added to 500 mL of DI water and diluted to 1 L, pH 2.91) at a ratio of 1:20 and shaken with a mechanical shaker for 18 ± 2 h. The samples were filtered with 0.22 µm syringe filters and the filtrates were acidified and analyzed for As (V) or As(III) concentration.
Analytical methods
As(V) or As(III) concentration was measured by inductively coupled plasma-optical emission spectrometry (ICP-OES) (Optima 8000DV, PerkinElmer) using a wavelength of 193.7 nm. Elemental composition analysis was carried out with Energy Dispersive X-Ray Fluorescence (ED-XRF, XGT-5200 X-ray Analytical Microscope, HORIBA Ltd., Japan). The surface area, total pore volume, and average pore diameter were obtained from the Brunauer–Emmett–Teller (BET) method using the BET analyzer (BELSORP Mini II, BEL Inc., Japan). X-ray diffraction (XRD) for mineralogical phases was performed using the Bruker XRD (D2 PHASER). The morphological features of adsorbent before and after adsorption were examined by a scanning electron microscope (SEM, JSM-6010LV, JEOL, Japan) and the Fourier transform infrared spectra (4000–400 cm−1 at a resolution of 4 cm−1) was recorded using a PerkinElmer spectrum GX spectrophotometer (FT-IR) instrument. The point of zero charge (pHpzc) was evaluated by the equilibrium method (Su et al., 2011).
Results and discussion
Model fitting and analysis of variance (ANOVA)
Experimental design points and obtained responses, R(%)-As(V) and R(%)-As(III) measured in two sets (M1 and M2), for the corresponding mixtures.
Models with linear, quadratic, and special cubic degrees were applied to predict the independent variables and the responses. Run by the Minitab software, statistical parameters such as standard deviation (S), predicted sum of squares (PRESS), and predicted regression coefficient (R2) were obtained for linear (S = 7.224, PRESS = 1333.0, R2 = 0.8145), quadratic (S = 4.466, PRESS = 437.3, R2 = 0.9391), and special cubic models (S = 3.221, PRESS = 249.9, R2 = 0.9652) in case of the As(V) response, and for linear (S = 9.907, PRESS = 2424.9, R2 = 0.7973), quadratic (S = 4.331, PRESS = 389.7, R2 = 0.9674), and special cubic models (S = 3.831, PRESS = 358.5, R2 = 0.9700) in case of the As(III) response. The model with lower standard deviation and predicted sum of squares and higher predicted regression coefficient is a better one to predict the response data (Abdullah and Chin, 2010; Rao and Baral, 2011). Thus, special cubic model was the most suitable to fit the experimental data of both responses.
Analysis of variance for all the responses.

The polynomial equations of the selected models for both responses can be expressed as follows:


Residual graphs
The residual values are used to construct normal probability plots for evaluating the normal distribution of the data. The data are considered as normal distribution when the plotted points are close to the fitted straight line (Rostamiyan et al., 2014). Apparently, the plotted points for both cases seem closer to the distribution line, indicating the data were normally distributed (Figure 2).
Normal probability plots for (a) As(V) response and (b) As(III) response.
Contour plots of the responses
A contour plot shows a detail effect on a certain response value by various establishing interactions of the mixture components in a two-dimensional view. Figure 3 illustrates the mixture contour plots of As(V) and As(III) responses resulting from the effect of the component interactions. The different desirable values of the responses were obtained and varied by changing in color. The darker color of the regions represents higher adsorption efficiency of the responses. For both responses, the maximum removal efficiency occurred toward the edge of Fe2O3 and IP with IP as vertex. This implies that adding Fe2O3 and IP proportion into the mixture improved both As(V) and As(III) adsorption efficiency to certain level.
The mixture contour plots of the responses: (a) As(V) and (b) As(III).
Mixture proportion optimization and model validation
Response optimization involves defining independent variable settings that collaboratively produce optimized responses, and its satisfactory is measured by the composite desirability (Rao and Baral, 2011). The desirability is scaled from 0.0 (undesirable) to 1.0 (very desirable) (Shahamirifard et al., 2016). In the present study, the response optimization was processed using Response Optimizer of Minitab that identifies a combination of independent variables (NC, Fe2O3, and IP) to jointly optimize adsorption efficiency of As(V) and As(III). Figure 4 presents the optimization plot of independent variables affecting the predicted As(V) and As(III) adsorption efficiency. Independent variable settings on the plot could be adjusted by moving the vertical red line to obtain more desirable predicted responses. To obtain high composite desirability with a high comparable adsorption efficiency of both As(V) (91.3217%) and As(III) (91.8716%) by using less amount of iron oxide or iron powder as possible, the ideal mixture proportion of the materials is 0.5215 of NC, 0.1922 of Fe2O3, and 0.2863 of IP. The predicted As(III) desirability, As(V) desirability, and composite desirability were found to be d = 0.93048, d = 0.91826, and d = 0.9243, respectively, which were close to 1, indicating that the selected mixture ratio has a significant positive effect on maximizing the As(V) and As(III) adsorption efficiency (Rao and Baral, 2011). The optimum components were used to develop the porous pellet adsorbent for the As(V) or As(III) adsorption to validate the model. The results indicated that the As(V) and As(III) removal efficiency were 91.40% and 92.57%, respectively, comparable enough to the predicted values, suggesting that the predicted models were valid and adequate.
The mixture optimization plot for As(V) and As(III) responses.
Characterization of the developed adsorbent
Chemical composition (wt.%) of natural clay and porous pellet adsorbent analyzed by XRF.


XRD pattern of the iron mixed porous pellet adsorbent.
Figure 6 shows the surface morphological features of the adsorbent before and after adsorption. The porous pellet adsorbent has a cylinder shape with numerous pores surrounding the surface, developed by carbonization of rice bran (Figure 6(a)). The scattered rough surface structure was observed before adsorption (Figure 6(b)). This indicated the spreading of iron oxide and iron powders to form heterogeneity on the surface. After adsorption of As(V) and As(III) (Figure 6(c) and (d), respectively), similar morphology of the surface were observed. The surface became smoother, consisted of small pores and seemed to be layered by various sizes of flat sheet. This is probably due to the binding between arsenic and iron species on the layer-structure of clay.
SEM images of (a) shape of porous pellet (×25), (b) surface of porous pellet before adsorption, and porous pellet after adsorption (c) As(V) and (d) As(III).
The FTIR spectra of the adsorbent before and after As(V) and As(III) adsorption showed that the major peak bands were observed in the wavenumber range from 400 to 1200 cm−1 (Figure 7). The peak band of 1029.94 cm−1 and 800.42 cm−1 was assignable to the stretching vibration of Si–O–Si group and Si–O deformation (Nayak and Singh, 2007; Petala et al., 2013; Tandon et al., 2013). The band of 692.41 cm−1 corresponds to the spectrum for iron oxide (Fe2O3) (Li et al., 2010). The peak bands of 524.62 and 437.82 cm−1 could be assigned to the vibration of Si–O–Al and Fe–O groups, respectively (Chen et al., 2011; Li et al., 2016). After As(V) and As(III) adsorption, reduction of stretching the peak bands, increase of transmittance percent of corresponding bands, and no presence of new peak bands were observed. This could be reasoned by As(V) and As(III) in the solution mostly adsorbed on the surface of the adsorbent (Chen et al., 2011).
FTIR spectrum of porous pellet before and after As(V) and As(III) adsorption.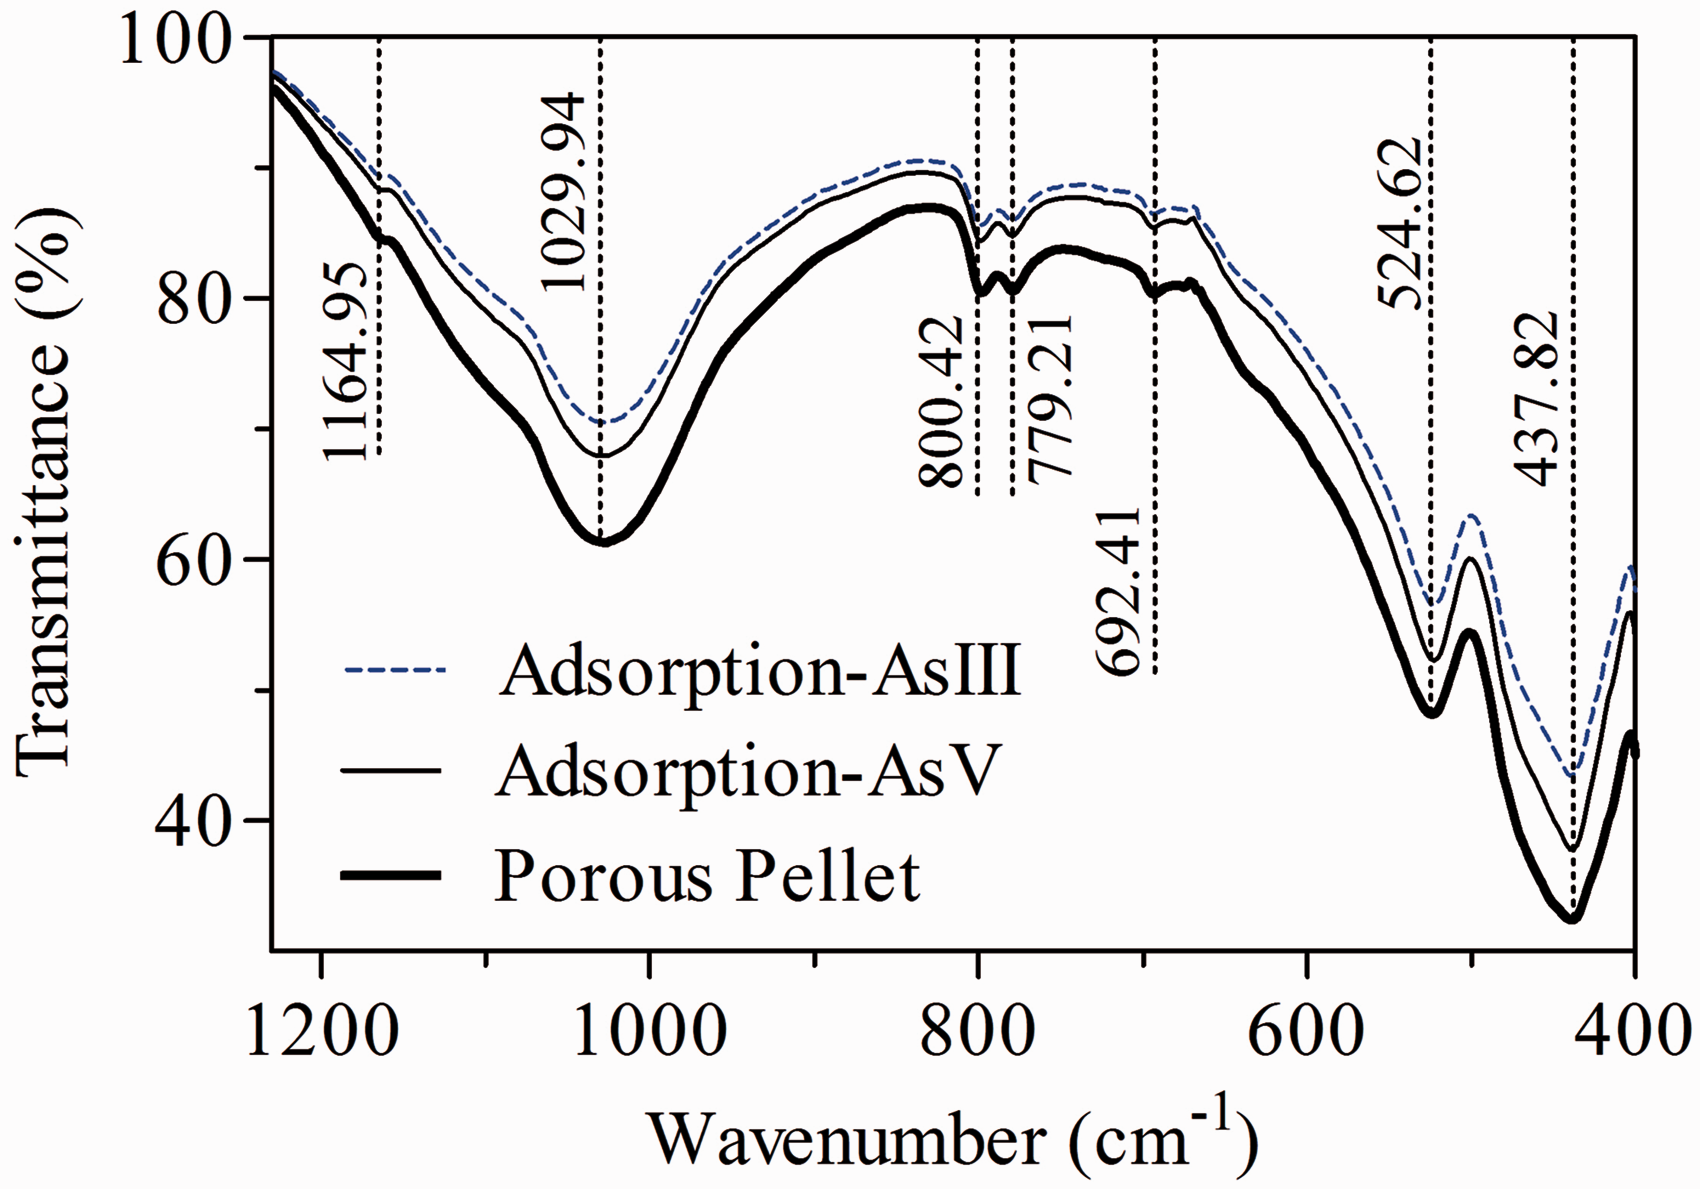
Adsorption kinetics
Kinetic study illustrates the chemical rate of adsorption process between adsorbate and adsorbent by observing the speed of a chemical reaction until reaching its equilibrium in a particular amount of time (Sen Gupta and Bhattacharyya, 2011). Adsorption performance of As(III) and As(V) onto porous pellet adsorbent dependent on time along with the fitting kinetic models showed a similar trend, which an initial wide availability of active sites provides a rapid uptake first and the filling up of active sites slows down and stabilizes the adsorption process within 72 h (Figure 8). Kinetic experimental data were fitted to the pseudo-first-order and pseudo-second-order models defined as (Far et al., 2012; Salameh et al., 2010)
Time dependent for (a) As(III) and (b) As(V) adsorption onto the adsorbent.


Kinetic parameters of As(III) and As(V) uptake onto the adsorbent.

Effect of solution pH
As(V) adsorption capacity gradually decreased with the pH range from 3 to 7 and significantly decreased when pH was more than 7 (Figure 9). For As(III) adsorption, the removal capacity was not remarkably changed over the pH range from 3 to 9. Both As(V) and As(III) adsorption dramatically declined as pH raised above 9. Arsenic speciation and the characteristic of adsorbent surface importantly influence the adsorption capacity over various solution pH. In water, As(V) mainly exists in the form of H3AsO4 at pH less than 2.2, Effect of solution pH onto As(III) and As(V) adsorption by the adsorbent.
Isotherm study
Isotherm study was conducted to determine the characteristic of the adsorption and the maximum adsorption capacity of the adsorbent. The isotherm models such as the Langmuir, Freundlich, and Sips models were applied to predict the equilibrium isotherm data. The isotherm models were expressed as follows (Foo and Hameed, 2010; Jung and Ahn, 2016):
Isotherm study of As(III) and As(V) adsorption onto the adsorbent.


Isotherm parameters of As(III) and As(V) uptake onto the adsorbent.
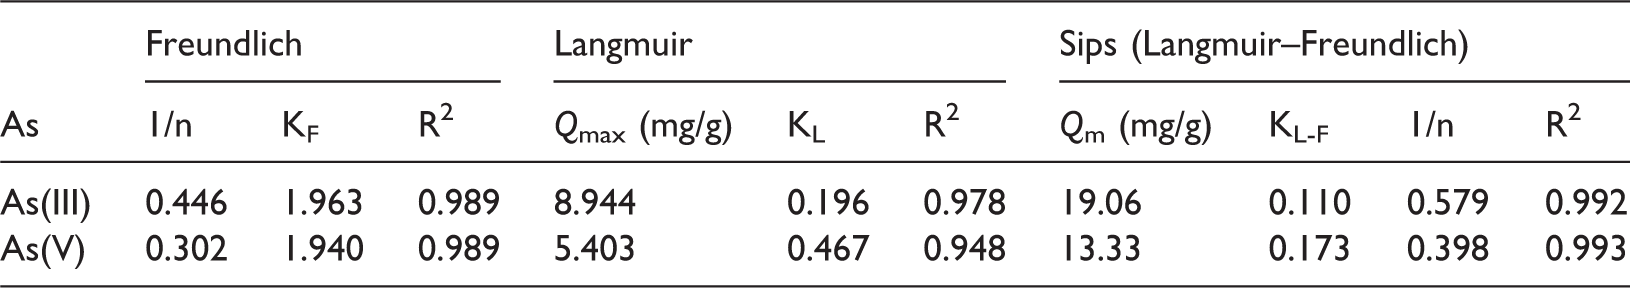
The characteristic of the adsorption can be determined through either the value of a dimensionless constant separation factor (RL) or the Freundlich constant (1/n). The separation factor was calculated by RL = 1/(1 + KLCo), where Co (mg/L) is the initial As(V) or As(III) concentration. The adsorption process is irreversible (RL = 0), favorable (0 < RL < 1), linear (RL = 1), and unfavorable (RL > 1) (Khan and Khan, 2015). Similarly, the magnitude of the adsorption intensity, 1/n, can suggest the type of isotherm from the Freundlich model. The adsorption is favorable when 0 < 1/n < 1, irreversible when 1/n = 1 and unfavorable when 1/n > 1 (Fufa et al., 2014). The values of 1/n for As(III) and As(V) were 0.446 and 0.302, respectively. Plus, for the studied initial concentration range, the RL values for As(III) and As(V) adsorption were in the range of 0.05–0.91 and 0.02–0.81 (within 0 to 1). This showed that the adsorbent expressed a favorable adsorption toward As(V) or As(III). Noticeably, higher initial arsenic concentration tends to lead the adsorption to an irreversible isotherm and the adsorption approaches a linear isotherm at lower initial arsenic concentration.
Effect of coexisting anions
A similar trend of the influence of inorganic anions introduced separately and jointly on As(III) and As(V) adsorption was observed (Figure 11). The presence of Cl− over the studied concentration range showed no significant effect on the adsorption. The anions Effect of coexisting anions on the removal of (a) As(III) and (b) As(V) by the adsorbent.
Adsorbent regeneration and arsenic leaching test
The ability of the adsorbent to be regenerated and reused for As(III) and As(V) adsorption is presented in Figure 12. Apparently, the adsorption efficiency of As(III) and As(V) gradually decreased when the number of regeneration cycle increases. However, after the third regeneration time, the adsorbent could still maintain its well adsorption performance by being able to remove 84.94% and 83.06% for As(III) and As(V), respectively. In addition, the adsorbent expressed insignificant loss or no physical crush of the particle size. Thus, the adsorbent could be reused effectively for several times through desorption of NaOH treatment.
Reuse of the adsorbent for As(III) and As(V) removal.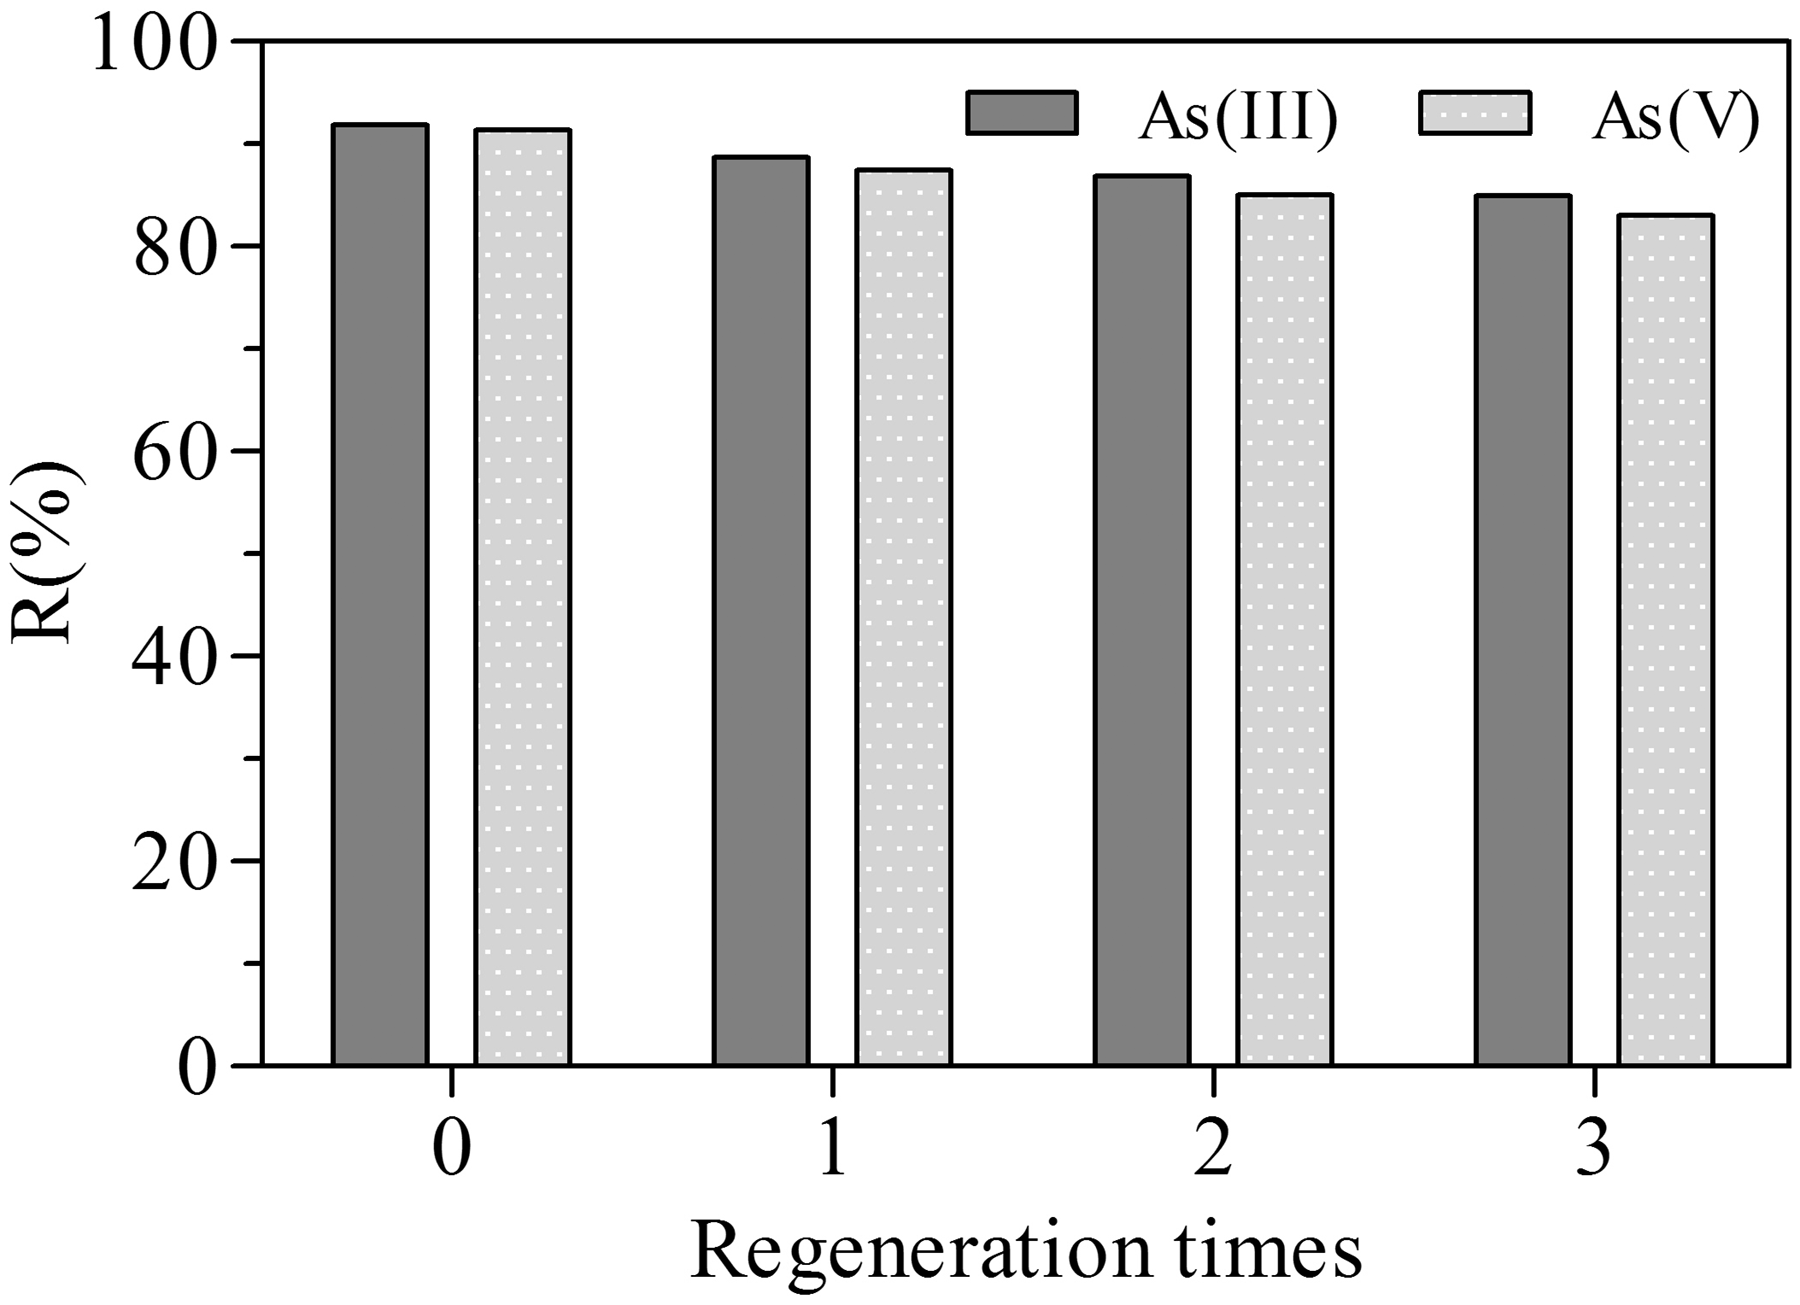
The toxicity characterization leaching procedure was applied to categorize the adsorbed adsorbent as either hazardous or non-hazardous material to be disposed. The US EPA recommends the permissible limit of 5 mg/L for the arsenic concentration in the leachate. The result indicated that As(III) and As(V) concentrations in the leachate were 0.54 and 0.73 mg/L, respectively, which were much lower than that of the limit. Therefore, the spent adsorbent was non-hazardous material and could be safely disposed as a solid waste.
Conclusions
Widely available natural clay could be easily used to bind iron oxide and iron powder to be the effective adsorbent for efficiently removing arsenate and arsenite from water. The augmented simplex-centroid mixture design method was a successful and useful tool to optimize the proportion of the constituent materials of the adsorbent. In the batch adsorption, the optimized adsorbent expressed a favorable adsorption toward both arsenate and arsenite even though the certain extent reduction of the efficiency occurred in the presence of some anions, especially phosphate. The adsorbent maintained high adsorption efficiency after several times of regeneration, was easily separated from the aqueous solution, and was non-hazardous solid waste after adsorption. In addition, regarded the low cost and availability of raw materials, the adsorbent could be cost-effective for arsenic removal from water.
Footnotes
Declaration of Conflicting Interests
The author(s) declared no potential conflicts of interest with respect to the research, authorship, and/or publication of this article.
Funding
The author(s) disclosed receipt of the following financial support for the research, authorship, and/or publication of this article: This study was supported by the Center for Scientific and Technological Equipment, and School of Environmental Engineering, Institute of Engineering, Suranaree University of Technology, Nakhon Ratchasima 30000, Thailand.