
Abstract
Activated carbons (ACs) were synthesized from golden shower (GS) through chemical activation. Two synthesis processes were used: one-stage and two-stage processes. In the one-stage process, GS that was impregnated with K2CO3 was directly pyrolyzed (GSAC), and the two-stage process consisted of (1) pyrolytic or hydrolytic carbonization to produce biochar or hydrochar and (2) subsequent chemical activation was defined as GSBAC and GSHAC, respectively. The activated carbon’s characteristics—thermal stability and textural, physicochemical, structural, and crystal properties—were thoroughly investigated. Results demonstrated that the characteristics of activated carbons strongly depend on the method used for their synthesis. The Brunauer–Emmett–Teller surface area followed the order GSAC (1413 m2/g) > GSHAC (1238 m2/g) > GSBAC (812 m2/g). The existence of acidic groups was determined through Fourier transform infrared spectroscopy and Boehm titration. The excellent adsorptive capacities of the activated carbons were confirmed from the iodine number (1568–2695 mg/g) and methylene number (143–233 mg/g).
Introduction
Activated carbons (ACs) with high specific surface areas (SBET) play a vital role in adsorbing inorganic and organic compounds in the water treatment process. According to an industry market research report, the global demand for AC is estimated to increase 8.1% per year, and be up to 2.1 million metric tons by 2018 (Freedonia, 2014). Lignocellulose materials have been considered as abundant renewable precursors that can be used for manufacturing ACs at lower cost. Typically, ACs can be synthesized through two well-known processes: physical and chemical activation. The physical activation method often comprises two stages: (1) raw materials pyrolysized to convert into a fixed carbon mass (biochar) that has rudimentary pore structures; and (2) physical activation of biochar by oxidizing gases (i.e., air, CO2, or steam) (Gaspard et al., 2014). Meanwhile, the chemical activation process can be conducted in one or two stages (Basta et al., 2009; Fernandez et al., 2015; Oh and Park, 2002). In the one-stage process, which is the most common method, raw materials are directly mixed with certain activating reagents and the mixture is pyrolyzed. By contrast, the two-stage process comprises (1) a precarbonization process (i.e., pyrolysis or hydrolysis) and (2) chemical activation. Pyrolysis, a dry carbonization process, is conducted at high temperatures (400–1200℃) in an inert atmosphere (i.e., N2 or Ar atmosphere), under vacuum conditions, or under oxygen-limited conditions for producing biochar. In hydrolysis, a wet carbonization process, the raw materials are dispersed in an autoclave containing a given solution (i.e., H2O, NaOH, or H3PO4) (Fernandez et al., 2015). Subsequently, the autoclave temperature is controlled (150–350℃) for 2–24 h at a specific pressure for producing hydrochar (Gaspard et al., 2014).
Several previous investigations have shown that ACs prepared through the two-stage chemical activation process have a larger surface area and higher adsorption capacity than those prepared using the one-stage chemical activation process. For example, Basta et al. (2009) prepared ACs from rice straw using the one-stage and two-stage processes. Their results showed that two-stage KOH activation through prepyrolysis carbonization was more efficient in producing ACs with high SBET and high adsorption capacity for methylene blue (MB). A similar result was reported by other investigators (Kennedy et al., 2004; Oh and Park, 2002). For hydrothermal carbonization, Fernandez et al. (2015) reported that SBET of orange-peel-derived ACs produced from hydrochar in water was twice that of orange-peel-derived ACs in H3PO4 acid solution. ACs with extremely high SBET, synthesized from commercial organic precursors (i.e., furfural, glucose starch, cellulose, eucalyptus sawdust, and saccharides), have been precarbonized through a hydrothermal process (Huang et al., 2014; Sevilla et al., 2011). However, very few studies have compared the characteristics of ACs prepared from the three chemical activation methods.
Notably, activating reagents have a strong effect on AC characteristics. ACs activated by K2CO3 show the highest SBET, nearly 2000 m2/g, compared with those activated by Na2CO3, KOH, NaOH, ZnCl2, and H3PO4 (Hayashi et al., 2000). In another comparison study on the efficiency of chemical agents (i.e., K2CO3 and KOH) in the synthesis of ACs (Okman et al., 2014), ACs activated by K2CO3 and KOH through the optimal carbonization process exhibited similar yields, SBET, and micropore volumes. Furthermore, environmentally friendly chemical agents play a major role in industrial and environmental applications. A strong base (i.e., KOH and NaOH) is hazardous, expensive, and corrosive, while a Lewis acid of ZnCl2 is not only environmentally unfriendly but also creates problems in waste disposal. In particular, K2CO3 is not a hazardous chemical, and it is frequently used in food additives. In addition, mixing methods between a precursor and a chemical agent also play a key role in determining the textural properties of ACs. Ahmadpour and Do (1996, 1997) compared three different mixing methods—physical mixed method, impregnation method, and acid washed and impregnation method. They concluded that two impregnation methods can produce AC with larger SBET and higher micro volume than the physical mixed method. Therefore, K2CO3 was used as a potential activating agent, and the impregnation method was selected in the current study.
Cassia fistula (commonly known as golden shower (GS)) is a very popular ornamental plant in tropical and subtropical regions, and it can be used as a lignocellulose precursor for synthesizing ACs because it is relatively abundant, a renewable resource, and costs less. Hanif et al. (2007) investigated the biosorption of Ni(II) in industrial wastewater by various GS biomasses. The results demonstrated that GS was an excellent biosorbent for Ni(II) removal from industrial effluents. Later, the biosorption of chromium(III) and chromium(VI) in aqueous solutions by untreated and pretreated GS biomass was studied by Abbas et al. (2008). Although GS has been used as a biosorbent for removing heavy metal ions, its characteristics have not been reported.
In this study, GS was used as a lignocellulose precursor for synthesizing ACs through various chemical activation methods using K2CO3. The characteristics of the ACs, comprising thermal, physicochemical, textural, morphological, and crystal properties, surface functional groups, and adsorption capacities for iodine and MB, were thoroughly investigated. In addition, the characteristics of the ACs’ precursors were simultaneously discussed.
Materials and methods
Preparation of feedstock, biochar, hydrochar, and their ACs
Pods of GS were collected from Taipei in Taiwan, and the seeds were removed. The materials shown in online Figure S1 were washed with tap water at least thrice and then with deionized distilled water to remove any adhering dirt or impurity. They were then placed in an oven at 80℃ for 24 h. The dried GS was ground and sieved to obtain particles in the size range from 0.106 to 0.250 mm.
Approximately 50 g of the powdered GS was taken in a porcelain crucible covered with a lid. The crucible was placed in a muffle furnace (Deng Yng DF 40, Taiwan) and then pyrolyzed at 800℃ for 4 h under a limited-oxygen condition for obtaining biochar (GSB). The synthesis procedure of biochar (calcination in a noncirculated air atmosphere, i.e., within lid-enclosed crucible) has been published in our recent work (Tran et al., 2016). Hydrochar (GSH) was prepared through a hydrothermal carbonization process. Approximately 30 g of the powdered GS was mixed with 120 mL of deionized distilled water in a 200 mL Teflon-lined autoclave at 190℃ for 24 h.
ACs were synthesized through chemical activation processes with K2CO3. The precursors (i.e., GS, GSB, and GSH) were immersed in K2CO3 solution with a weight ratio of 1:1 (K2CO3:precursors), and this was followed by pyrolysis in the non-circulated air atmosphere (i.e., within lid-enclosed crucible) at 800℃ for 4 h (Figure 1). Chemically activated GS, GSB, and GSH are referred to by the abbreviations GSAC, GSBAC, and GSHAC, respectively, and GSAC, GSBAC, GSHAC, and GSB were porous carbon materials.
Schematic illustration of the preparation procedure for GS, GSB, GSH, and activated carbons (GSAC, GSBAC, and GSHAC).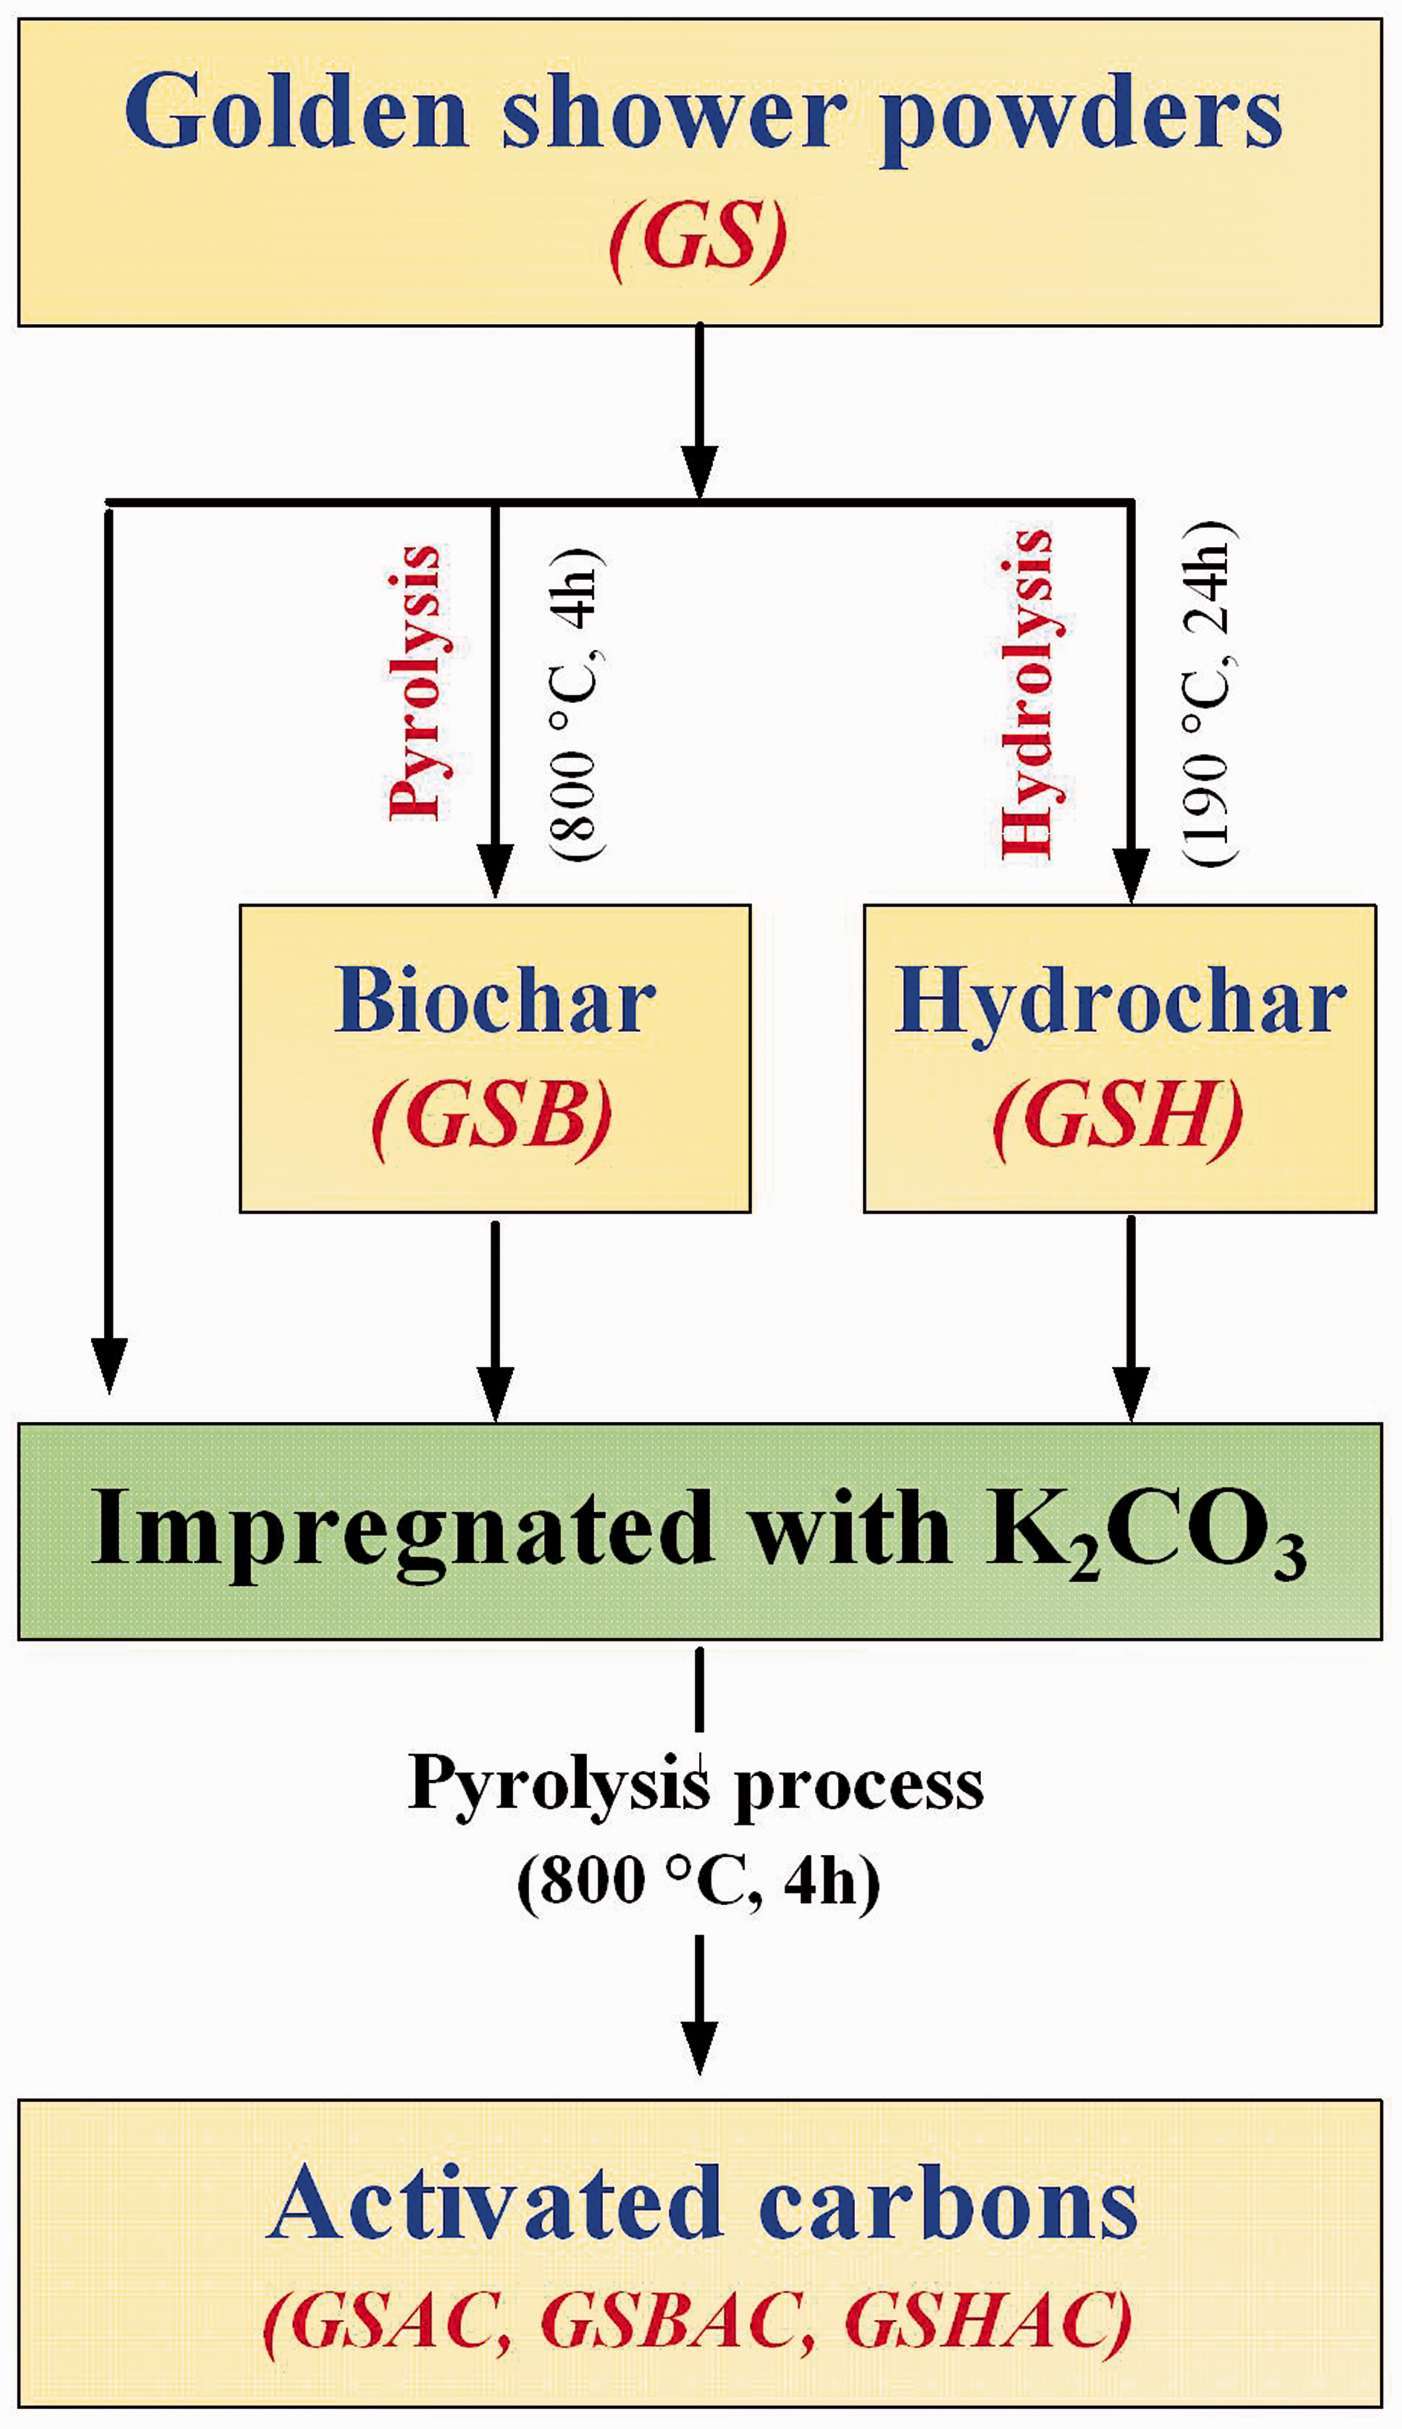
After carbonization, the samples were thoroughly washed with 0.1 M HCl for dissolving ash and inorganic salts. Finally, hot water and deionized distilled water was used to wash the samples until the pH of the filtrates reached a constant value. The samples were then dried and sieved, and they were stored in brown bottles until use.
Characteristics of feedstock, biochar, hydrochar, and their ACs
Thermal characteristics
The thermal stability of ACs and their precursors was measured by thermo-gravimetric analysis (TGA; DuPont TA Q50, USA). The experiment was carried out from room temperature to 900℃ at a heating rate of 10℃/min in an inert nitrogen environment without oxygen.
Physicochemical characterization
Proximate analysis was performed by following an international standard procedure (ASTM). The bulk (apparent) density and hardness (abrasion) number were examined according to the methods published in the literature (Ahmedna et al., 1997).
Textural properties
N2 adsorption–desorption isotherms were measured using a Micromeritics ASAP 2020 sorptometer at 77 K. The Brunauer–Emmett–Teller (BET) method was employed to compute the specific surface areas (SBET). Furthermore, the micropore surface area (Smicro) and micropore volume (Vmicro) were determined using De Boer’s t-plot (statistical thickness) method. The external (nonmicropore) surface area (Sexternal) was calculated as the difference between SBET and Smicro. The total pore volume (Vtotal) was estimated in terms of the amount of adsorption at a relative pressure (P/P0) of 0.98 by using the Horvath–Kawazoe method. Pore size distributions were measured using Brunauer’s MP method, and the nonmicropore volume (Vnon-micro) was computed by subtracting the micropore volume from the total pore volume.
Morphological and crystal properties
The morphology of the adsorbents was obtained using scanning electron microscopy (SEM; Hitachi S-4800, Japan). To identify possible crystalline structures, adsorbents were analyzed using X-ray diffraction (XRD; PANalytical PW3040/60 X’Pert Pro) with Cu Kα radiation (λ = 0.154 nm). The scan angle 2θ covered the range 5° < 2θ < 60° and the scan speed was 3°/min.
Surface chemistry
The functional groups present on the adsorbent surface were detected using Fourier transform infrared spectroscopy (FTIR; FT/IR-6600 JASCO); the adsorbent particles were pelleted using KBr. The spectra were scanned from 4000 to 650 cm−1. The pH value of the adsorbents at the point of zero charge (pHPZC) was determined using the drift method (Tran et al., 2016).
The acidic groups and basic sites on the adsorbent surfaces were determined through Boehm titration by following the standardization protocol proposed by Goertzen et al. (2010). An adsorbent mass of 0.5 g (m) was mixed with 25 mL (Vo) of every NaOH (0.05 M), Na2CO3 (0.05 M), NaHCO3 (0.05 M), and HCl (0.05 M) in a series of 100-mL Erlenmeyer flasks. The flasks were sealed with a Parafilm. After shaken for 48 h using an orbital shaking incubator (S300R-Firstek) at 150 r/min, the mixtures were filtered to separate the adsorbent, and 10 mL (Va) aliquots were then taken by pipette from the filtrates. The aliquots of the reaction base NaHCO3, Na2CO3, and NaOH were acidified by the addition of 20, 30, and 20 mL (VHCl) of HCl (0.05 M), respectively, and then back-titrated with NaOH (0.05 M). Meanwhile, the aliquots of the reaction acid HCl were titrated directly with NaOH (0.05 M). Notably, the titration was performed immediately after CO2 expulsion for 2 h under inert N2 gas, and the degasification (or sparging) was continued during the titration to avoid the dissolution of CO2 from the atmosphere. The endpoint was determined using a methyl red (0.1%) color indicator. The total numbers of acidic (i.e., carboxylic, phenolic, and lactonic, as shown in online Figure S2) and carboxylic groups on the adsorbents were computed as the numbers of moles neutralized by NaOH and NaHCO3, respectively. The number of phenolic groups was assumed to be the difference between the number of moles neutralized by NaOH and Na2CO3, and the number of lactonic groups was assumed as the difference between the moles neutralized by Na2CO3 and NaHCO3. Furthermore, the total number of basic sites of adsorbents was calculated as the number of moles neutralized by HCl. The numbers of moles of adsorbent surface functionalities (nASF, mmol/g) neutralized by NaOH (pKa = 15.74), Na2CO3 (pKa = 10.25), NaHCO3 (pKa = 6.37), and HCl were determined from the following equations


Adsorption properties
The iodine number (ASTM D4607-14) is the amount of iodine adsorbed (mg) by 1.0 g of carbon. Three weighed carbon doses were transferred into three Erlenmeyer flasks, and to each flask, 10 mL of 5% (by weight) HCl solution was added. The mixture was boiled for 1.0 min to remove any trace of sulfur and then cooled to room temperature. Subsequently, 50 mL of 0.1 N iodine solution was added to each flask. The flasks were immediately stoppered, shaken vigorously for 30 s, and immediately filtrated. A 25-mL aliquot of each filtrate was directly titrated with a standardized 0.1 N sodium thiosulfate solution (Na2S2O3.5H2O) until the solution became pale yellow. The endpoint was determined by adding 2 mL of starch until the solution turned colorless. The titration experiment was conducted in duplicate, and mean values were considered. It was ensured that filtrate normalities (C) determined from equation (4) were not within the range of 0.08–0.04 N. The amount of iodine adsorbed per gram of carbon (X/M; mg/g) was calculated using equation (5). The iodine number is the value of X/M at the residual iodine concentration (C) of 0.02 N.


MB number was defined as the amount (mg) of MB adsorbed by 1.0 g of carbon, and Barton’s (1987) method was used for determining it. Approximately 0.1 g of the carbon samples was added to Erlenmeyer flasks containing 25 mL at a MB concentration of 1000 mg/L. The flasks were covered with a parafilm and shaken using an orbital shaking incubator (S300R-Firstek) with 150 r/min at 25℃ for 24 h. The MB concentration was determined using a Genesys 10 UV-Vis spectrophotometer (Thermo Scientific, USA) at maximum wavelength of 665 nm. The amount of MB adsorbed at equilibrium, qe (mg/g), was calculated using the mass balance equation

Results and discussion
Thermal characteristics
The pyrolytic characteristics of raw GS were determined using the thermogravimetric analyzer, and they are presented in Figure 2(a). Four overlapping peaks for the maximum weight loss are visible in the thermogravimetric curve. The weight loss temperature (Tmax) at 56.2℃ was assigned to the vaporization of moisture (≈4.11%), and the thermal decomposition peaks at Tmax of 307℃, 332℃, and 451℃ were attributed to the thermal degradation of hemicellulose (19.37%), cellulose (38.95%), and lignin (37.57%) in GS, respectively. Yang et al. (2007) noted that the pyrolysis of pure hemicellulose and cellulose occurred rapidly and that the weight loss of pure hemicellulose occurred at 220–315℃ (Tmax = 268℃) whereas that of pure cellulose occurred at 315–400℃ (Tmax = 355℃). It is noteworthy that the weight of the residue remains virtually constant from 500℃ to 900℃, suggesting that complete carbonization of GS requires a minimum temperature of 500℃. Furthermore, many previous studies confirmed that the highest SBET of ACs prepared from different precursors through the method of chemical activation with K2CO3 or KOH was found at a pyrolysis temperature higher than 800℃. In fact, K2CO3 and KOH worked efficaciously as activating reagents at 800℃ (Hayashi et al., 2000, 2002; Okman et al., 2014). Taking everything into account, the pyrolysis temperature (800℃) was selected as optimal for this study.
Thermo-gravimetric analysis of the synthesized ACs and their precursors.
For the GSH material, the disappearance of the peak corresponding to the decomposition of hemicellulose is evident in Figure 2(c), indicating that the hydrothermal process at 190℃ can completely decompose the hemicellulose component of raw GS. However, cellulose and lignin in GS might not be decomposed during the hydrothermal process, and this possibility is supported by a previous report (Yang et al., 2007).
The onset and endpoint temperatures of the adsobents are extrapolated on the basis of the intersection of two tangents to the TG curves. As expected, the onset temperatures, which denote the temperatures at which weight loss begins, show an appreciable shift. Furthermore, the endpoint (or endset) temperatures of the adsorbents (Figure 2) also show a considerable change and follow the order of GSBAC > GSAC ≈ GSHAC > GSB >GSH > GS. Therefore, it can be concluded that the ACs are thermally more stable than their precursors.
Physicochemical characterization
Physical and chemical characteristics of the synthesized ACs and their precursors.

Note: Mean values ± standard deviation.
Calculated by difference.
Atomic ratio.
In Table 1, the elements containing C and O are the primary composites. The O/C molar ratio has been used as a reference for surface hydrophilicity because it is indicative of polar-group content, with the polar groups most likely to have been derived from carbohydrates. Moreover, the H/C molar ratio has been used as an indicator of the degree of aromatization and carbonization (Chen et al., 2011). The H/C molar ratio of GSAC, GSBAC, and GSHAC decreased rapidly compared with their precursors—GS, GSB, and GSH, respectively, implying that the ACs had higher aromaticity and were thermally more stable. The analogous results of TGA analysis also indicated that the ACs showed higher thermal stability than their precursors. The relatively higher H/C molar ratio of GSH indicates that original organic plant residues, such as cellulose and lignin (Figure 2), remained in hydrochar. The porous carbon samples (i.e., GSAC, GSBAC, GSHAC, and GSB) had similar O/C molar ratios, suggesting that they shared similar affinity for water.
The GSBAC yield (84.16%) was greater than the GSHAC (63.77) and GSAC yields (57.67). This might result from the complete degradation of hemicellulose, cellulose, and lignin in GS during the previous pyrolysis process for producing GSB (Figure 2). The greater GSHAC yield compared with the GSAC yield was attributed to the hemicellulose in GS that was decomposed by the hydrothermal process to produce GSH (Figure 2).
Textural properties
The nitrogen adsorption/desorption isotherms of the ACs and their precursors are presented in Figure 3. Clearly, the adsorption isotherms of all the ACs and biochar sample belong to Type I of the International Union of Pure and Applied Chemistry (IUPAC) classification, and the Type I isotherm is a typical characteristic of micropores with a small external surface area (Sing, 1985). Furthermore, a wide knee (hysteresis loop) is present in the adsorption/desorption isotherms of the porous carbon materials. Hysteresis appearing in the multilayer range of physical adsorption isotherms is usually related to the adsorbent with micropore or mesopore structures. According to the IUPAC nomenclature, porous carbon materials exhibit the H4-type hysteresis loop, which is associated with narrow slit-like pores.
Nitrogen adsorption/desorption isotherms (a) of GS, GSB, GSH, GSAC, GSBAC, and GSHAC; and pore size distributions (b) of GSB, GSAC, GSBAC, and GSHAC.
Textural parameters of the synthesized ACs and their precursors.
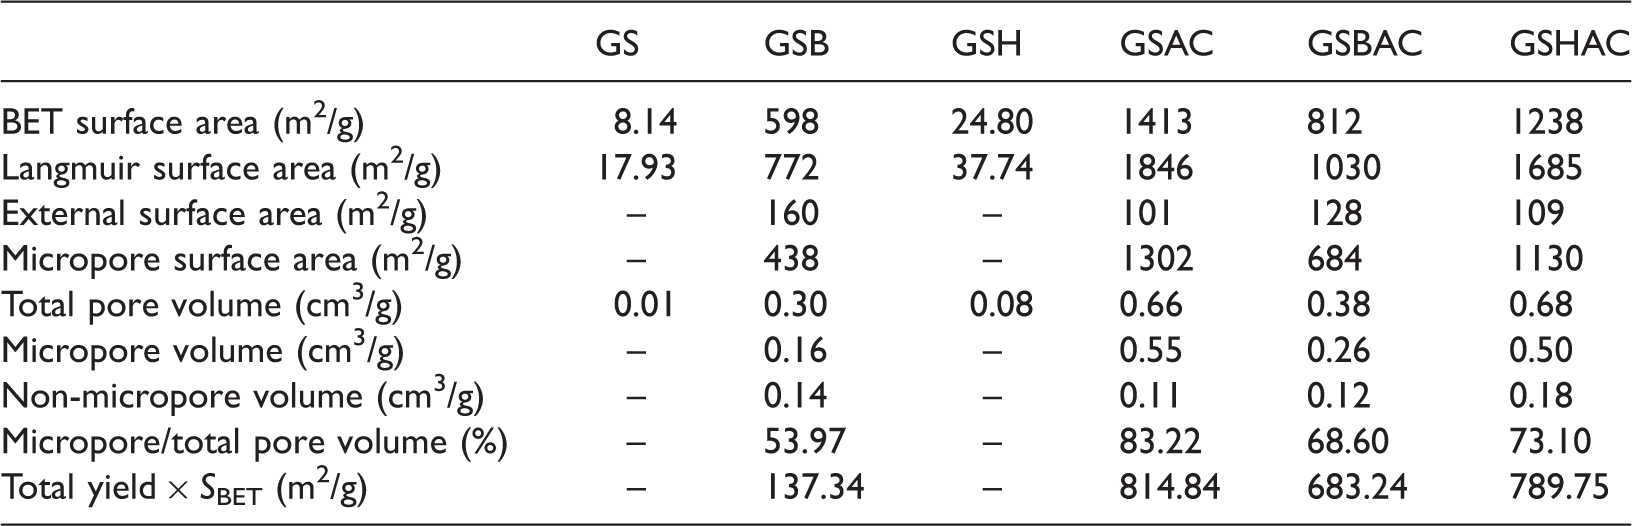
From a practical and economical perspective, because the yield is as important as the surface area, the product SBET × total yield can be considered as a performance criterion for any porous carbon preparation process (Braghiroli et al., 2015). Although the total GSAC yield was the lowest (Table 1), the product of SBET × total yield was the highest (814.8 m2/g) for this material; the product values were 789.75, 683.24, and 137.37 m2/g for GSHAC, GSBAC, and GSB, respectively. Clearly, GSAC is economically beneficial.
Morphological and crystal properties
Figure 4 shows the morphology of the synthesized ACs and their precursors. The raw GS and hydrothermal material had low porosities and fairly rough surfaces. These observations matched with their low SBET and total pore volume (Table 2). The microspheres in GSH, which are visible in Figure 4, were formed from the high cellulose fraction in GS during hydrothermal carbonization (Sevilla et al., 2011). However, the high lignin content (Figure 2) might prohibit the formation of a pathway from the high number of carbon spheres in the GSH sample. Furthermore, the poorly developed pores of GSH might result from the weak decomposition of cellulose and lignin during the hydrothermal process. A marked change can be observed in the morphology of GSB when the lignocellulose material is pyrolyzed at a high temperature. The surface morphology of GSB shows well-developed pores and fairly high surface area (SBET ≈ 598 m2/g), and therefore, GSB can be considered as a green adsorbent for use in wastewater treatment processes.
Scanning electron microscopy (SEM) of the ACs (d–f) and their precursors (a–c).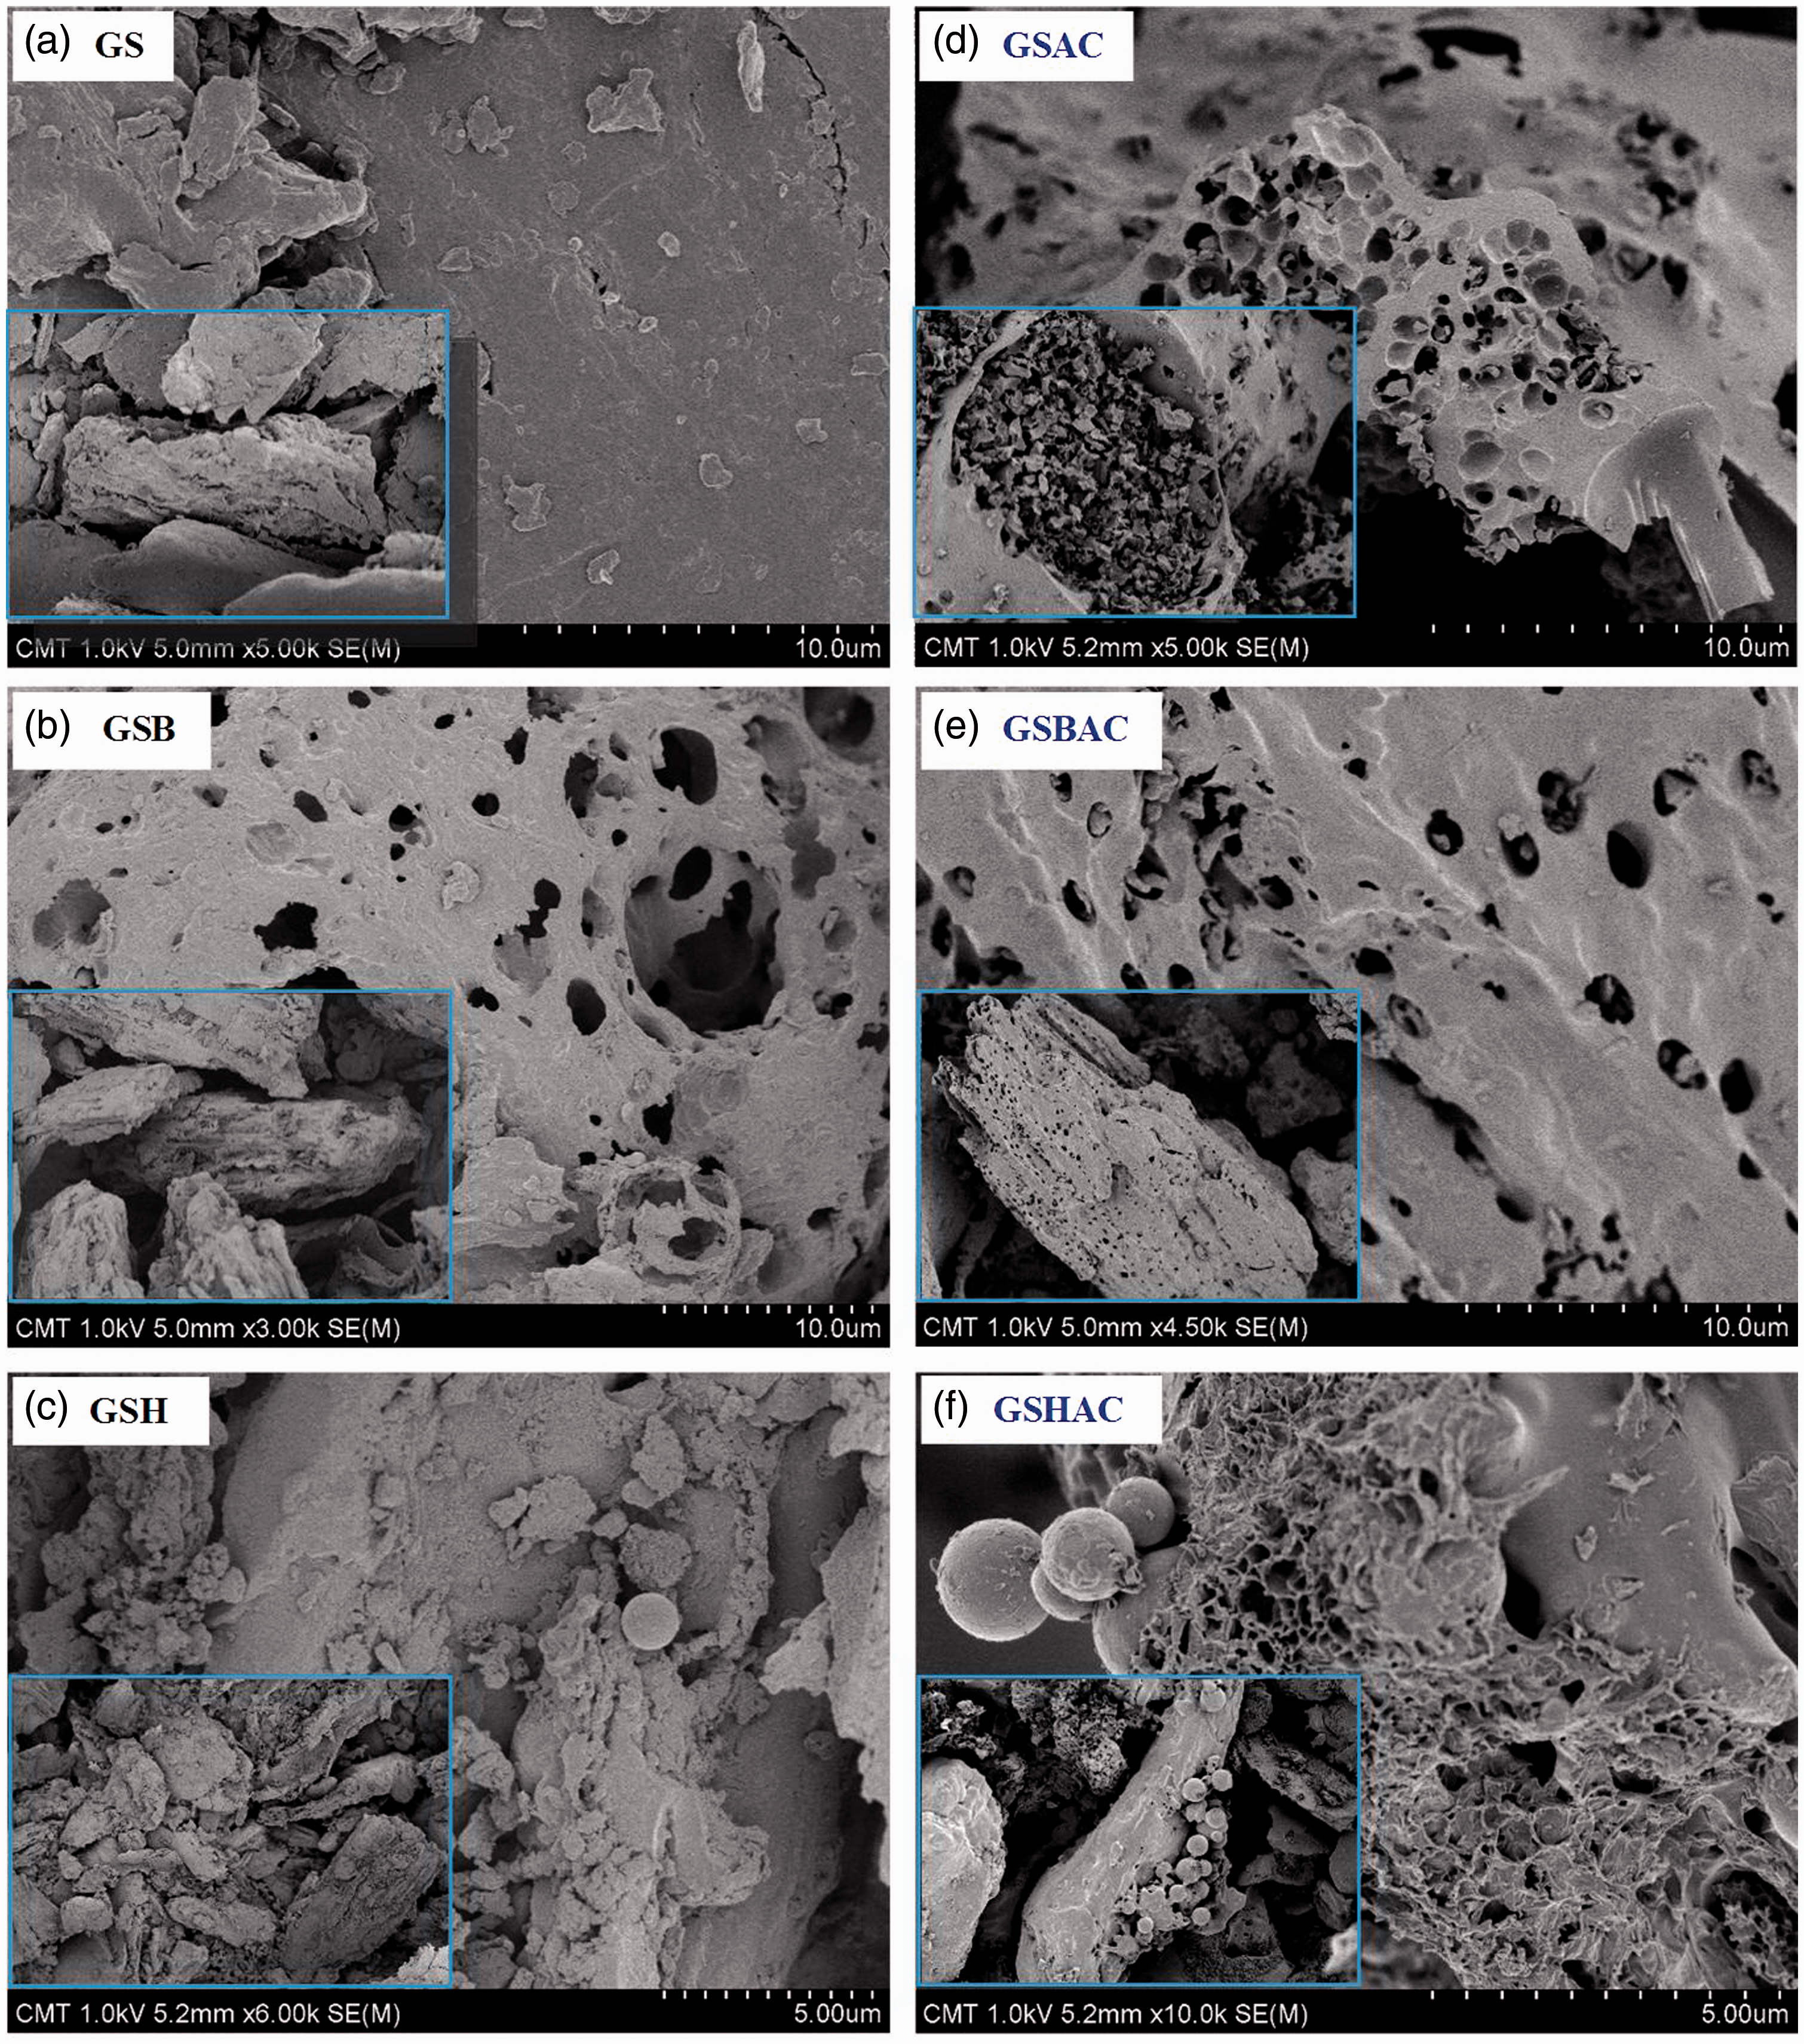
Notably, the synthesized AC samples were characterized by irregular and heterogeneous surface morphology with sponge-like structures. The formation of well-developed pores of various sizes and shapes in the ACs during pyrolysis resulted from the evaporation of K2CO3 (Demiral et al., 2008). Okada et al. (2003) highlighted the high SBET of ACs prepared from waste newspaper through K2CO3 activation, which may intercalate and expand the interlayers of adjacent hexagonal network planes. The planes consist of C atoms, and pore formation is enhanced because of poorly developed hexagonal planes, which are similar to poorly developed planes in graphite. Another reason for enhanced pore formation might be the diffusion of K2CO3 molecules into the rudimentary pores created during pyrolysis and the consequent acceleration of the K2CO3–C reaction (Tan et al., 2008). Pore development in the char during pyrolysis plays a crucial role in improving SBET and the total pore volume. Therefore, it can be inferred that the surface morphology of the ACs strongly depended on their preparation method.
XRD patterns of the crystallinities of the six adsorbents are presented in Figure 5. The XRD patterns of raw GS and GSH show high crystallinity, with two sharp peaks at 2θ values of approximately 15° and 22°. These peaks are characteristic of crystalline cellulosic materials (Johar et al., 2012). The other adsorbents show weak crystallinity. Cellulose in the GS and GSH with a parallel alignment and a crystalline structure resulted from hydrogen bond interactions and van der Waal’s forces between adjacent molecules (Zhang and Lynd, 2004). Hemicellulose and lignin are amorphous in nature (Johar et al., 2012). The XRD spectra of the GSB and AC samples showed the absence of the observed peaks for the adsorbents, suggesting that (1) the structure of GSB and ACs is predominantly amorphous and (2) cellulose and lignin in GS and GSH are completely decomposed at the pyrolysis temperature of 800℃.
X-ray diffraction spectra of the synthesized ACs and their precursors.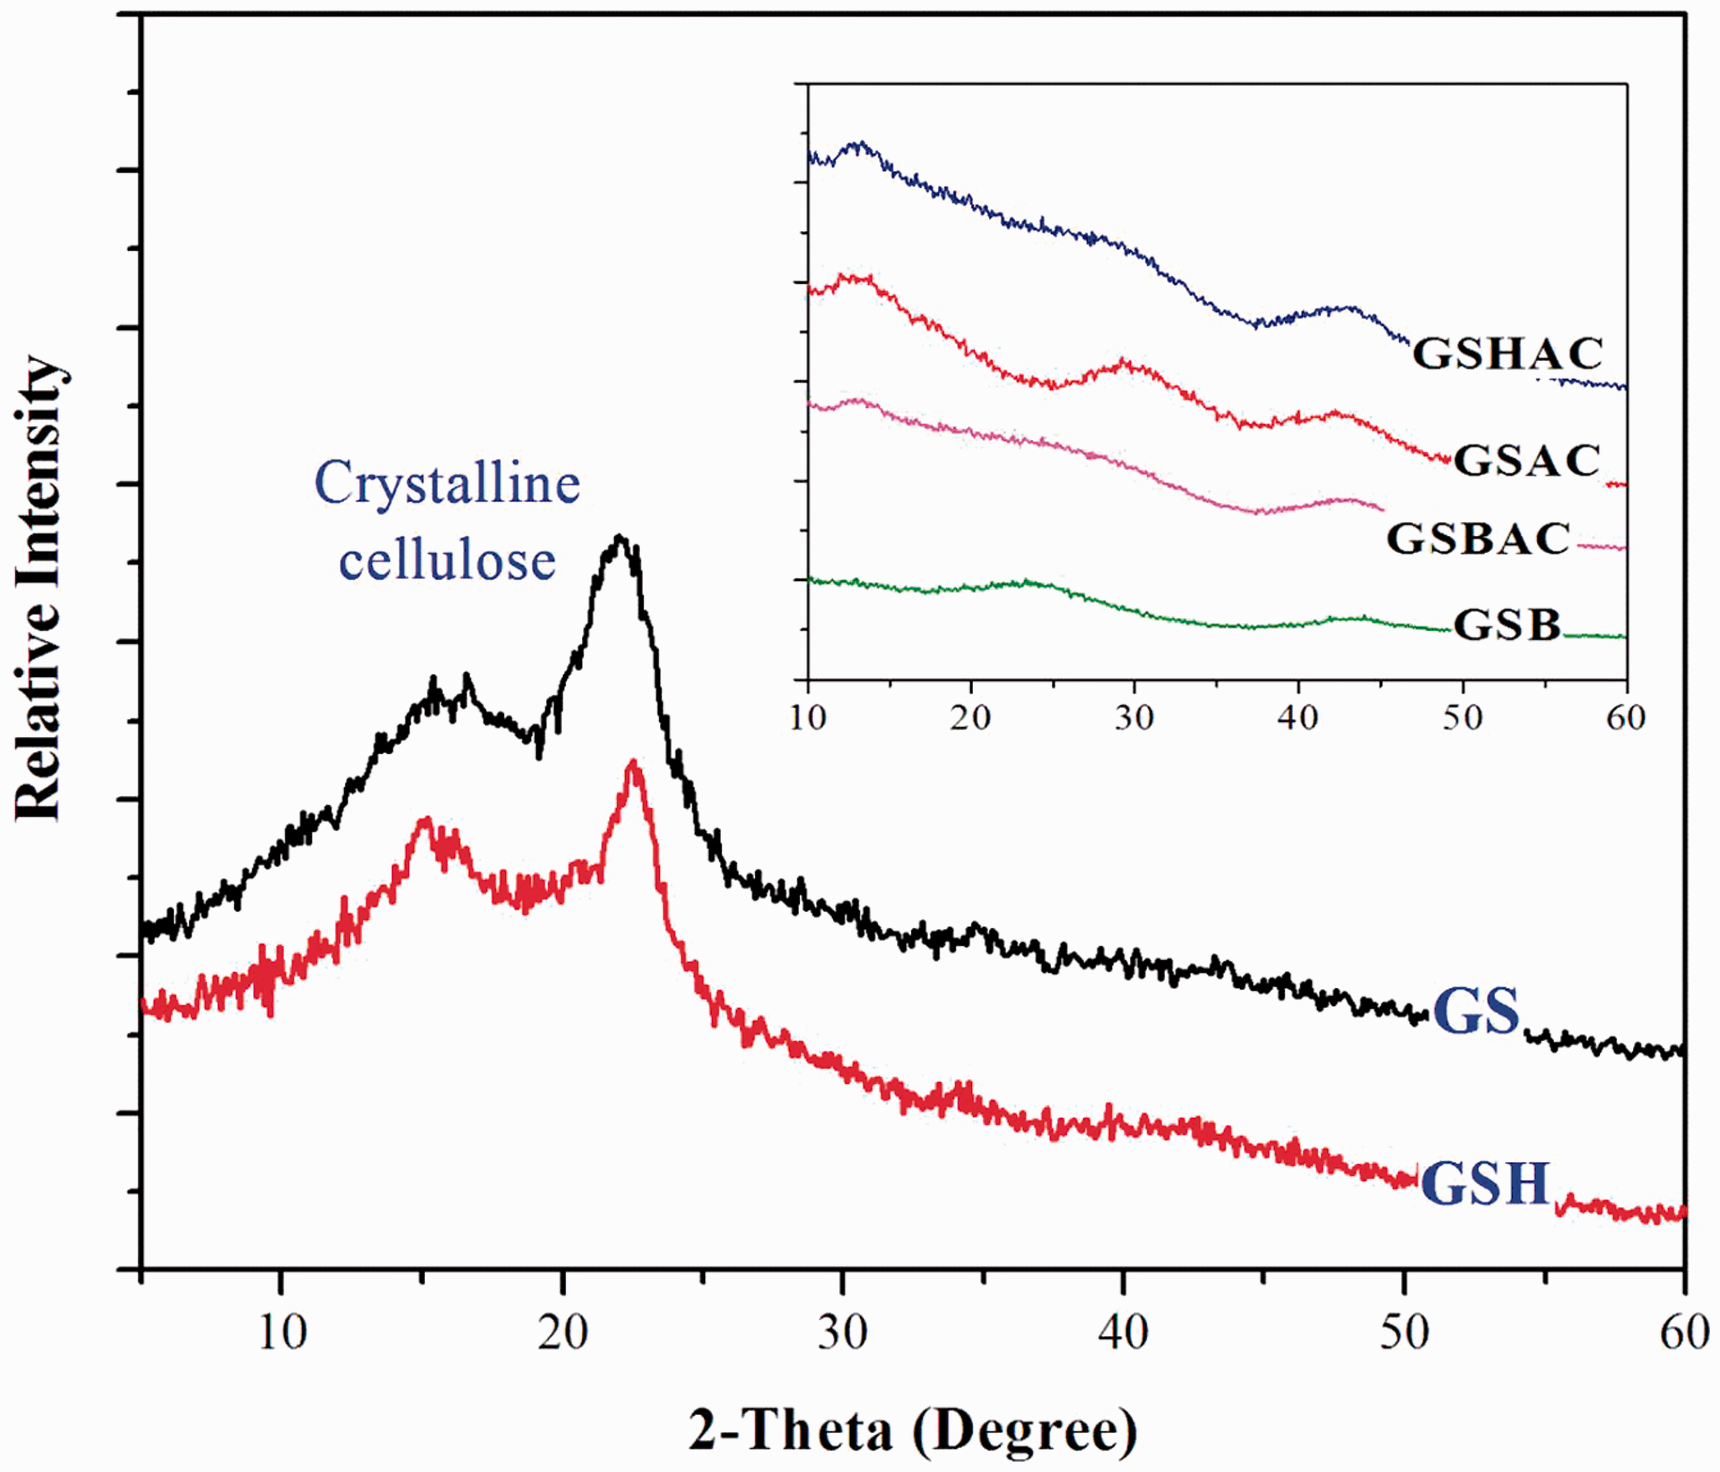
Surface chemistry
Qualitative information on functional groups present on the adsorbent surfaces and their spectroscopic assignments is provided in Figure 6. The spectrum of GS is typical of lignocellulose materials (Sevilla et al., 2011; Yang and Lua, 2003). The bands at 3700–3000 cm−1 are assigned to (O–H) stretching vibrations in hydroxyl groups in hemicellulose, cellulose, and lignin (Köseoğlu and Akmil-Başar, 2015). Furthermore, the bands observed in the range of 3000–2800 cm−1 are related to asymmetric and symmetric C–H stretching vibrations of the methyl (–CH3–) and methylene (–CH2–) groups, which are expected to be present in hemicellulose, cellulose, and lignin. The TGA results of GSH (see Figure 2(c)) confirm that hemicellulose in GS was decomposed during the hydrothermal process. Consequently, the peak at 2924 cm−1 in the GSH spectrum reflects aliphatic C–H stretching in the methyl and methylene groups in cellulose and lignin. The intense bands observed for aliphatic CHn nearly disappeared in the spectra of porous carbon materials, indicating the complete loss of labile aliphatic compounds, and a marked decrease in the nonpolar group content in the carbonization process (Chen et al., 2008). The presence of a carbon-carbon triple bond (C≡C) in disubstituted alkynes can be inferred from the bands in the region of 2450–2150 cm−1. The C≡C vibrations in alkyne groups of biochar and the three ACs were more intense than those in raw GS, because of the release of volatile matter, such as H element (Yang and Lua, 2003). This finding is well consistent with the results of element analysis in Table 1. The H element percentage of GSAC, GSBAC, and GSHAC decreased by approximately 90%, 85%, and 89% compared to their precursors of GS, GSB, and GSH, respectively. Concurrently, GSB and GSH expressed a decrease of around 79%, and 49% of H element, respectively as opposed to GS.
FTIR spectra of the synthesized ACs and their precursors.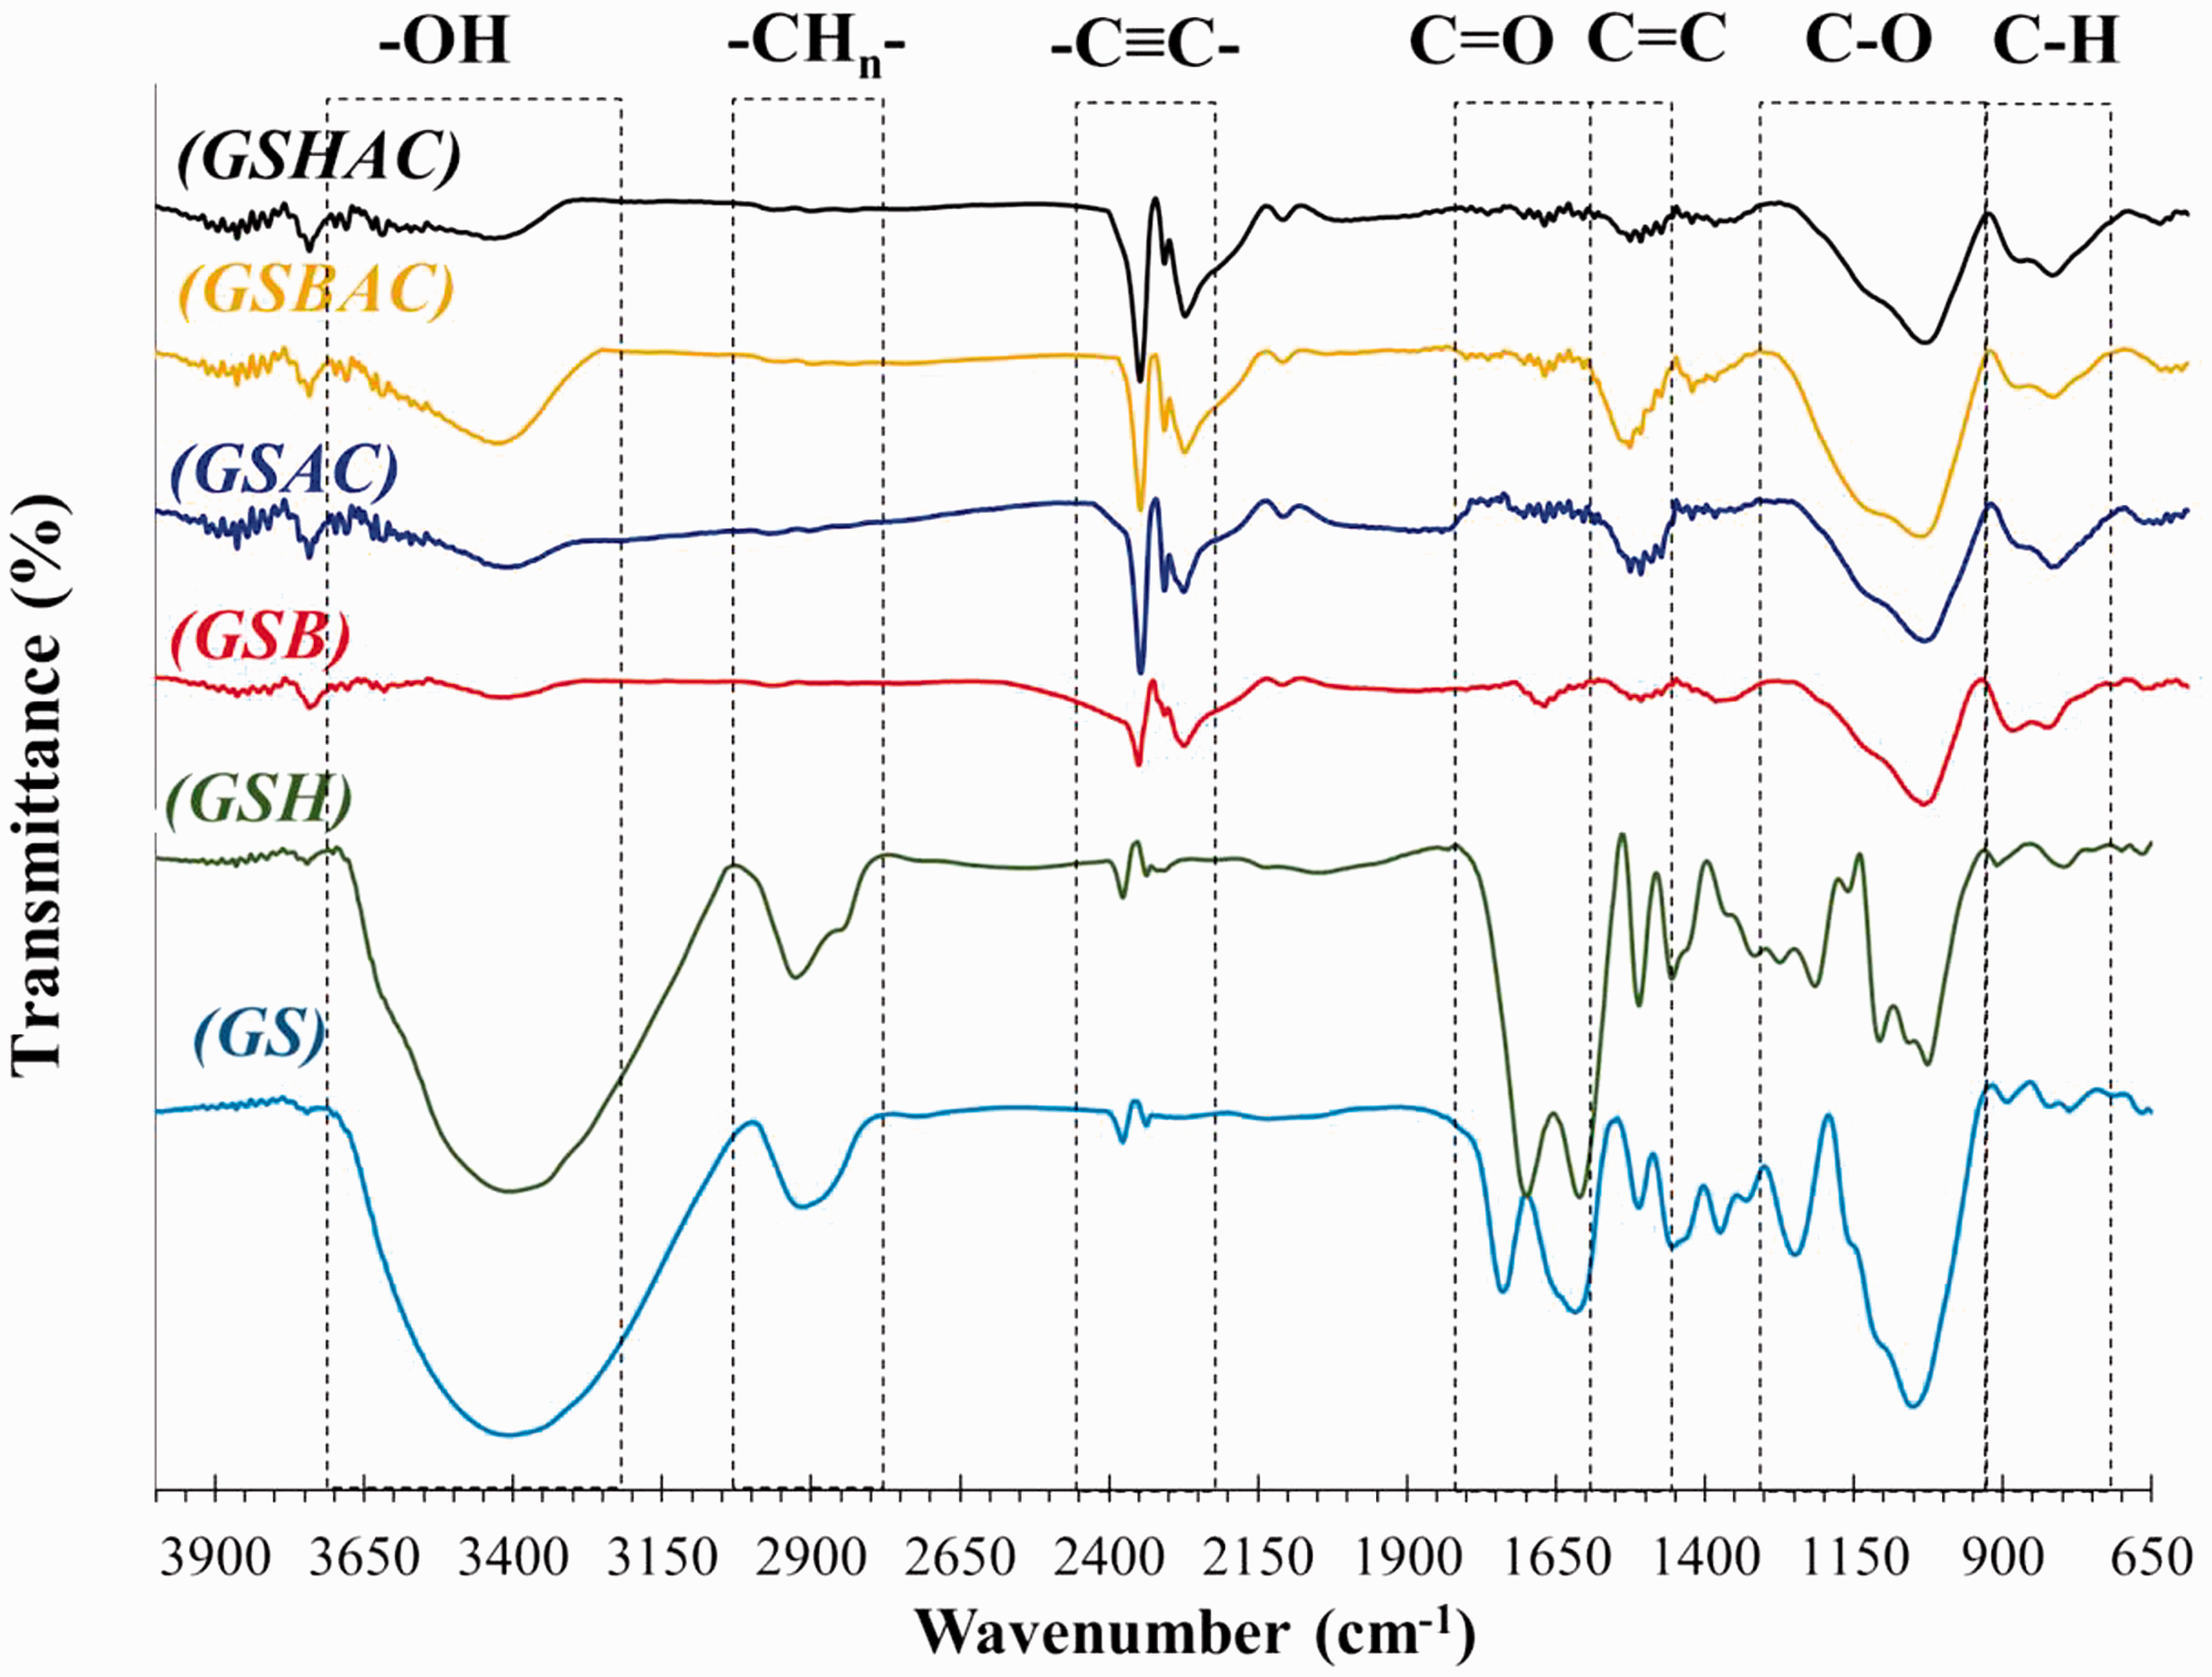
Surface chemistry of the synthesized ACs and their precursors.
Note: Mean values ± standard deviation.
Density of acidity = (total acidic groups in mmol/g × Faraday’s constant of 96.5 in C/mmol)/SBET in m2/g.
Density of total groups calculated similarly to density of acidity.
Similarly, the bands around the region from 1650 to 1480 cm−1 can be attributed to the C=C double bonds in aromatic rings. The presence of aromatic benzene rings can also be recognized from the bands in the 970–730 cm−1 region, which belong to the aromatic C–H out-of-plane bending mode. Finally, the observed bands between approximately 1290 and 970 cm−1 corresponds to stretching C−O groups (Yang and Lua, 2003).
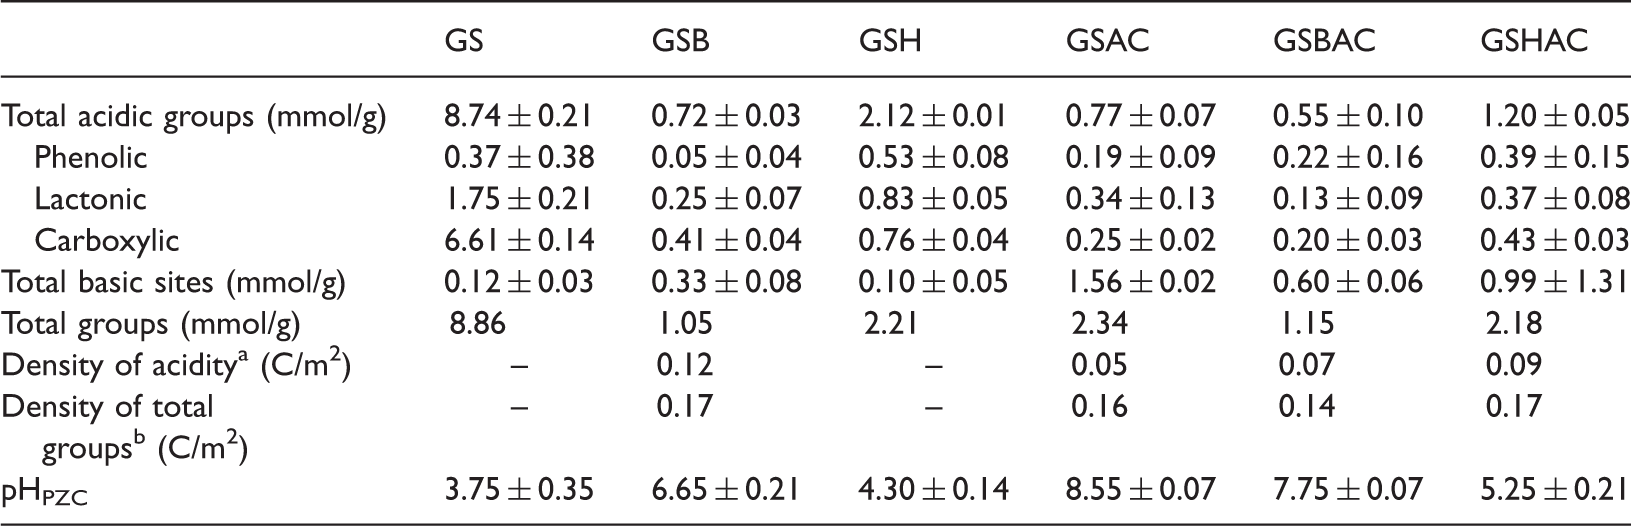
The electrical state of the adsorbent surfaces in solutions was characterized by the point of zero charge (PZC). The pH value at which the net (external and internal) surface charge of an adsorbent is zero is defined as pHPZC (Tran et al., 2016). Online Figure S3 and Table 3 show a plot and pHPZC values of adsorbent samples, obtained using the pH drift method. Obviously, the pHPZC values of the ACs were strongly dependent on the chemical activation method used; pHPZC of GSAC (8.55) > GSBAC (7.75) > GSHAC (5.25). According to the pHPZC values, GSAC and GSBAC can be classified into the H-carbons (pHPZC > 7.0), while GSHAC was the L-carbon (pHPZC < 7.0) (Mattson and Mark, 1971).
Table 3 presents quantitative information on the acidic and basic groups on the adsorbent surfaces; the information was obtained through Boehm titration. Generally, any adsorbent typically coexists with both acidic and basic properties in solutions (amphoteric nature). However, the dominant concentration of the total acidic groups or total basic groups is strongly dependent on the pHPZC values. When pHPZC < 7.0, the total amount of acidic groups should dominate; otherwise, the total amount of basic groups should dominate. Clearly, the changes in the pHPZC values are in accordance with the change in the total acidic groups and total basic groups.
Adsorption properties
The adsorption properties of the ACs and biochar were evaluated on the basis of the iodine number and MB number. Iodine molecules (≈0.27 nm) can be adsorbed into micropores (pore width > 1 nm) of porous materials (Yenisoy-Karakaş et al., 2004), whereas MB molecules with a minimal molecular cross section of approximately 0.8 nm require the minimal pore size distribution to be 1.33 nm (Graham, 1955).
Iodine number and methylene number of the synthesized ACs and biochar.

Note: Mean values ± standard deviation.
Calculated from incremental BJH (Barret–Joyner–Halenda) pore volumes larger than the pore with of 1.3 nm (cm3/g).
The adsorption capacities of MB with a concentration of 1000 mg/L on biochar and ACs are displayed in Table 4. The adsorption capacity (mg/g) and removal efficiency (%) of MB at 24 h decreased in the order of GSBAC (233.6 mg/g; 94.7%) > GSAC (210.2 mg/g; 85.5%) > GSHAC (143.1 mg/g; 57.8%) > GSB (32.6 mg/g; 13.5%). Graham (1955) investigated the nominal limiting pore diameter for adsorption of MB by the five commercial ACs and concluded that the average nominal limiting pore diameter for MB adsorption was approximately 1.3 nm. The adsorption amounts of MB on GSB and ACs are related to the adsorption capacities of organic compounds with high molecular weight on the adsorbents. Because organic compounds with high molecular weight cannot enter micropores, the adsorption capacities of porous carbon materials for MB are not proportional to their SBET. Both SBET and the pore size are the factors that determine the highest adsorption capacity.
Online Table S2 presents a comparison of the textural properties, total yield, and SBET × total yield of the ACs synthesized in this study with those of ACs prepared in previous investigations. Clearly, the yield of AC synthesized in a non-circulated air atmosphere was considerably higher than that of AC prepared in an inert nitrogen atmosphere. The values of the specific surface area and total pore volume of both GSAC and GSHAC were in accordance with the values presented in the literature; however, the values for GSBAC did not agree with literature values. This might be attributed to GSBAC being produced with a lower impregnation ratio of the activating reagent/ precursor.
Conclusions
The synthesized ACs exhibited low moistures (3.13–5.3%), ash content (0.60–0.93%), and volatile (13.10–15.43%), but high fixed carbon (78.41–81.11%), %carbon (71.04–76.31%), hardness (58.01–80.89%), and pH values (8.15–9.71).
The results of TGA analysis demonstrated that the synthesized ACs exhibited higher aromaticity and thermal stability compared to their precursors. The presence of cellulose matter in raw material (GS) and hydrothermal material (GSH) can be sensibly evaluated by TGA and XRD analysis. The presence of oxygen-containing functional groups on the surface of ACs was accurately identified through the FTIR technique and Boehm titration method. The pHpzc values of the ACs were in the following order: GSAC (8.55; the H-carbon) > GSBAC (7.75; the H-carbon) > GSHAC (5.25; the L-carbon).
The textural characteristics of ACs synthesized from GS indicated the SBET values followed the order of GSAC (1413 m2/g) > GSHAC (1238 m2/g) > GSBAC (812 m2/g) >GSB (598 m2/g) > GSH (24.8 m2/g) > GS (8.14 m2/g). Micropore volumes of the ACs were 83% for GSAC, 73% for GSHAC, and 68% for GSBAC. Although, GSHAC exhibited slightly lower BET surface area than GSAC, the concentration of total acidic oxygen functional groups on the GSHAC’s surface was 1.5-fold higher than that of GSAC. Excellent adsorption properties of the ACs were confirmed from the high iodine numbers (1568–2695 mg/g) and the methylene blue indexes (143.14–233.59 mg/g).
The GS biochar can be considered a potential and inexpensive candidate for adsorption application because it possessed relatively high SBET value (598 m2/g) and total acidic groups (0.72 mmol/g), high fixed carbon (84%) and percentage of carbon (77%), good adsorption properties of iodine (794 mg/g) and MB (33 mg/g). On the other hand, it contained low moisture (2.23%), volatile (14.33%), and total ash content (0.89%).
On the basis of favorable characteristics, GS can be considered an excellent precursor for synthesizing ACs through chemical activation.
Footnotes
Acknowledgements
The first author would like to thank CYCU for the Distinguished International Graduate Students (DIGS) scholarship to pursue his doctoral studies.
Declaration of Conflicting Interests
The author(s) declared no potential conflicts of interest with respect to the research, authorship, and/or publication of this article.
Funding
The author(s) disclosed receipt of the following financial support for the research, authorship, and/orpublication of this article: This work was financially supported by Chung Yuan Christian University (CYCU) in Taiwan.
References
Supplementary Material
Please find the following supplemental material available below.
For Open Access articles published under a Creative Commons License, all supplemental material carries the same license as the article it is associated with.
For non-Open Access articles published, all supplemental material carries a non-exclusive license, and permission requests for re-use of supplemental material or any part of supplemental material shall be sent directly to the copyright owner as specified in the copyright notice associated with the article.