
Abstract
The first aim of this study was to investigate mesoporous activated carbon adsorbents from sisal, hemp, and flax fibers by cost-effective methods. Fibers were impregnated with low concentration (20 wt.%) phosphoric acid. Carbonization temperatures were defined by thermal analysis. Bast fibers (hemp, flax) decompose at lower temperatures (419.36℃, 434.96℃) than leaf fibers (sisal, 512.92℃). The second aim was to compare bast and leaf fibers-derived activated carbon adsorbents by determining physical adsorption properties, chemical compositions, scanning electron microscope, and Fourier transform infrared spectroscopy. Results showed that natural fibers have good candidates to prepare mesoporous activated carbon adsorbents with high surface area (1186–1359 m2/g), high mesopore percentage (60–72%), and high C content (80–86%). Even though leaf-derived activated carbon developed more mesoporous structure (72%), bast-derived activated carbons provided higher surface areas (Shemp = 1359 m2/g; Sflax = 1257 m2/g) and C content. Fourier transform infrared spectra for bast fibers-derived activated carbon adsorbents were quite similar while leaf fiber-derived activated carbon adsorbent had a different spectrum.
Keywords
Introduction
Biobased materials have become more attractive recently because they can provide the solution for the landfill space shortage, the petroleum resources reduction, and concerns over emissions caused by synthetic material usage (Mohanty et al., 2005). They are typically made from renewable agricultural and forestry feed stocks including wood, agricultural waste, and natural plant fibers. There is a need for developing activated carbon adsorbents (ACAs) from inexpensive and efficient alternative precursors (Dias et al., 2007; Hu et al., 2000a). Therefore, natural fibers are one of the alternative options due to their low cost, renewability, and continuous availability (Fakirov, 2007). The natural fibers such as hemp fiber (Williams and Reed, 2003), oil palm fiber (Tan et al., 2007), cotton fiber (Muxel et al., 2011), and kenaf fiber (Aber and Sheydaei, 2011) have been used to prepare activated carbons. Natural fibers can be classified into three groups based on their origin within the plant – namely bast, leaf, and seed fibers (Roul, 2009). Jute, kenaf, flax, and hemp are examples of bast fibers. Bast fibers are commonly used for manufacturing ropes and heavy duty industrial fabric. Flax (Linum usitatissimum) is cultivated for linen yarn and fabric. Hemp (Cannabis sativa) fiber is generally used for cordage, specialty textiles such as sails and linen, and specialty paper such as tea bag paper and coffee filters. Examples of leaf fibers are sisal, banana, palm, and pineapple. Sisal (Agave sisalana) is a commonly used leaf fiber in agricultural, shipping, and industrial applications (Roul, 2009).
Activated carbons (ACs) can be prepared by physical and chemical activation (Reed and Williams, 2004). Physical activation is conducted in two steps: (1) carbonization of the precursor material, and (2) gasification of the char in steam or carbon dioxide environment (Reed and Williams, 2004). Chemical activation is completed in a single step that combines the carbonization and activation process, and therefore provides better development of a porous structure. It is also performed at lower temperatures than the physical activation process. However, the corrosiveness of the process and the addition of a washing stage are the disadvantages of the chemical activation process (Amri, 2008). Chemical activation was preferred in this work because of all the energy-saving benefits. Activating agent concentration is one of the important parameters for chemical activation and it has been studied in the literature at around 35–80% (Baba Jibril et al., 2008; Dev et al., 2010; Ekpete and Horsfall, 2011; Fu et al., 2003). One of the purposes of this study was to reduce the cost of the AC preparation by reducing the activating agent concentration.
Carbonization temperature is another significant factor in AC production since the carbonization step creates porosity in the char (Baba Jibril et al., 2008). Therefore, carbonization temperature should be sufficient to volatilize non-carbon substances to obtain desired properties for activated carbon (Ekpete and Horsfall, 2011). Natural fibers consist of hemicellulose, cellulose, and lignin, which have been reported to decompose at 180–380℃, 230–400℃, and 160–900℃, respectively (Baba Jibril et al., 2008). In many studies, (Baba Jibril et al., 2008; Ekpete and Horsfall, 2011; Rosas et al., 2009) carbonization temperatures were chosen based on these assumptions which might not be accurate since each and every natural fiber has a different percentage of hemicellulose, cellulose, and lignin. Defining carbonization temperatures would also help to lower the cost.
The adsorption capacity of an AC generally depends on the amount of carbon pores (Li et al., 2008). ACAs are preferable for gas purification and removal of organic pollutants from water because of their porous structure (Suzuki, 1994). Choosing the appropriate activated carbon pore size is also an important factor since pore size has a significant contribution to adsorption. For example, adsorbate gas molecules with diameters larger than 2 nm were demonstrated to be adsorbed efficiently in mesopores (2–50 nm) but not in micropores (<2 nm) (Hu et al., 2000b). Although it is desirable for ACAs to be highly mesoporous for some important applications, such as energy conversion, waste water treatment, storage materials, and biomedical engineering material applications, mesoporous activated carbons have been reported less in the literature because of their costly and complex manufacturing process (Hu et al., 2000b).
Studies of microporous activated carbons from natural fibers have been widely reported in literature. Phan et al. (2006) reported studies on microporous AC fiber adsorbents derived from natural fibers (jute, coconut) for water treatment applications. The authors observed high surface area (1500 m2/g) leading to high adsorption capacity attributed to chemical activation by phosphoric acid (Rosas et al., 2009). On the other hand, lignocellulosic materials are also great alternatives for mesoporous AC production. Dev et al. (2010) showed that mesoporous AC can be obtained from coconut shells and palm seeds by chemical and physical activation methods, and have higher adsorption capacities compared to microporous AC for larger adsorbates, such as phenol. Wang et al. (2008) studied mesoporous AC derived from bamboo chips for CO2 adsorption. Even though there are some natural fiber-derived AC studies in the literature, comparison of groups based on their origin has not been done. In this work, bast- and leaf-derived AC characteristics were evaluated.
Natural fibers are considered to be “green” alternative sources to prepare low-cost, high-quality mesoporous ACAs. The purposes of this study are to produce and characterize (bast and leaf fibers) mesoporous ACAs from natural fibers including hemp, sisal, and flax by cost-effective methods. Impregnating the natural fibers with low concentration of activating agent was one of the methods to reduce the cost. Carbonization temperature for each material was determined by thermal analysis method which was the second method. Physical adsorption characteristics, chemical compositions, surface morphology as well as the main functional groups were obtained and compared for bast fiber- and leaf fiber-derived ACs.
Experimental
Activated carbon preparation
The carbon precursors were bast (flax, hemp) and leaf (sisal) natural fibers. Phosphoric acid (H3PO4) was used as the chemical activating agent. H3PO4 is commonly used in literature due to its easy recovery by water washing. It also functions as a dehydrating agent and inhibits the formation of tar (Lori et al., 2000).
Natural fiber precursors were impregnated with H3PO4 for 1 h. 20 wt.% activating agent was chosen in this research to reduce the cost and energy. As shown in Figure 1, a horizontal furnace (Lindberg/Blue M) was used at the carbonization step for carbon formation. The furnace’s inner diameter was 6 cm, with a length of 110 cm and its temperature was regulated with a three-zone temperature control system. In each run, the sample material was placed centrally in the furnace and the system was then purged with nitrogen (N2) gas with 94.4 ml/min flow rate for 1 h. the dwell time, and the heating rate was 10℃/min.
Schematic diagram of horizontal tube furnace setup.
The end product was repeatedly washed with hydrochloric acid (HCl), hot water, and distilled water. In the last step, the washed sample was dried at 100℃ for 2 h.
Thermal gravimetric analysis
Thermal gravimetric analysis (TGA) was conducted with a DuPont TGA 2950 thermogravimetric analyzer (TA instruments, New Castle, Delaware) over a temperature range of 10–800℃ to determine carbonization temperature. The furnace was heated at 10℃/min under N2 atmosphere with a flow rate of 50 ml/min until the precursor materials were thermally decomposed to porous carbonaceous adsorbent materials.
Physical adsorption characterization
Micromeritics ASAP2020-Accelerated Surface Area and Porosimetry Analyzer (Micromeritics Corp., Norcross, GA, USA) with Micro Active software was used to determine the N2 adsorption–desorption isotherms, BET surface area, and pore size characteristics (pore surface area, pore diameter, pore volume) via the volumetric adsorption of N2 for the activated samples at 77°K. The micropore surface area was estimated using the t-plot. Equation for average pore diameter is 4 V/A. The total pore volume is the sum of micropore volume and mesopore volume, which was the volume of liquid N2 at a relative pressure of about 0.99 (Reed and Williams, 2004). V and A represent single-point total pore volume and BET surface area, respectively. (V/A) is multiplied by 4 based on the assumption of the cylindrical model of pores. Dubinin–Radushkevich (DR) method was used for the determination of the micropore volume. Density Functional Theory (DFT) has been applied to measure the micropore size distribution by Quantachrome instrument (Wang et al., 2013). For micropore size distribution, CO2 adsorption at 273.15°K has been preferred since CO2 adsorption is faster (∼3h.) compared to N2 adsorption (∼30h.), and this adsorption leads to the assurance that measured adsorption points are equilibrated (Cazorla-Amoros et al., 1996; Garcia-Martinez et al., 2000; Garrido et al., 1987). The mesopores size distribution was estimated by using the Barrett–Joyner–Halenda (BJH) method (Barrett et al., 1951). This method is usually applied to N2 desorption data measured at 77°K for calculating pore size distributions from experimental isotherms on mesoporous and small macroporous materials (Garrido et al., 1987). Triplicate analyses were performed for each natural fiber-derived AC type.
Analyzing the entire pore size distribution of adsorbent is important because the difference in the pore size affects the adsorption capacity for molecules of various shapes and sizes. The pore size is also one of the criteria by which carbon adsorbents are selected for a specific application (Dinesh, 2010–2011).
Ultimate and proximate analysis
The ultimate analysis shows the various elemental chemical constituents, such as carbon (C), hydrogen (H), and nitrogen (N), and was performed using a Perkin-Elmer CHN 2400 analyzer (PerkinElmer, Waltham, MA, USA). The percentage weight of the fixed carbon, volatile matter, ash, and moisture content in the adsorbents was measured with proximate analysis. Ash content indicates the amount of inorganic substituents in the carbon (Baseri et al., 2012). The commercial samples’ ash content is around 2% (Devi et al., 2012). High ash content is undesirable because adsorption capacity of AC sample will be low. If moisture content is high, the adsorption will be low and this will also increase transportation and storage costs (Silgado et al., 2014). The commercial activated samples have approximately 5–8% moisture (Devi et al., 2012). AC with the low ash content and low moisture content is an attractive candidate for adsorption studies. Volatile matter shows the presence of organic compounds in the material (Phan et al., 2006). ASTM D2867-14 (2014) for moisture content, ASTM D2866-11 (2011) for ash content, and ASTM D5832-08 (2008) for volatile matter content were used as standard test methods. The fixed carbon content of AC was determined by subtracting the moisture content, volatile matter content, and ash content from 100%.
Fourier transform infrared spectroscopy analysis
Fourier Transform Infrared Spectrometry (FTIR) was used to analyze the organic functional groups present in the adsorbent. The FTIR spectrum was carried out at the range of 500–4000 cm−1 with a spectrometer (Bruker Alpha FTIR Spectrometer).
Scanning electron microscope analysis
Surface texture and porosity of the ACAs were investigated by scanning electron microscope (SEM) (FEI, Quanta FEG 690). The SEM analysis was operated at a 10 kV accelerating potential.
Results and discussion
Thermal gravimetric analysis (TGA) results
In this study, TGA was used to define the appropriate carbonization temperature by determining the decomposition temperatures for each sample. Figures 2 to 4 show the TGA profile of the natural fiber-derived ACs between 25 and 800℃ temperature ranges. It can be noted from these figures that there is an initial weight loss at temperatures below 300℃, which is attributed to evaporation of the moisture originally contained in the precursors. Weight loss continues above this temperature because of vaporization of volatile organic compounds. According to the weight loss and differential thermo gravimetric (DTG) plots, thermal decomposition temperatures are 419.36℃, 434.96℃ and 512.92℃ for hemp, flax and sisal fiber-derived ACs, respectively. This shows that bast fibers have lower decomposition temperatures compared to leaf fibers. Additionally, in the DTG curve, bast fibers have only one peak where the hemicellulose, cellulose, and lignin components may be superimposed, whereas leaf fibers have three overlapped steps. Peaks represent degradation of hemicellulose, cellulose, and lignin, respectively. Since the lignin is hard to decompose, it might cause increasing the decomposition temperature (Mwaikambo and Ansell, 2002). In this study, the higher lignin percentage of sisal fibers (11%) is the reason for higher decomposition temperature compared to flax (3%) and hemp (4%) lignin percentages (Abdul Khalil et al., 2013). Fixed carbonization temperature was chosen at 515℃ based on the thermal decomposition results, N2 flow was 94.4 ml/min, and the heating rate was 10℃/min with 1h. carbonization time.
Thermal gravimetric analysis of hemp fiber. Thermal gravimetric analysis of flax fiber. Thermal gravimetric analysis of sisal fiber.


Physical adsorption characteristics
Adsorption isotherms
N2 adsorption isotherms of three ACAs are shown in Figure 5. According to classification by the International Union of Pure and Applied Chemistry (IUPAC), the shape of the three adsorption isotherm curves indicates that these are Type I isotherms, which represent the Langmuir-type monolayer adsorption. The gradual increase in N2 uptake and larger adsorbed volume results in a less steep isotherm of Type I, suggesting that additional pores were created and small pores were widened. In Figure 5, it is clearly noted that all three curves have a hysteresis loop, which is the characteristic feature of mesoporous structures (Gregg and Sing, 1982).
N2 adsorption–desorption isotherm plots for sisal-, hemp-, and flax-derived activated carbon adsorbents at 77°K.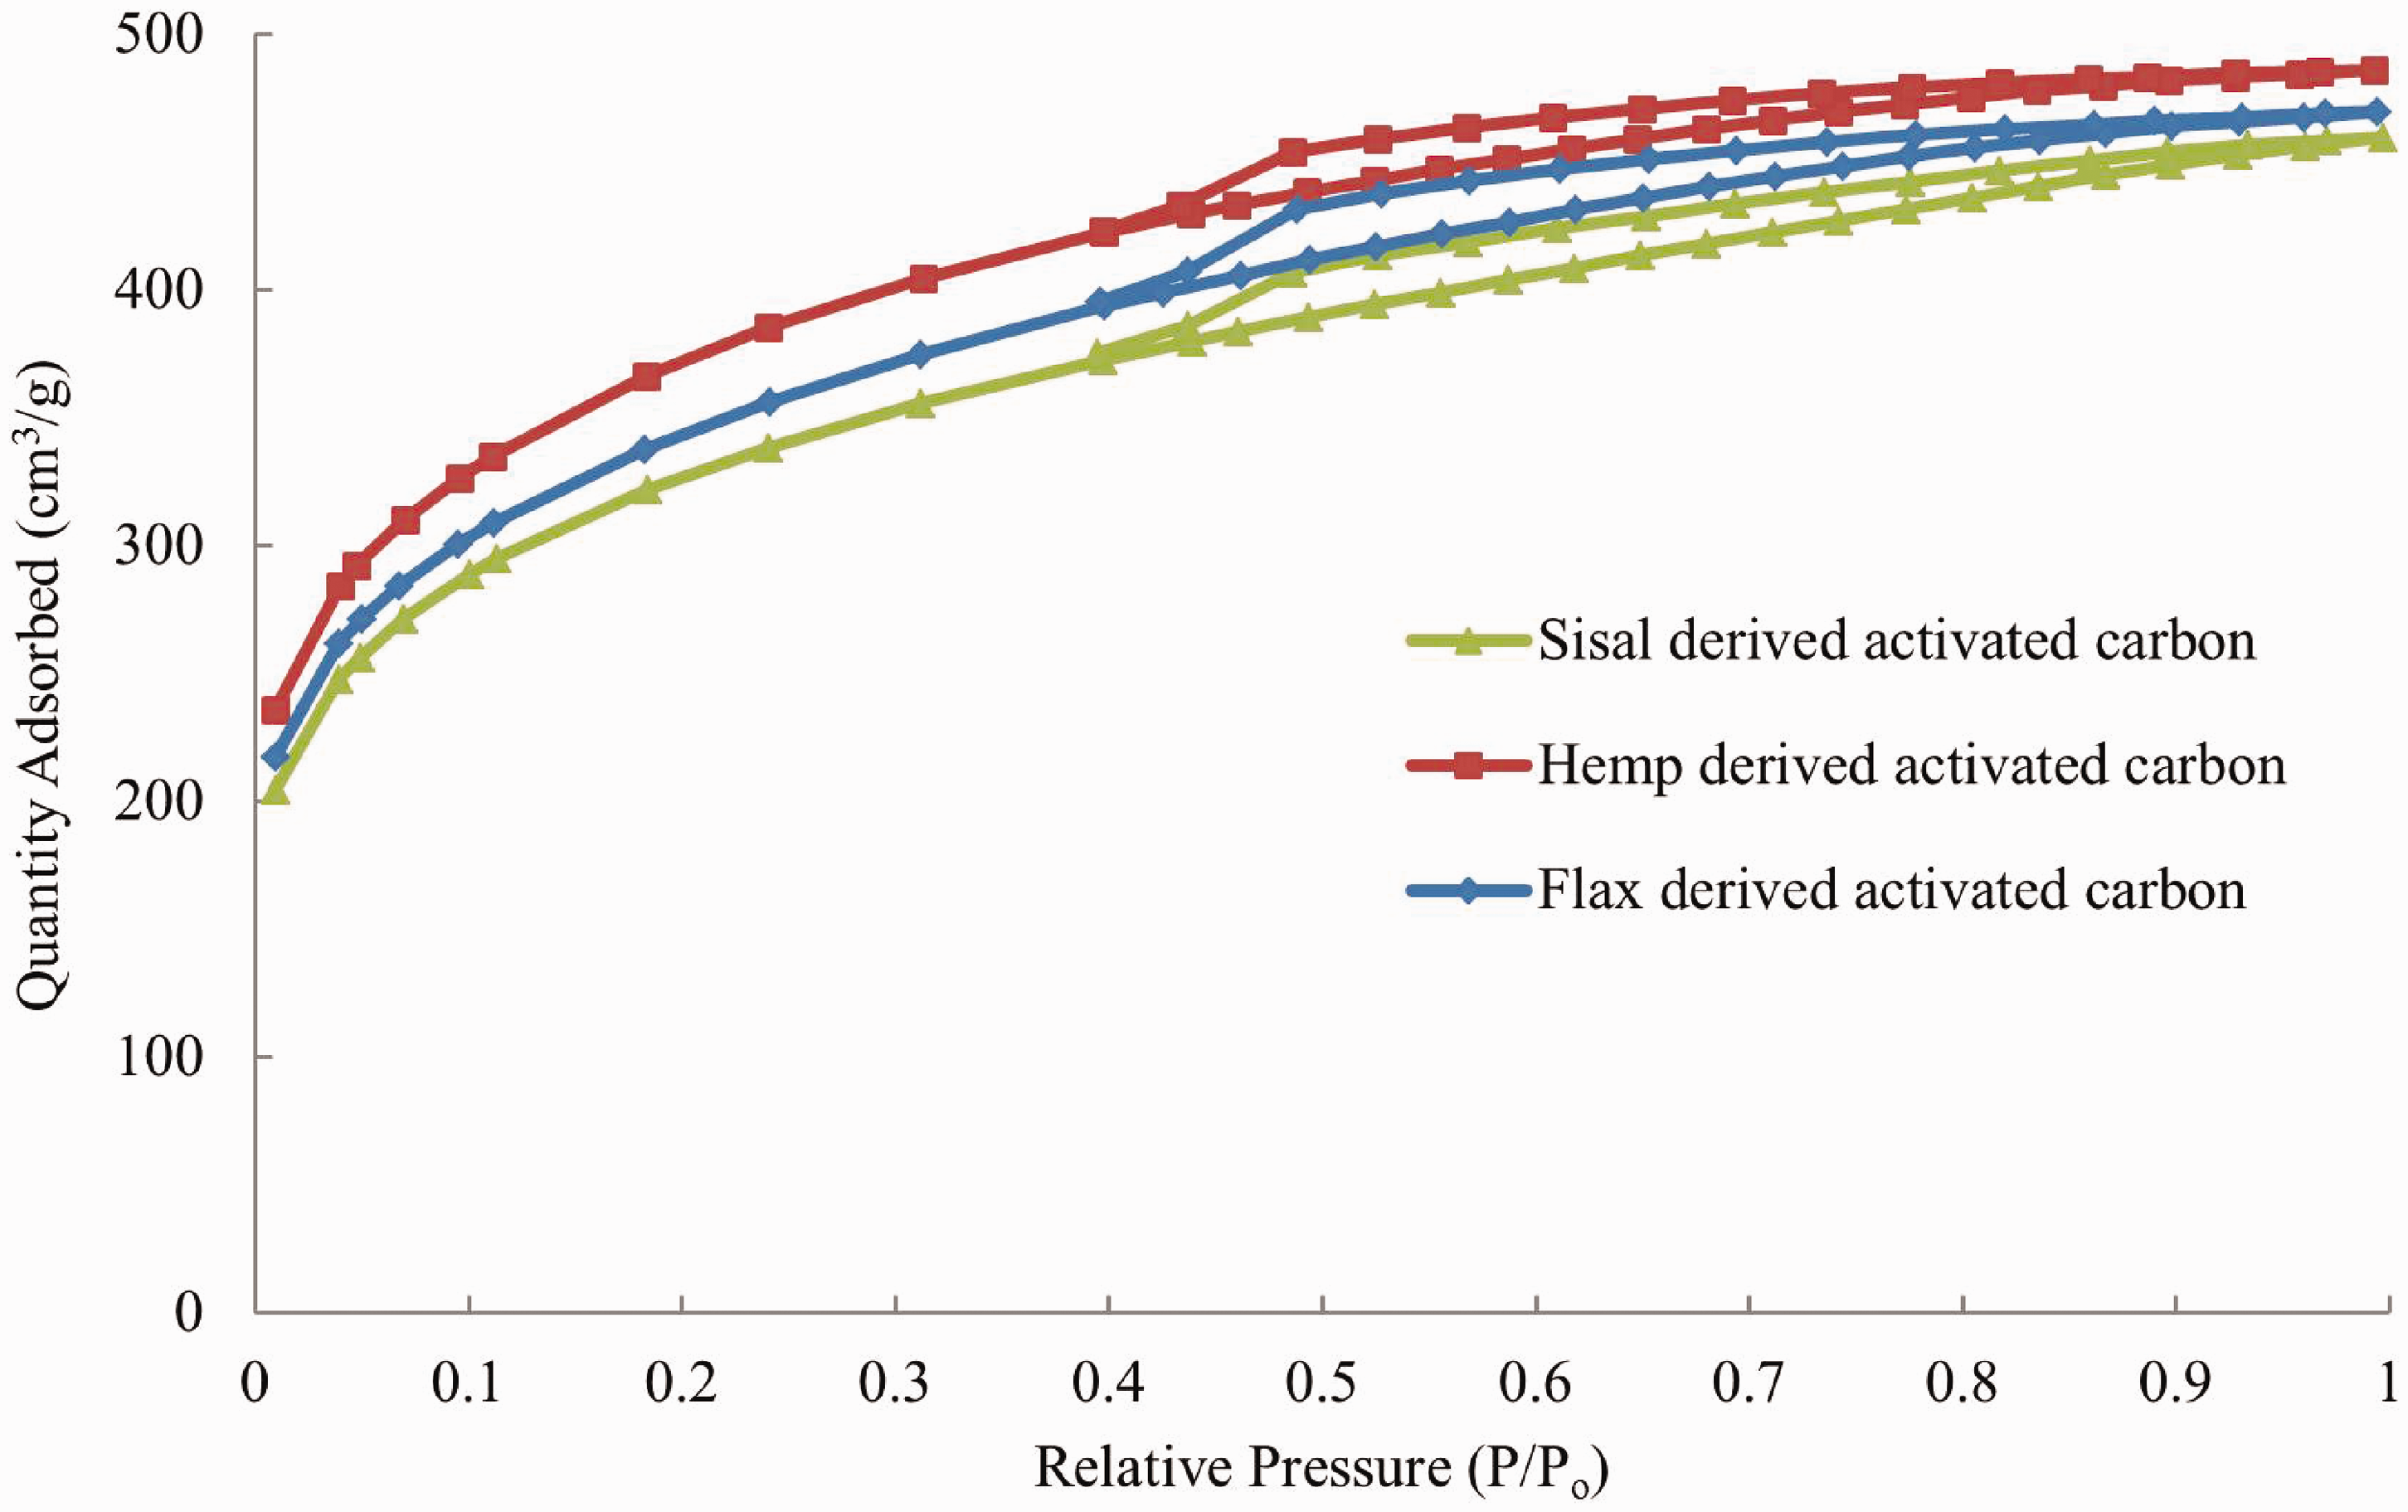
Surface area and pore characteristics
Characteristics of hemp-, flax-, and sisal-derived activated carbon adsorbents (n = 3).

HDAC: hemp-derived activated carbon; FDAC: flax-derived activated carbon; SDAC: sisal-derived activated carbon; SBET: BET surface area; Sme: mesopore surface area; Vmi: micropore volume; Vtot: total volume; Vme: mesopore volume; D: pore size.
Data clearly demonstrated that the hemp-, flax-, and sisal-derived ACAs possess high surface areas (1100–1300 m2/g) and exhibit high mesopore content (60–71%). Thus, it is possible to achieve mesoporous structure with high surface area through ACAs derived from natural fibers. Dev et al. (2010) also observed mesoporous structure with chemical activation. It was also observed that mesopore area ratio, total pore volume, micropore volume, mesopore volume and pore sizes changed very little for each of these adsorbents. The highest BET surface area (1359 m2/g) was obtained from hemp-derived ACA, but the largest mesoporosity (72%) was obtained from sisal-derived ACA. The mesopore volume is 60–72% of the total pore volume indicating that mesopores are dominant for all the natural fiber-derived ACAs.
Table 1 shows that total pore volume and BET surface area are linearly proportional to one another such that the BET surface area increases with increasing micropore area, mesopore area and total pore volume. However, BET surface area was inversely proportional to pore size. The average pore sizes of hemp- (1359 m2/g), flax- (1257 m2/g) and sisal-derived (1186 m2/g) ACAs were measured to be around 2.22 nm, 2.32 nm and 2.38 nm, respectively. This also proves that the chemical activation agent creates porosity as well as widens the pores, leading to the development of mesoporous structure.
Pore size distribution
Figure 6 presents the micropore size distribution for natural fiber-derived ACAs. All ACA types have broad micropore size distribution. The majority of micropores were situated around 0.5–0.6 nm but the samples also have secondary smaller peak around 0.8–0.9 nm.
Micropore size distribution of natural fiber (hemp, sisal, flax)-derived activated carbons by DFT method.
Figure 7 shows the mesopore size distributions of the natural fiber-derived ACAs. The maxima of the distribution curves occur at 1.8 nm for all the adsorbents and their pore volumes are similar to each other (0.36 cm3/g, 0.304 cm3/g, and 0.32 cm3/g, respectively).
Mesopore size distribution of natural fiber (hemp, sisal, flax)-derived activated carbon adsorbents by BJH method.
Wang et al. studied mesoporous AC from coconut shells with H3PO4 activating agent (Wang et al., 2013). They used the Horvath–Kawazoe model for the micropore size distribution and observed broad micropore size distribution with two peaks at 0.55 and 0.59 nm. Cumulative PSD was obtained by DFT model. Heterogeneous pore distribution with four different peaks at 0.73, 1.10, 2.73 and 3.43 nm was observed. On the other hand, Zhu et al. prepared mesoporous ACs from coconut shells with physical and chemical activation (Hu et al., 2000b). The pore size distribution was narrow. The maximum peaks were between 2 and 3.49 nm.
Ultimate and proximate analysis
Ultimate and proximate analysis of hemp-, flax-, and sisal-fiber derived activated carbons.

HDAC: hemp-derived activated carbon; FDAC: flax-derived activated carbon; SDAC: sisal-derived activated carbon.
SEM analysis
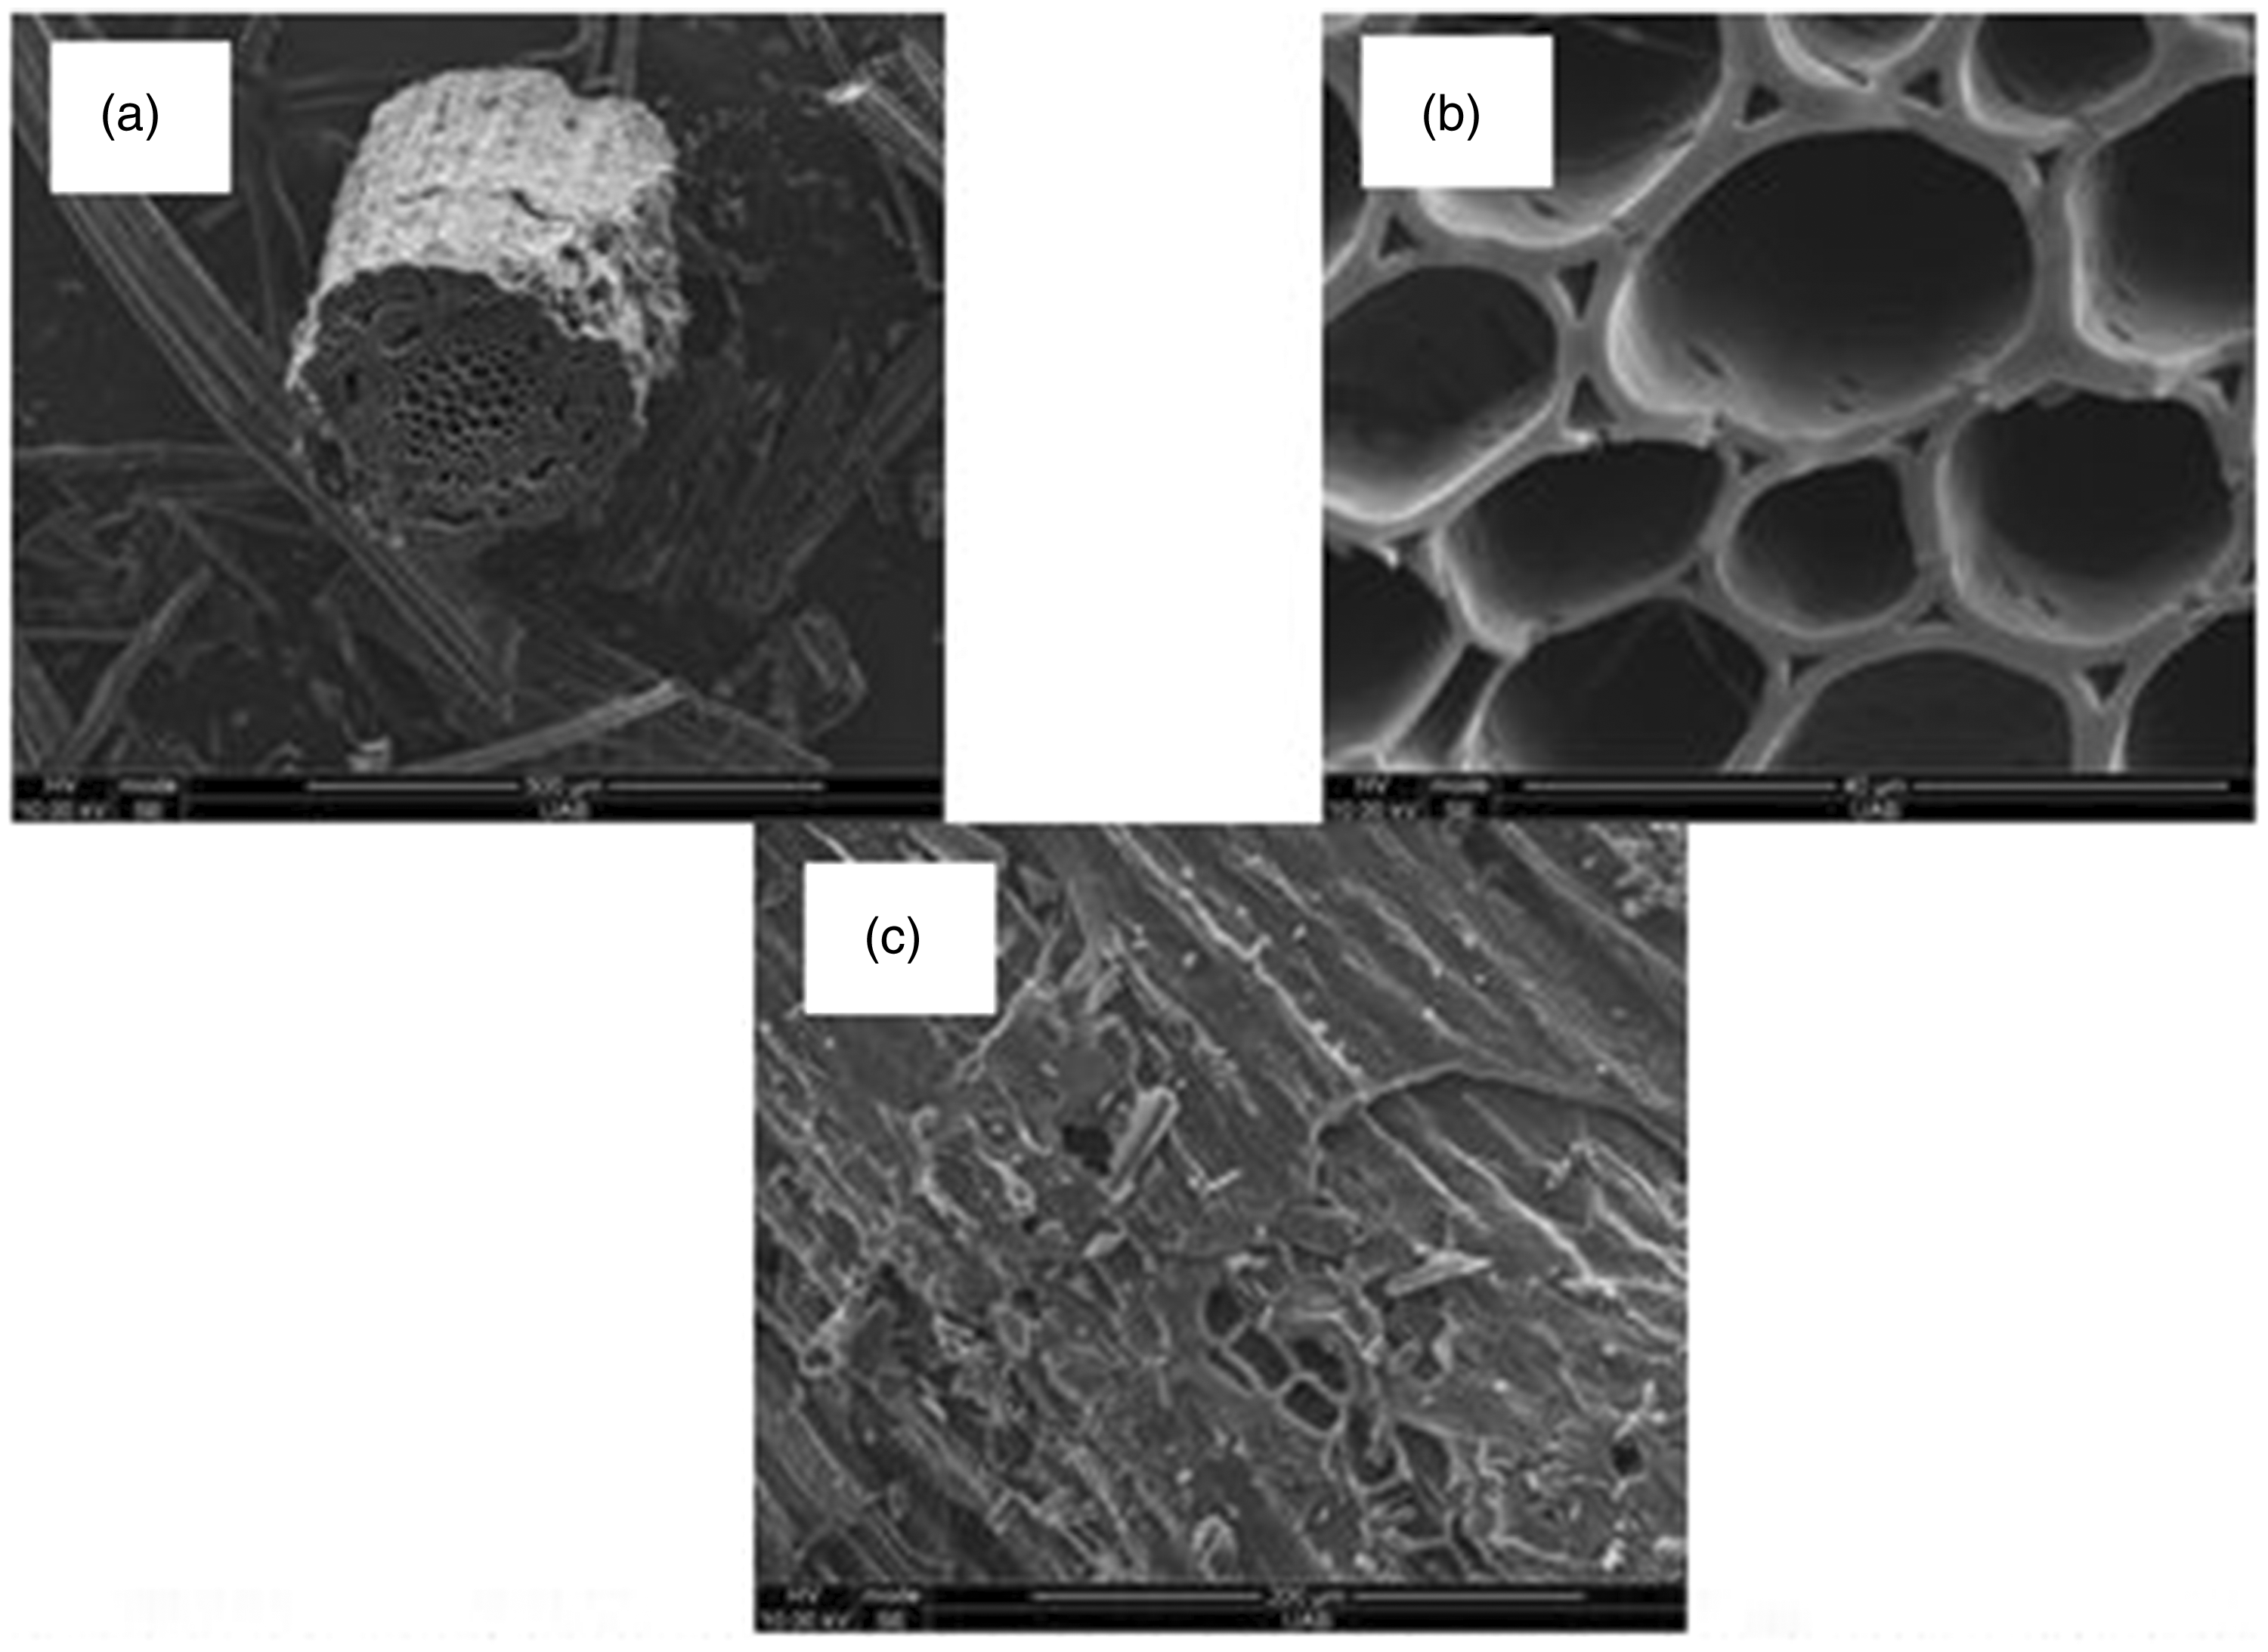
SEM was used for investigation of the porous structure present in the natural fiber-derived ACAs. Well-developed pores were clearly found on the surface of all natural fiber-derived ACAs (Figures 8 to 10). These studies prove that, after the carbonization and activation steps, the cross section of adsorbents became nonuniform with a wide variety of oval-shaped pores. Sample surfaces were fragmented and some particles were observed, which might be the residues that occurred during the carbonization or activation stage. The amount of pores and pore size distribution of the ACAs largely varies with different types (bast or leaf) of natural fiber. Moreover, SEM shows heterogeneous and irregular sizes of pores.
SEM images of hemp-derived activated carbon adsorbent: (a) cross section and (b) longitudinal surface. SEM images of flax-derived activated carbon adsorbent: (a) cross section; (b) enlarged area of cross section; and (c) longitudinal surface. SEM images of sisal-derived activated carbon adsorbent: (a) cross section; and (b) longitudinal surface.

FTIR
Typically, the AC adsorption capacity depends on porosity, surface area and the surface functional groups, such as carboxyl, lactone, phenol, and carboxylic anhydride (Katesa et al., 2013). Additionally, the surface functional groups determine the source of surface acidity (Devarly et al., 2007). Figure 11 shows the functional groups of flax-derived, hemp-derived, and sisal-derived ACAs. FTIR spectra of flax- and hemp-derived ACAs are quite similar because they belong to the family of bast fibers. Sisal fiber-derived ACA has different spectra compared to bast fibers since it belongs to the leaf fiber class.
Comparison of FTIR analysis of different natural fiber-derived activated carbon adsorbent types.
The peak at 3411 cm−1 is due to the absorption of water molecules as result of an O–H stretching in phenol vibration mode of hydrogen bonds and adsorbed water for sisal fiber-derived ACA. The peak at 1710 cm−1 corresponds to the stretching vibration of C=O in ketones, aldehyde, lactone, and carboxyl. The peak at 1572 cm−1 may be attributed to the aromatic C=C stretching vibration typically found in carbonaceous material; for instance, AC (Sricharoenchaikul et al., 2007). The peak at 1058 cm−1 represented ionized linkage P+-O- in acid phosphate esters and symmetrical vibration in a chain of P–O–P or C–O in carboxylic acids, alcohols, phenols, and esters (Devarly et al., 2007).
FTIR spectra of hemp-derived ACA and flax-derived activated carbon are very similar. The peak at 1541 cm−1 is attributed to the stretching of C=C stretch and this is also found in carbonaceous material. The peak at 1023 cm−1 is attributed to the bending of C–O in carboxylic acid, alcohols, and esters and the P=O bond in phosphate esters (Hesas et al., 2013). Another peak at 864 cm−1 is assigned to =C–H bending mode (Boonamnuayvitayaa et al., 2005).
The overall results indicate that natural fibers are good sources of precursors for preparation of mesoporous ACAs. Even though commercial ACs generally have surface areas around 1500 m2/g, their surface areas are between 400 and 2000 m2/g (Mohanty et al., 2005). Since the ACAs presented in this study are in the mid-surface area range, it can be seen that the ACs are comparable to commercial ACs. It was also found that H3PO4 at low concentration is a very effective chemical agent during the chemical activation of hemp, sisal and flax fibers to produce mesoporous ACAs.
The nature of the precursor material affects the AC surface area and porosity characteristics as well as the optimum carbonization and activation parameters. It should be noted that hemp fibers generate AC with the highest surface area, followed by flax and sisal fibers. This might be due to the lignocellulosic composition of the bast and leaf fibers which influences char yield and porosity because of the differences in thermal stability of the major components (i.e. lignin, cellulose, and hemicellulose).
The surface porosity was observed by using SEM. Although the magnification available for analysis on the SEM would not be able to detect micropores and mesopores, macropores were observed on the surface of the natural fibers.
Natural fiber-derived ACAs produced in this study have comparable surface area and porosity properties to commercial ACs. On the other hand, they are very brittle because natural fibers are thin, elongated structures; carbonization will tend to weaken the fibers (Mohanty et al., 2005). However, their brittleness can be eliminated by preparing fabric AC composites (Esclapez-Vicente et al., 2010).
Conclusions
During activation and carbonization, the polymeric structures of the samples decompose most of the non-carbon elements, such as H, O and N, in the form of liquid (called as tars) and gases, leaving behind a rigid carbon skeleton in the form of aromatic sheets and strips (Yakout and El-Deen, 2011). H3PO4 activation produces the reaction between organic species and the acid and this leads to form phosphate and polyphosphate bridges. The phosphate groups are inserted in the carbon matrix, separating the organic species. This process leaves the matrix with a highly porous structure after removal of the acid. The resulting AC fibers have a very high value of external area, a high mesopore volume and a very wide porous distribution. Natural fibers (hemp, flax and sisal) have a high potential for low-cost mesoporous ACA production. However, chemically ACAs prepared from bast fibers (hemp and flax) have better physical adsorption characteristics compared to the leaf fiber (sisal). Hemp-derived AC has the highest BET surface area (1359 m2/g) compared to the flax-derived AC (1257 m2/g) and sisal-derived AC (1186 m2/g). According to TGA, bast fibers decomposition temperature (419-434℃) is lower than that of sisal (515℃). Since the hemp fibers have the lowest decomposition temperature, they decomposed before sisal and flax fibers during the carbonization step and produced higher C percentage and surface area. Variations were very small for various pore volumes (total, micropore, mesopore) and pore size for all natural fiber-derived AC samples. It was also observed that the BET surface area is proportional to micropore and mesopore surface areas but inversely proportional to pore size. All adsorbents have high mesopore content (mesopore area content 60–69% and mesopore volume content 60–71%). The highest carbon content was also observed from hemp (bast)-derived AC (86%). Non-uniform porosity was observed through SEM which also confirms broad pore size distribution. FTIR analysis indicated that ACAs derived from sisal fibers (leaf) have acidic surface functional groups and the main functional groups are quite similar for flax- and hemp (bast)-derived ACAs. Overall, natural fiber derived for both bast and leaf type ACAs have great potential for applications including waste water purification (Song et al., 2012), separation of bio molecules, CO2 adsorption (Phan et al., 2006), and capacitors (Amri, 2008) which require predominantly mesoporous materials as adsorbates.
Footnotes
Declaration of Conflicting Interests
The author(s) declared no potential conflicts of interest with respect to the research, authorship, and/or publication of this article.
Funding
The author(s) disclosed receipt of the following financial support for the research, authorship, and/or publication of this article: The authors gratefully acknowledge the support of NSF-EPSCoR under award number EPS-1158862; Deep South Center, Pilot Project Research (grant number 2T42OH008436) from NIOSH, and The Center for Forest Sustainability, Auburn University.