
Abstract
Introduction
The numbers of patients with chronic kidney disease (CKD) progressing to end-stage kidney disease (ESKD) continue to increase world-wide, and CKD will become one of the most important chronic non-infectious conditions over the next decade. Patients with both CKD and ESKD are reported to be at greater risk of sarcopenia (muscle loss greater than that expected for age), and protein energy wasting (PEW) (Slee et al., 2020), with increased associated risk of hospitalisation and mortality. Dietary protein intake (DPI) is a major factor for both sarcopenia and PEW, as whereas the body has a supply of fat reserves, there is no equivalent protein store, and as such a negative protein balance will result in increased muscle catabolism and loss of muscle tissue.
Clinical guideline groups, including Kidney Disease Outcomes Quality Initiative (KDOQI), recommend that patients with CKD stage 3 restrict DPI to 0.55–0.60 g/kg/day (Ikizler et al., 2020), but once patients transition to dialysis then a greater DPI is recommended to compensate for protein losses in waste dialysate (Salame et al., 2018). However, many dialysis patients fail to achieve this increased target DPI (Shaaker and Davenport, 2024), as some simply continue with their low DPI following transition from pre-dialysis to dialysis. Whereas others, particularly those treated by peritoneal dialysis (PD), do not appear to have the same hunger profile for food compared to healthy individuals or haemodialysis patients (Wright et al., 2003), and may have a reduced appetite due to increased abdominal pressure, reflux oesophagitis, glucose absorption from the dialysate, and increased amounts of circulating anorexic hormones, including des-acyl ghrelin from the stomach and peptide YY from the colon.
The Appetite and Diet Assessment Tool (ADAT) questionnaire with 44 questions was developed to screen dialysis patients for inadequate nutritional intake and has been validated in North American and other haemodialysis populations (Salazar-Robles et al., 2021). However, this and the food enjoyment in dialysis (FED) (Buckner and Dwyer, 2003) questionnaire are burdensome for both patients and dietitians, especially with increasing numbers of elderly frail patients, who have greater additional co-morbidities, including vascular disease with less ability to sustain concentration and complete detailed questionnaires, now being treated by dialysis. Thus, a new Appetite and Food Satisfaction Questionnaire (AFSQ) was developed as a simple rapid screening tool and validated in PD patients (Melo et al., 2020). The AFSQ is based on six questions using the combination of a simple Likert score of 0 to 3 with a series of facial hedonic expressions ranging from a very happy smiley face to one with a serious frown (Buckner and Dwyer, 2003) (Appendix), so overcoming the language and educational barriers associated with the ADAT and FED questionnaires.
During the first wave of the COVID-19 pandemic in London, United Kingdom (UK), the hospital redeployed renal dietitians to support the acute clinical services, with all dietetic clinics and appointments cancelled. As such, patients received dietary advice in the form of leaflets, but to assess dietary intake PD patients were asked to compete the AFSQ when they attended for routine outpatient assessments of peritoneal membrane function. To determine the utility of the AFSQ in highlighting patients in need of dietary intervention, AFSQ food scores were compared with contemporaneous measurements of body composition, muscle strength and estimates of DPI, using standard equations based on 24-hour peritoneal and urinary urea losses.
Methods
Inclusion criteria
In this cross-sectional retrospective analysis, PD outpatients attending for routine assessment of peritoneal membrane function between January 2021 and September 2024 under the care of a university hospital, located in North Central London, were asked to complete the AFSQ (Appendix), and their scores reviewed. To avoid potential confounding by differences in pre-dialysis care and the transition to PD, only patients who had been established on PD for a minimum of 12 months were included. Other inclusion criteria included a stable PD prescription with no recent changes, and patients who had not been hospitalised in the previous 4 months. In cases of patients who had completed more than one AFSQ, only the first questionnaire score was reviewed.
Patients
Demographic and relevant clinical data: including age, gender, ethnicity, dialysis vintage, the presence of diabetes mellitus, along with the Stoke-Davies co-morbidity score (Davies et al., 2002), and an assessment of frailty, using the Rockwood Clinical Frailty Scale score (Rockwood et al., 2005), were obtained from computerised hospital medical records at the time of attendance. PD prescription details including PD modality (continuous ambulatory peritoneal dialysis – (CAPD), automated PD with a dry day (APD), automated PD with an additional daytime exchange (CCPD), prescription of icodextrin and hypertonic (22.7 g/L) glucose dialysis solutions and the number of dialysis exchanges were also recorded.
Measurements
Peritoneal membrane function was assessed by total weekly clearance of urea (Kt/Vurea), as the sum of both peritoneal and urinary Kt/Vurea, from 24-hour collections of effluent peritoneal dialysate and urine, respectively. Protein nitrogen accumulation, adjusted for body weight (nPNA), was used as a surrogate of estimated daily nitrogen protein intake and calculated using standard equations (Bergström et al., 1998; Davies et al., 2000), and middle size molecule clearance by serum beta 2 microglobulin (β2 M). Peritoneal solute transport rate (PSTR) was calculated as the equilibration ratio between the 4-hour plasma and dialysate for creatinine (4 hours D/P Cr) using a 2.0-L, 22.7-g/L exchange, with creatinine measured enzymatically (Yoowannakul et al., 2018). Peritoneal glucose absorption was determined as the difference between the amount of glucose instilled in fresh dialysate and the amount of glucose recovered in the corresponding 24-hour drained effluent dialysate (Tangwonglert and Davenport, 2021). Glucose calories were calculated based on 3.76 calories/g glucose absorbed. Sodium losses were calculated as the difference between the total amount of sodium infused in fresh dialysate and both the amount of sodium in the 24-hour total effluent dialysate and 24-hour urinary sodium. Body composition was determined by multi-frequency bioimpedance measurements (InBody 770, In Body Seoul, South Korea) in a standardised manner, with PD dialysate drained out and after emptying the bladder at the end of the peritoneal equilibration test (Davenport, 2013). Bioimpedance equipment was regularly serviced and calibrated and previously validated against dual energy x-ray absorptiometry (Fürstenberg and Davenport, 2011). Extracellular to total body water (ECW/TBW), and extracellular water to height (ECW/ht) were record along with fat mass, percentage body fat mass and muscle mass as appendicular lean mass (ALMI). All these measurements were then indexed to height squared to allow comparison between patients.
Muscle strength was assessed by hand grip strength (HGS) measured using a calibrated grip-D strength dynamometer (Takei Scientific Instruments Co, Nigata, Japan). Patients were instructed according to the manufacturer's instructions as how to perform their maximal voluntary effort, and the maximum value of three measurements in the dominant arm recorded (Camilleri et al., 2017). To adjust HGS measurements for body size, age and sex, HGS was indexed to allow comparison between patients (Nguyen and Davenport, 2025).
Statistical analysis
The D’Agostino Pearson test was used to determine normality, and statistical analysis was by Chi-squared test (χ2) or Fisher's exact test to analyse categorical data between groups, along with the ANOVA or Kruskal–Wallis test for analysis of numerical data between groups with appropriate correction for multiple testing by Tukey, Friedman or Games Howel, respectively. Spearman correlation was used for univariate analysis, A step backwards multi-variable regression model was developed to investigate variables associated with the AFSQ score entering all variables with P < 0.1. If required variables were log transformed. Variables which were not significant, and did not improve model fit were then eliminated. Models were checked for collinearity and collider bias. Statistical analysis was undertaken using SPSS version 29.0 (IBM, Armonk, NY, USA) and GraphPad Prism version 10.4.1 (San Diego, CA, USA). Data are presented as integer, mean ± standard deviation, for normally distributed data and median (interquartile range) for non-parametric data, or as a percentage. Statistical significance was taken as P < 0.05.
Ethics
This retrospective audit complied with both hospital and UK National Research Ethics Service guidelines for clinical audit and service development and did not require individual patient consent. In keeping with UK National Research Ethics Service guidelines all individual patient data was fully anonymised.
Results
During the audit period 280 ESKD patients were treated with PD, but only 177 had been treated for ≥12 months and completed at least one AFSQs. The mean age of the patients studied was 61.8 ± 15.2 years, 103 (58.2%) males, 83 (46.9%) diabetic, with a median PD treatment duration (vintage) of 17 (14–30) months. The main ethic groups where White (36.2%), Black (34.5%) and Asian (27.7%). Most were treated by CCPD (65.5%), followed by CAPD (35%) and APD (8.5%), with 86.4% prescribed icodextrin and 62.1% 22.7 g/L glucose dialysates.
The median AFSQ score was 5 (3–8), with a range from 0 to 17. Patients were divided into terciles according to their food satisfaction score, those with lowest food satisfaction score (0–3), middle score (4–6) and highest score (≥7). Out of the six questions, the question with the highest scores, and greatest separation between groups scores was appetite, followed by taste, wanting to eat and then enjoyment of food (Figures 1 and 2).
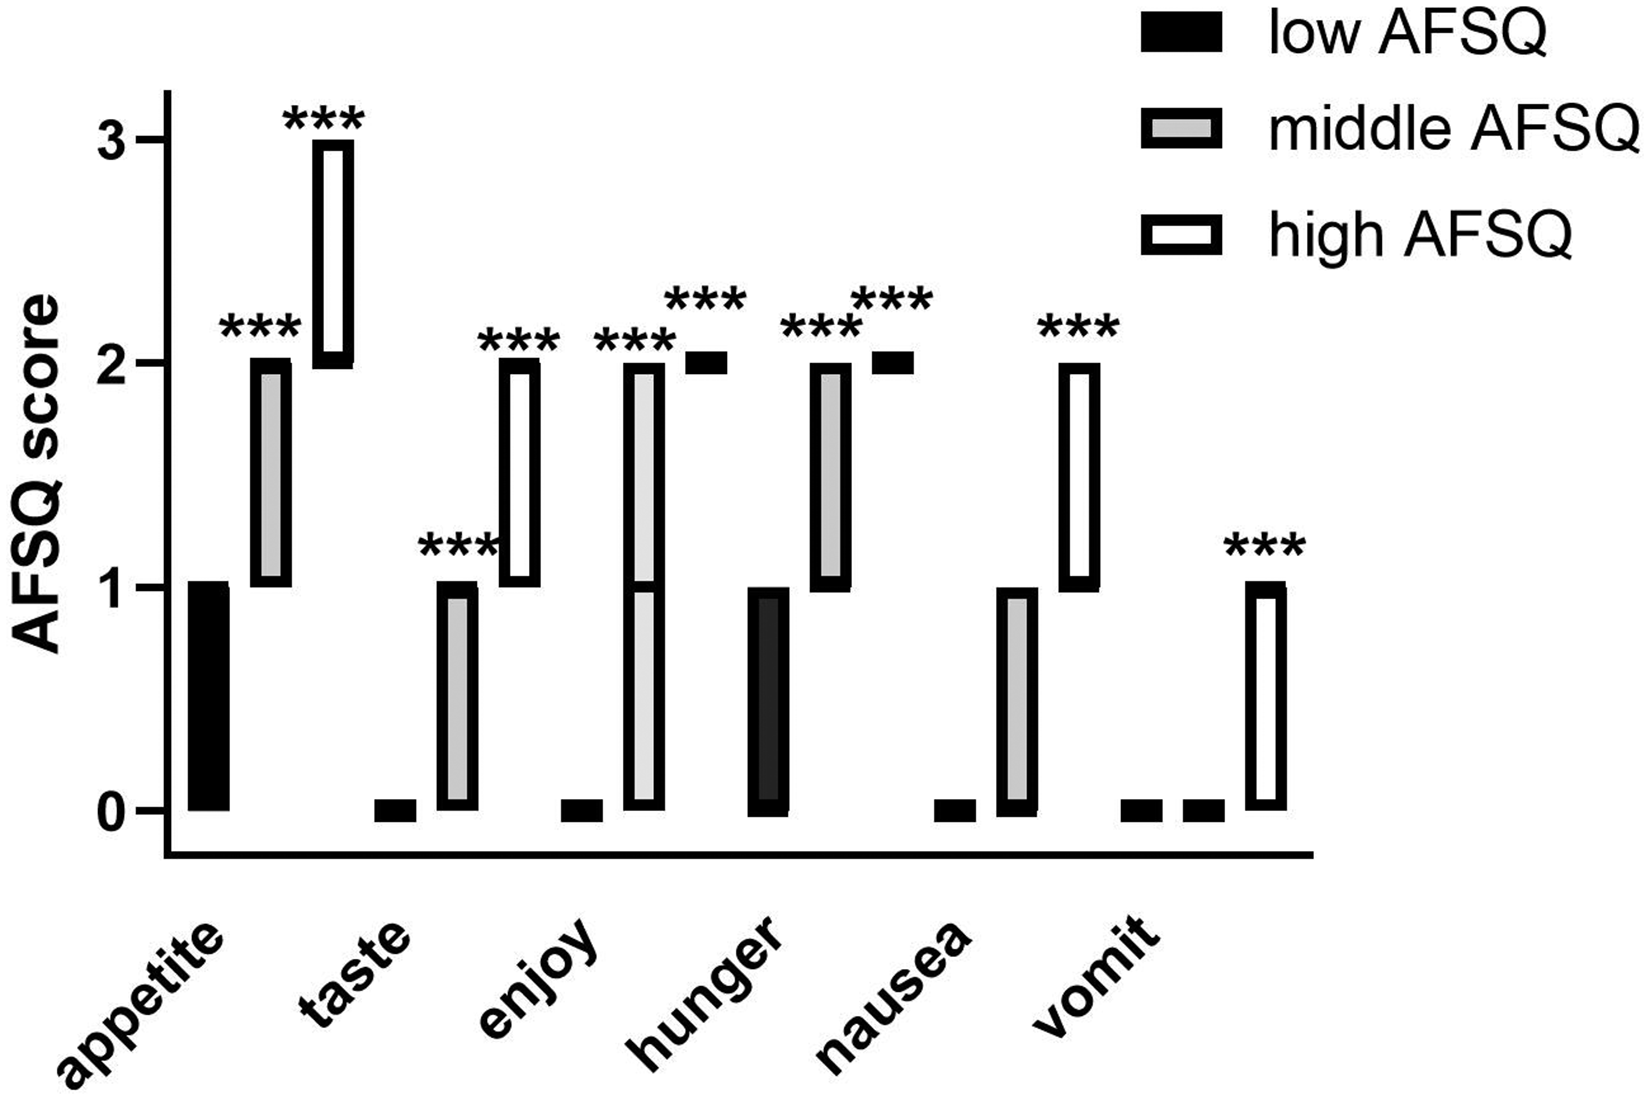
Appetite and Food Satisfaction Questionnaire (AFSQ) scores for the six individual questions, with patients divided according to their total score: low (0–3), middle (4–6) and high food dissatisfaction (≥ 7). ***P < 0.001 vs low group.
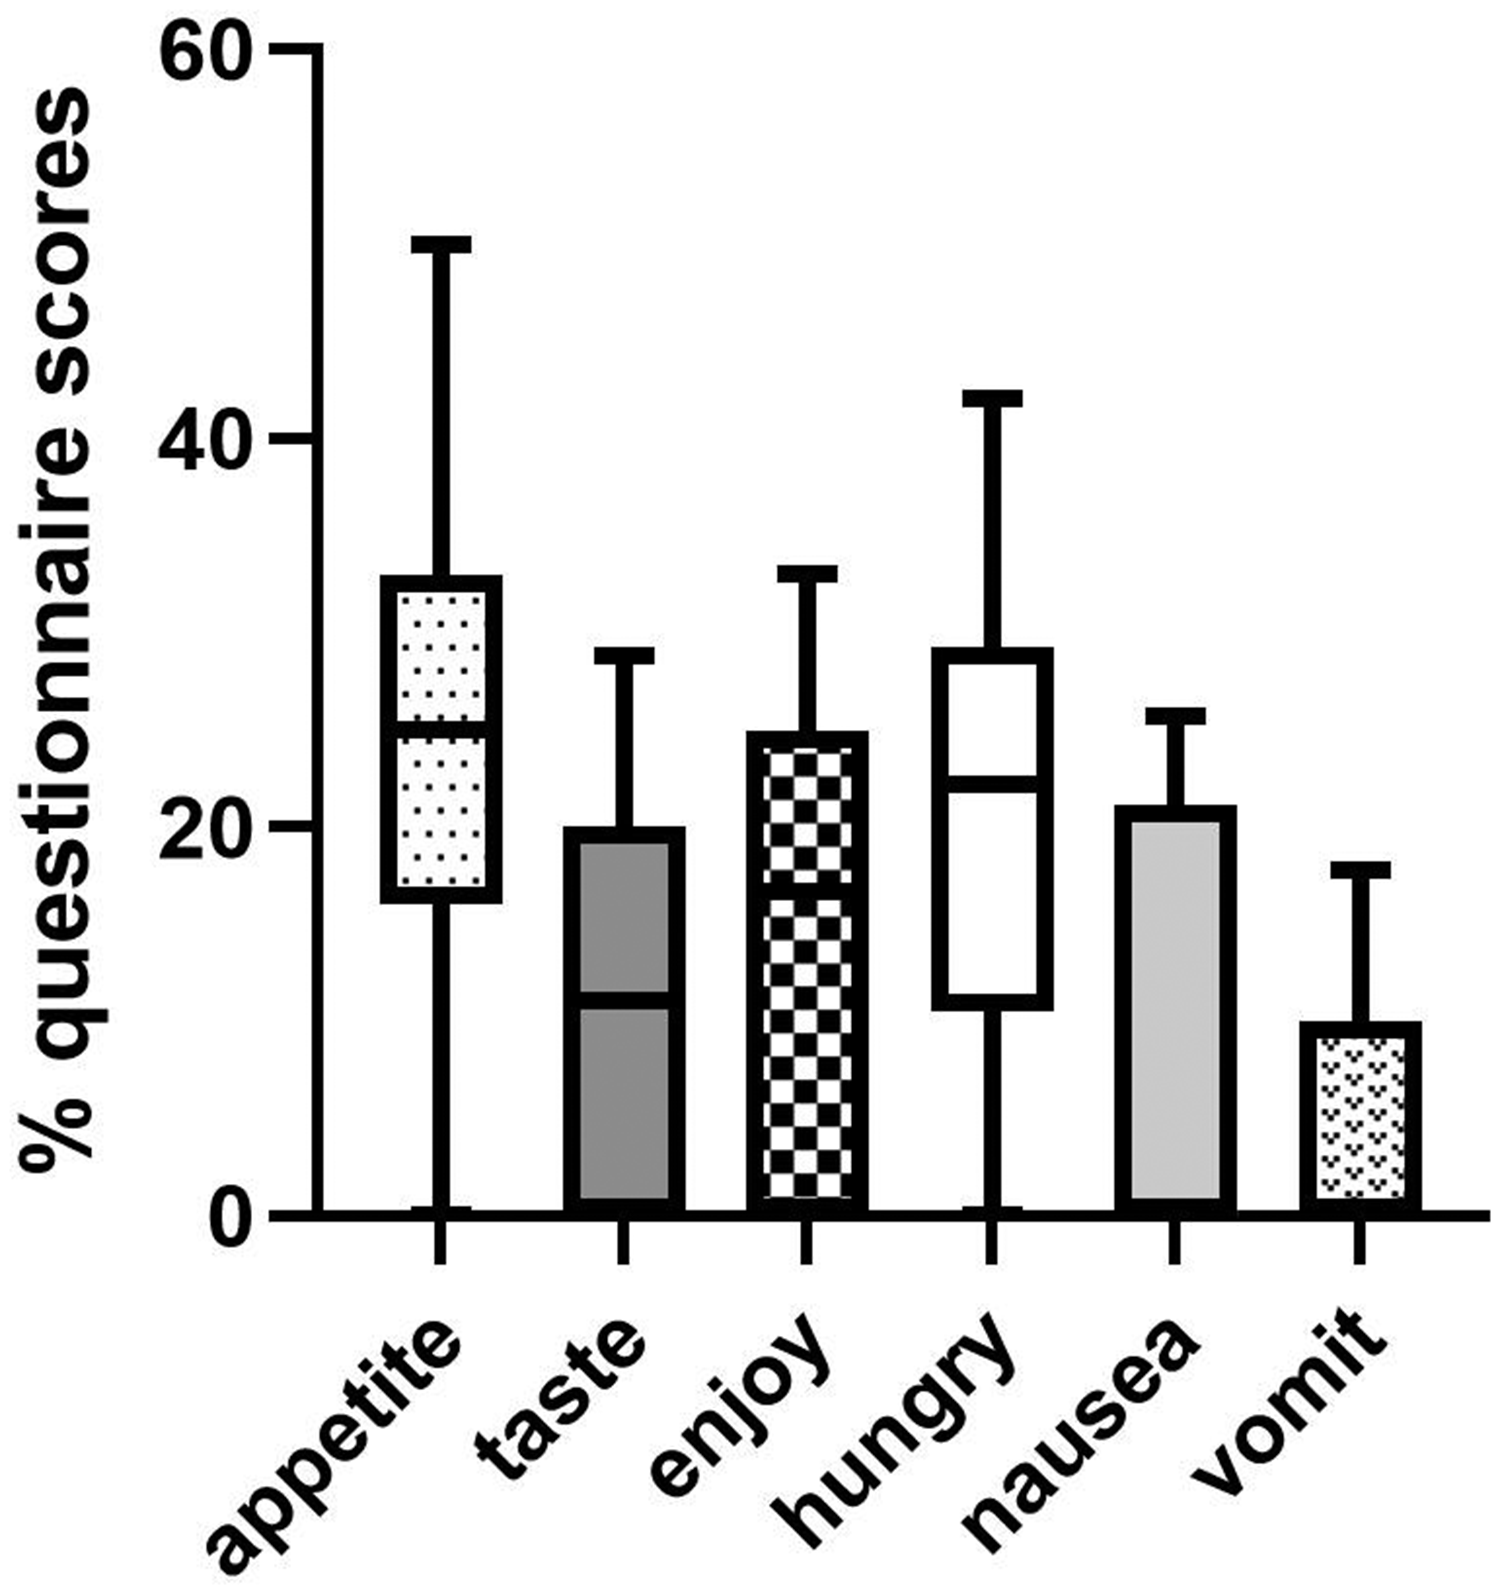
Percentage of the total Appetite and Food Satisfaction Questionnaire (AFSQ) scores for the six individual questions. Data as median, interquartile and 10% to 90% confidence limits. Appetite score P < 0.01 vs enjoyment, <0.001 vs taste, nausea and vomiting. Taste <0.05 vs hunger and vomiting, Enjoyment P < 0.001 vs nausea and vomiting, and hunger P < 0.001 vs nausea and vomiting.
There were no significant differences between the groups in terms of age, gender, ethnicity, co-morbidity and frailty (Table 1). Similarly, there were no differences in PD prescriptions or the assessments of peritoneal membrane transport. Although there was a trend for the group with the lowest scores to have greater residual urine output and absorb fewer glucose calories from the dialysate, but these were not significant. However less sodium was removed daily from the group with the highest scores.
Patient characteristics and peritoneal dialysis prescriptions and results of peritoneal membrane testing according to Appetite and Food Satisfaction Questionnaire scores.
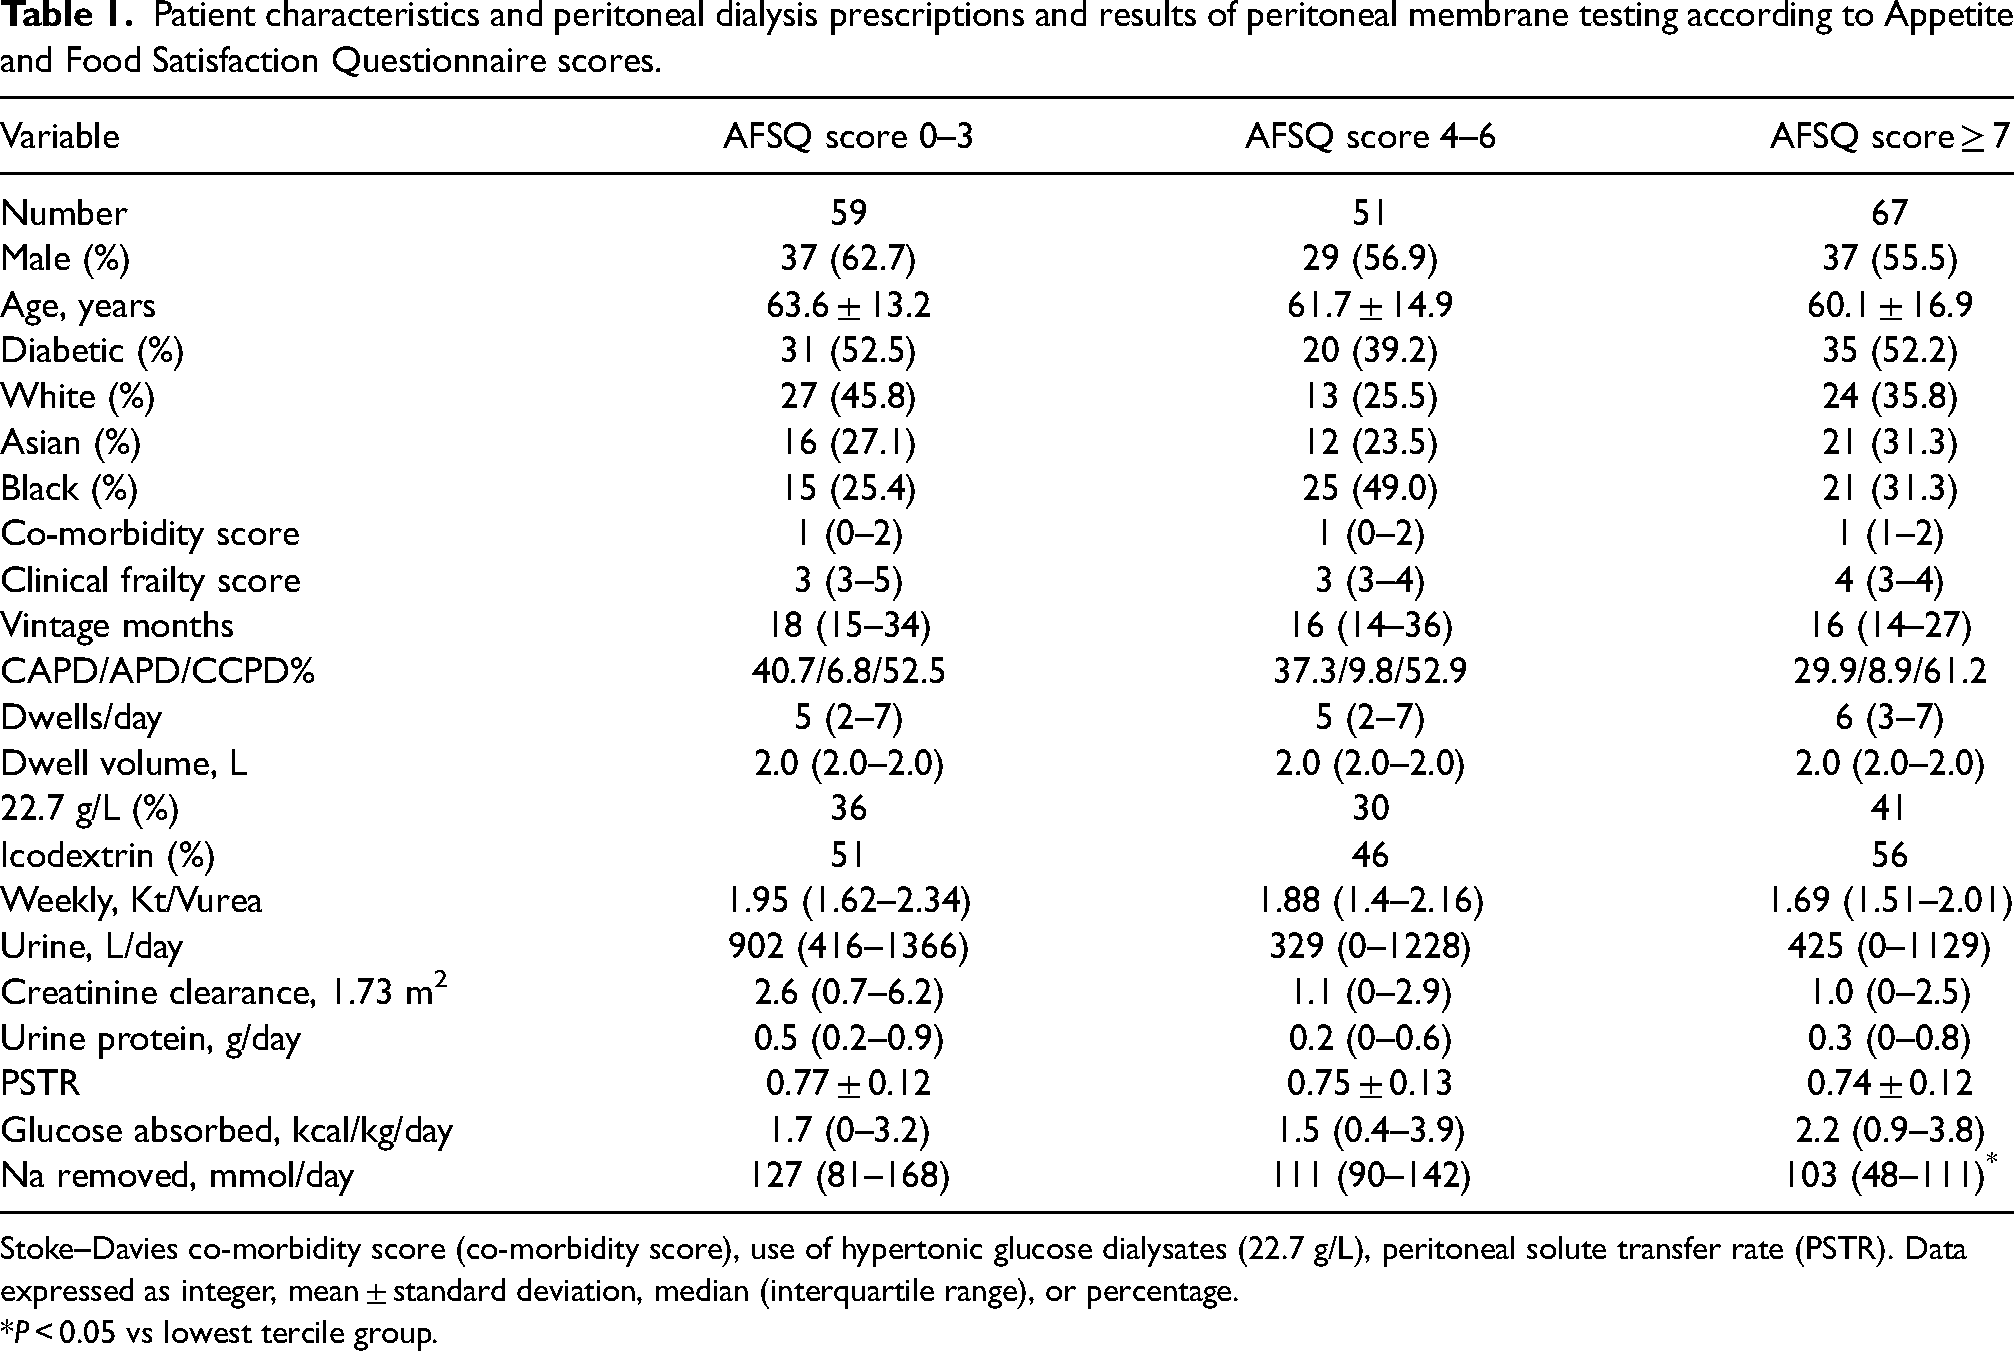
Stoke–Davies co-morbidity score (co-morbidity score), use of hypertonic glucose dialysates (22.7 g/L), peritoneal solute transfer rate (PSTR). Data expressed as integer, mean ± standard deviation, median (interquartile range), or percentage.
P < 0.05 vs lowest tercile group.
Although estimated DPI was lower in the group with higher AFSQ scores, body composition was not significantly different, although there was a trend for lower ALMI and HGS with higher AFSQ scores (Table 2). Apart from serum potassium, there were no other significant differences in laboratory investigations, although there was a trend for lower serum urea in those with higher AFSQ scores.
Patient body composition and laboratory results according to the Appetite and Food Satisfaction Questionnaire scores.
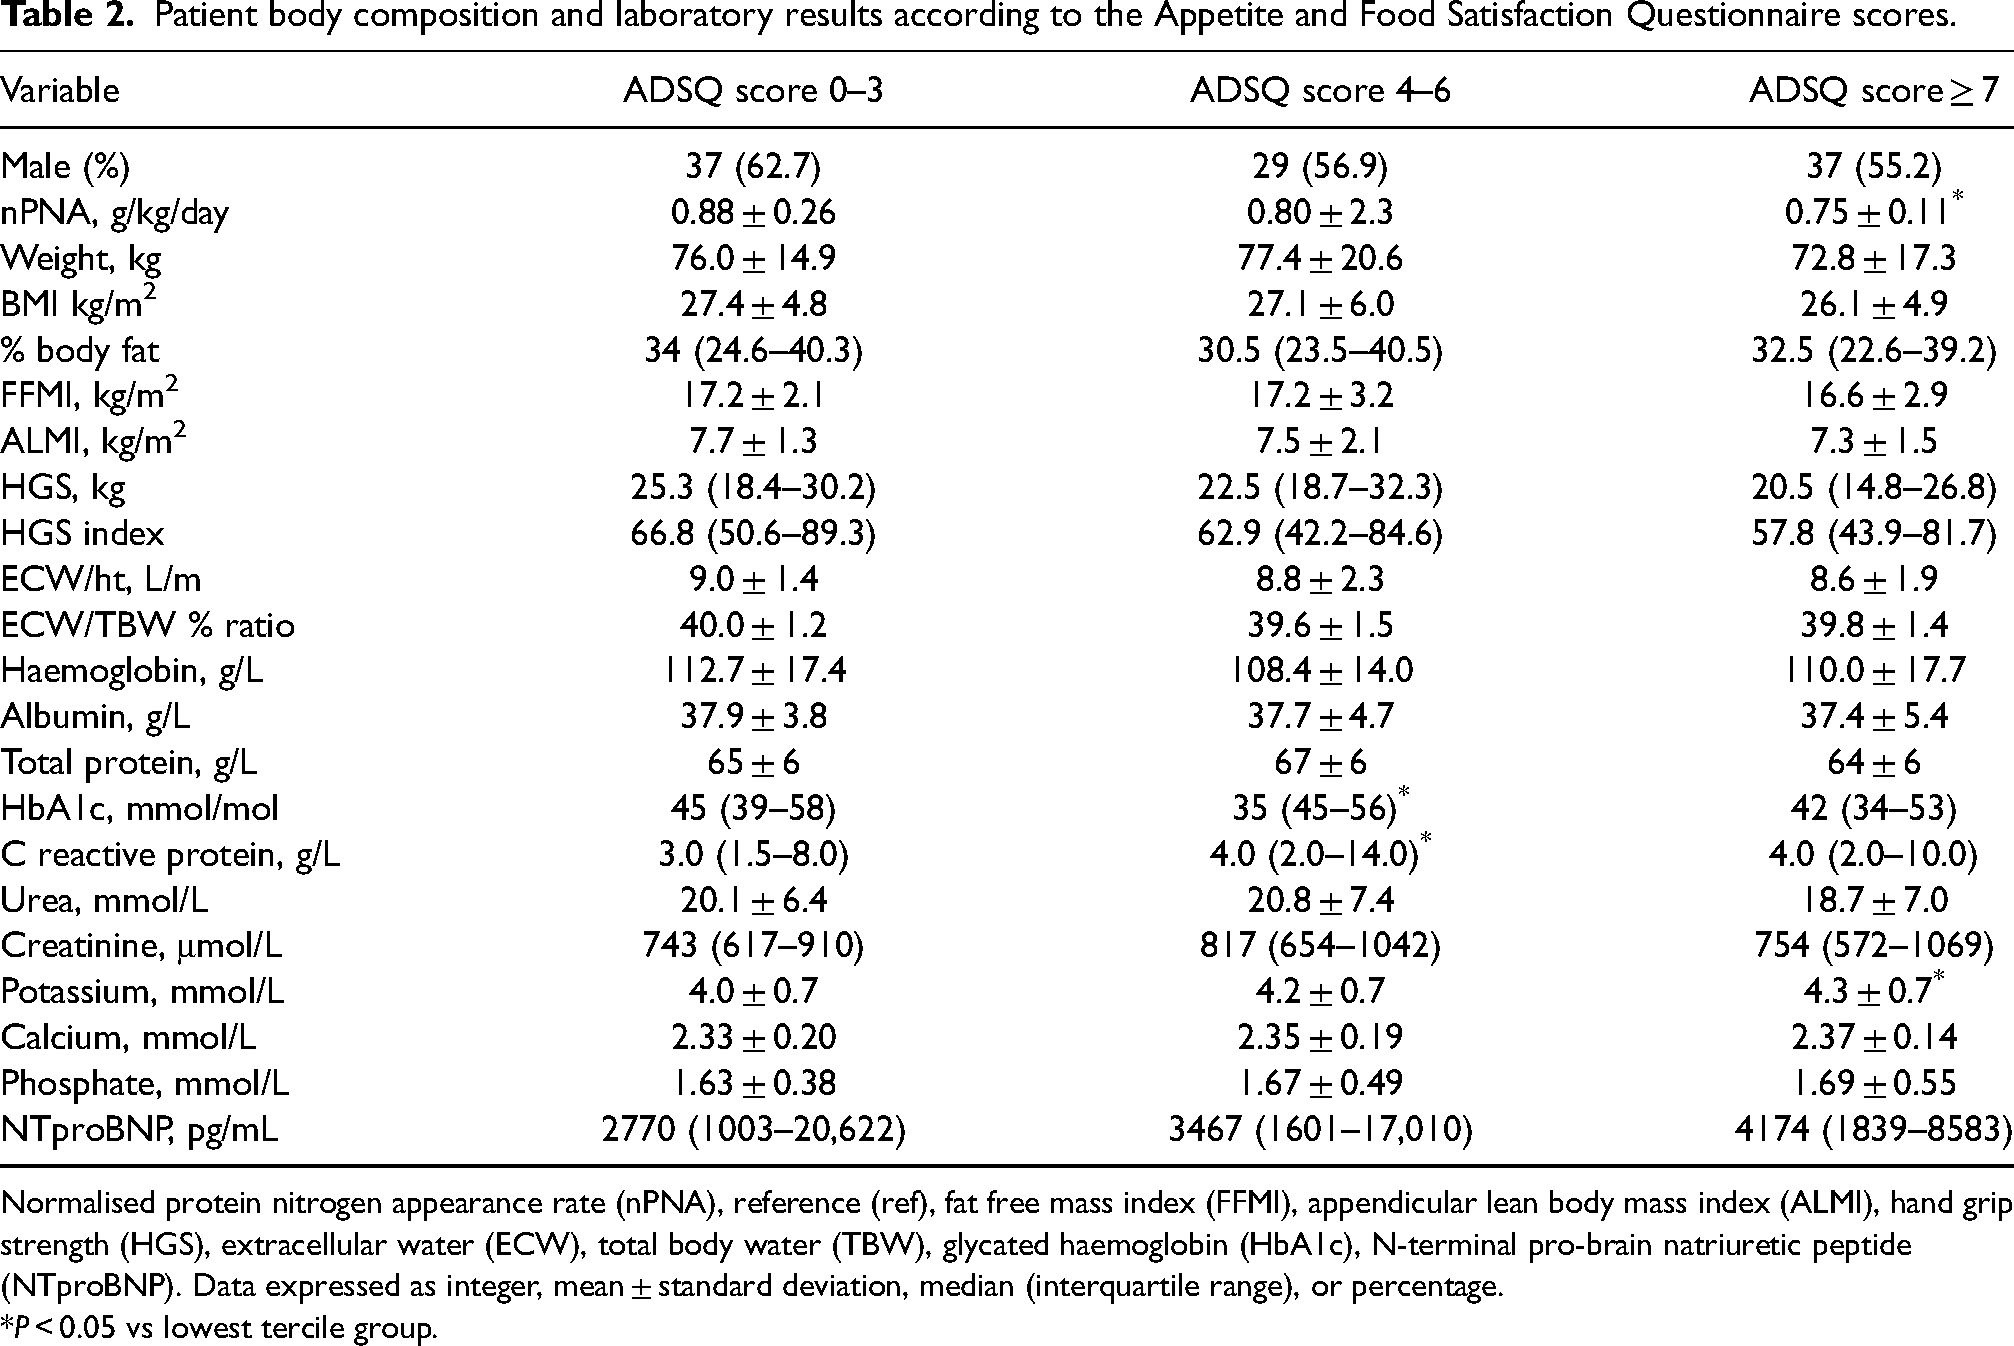
Normalised protein nitrogen appearance rate (nPNA), reference (ref), fat free mass index (FFMI), appendicular lean body mass index (ALMI), hand grip strength (HGS), extracellular water (ECW), total body water (TBW), glycated haemoglobin (HbA1c), N-terminal pro-brain natriuretic peptide (NTproBNP). Data expressed as integer, mean ± standard deviation, median (interquartile range), or percentage.
P < 0.05 vs lowest tercile group.
On univariate analysis, AFSQ scores were positively associated with serum potassium and calcium, but negatively with measures of residual kidney function, estimates of DPI, daily sodium losses, peritoneal glucose absorption, faster peritoneal membrane transport, HGS and both urinary and peritoneal protein losses (Table 3).
Spearman univariate associations with the Appetite and Food Satisfaction Questionnaire total scores.
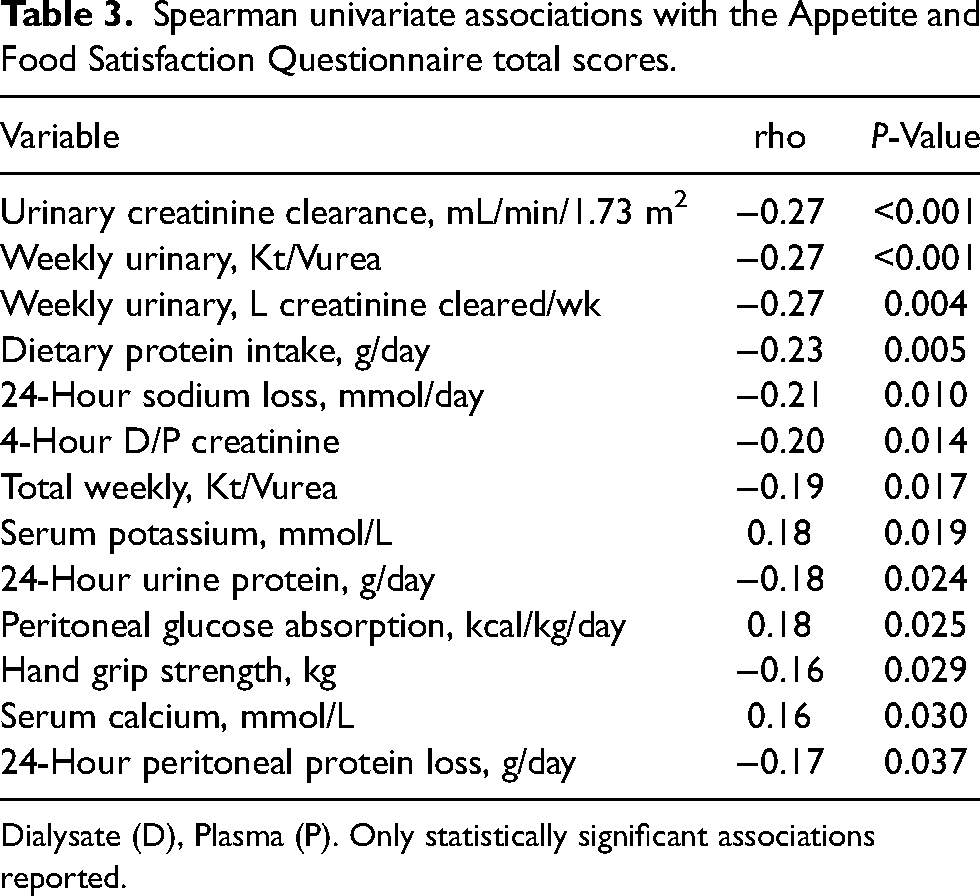
Dialysate (D), Plasma (P). Only statistically significant associations reported.
A step backward multi-variable model was analysed, and variables independently associated with increasing AFSQ scores included serum potassium, more positive daily sodium balance (lower sodium removal), whereas lower scores were associated with higher estimated DPI and higher lean body mass (Table 4).
Step backward multi-variable regression model for factors associated with a greater Appetite and Food Satisfaction Questionnaire (AFSQ) score.
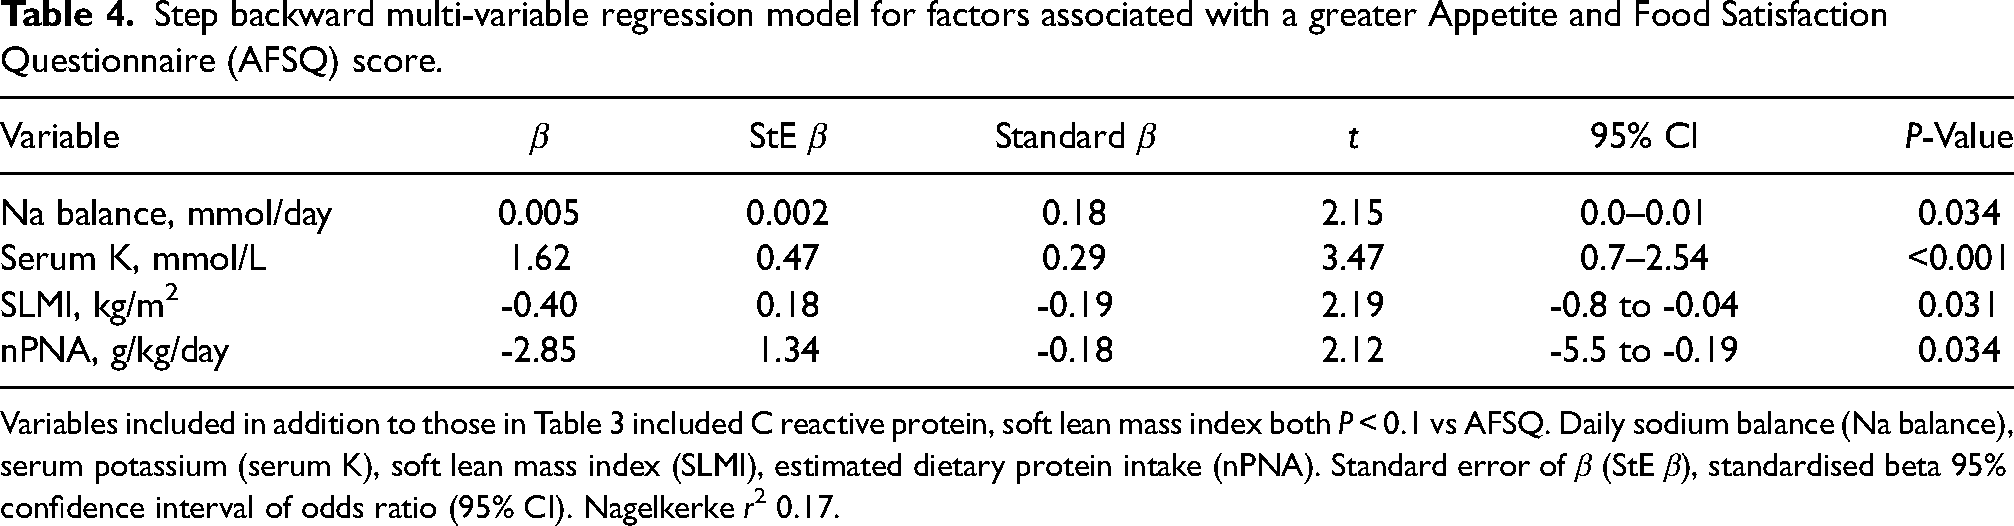
Variables included in addition to those in Table 3 included C reactive protein, soft lean mass index both P < 0.1 vs AFSQ. Daily sodium balance (Na balance), serum potassium (serum K), soft lean mass index (SLMI), estimated dietary protein intake (nPNA). Standard error of β (StE β), standardised beta 95% confidence interval of odds ratio (95% CI). Nagelkerke r2 0.17.
Discussion
The AFSQ was introduced into routine clinical practice following redeployment of dietitians during the years of the COVID epidemic, and this retrospective analysis was undertaken to evaluate the AFSQ as a simple screening tool to detect malnutrition and trigger dietitian referrals. The PD program in North central London serves a multi-ethnic population, with most patients coming from the black and ethnic minorities, and of the white minority, 1/3 originated from outside the UK. Thus, using the standard 44 questionnaire ADAT as a screening tool to detect patients at risk of malnutrition can be problematic when dealing with a population who may not have English as their primary, or even secondary language. Whereas our PD nursing team found that our ethnically diverse patients could readily complete the short six question AFSQ, which combines a pictorial score with a simple Likert scale.
A previous smaller study using the AFSQ in PD patients in Brazil reported that malnutrition was significantly greater in those with higher scores, and that some indices of body composition and HGS were also lower in those with higher food dissatisfaction scores (Salazar-Robles et al., 2021). As with this earlier study, the question on appetite had the highest scores, and also demonstrated the greatest discrimination between groups,
To overcome the potential confounders associated with the transition from pre-dialysis CKD to initiating dialysis, only PD patients who had been dialysed for a minimum of 12 months and with stable PD prescriptions were included. A reduction in residual kidney function was found to be a key factor associated with higher food dissatisfaction scores, and poor appetite. It is recognised that DPI naturally decreases as residual kidney function declines in patients with progressive CKD (Ikizler et al., 1995), and a previous report also observed that dietary intake was lower in group of Chinese PD patients with reduced urinary output (Li et al., 2016). Female gender was also associated with higher AFSQ scores in the earlier smaller study from Brazil, but although there was a slight increase in the number of female patients in the group with the highest scores, this was not significant. Whether this is due to differences in the endocrine control of appetite and adipokines released from body fat stores, or relates to differences in the choice of foods, or societal pressures on body image for women in Brazil and the UK remains to be determined (Golembiewska et al., 2013; Westenhoefer, . 2005). Whereas earlier studies in the pre-icodextrin era suggested that faster peritoneal transport was associated with reduced appetite (Chung et al., 2011; Golembiewska et al., 2013), this study noted an association with slower transport. Although not significant, fewer patients with higher AFSQ scores were treated by CAPD, with more using CCPD along with greater usage of hypertonic glucose dialysates with more glucose calorie absorption on univariate analysis. Whereas previous studies have reported hypokalemia in malnourished PD patients (Zanger, 2010), an association was noted between higher AFSQ scores and a higher serum potassium concentration, but this may reflect patients with higher AFSQ scores having lower residual kidney function, and lower urinary potassium excretion (7 (0–20) vs 14.5 (7–28) mmol/day). In addition, PEW can lead to potassium release from muscle, and those with reduced appetite may stop or no longer follow dietary restrictions.
On multi-variable testing those patients with the lowest AFSQ scores, had higher estimated DPI (nPNA), greater 24-hour combined urinary and peritoneal sodium losses, and greater soft lean tissue mass adjusted for body size. As there were no differences in markers of ECW expansion; N-terminal probrain natriuretic peptide, or the ratios of ECW/TBW or ECW/ht, the differences in daily sodium losses would suggest that those with better appetite and lower AFSQ scores consumed greater amounts of dietary sodium and so had greater losses, whereas those with either a sodium gain or lower sodium losses had higher AFSQ scores and presumably lower dietary sodium intake.
As with any retrospective observational study, only associations can be reported. Due to the COVID-19 pandemic detailed contemporaneous dietary histories could not be obtained from trained renal dietitians. However, the association between AFSQ scores and nPNA would suggest a role for the AFSQ as a screening tool. Although there was an association with lean body mass and lower AFSQ scores, by using a cross-sectional design, this study was unable to determine whether patients with persistently lower AFSQ scores lost body fat or lean tissue.
On the positive side, the PD staff found that their multi-cultural PD population were able to complete this short six question form, and those patients with higher food dissatisfaction scores had lower estimates of DPI. Thus, the simple to use AFSQ may have a role as a screening tool to highlight patients for formal dietetic review, particularly in resource limited centers.
Supplemental Material
sj-pdf-1-nah-10.1177_02601060251368433 - Supplemental material for Evaluation of the Appetite and Food Satisfaction Questionnaire (AFSQ); a simple dietary tool to screen for peritoneal dialysis patients with reduced diary intake
Supplemental material, sj-pdf-1-nah-10.1177_02601060251368433 for Evaluation of the Appetite and Food Satisfaction Questionnaire (AFSQ); a simple dietary tool to screen for peritoneal dialysis patients with reduced diary intake by Andrew Davenport in Nutrition and Health
Footnotes
Acknowledgements
The author wishes to thank his patients.
Authors’ contributions
AD collected and analysed data, and approved final manuscript version.
Availability of data and materials
Data was collected as part of clinical practice. Anonymised data set with all identifiers removed is held on Royal Free Hospital servers. All reasonable applications for the data set will be considered in accordance with NHS procedures and practices.
Consent to participate
Written informed consent was waived by UK National Research ethics. All patient data was anonymised prior to analysis.
Declaration of conflicting interests
The author declared no potential conflicts of interest with respect to the research, authorship, and/or publication of this article.
Ethical statement
Audit of clinical practice complied with UK National Research ethics codes of practice.
Funding
This retrospective audit of clinical practice did not require formal ethical approval as stated by UK National Research Ethics Service.
Supplemental material
Supplemental material for this article is available online.
References
Supplementary Material
Please find the following supplemental material available below.
For Open Access articles published under a Creative Commons License, all supplemental material carries the same license as the article it is associated with.
For non-Open Access articles published, all supplemental material carries a non-exclusive license, and permission requests for re-use of supplemental material or any part of supplemental material shall be sent directly to the copyright owner as specified in the copyright notice associated with the article.