
Abstract
Purpose of the Review:
Diagnostic and treatment accuracy of depression can lead to a better and possibly earlier response and remission in patients. The literature, though scanty, seems to suggest that quantitative electroencephalography (QEEG) can predict the outcome of antidepressant effects.
Collection and Analysis of Data:
Articles published between January 1990 and July 2019, including those dealing with QEEG recordings before and after the initiation of antidepressant medication, were included. The pooled effect size and subgroup analysis of waveforms were calculated to predict response to antidepressants. In all, 572 results were retrieved from the searches, of which 20 studies were included. Pooled data using a random-effects model (REM) calculated an effect size of 0.80 (95% CI [0.64–0.97]). Heterogeneity of the sample was low with Tau² = 0.02; df = 18 (P = .30); I² = 12%. Moreover, subgroup analysis showed that theta band frequencies were better at predicting response than alpha band frequencies (the standard mean difference [SMD] for theta was 0.91 compared to 0.68 for alpha waves).
Conclusions:
QEEG is a valuable predictor of the antidepressant response. Among the EEG frequencies, the theta band showed the most significant change with treatment.
Question: What is the evidence for using resting-state QEEG in predicting antidepressant treatment response (ATR)? Findings: Response to antidepressants correlates with decreased prefrontal cordance, changes in the ATR index, and frontal spectral powers. Frontal alpha and theta waves also predict SSRI treatment response, with significant effects observed after two weeks. Theta waves show better predictive ability for ATR in subgroup analysis. Meaning: Resting-state QEEG shows promise in predicting antidepressant treatment response.Key Messages:
The remission rate of first-line antidepressants is approximately 30% in depression,1,2 and it can take as much as six to eight weeks of an adequate dose of an antidepressant before treatment failure is considered. 3 Studies addressing an early prediction of treatment response have included predictions based on depression rating scales, 4 and/or neuroimaging scans, 5 but the results are equivocal.
Quantitative electroencephalography (QEEG) might be time-consuming considering the pre-placement of electrodes, but as per a recent meta-analysis by Watts et al. in 2022, EEG represents a cost-effective and scalable potential measure to predict treatment response with promising predictive models. 6 QEEG is also non-invasive and easy to administer, though it seems less cost-effective in the Indian scenario or other low to middle-income countries. Various factors derived from QEEG recordings are mentioned in the literature, such as power at each electrode, Cordance (which is also shown to be a reliable indicator of low perfusion, low metabolism, and association with undercutting lesions in the brain);7–10 increased theta and delta power, before starting medication, is related to poor treatment response; 11 and the antidepressant treatment response (ATR) index, which is calculated from the EEG at the baseline and after one week of antidepressant therapy.9,12 Detailed definitions and details for calculations of these parameters are given.9,13
A recent meta-analysis 14 used multiple QEEG markers (spectral power density, Cordance, Event-Related Potentials [ERP]), Loudness Dependence of Auditory Evoked Potentials [LDAEP], and ATR) to predict the treatment response from different treatment modalities (medications, somatic therapy, psychotherapy and combinations of these) in depressed patients. The results indicated insignificant overall predictive power. The present review aims to quantitatively summarize the strength of the studies dealing with the resting-state QEEG and prediction of the ATR.
Methods
Search Strategy
The research studies were searched following a fourfold process. Databases searched were PubMed Central, PsycINFO, Embase, ClinicalTrials.gov, Cochrane Central Register of Controlled Trials, WHO International Clinical Trials Registry Platform (ICTRP), Cochrane Database of Systematic Reviews, Database of Abstracts of Reviews of Effects (DARE) and Open Gray database (research reports, doctoral dissertations and conference papers), using the keywords ((“Major Depression” OR “Anaclitic Depression” OR “Dysthymic Disorder” OR “Endogenous Depression” OR “Late Life Depression” OR “Postpartum Depression” OR “Reactive Depression” OR “Recurrent Depression” OR “Treatment Resistant Depression” OR depressi*) AND (“Quantitative Electroencephalogram” OR QEEG)), for articles published between January 1990 and June 2019. A hand search of selected journals for relevant articles from 2010 onwards was then performed (SJ). Finally, authors were contacted via email for study protocols, conference proceedings, unpublished data, and unavailable full-text articles. The preliminary screening of the articles, based on title and abstract, was performed independently by researchers AS and SJS, using the software RAYYAN. 15 Any dispute(s) was resolved consensually by the authors (SS, SJS, AS, and SJ).
Eligibility Criteria
Studies included were (a) written in English; (b) had a study population age range from 20 to 80 years; (c) studies designed as randomized controlled trials—double-blind, open-label, and cross-over designs; (d) and studies with comparator group(s) as either an active comparator or placebo. Only those studies were further included that (e) used ICD or DSM criteria for diagnosis, (f) standardized interviews (SCID, CIDI) as well as standard rating scales (Beck Depression Inventory (BDI), 16 Hamilton Depression Rating Scale (Ham-D), 17 Montgomery-Asberg Depression Rating Scale (MADRS), 18 Quick Inventory of Depressive Symptomatology Self Report (QIDS-SR) 19 for recording symptoms severity of (g) patients with depression, bipolar depression, treatment-resistant depression and comorbid medical and psychiatric conditions, and (h) received treatment from the following classes of antidepressants (SSRI, SNRI, TCA, NaSSa, NARI, SARI), with an optimum treatment dose for at least two weeks. Their (a) treatment outcomes were recorded by researchers as either a reduction in depression scores or categorization as responders/non-responders by clinicians (>50% reduction in scores on the standardized rating scales). Studies were excluded in the case of (a) Factorial RCT study design with a combination of treatment modalities and (b) psychological/somatic therapy as comparator groups.
Quality of the Studies
The methodological quality of the selected studies was assessed independently by authors SJS and AS using Cochrane Collaboration assessment tools—RoB-2 for randomized studies20,21 for non-randomized studies. The studies were then classed as either having a high risk of bias (one or more criteria not applied/met), a moderate risk of bias (one or more criteria unclear), or a low risk of bias (all criteria applied/met).
Data Extraction and Statistical Analysis
The relevant data regarding sample size, depression subtype, depression assessment tool, antidepressant drug along with the dosage, duration of treatment, and QEEG markers from all studies were extracted by the authors, SJS and AS (Table 1). OpenMeta[Analyst] 22 software was used to calculate the effect size. The publication bias was assessed using funnel plot characteristics. Heterogeneity between studies was calculated using Cochran’s Q and Thompson—Higgins I 2 statistic. A P value of <.10 for the Chi 2 statistic or an I 2 > 50% was considered for significant heterogeneity. Due to significant heterogeneity in the included studies, a random-effects model (REM) was used. The standardized mean difference (SMD) with 95% CI was calculated from the change in spectral power among responders and non-responders. The SMD was calculated using various statistical derivations in the studies that did not report the mean spectral powers (Supplemental Table S1).
Characteristics of Included Studies.
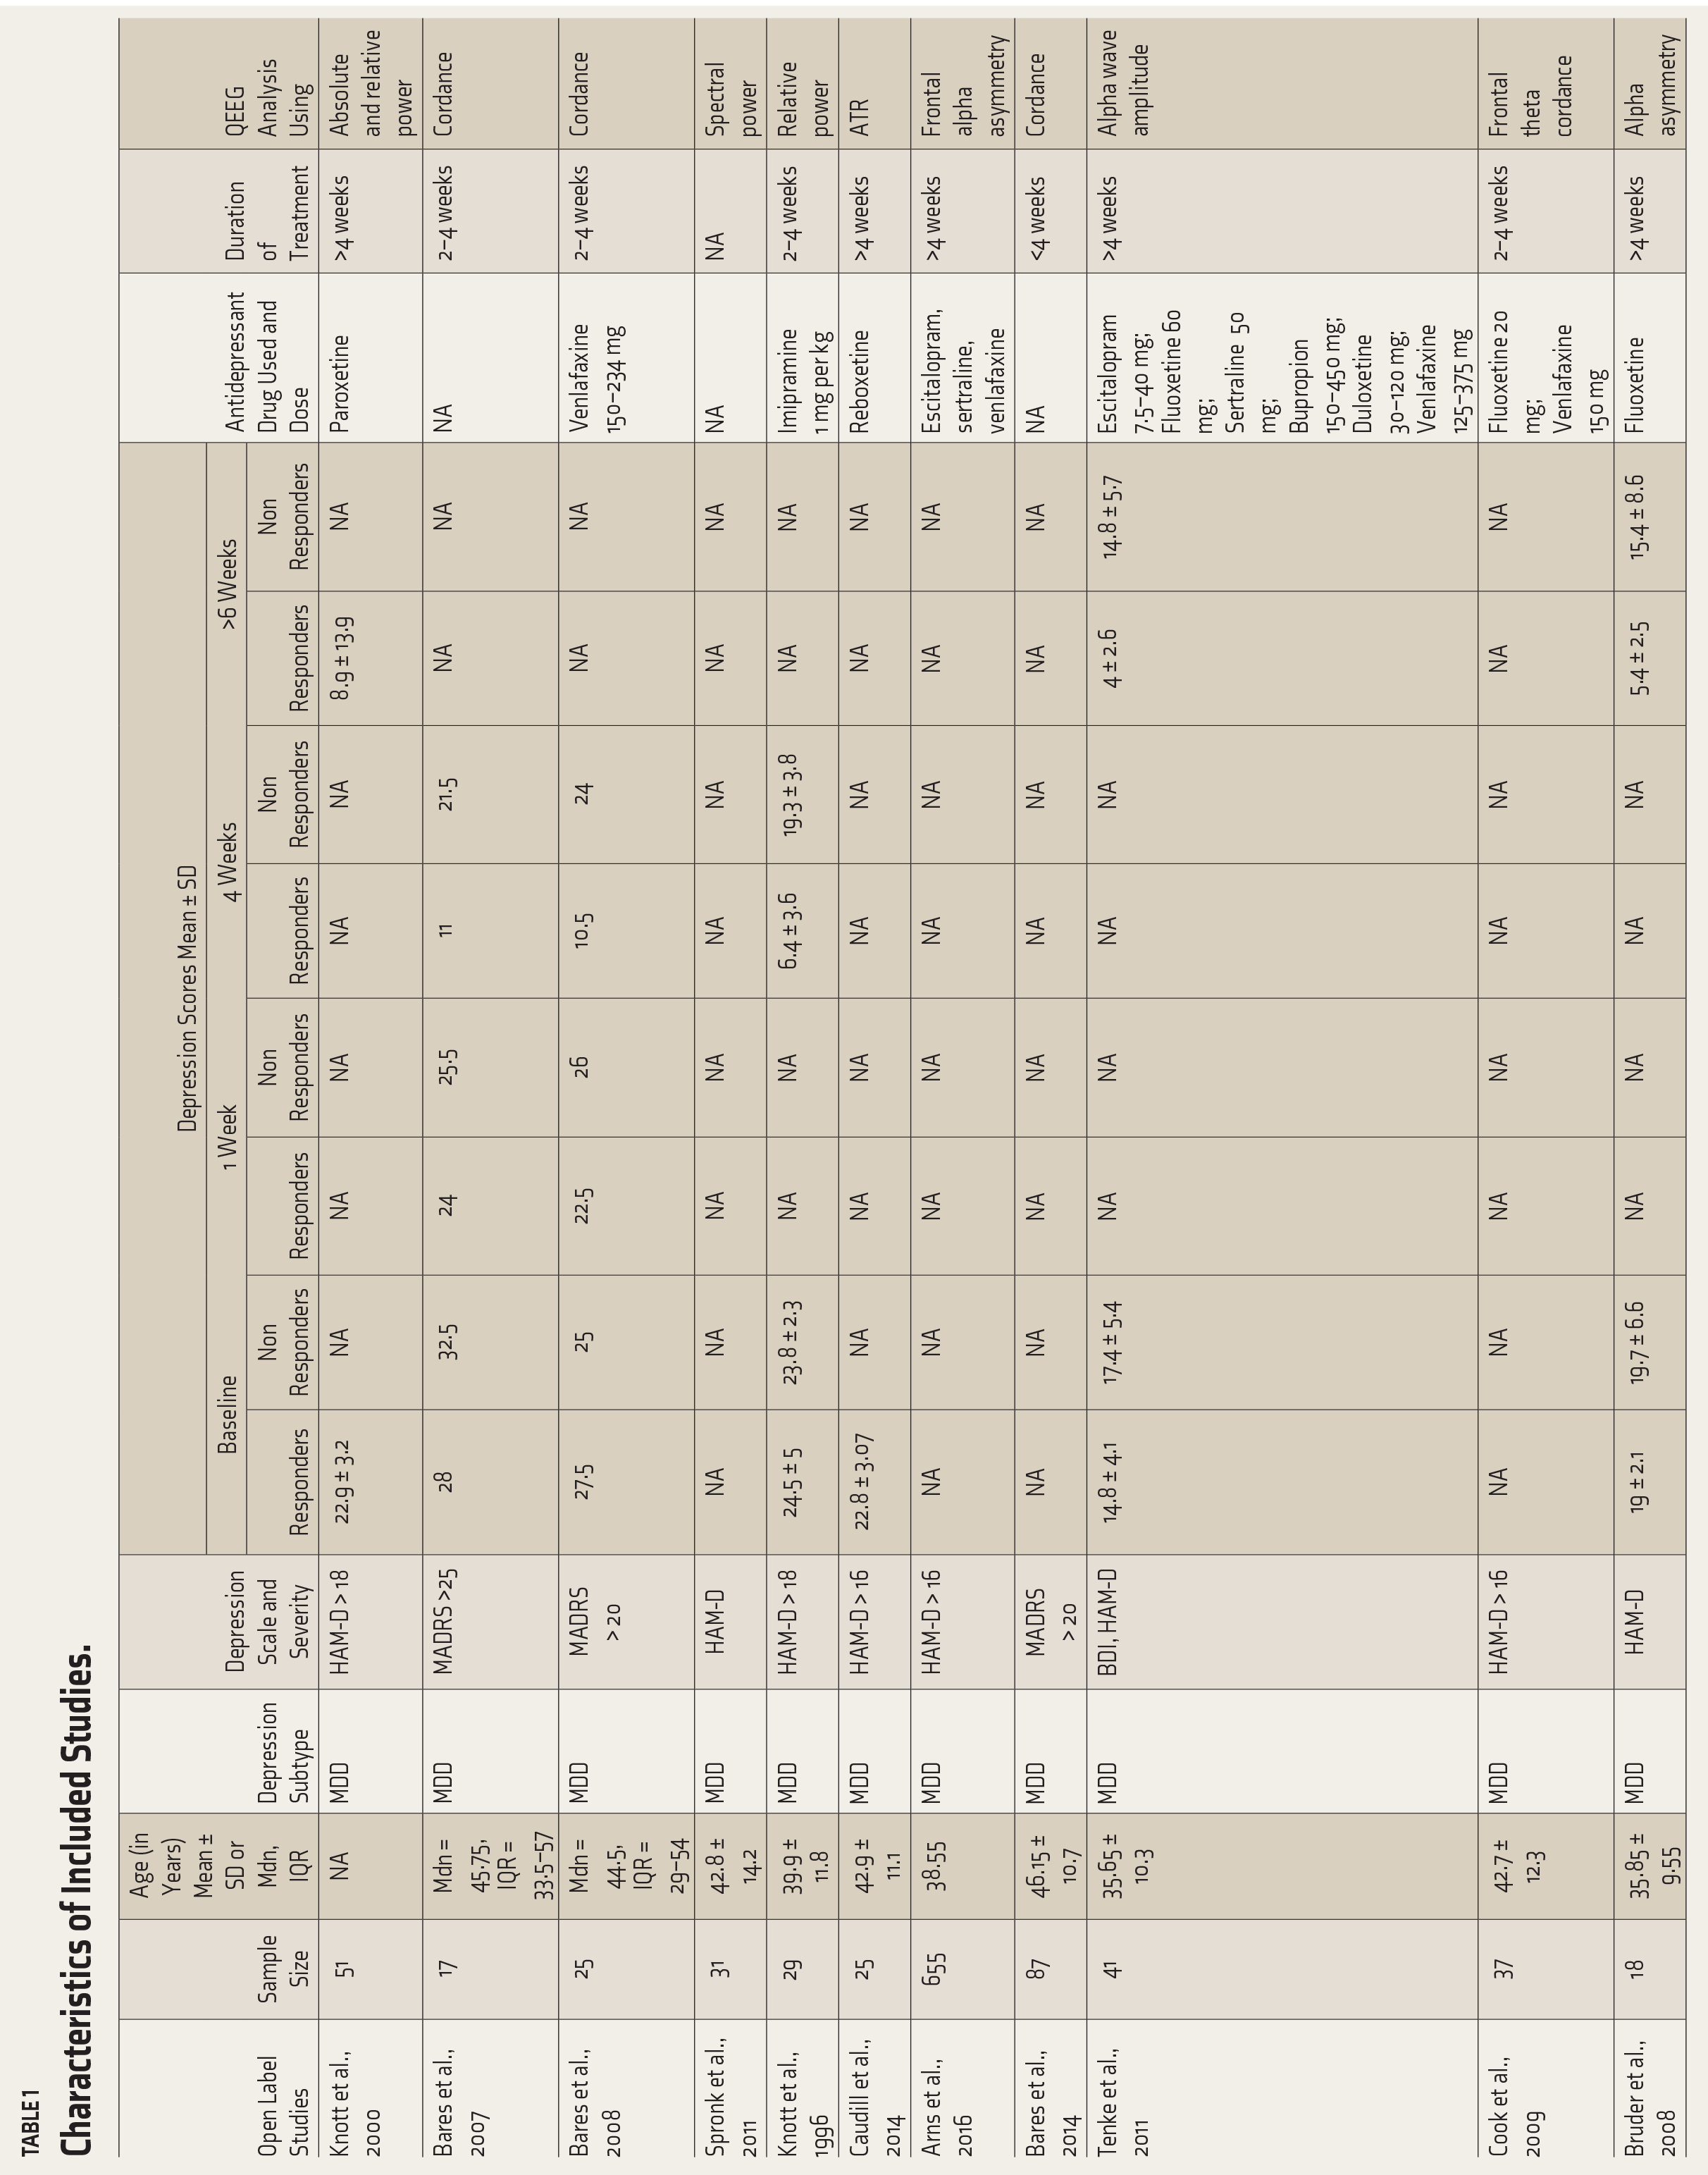
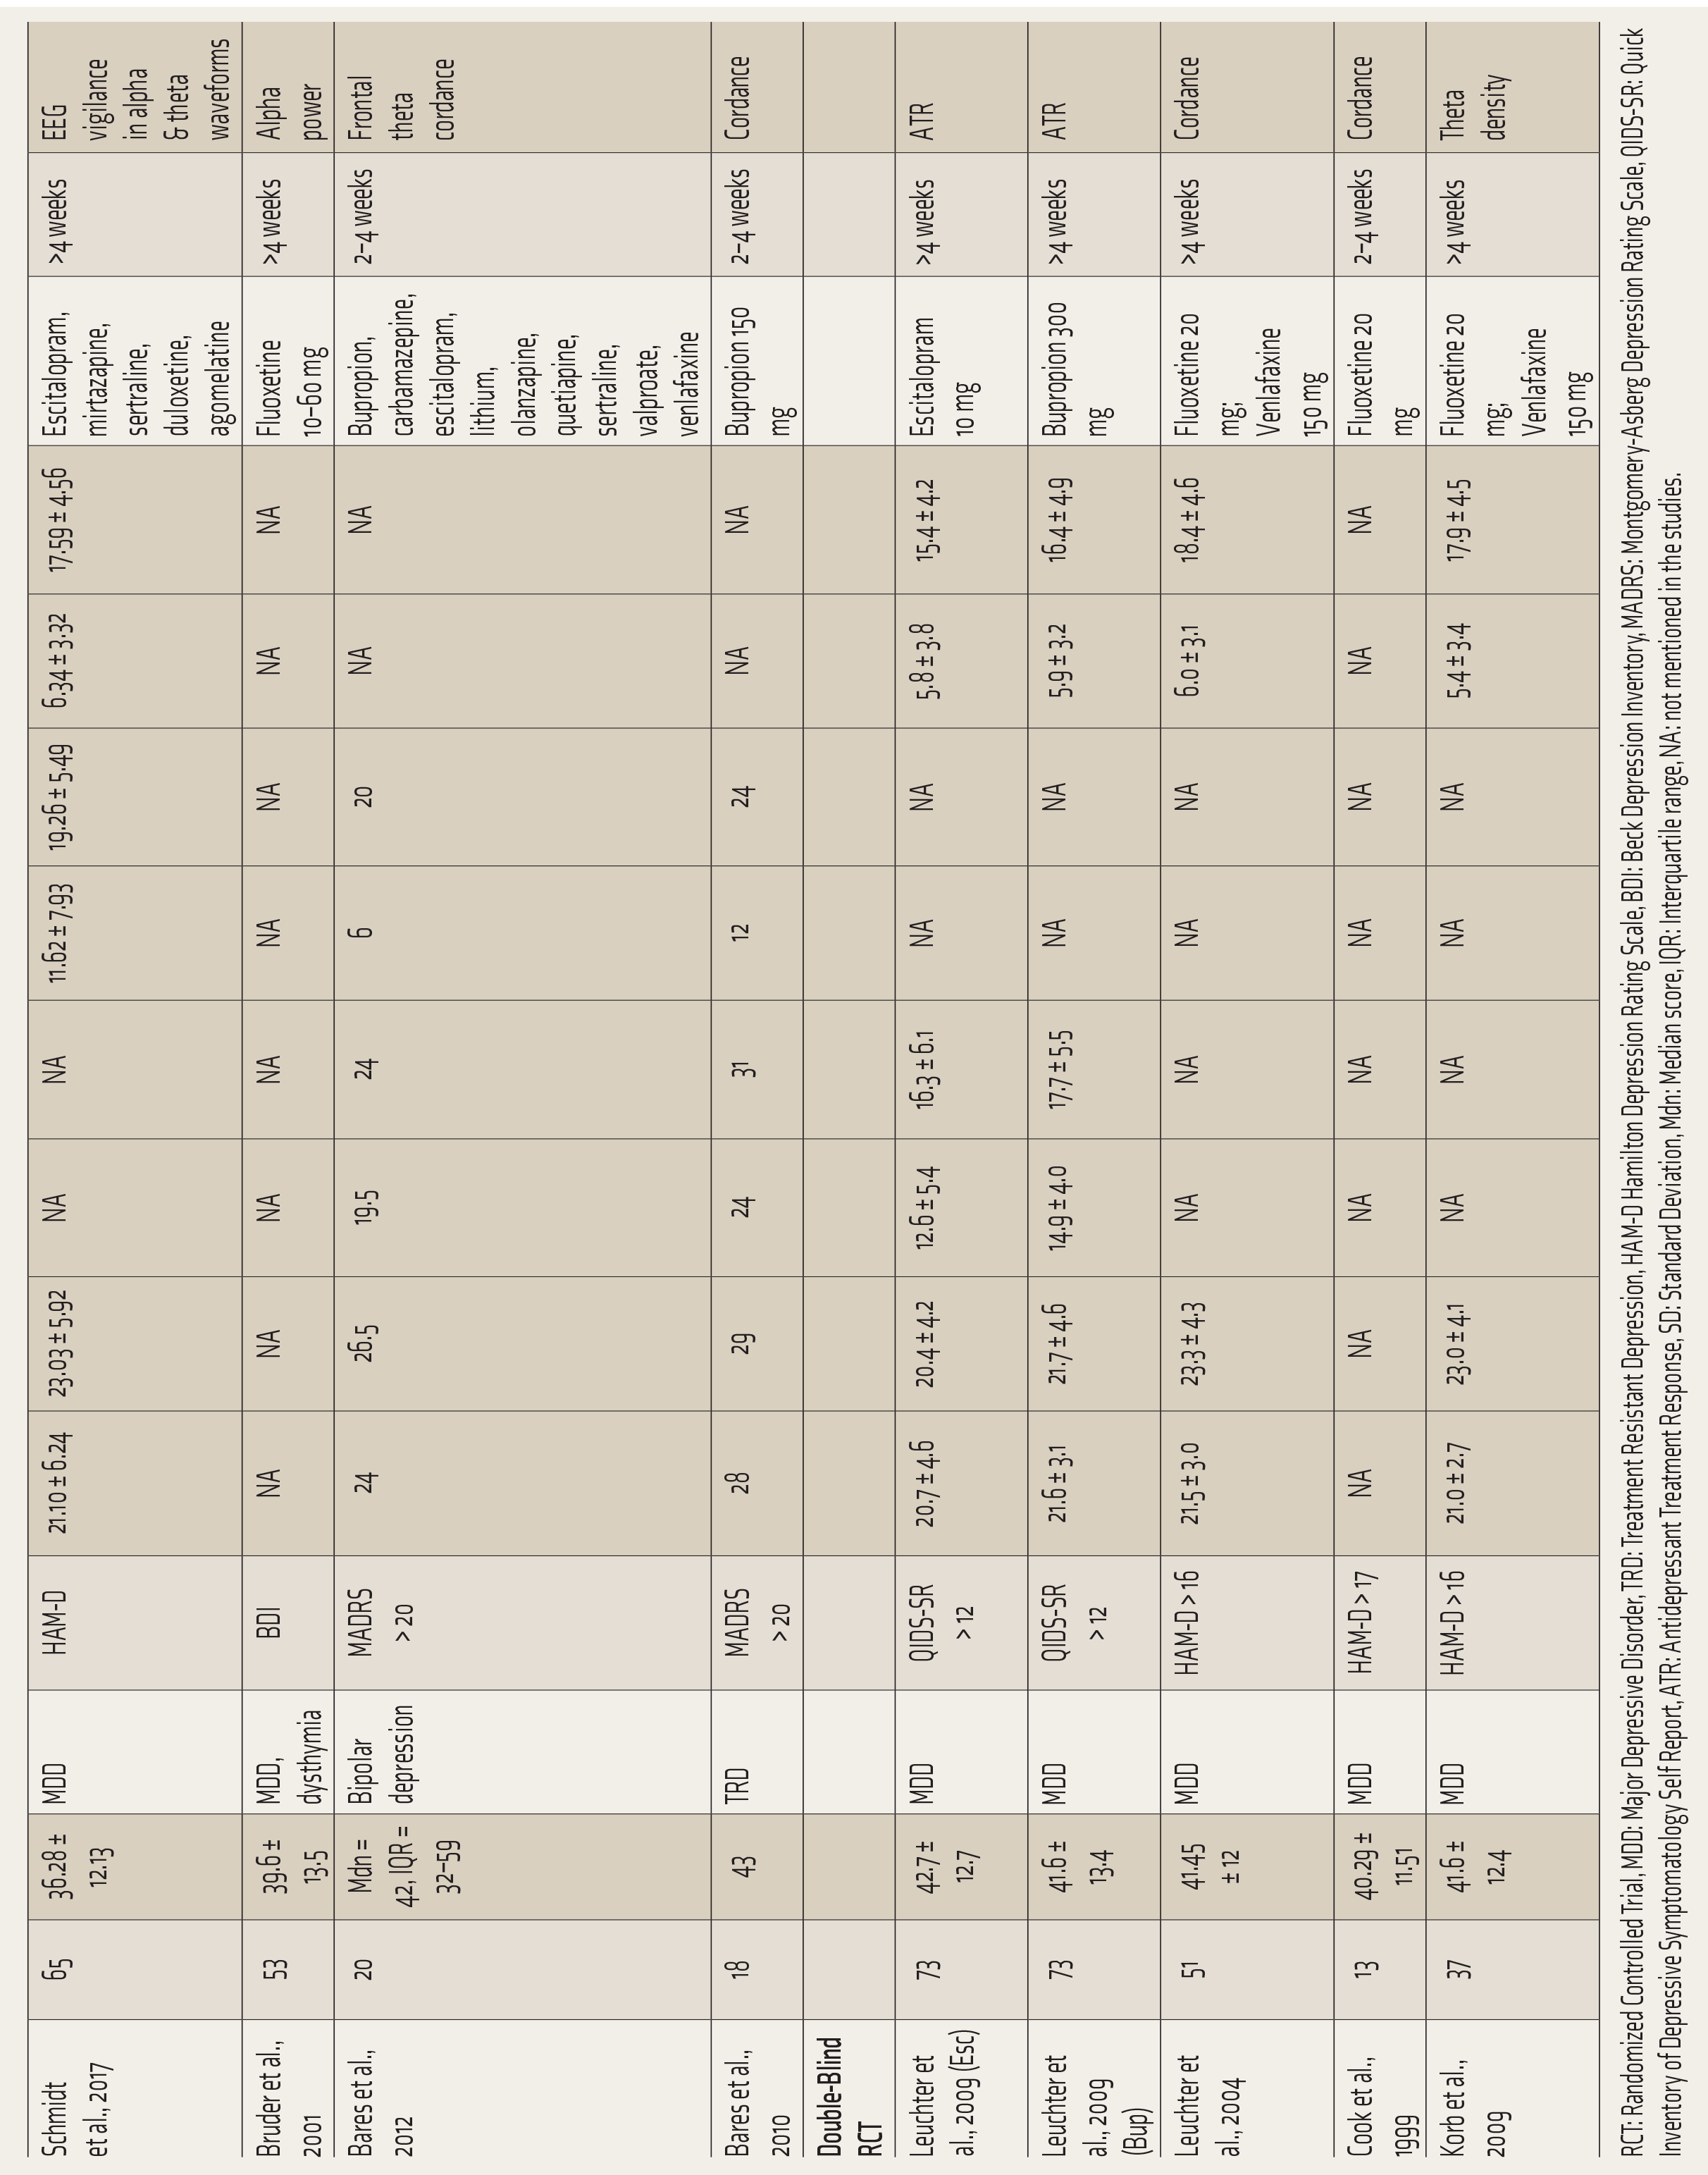
RCT: Randomized Controlled Trial, MDD: Major Depressive Disorder, TRD: Treatment Resistant Depression, HAM-D Hamilton Depression Rating Scale, BDI: Beck Depression Inventory, MADRS: Montgomery-Asberg Depression Rating Scale, QIDS-SR: Quick Inventory of Depressive Symptomatology Self Report, ATR: Antidepressant Treatment Response, SD: Standard Deviation, Mdn: Median score, IQR: Interquartile range, NA: not mentioned in the studies.
Results
Search Results
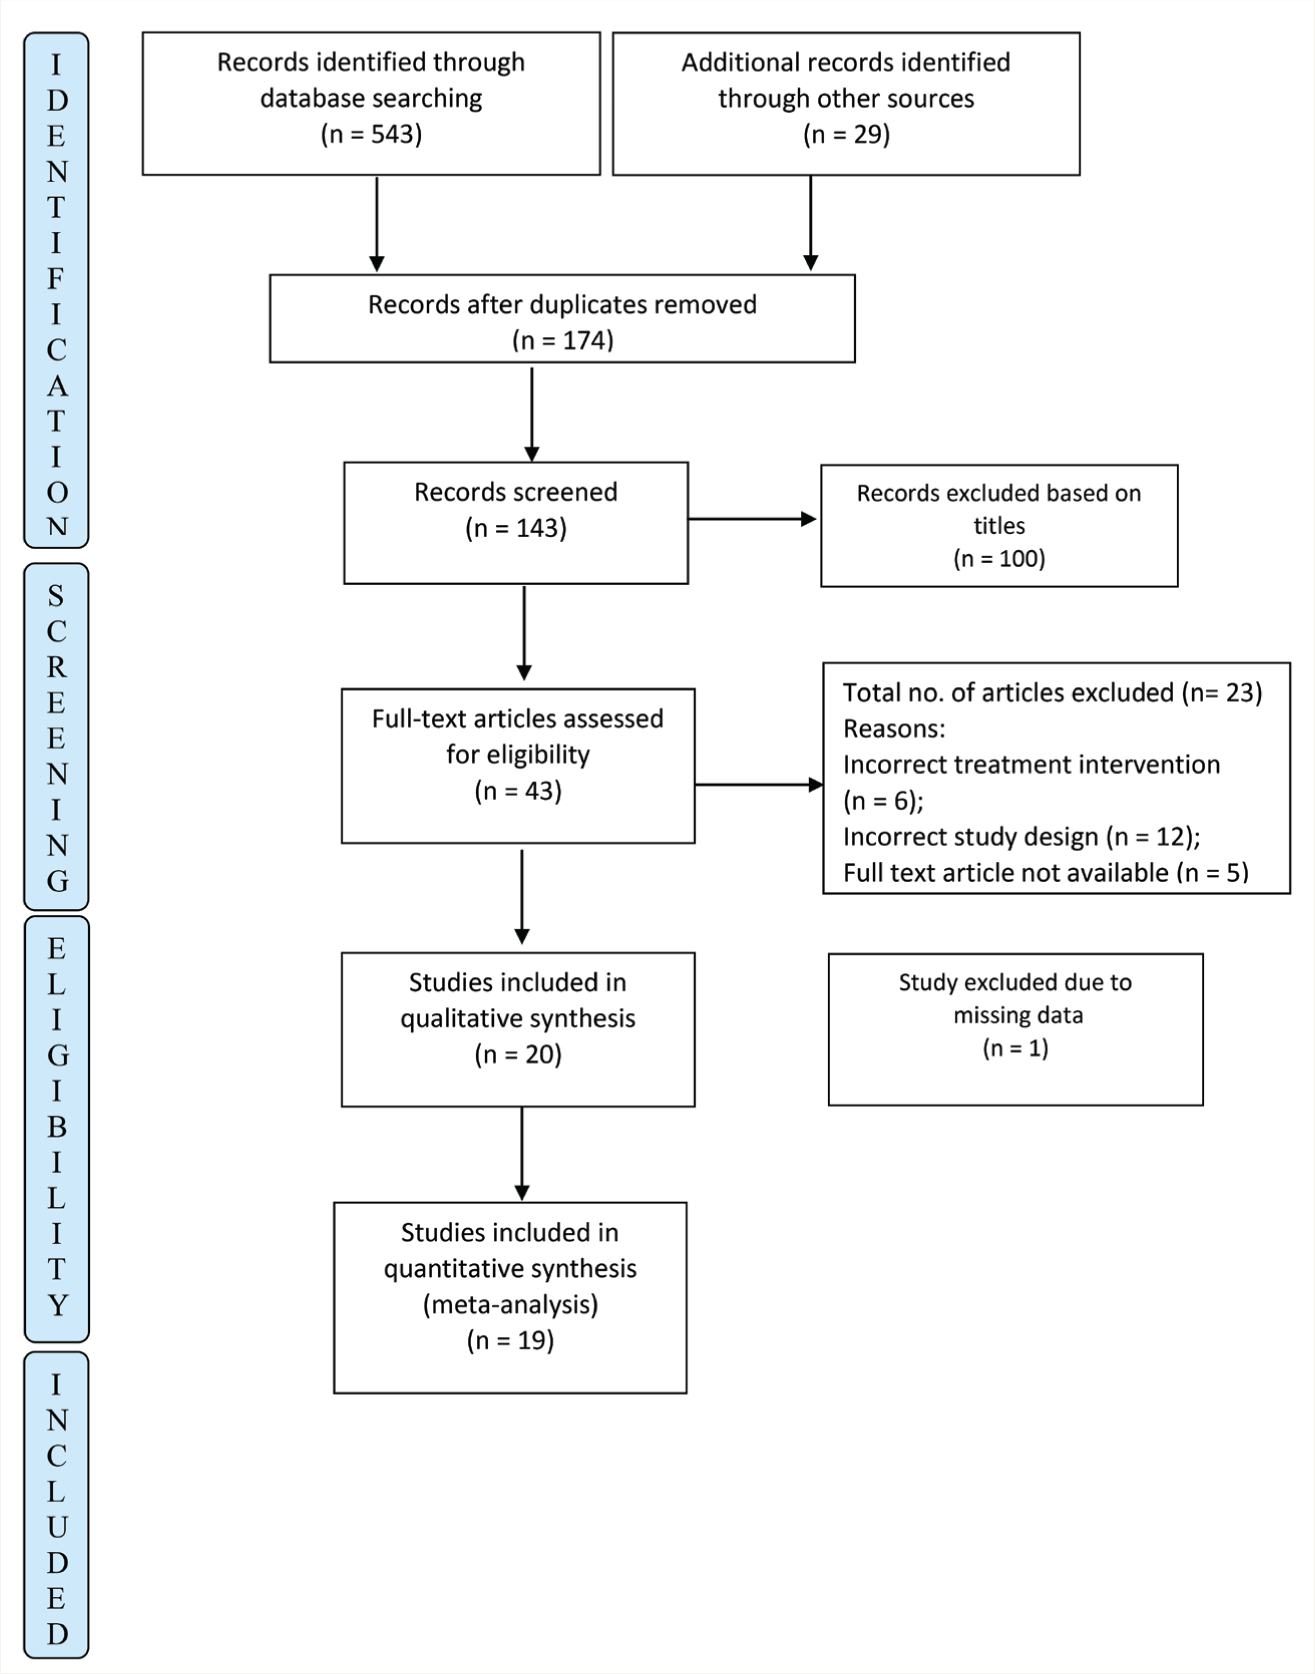
The search strategy identified 572 articles (363 from Ovid, 55 from Embase, 61 from PubMed, 64 from PsychInfo, and another 29 studies through hand search). After removing duplicates, the studies were screened based on titles and abstracts. Forty-three studies were reviewed as full text, and 19 were included in the analysis. The reasons for exclusion are detailed in Figure 1. The selected studies were then reported using PRISMA 23 guidelines.
PRISMA Flow Chart of the Studies Included in the Meta-analysis.
Study Characteristics
The total number of patients included in the 19 studies8–11,13,24–36 was 859 (Table 1). The mean age of this sample was 40.62 ± 3.04, except for Bares 2010 37 (treatment-resistant depression) and 2012 38 (bipolar depression), all the other studies included patients with major depression. ROBINS-1 and ROB-2 were used to assess the risk of bias for observational (n = 12) and RCT (n = 7) studies, respectively (Suppl Table 2). One observational study 14 was assessed at moderate risk of bias. Two RCTs27,32 had some concerns of bias regarding the intended intervention and measurement of outcome, respectively, as per ROB-2. The details are included in Supplemental Table S2. Since none of the studies reported a high risk of bias, all of them were included in the analyses.
Efficacy of QEEG in the Prediction of Antidepressant Response
Table 2 shows the pooled SMD of all the studies included in the analysis using a REM. The overall weighted effect size was calculated to be d = 0.80 (95% CI 0.64–0.97) with significantly low heterogeneity, Tau² = 0.02; χ 2 = 20.54, df = 18 (P = .30); I² = 12%. These results indicate a significant change in the QEEG waveforms with antidepressant therapy.
Meta-analysis of QEEG Predicting Treatment Response in Depression.
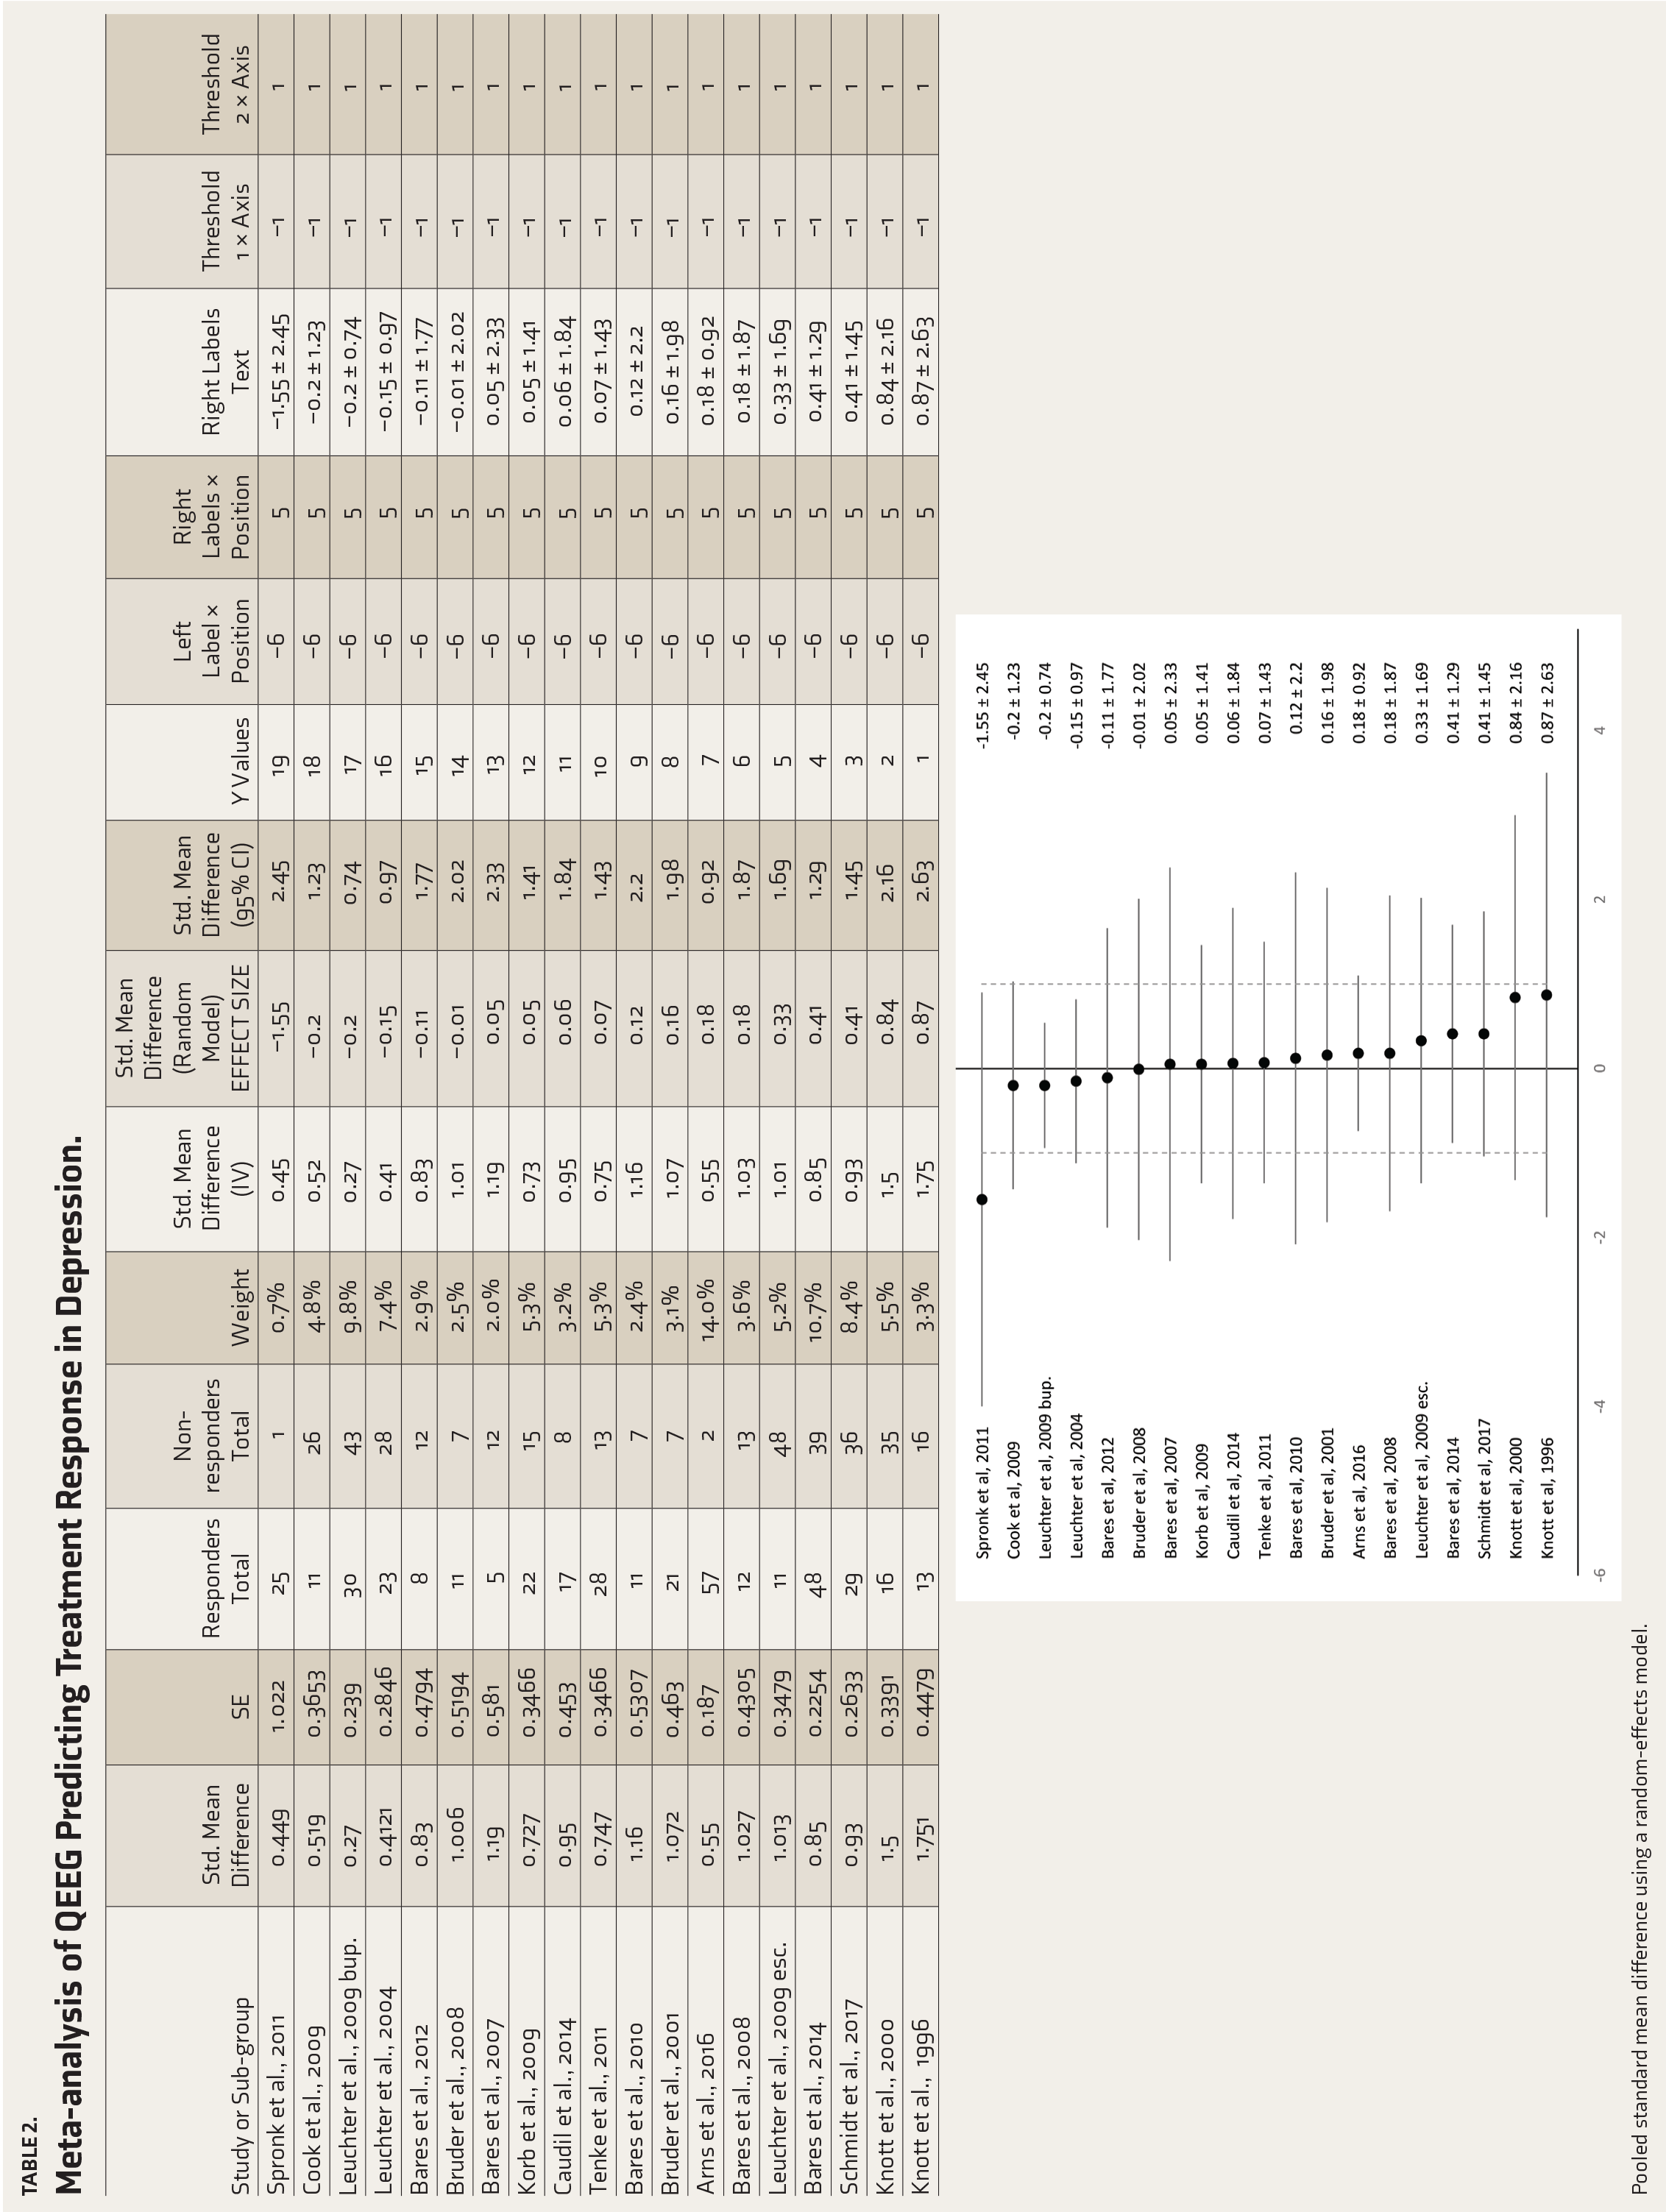
Pooled standard mean difference using a random-effects model.
Subgroup Analysis of QEEG
Table 3 shows subgroup analysis for different EEG waveforms. Both alpha (0.68, 95% CI [0.39–0.97], Tau² = 0; χ 2 = 1.63, df = 3 (P = .65); I² = 0) and theta (0.91, 95% CI [0.66–1.16], Tau² = 0.03; χ 2 = 11.86, df = 10 (P = .29); I² = 16%) waveforms show evidence of significant change in spectral power with antidepressant medications, with higher effect size recorded for theta waves.
Subgroup Analysis of the Different EEG Waveforms Included in the Meta-analysis.
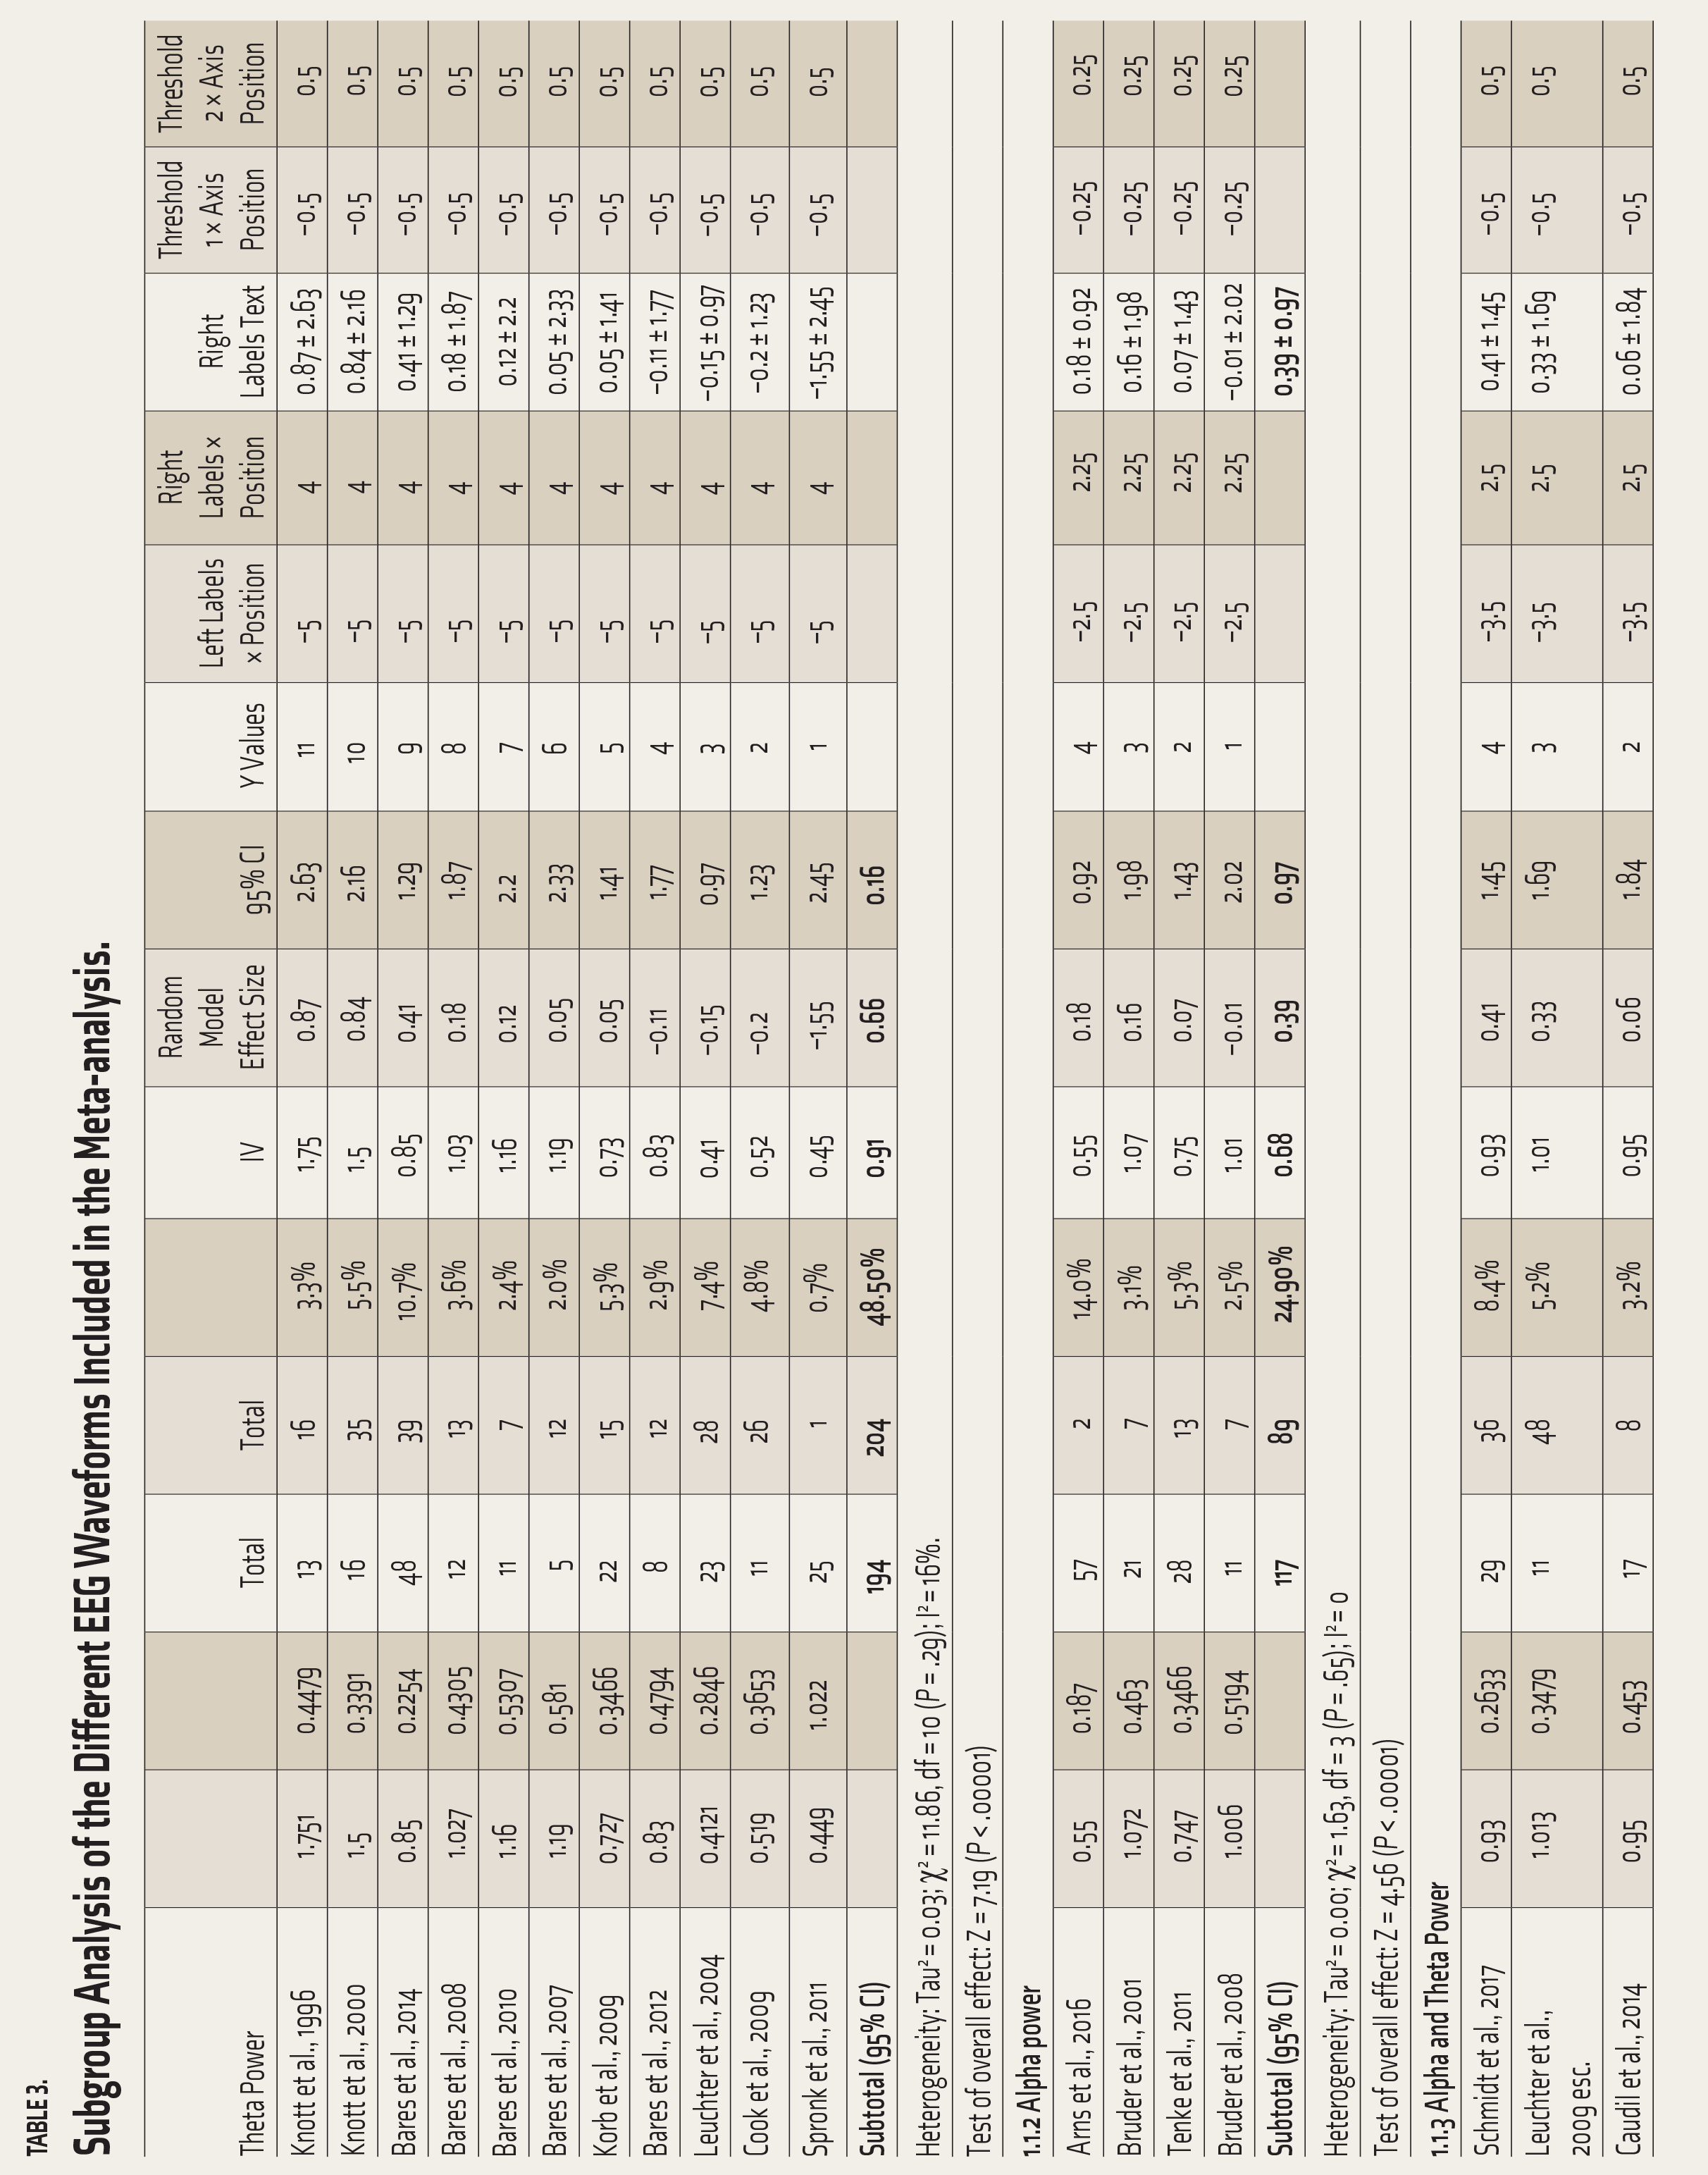
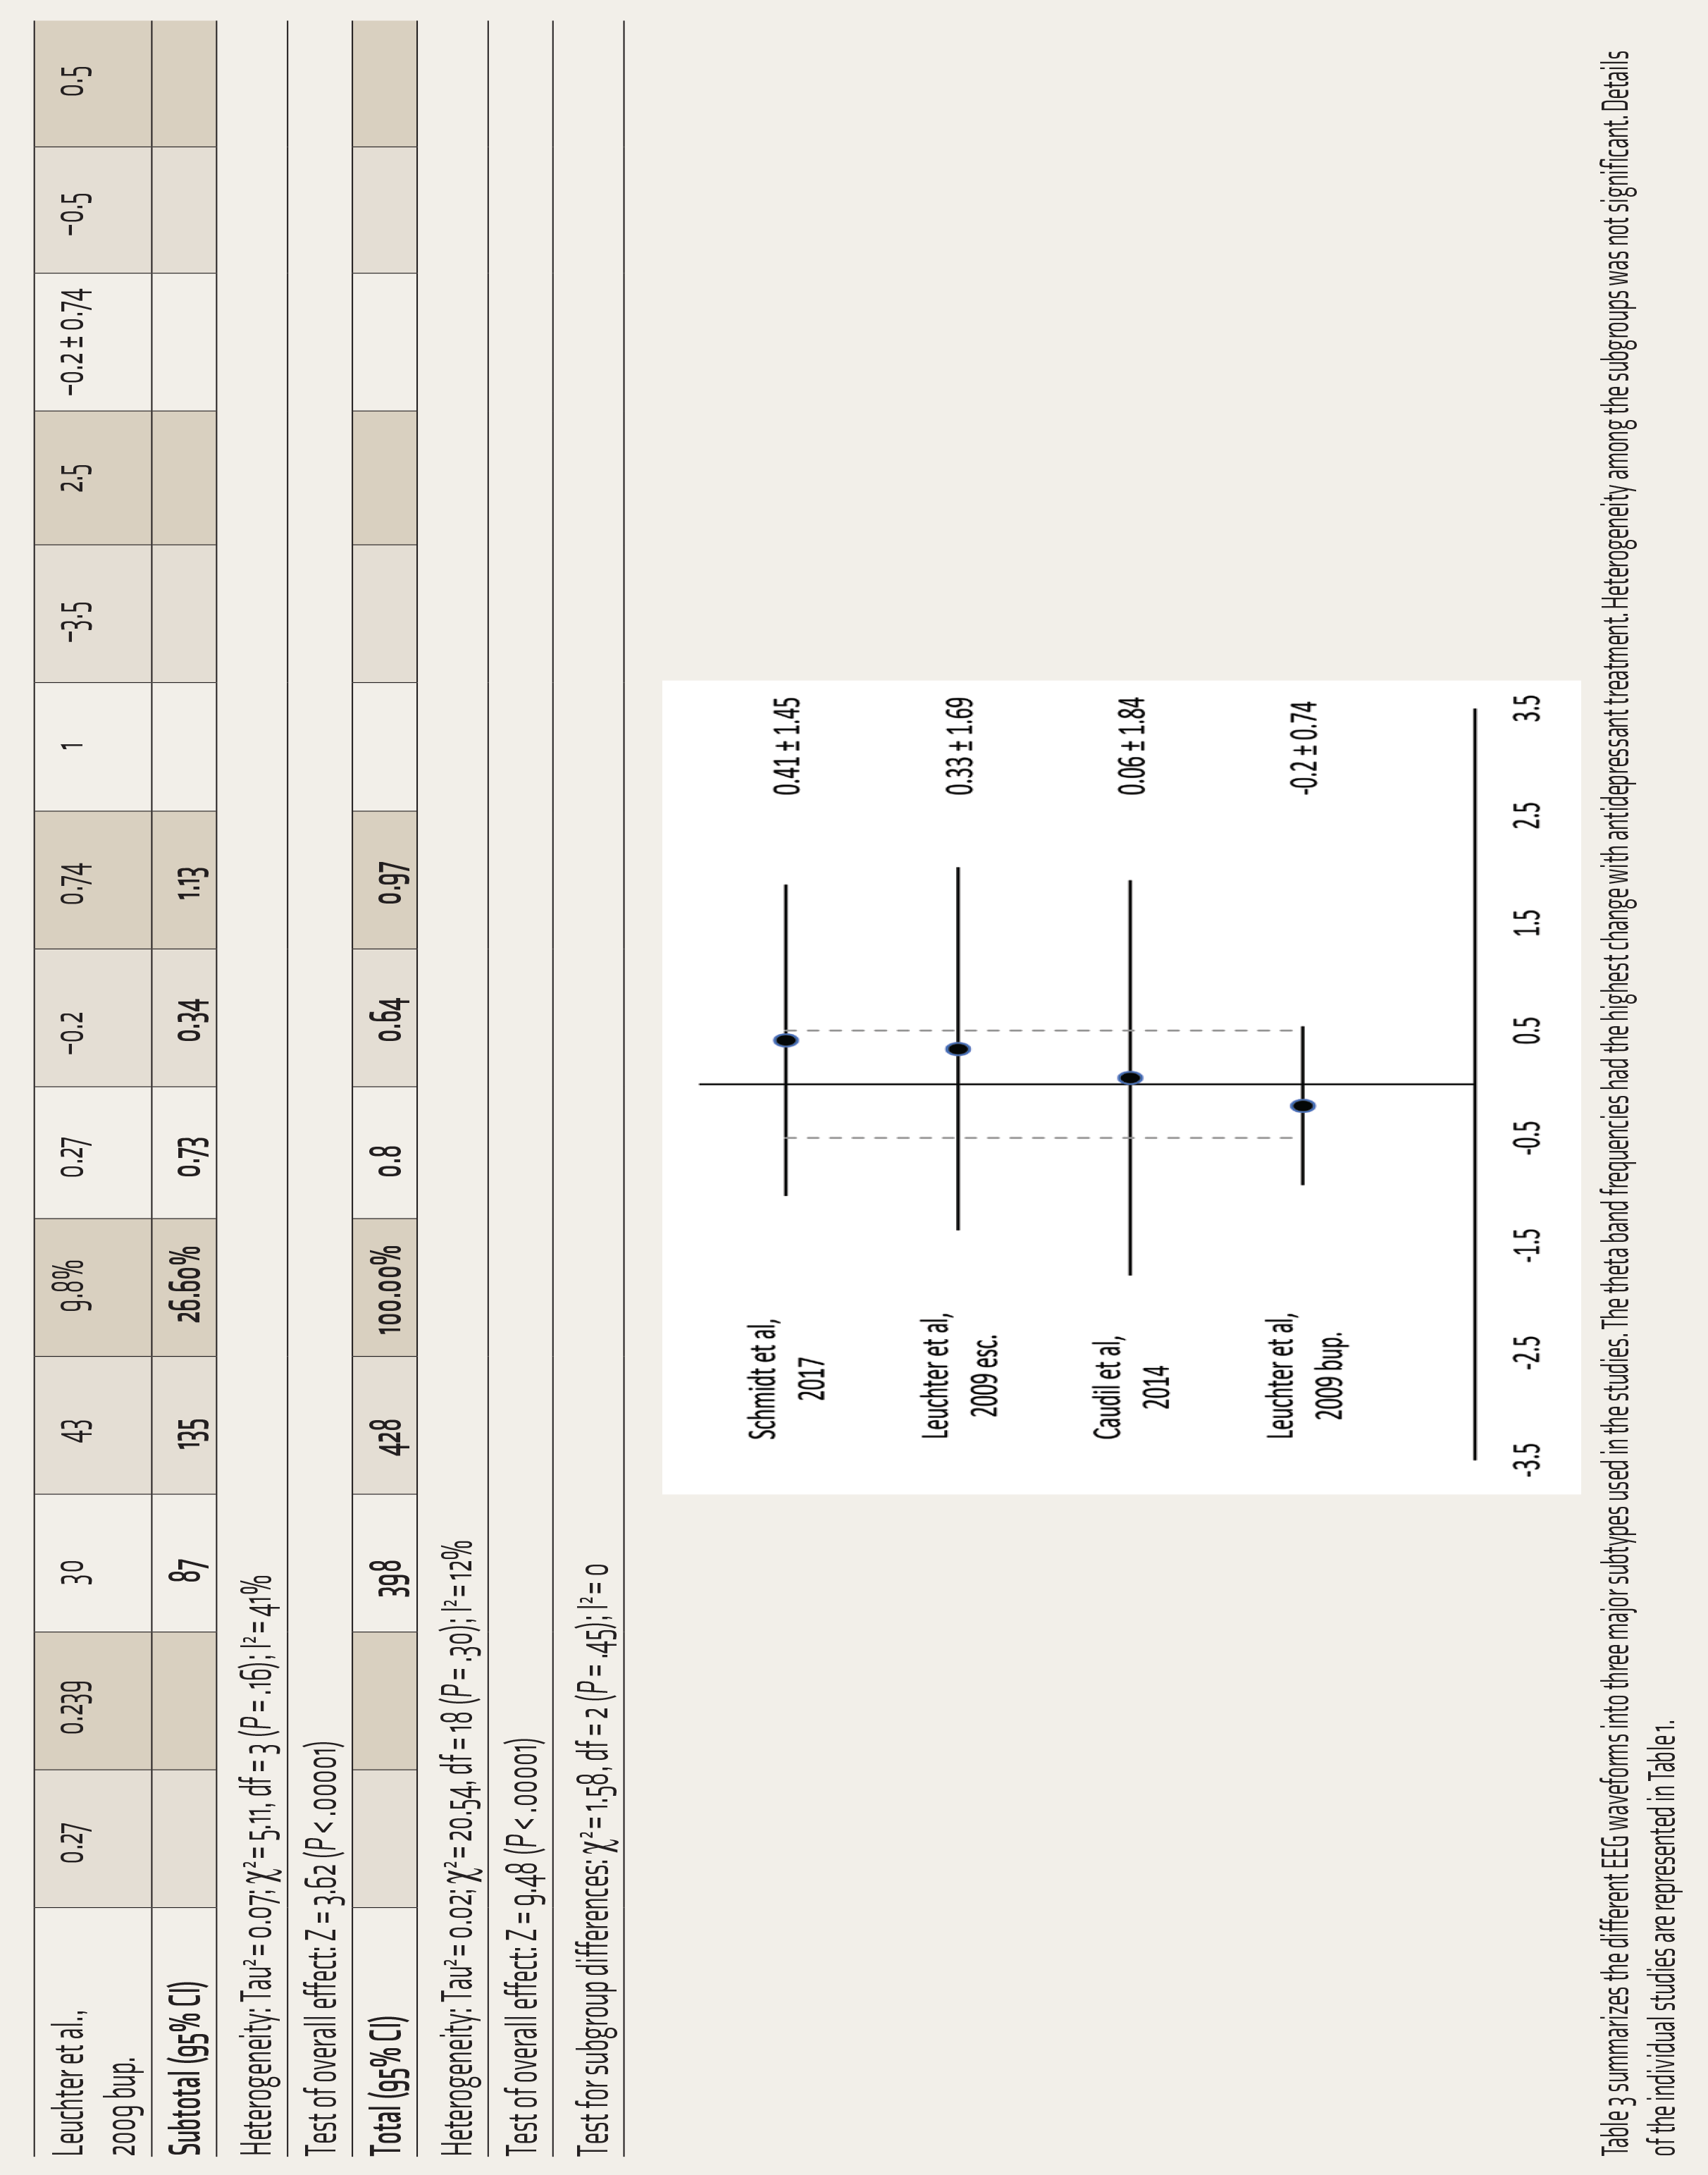
Table 3 summarizes the different EEG waveforms into three major subtypes used in the studies. The theta band frequencies had the highest change with antidepressant treatment. Heterogeneity among the subgroups was not significant. Details of the individual studies are represented in Table 1.
Publication Bias
The funnel plot analysis for publication bias appeared symmetrical upon visual inspection, indicating no bias. Low-power studies were relatively absent from the funnel plot, and high-power studies presented lesser variations and asymmetry (Supplemental figure S1). These results indicate that the current analysis is unlikely to be influenced by publication bias, and therefore, significant confidence can be held in the conclusion of the current analyses.
Discussion
The study was undertaken with the research question of whether QEEG changes predict the treatment response to antidepressants among patients with depression. The included studies measured various QEEG markers – Cordance (n = 8), ATR (n = 2), and relative and absolute spectral power (n = 10). Response to the prescribed antidepressant can be predicted based on decreased prefrontal cordance, change in ATR Index, 31 and relative and absolute spectral powers for channels majorly in the frontal region.11,29,30 The frontal alpha and theta waves also significantly predicted treatment response to SSRIs.11,27 A robust effect size (d = 0.80), with low heterogeneity, for at least two weeks of antidepressant therapy, and the subgroup analysis suggesting theta waves as a better predictor of the ATR (d = 0.91) were the main conclusions of this meta-analysis.
These analyses reflect the predictive power of QEEG for ATR and a strong unidirectional funnel plot symmetry, indicating the overall evidence for predicting medication response with a high effect size. 39 The meta-analysis has some limitations, however. First, considering the study’s methodological aspects, some artifacts may arise from the nature of the studies selected/included. We considered individual studies’ operational definitions for “marker” and “responders,” which left us with a diverse nature of variables/data in quality but not enough quantity to consider each variable for all QEEG measures reliably. Though narrowing these variables further in our selection criteria could have generated a data set uniformly, it could have also left us with an even lesser number of studies to gather the evidence in any direction. The literature and clinical acumen resonate toward six to eight weeks of lapse before we gauge treatment response. Still, we considered a one to two-week decline in measures to predict the treatment response and could not streamline the studies for longer durations of active medications. Second, a lack of patient-level data and small sample sizes in studies could have inflated the overall effect size, indicating plausible false impressions on QEEG efficacy as a marker. 39 Third, the diverse nature of technological options with which QEEG data was analyzed could lead to heterogeneous interpretations and redundant multiple-hypothesis testing likely to overgeneralize the findings. The risk of bias tools was incorporated to guard off such misinterpretations, but like any meta-analysis, the quality of studies included directly impacts the quality of meta-analyzed results. 40 Lastly, considering the factors related to depression, including heterogeneity in terms of diagnosis, sub-typing, treatment regime, treatment response, and duration of treatment response, could have limited the generalizability of our results. 41
To quantitatively evaluate the antidepressant response using EEG, further studies can be designed using a baseline EEG and EEG a few weeks into treatment. The data extracted from the two resting awake EEGs may be used to calculate the different QEEG parameters (Cordance, ATR, and spectral power). A homogenous patient group selection and a randomized placebo-controlled study design would help further increase the results’ generalizability. The above QEEG parameters have been shown to have a large effect size in predicting antidepressant response and can be clinically used to predict treatment response in depression. Further, QEEG needs to be studied or validated rigorously with marker-specific study designs for different drug trials to ascertain its efficacy in clinical practice. Prioritizing activity-recorded EEG over resting-state markers can also bridge our understanding of functional aspects of depression since literature seems to hint toward an association between physical activity and risk for depression. 42
Supplemental Material
Supplemental material for this article is available online.
Supplemental Material
Supplemental material for this article available online.
Supplemental Material
Supplemental material for this article available online.
Footnotes
Declaration of Conflicting Interests
The authors declared no potential conflicts of interest with respect to the research, authorship and/or publication of this article.
Declaration Regarding the Use of Generative AI
None of the content in the manuscript is generated by AI, and the authors assume full responsibility for the entire content. However, Grammarly was used to ensure the language for any grammatical errors, spelling mistakes, and punctuation inaccuracies.
Funding
The authors received no financial support for the research, authorship and/or publication of this article.
Registration and Primary funding source
The study is registered on the PROSPERO network (
References
Supplementary Material
Please find the following supplemental material available below.
For Open Access articles published under a Creative Commons License, all supplemental material carries the same license as the article it is associated with.
For non-Open Access articles published, all supplemental material carries a non-exclusive license, and permission requests for re-use of supplemental material or any part of supplemental material shall be sent directly to the copyright owner as specified in the copyright notice associated with the article.