
Abstract
Background:
Little information exists about the association between alcohol and tobacco use and self-reported depressed mood, such as feeling sad, blue, or depressed days (SBDD), among older adults in India. The aim of this study was to examine the association between alcohol and tobacco use and self-reported depressed mood with SBDD among older adults in India.
Methods:
This study uses the Longitudinal Aging Study India (LASI) Wave 1 dataset of 10,487 respondents identified with self-reported mood disorders with SBDD. Descriptive statistics, bivariate, and multivariate models were performed.
Results:
In total, 19.7% of persons above 45 years of age experienced SBDD for 2 weeks during the last 12 months. Compared to nonusers, those who used tobacco or alcohol reported higher symptoms of SBDD. Several factors related to alcohol (e.g., illicit alcohol) and tobacco (e.g., smokeless tobacco) indicate a statistically significant association with the prevalence of prolonged sadness or depression.
Conclusion:
Analysis of LASI Wave 1 shows that lifestyle choices such as alcohol and tobacco use play a role in the burden and association of negative emotions such as SBDD among older adults in India.
A significant association exists between alcohol and tobacco use and mood disorders, such as feeling SBDD, among older adults in India. Collaborative efforts and innovative strategies are needed to support older adults in India in improving their quality of life and well-being.Key Messages:
Late-life depression (LLD) is an increasingly prevalent mental health challenge among older adults, magnified by factors such as an aging population, social stressors, and the disruptive influence of events like the coronavirus disease-2019 (COVID-19) pandemic. 1 Globally, >9% of the population was 65 years or older in 2019, a proportion projected to surge to 16% by 2050 (United Nations, 2019). 2 Within this demographic shift lies a growing concern for the emotional well-being of older individuals, with depression emerging as a prominent issue.
The gravity of LLD extends well beyond emotional distress, with profound societal implications. Depression ranks as the second leading global burden of disease, underscoring its urgency as a public health concern. 3 Startlingly, depression is the primary contributor to the alarming global suicide rates among older adults, accounting for an overwhelming 97.5% of cases. 4 The worldwide prevalence of depression varies from 10% to 20%, influenced by cultural nuances and contextual factors. 5 The risk factors contributing to depression in older adults are multifaceted, encompassing chronic illnesses, financial instability, social isolation, bereavement, and age-related physical limitations. 6 These risk factors often intersect with those affecting individuals of all age groups, emphasizing the need for tailored interventions for older adults.
Adding complexity to the issue, LLD frequently manifests with atypical features, often concealed by cognitive impairments. 7 This disguising of symptoms poses unique challenges for diagnosis and management, necessitating a comprehensive approach. Despite these complexities, addressing depression comprehensively is imperative due to its pervasive consequences, affecting an estimated 350 million people globally. 8
Furthermore, it is essential to recognize that LLD’s impact transcends mental health, exerting substantial financial repercussions. Major depressive disorders ranked third among the leading causes of global disability in 2015, highlighting its significant contribution to the global burden of disease. 9 Over the last decade, the number of older adults with substance abuse has increased exponentially. Alcohol is the most common substance abused, along with tobacco use among older adults. For example, in rural India, the prevalence of alcohol and tobacco use among those >60 years of age has been reported as 31%–42% and 10%, respectively. 10
This study examines the burden of alcohol and tobacco use, characteristics of use (e.g., frequency, type of drink, etc.), and the association between alcohol and tobacco use and self-reported depressed mood with sad, blue, or depressed days (SBDD) among older adults in India. Addressing this issue is important in safeguarding the well-being of older adults and addressing a pressing public health concern with far-reaching economic implications.
Methods
Data Source
This study used data from the nationally representative cross-section survey data of 72,250 adults (along with their partners who had no age criterion) chosen from 42,949 households during 2017–2018 as part of the Longitudinal Ageing Study in India (LASI) Wave 1. 11 LASI is a nationally representative survey of over 72,000 individuals aged 45 years and over, along with their spouses, regardless of their age. The sample was collected nationwide using a multistage stratified area probability cluster sampling design. Country-level weights were used; hence, the estimates are nationally representative.
Study Population
Based on the inclusion criteria for the study sample, the 10,487 individuals aged 45 who were identified for analysis felt SBDD for 2 weeks during the last 12 months (Worsening of the feeling of being SBDD during 2 weeks, all day long, n = 2,694; most of the day, n = 2,649; about half the day, n = 3,075; and less than half a day, n = 2,069).
Outcome Variables
The outcome variable of this study was SBDD. Specifically, the LASI questionnaire probes the individuals how many days in the past 30 days they have felt SBDD. In LASI (2017–2018), the questions asked of respondents during the last 12 months were: Was there ever a time when you felt SBDD for 2 weeks or more in a row?
Main Exposure Variable
The main exposure variables were alcohol and tobacco usage, depicted as follows:
Current consumers of Smokeless Tobacco (SLT), smoke tobacco, and dual tobacco users who consumed both smoked in smokeless forms, compared with those who did not currently consume tobacco in any form. Categorization was based on the responses obtained, such as Ever using any tobacco, Types of tobacco product consumed, Currently Smoked tobacco, Quantity of Smoked tobacco per day, and current smokeless tobacco. Consumption of alcohol: Have you ever consumed any alcohol in the past 3 months, at least one alcoholic drink? What are the types of drinks you usually drink? In the past 3 months, have you at least 5 or more drinks on one occasion? Have you ever felt that you should cut down on drinking? Have people ever criticized your drinking? Have you ever felt bad or guilty about drinking? Have you ever taken a drink first thing in the morning to steady your nerves or get rid of a hangover?
Predictor Variables
This study included a range of socio-economic and demographic variables, such as age, sex, education, marital status, economic status, caste (social group), religion, place of residence, and region of residence based on the earlier study by Kobau et al. and availability of data in the LASI dataset.11,12
Statistical Analysis
This study used descriptive statistics and bivariate and multivariate estimates to meet the research objectives. In the first step of the analysis, descriptive analysis was carried out to understand the distribution of the study population, while in the second step of the analysis, bivariate analysis was carried out to identify the percentage of persons who felt SBDD for 2 weeks during the last 12 months by tobacco and alcohol habits of persons. A chi-square (χ²) test was conducted to determine the association between outcome and socio-economic variables. Cramer’s V and pie φ test was conducted to measure measures of association between categorical variables. Cramer’s V is a measure of association used to quantify the strength and direction of association between two nominal variables in a contingency table if the independent variable (alcohol or tobacco use) is more than two categories,
The Phi coefficient compares the association between two binary variables (variables with two categories). If the dependent variable (SBDD) is continuous and non-normal, then a one-way analysis of variance using the Kruskal Wallis test was conducted, and if the independent is more than two categories, the independent Wilcoxon-Mann-Whitney test was conducted if the independent is two categories and the dependent variable is the not normally distributed. In the third step of the analysis, a multivariable relative risk analysis was carried out to assess the risk associated with tobacco and alcohol habits of persons. When calculating relative risks (RRs), the first group within each category was used as the reference group. Along with the RRs, the P value (***P < .01, **P < .05, *P < .10) was considered to be statistically significant with upper and lower 95% confidence intervals (CIs). To account for the survey design and to adjust for sampling weight, clustering, and stratification in the sampling design, we employed the svy command in STATA 13.1 (StataCorp, USA).13,14
Results
Table 1 shows the demographic characteristics of a study population that reported SBDD for 2 weeks in the last 12 months. Most of the study sample falls within the age range of 45–59 years, accounting for nearly half of the respondents. The gender distribution is fairly balanced, with 45.9% male and 54.1% female respondents. 50.6% reported having no formal education. 31.3% have primary education, 12.4% have secondary education, and only 5.6% are graduates or have higher educational qualifications. The poorest and poorer quintiles account for 20.9% and 21.2% of the sample, respectively. Scheduled tribes comprise 8.8% of the population, scheduled castes make up 19.7%, other backward castes are the most prevalent at 46.7%, and individuals from other castes represent 24.9% of the sample. Gender-wise, a higher percentage of females (21.5%) reported feeling SBDD compared to males (17.6%), and this difference was found to be statistically significant (χ2 = 171.210, P < .001). Education-wise, those with no education (22.1%) and primary education (19.5%) were more likely to report these emotions. Individuals from rural areas reported these feelings more (21.3%) than urban residents (16.1%). Regional variations were prominent, with the West region having the highest percentage (27.7%) and the South region having the lowest (12.8%) reporting such emotions. Compared to other states, Uttar Pradesh, Gujarat, Madhya Pradesh, Bihar, Tamil Nadu, and Arunachal Pradesh reported a higher prevalence of SBDD among older adults.
Persons Who Felt SBDD for 2 Weeks, and Mean Duration of SBDD During the Last 12 Months by Socioeconomic and Demographic Characteristics; LASI 2017–2018.
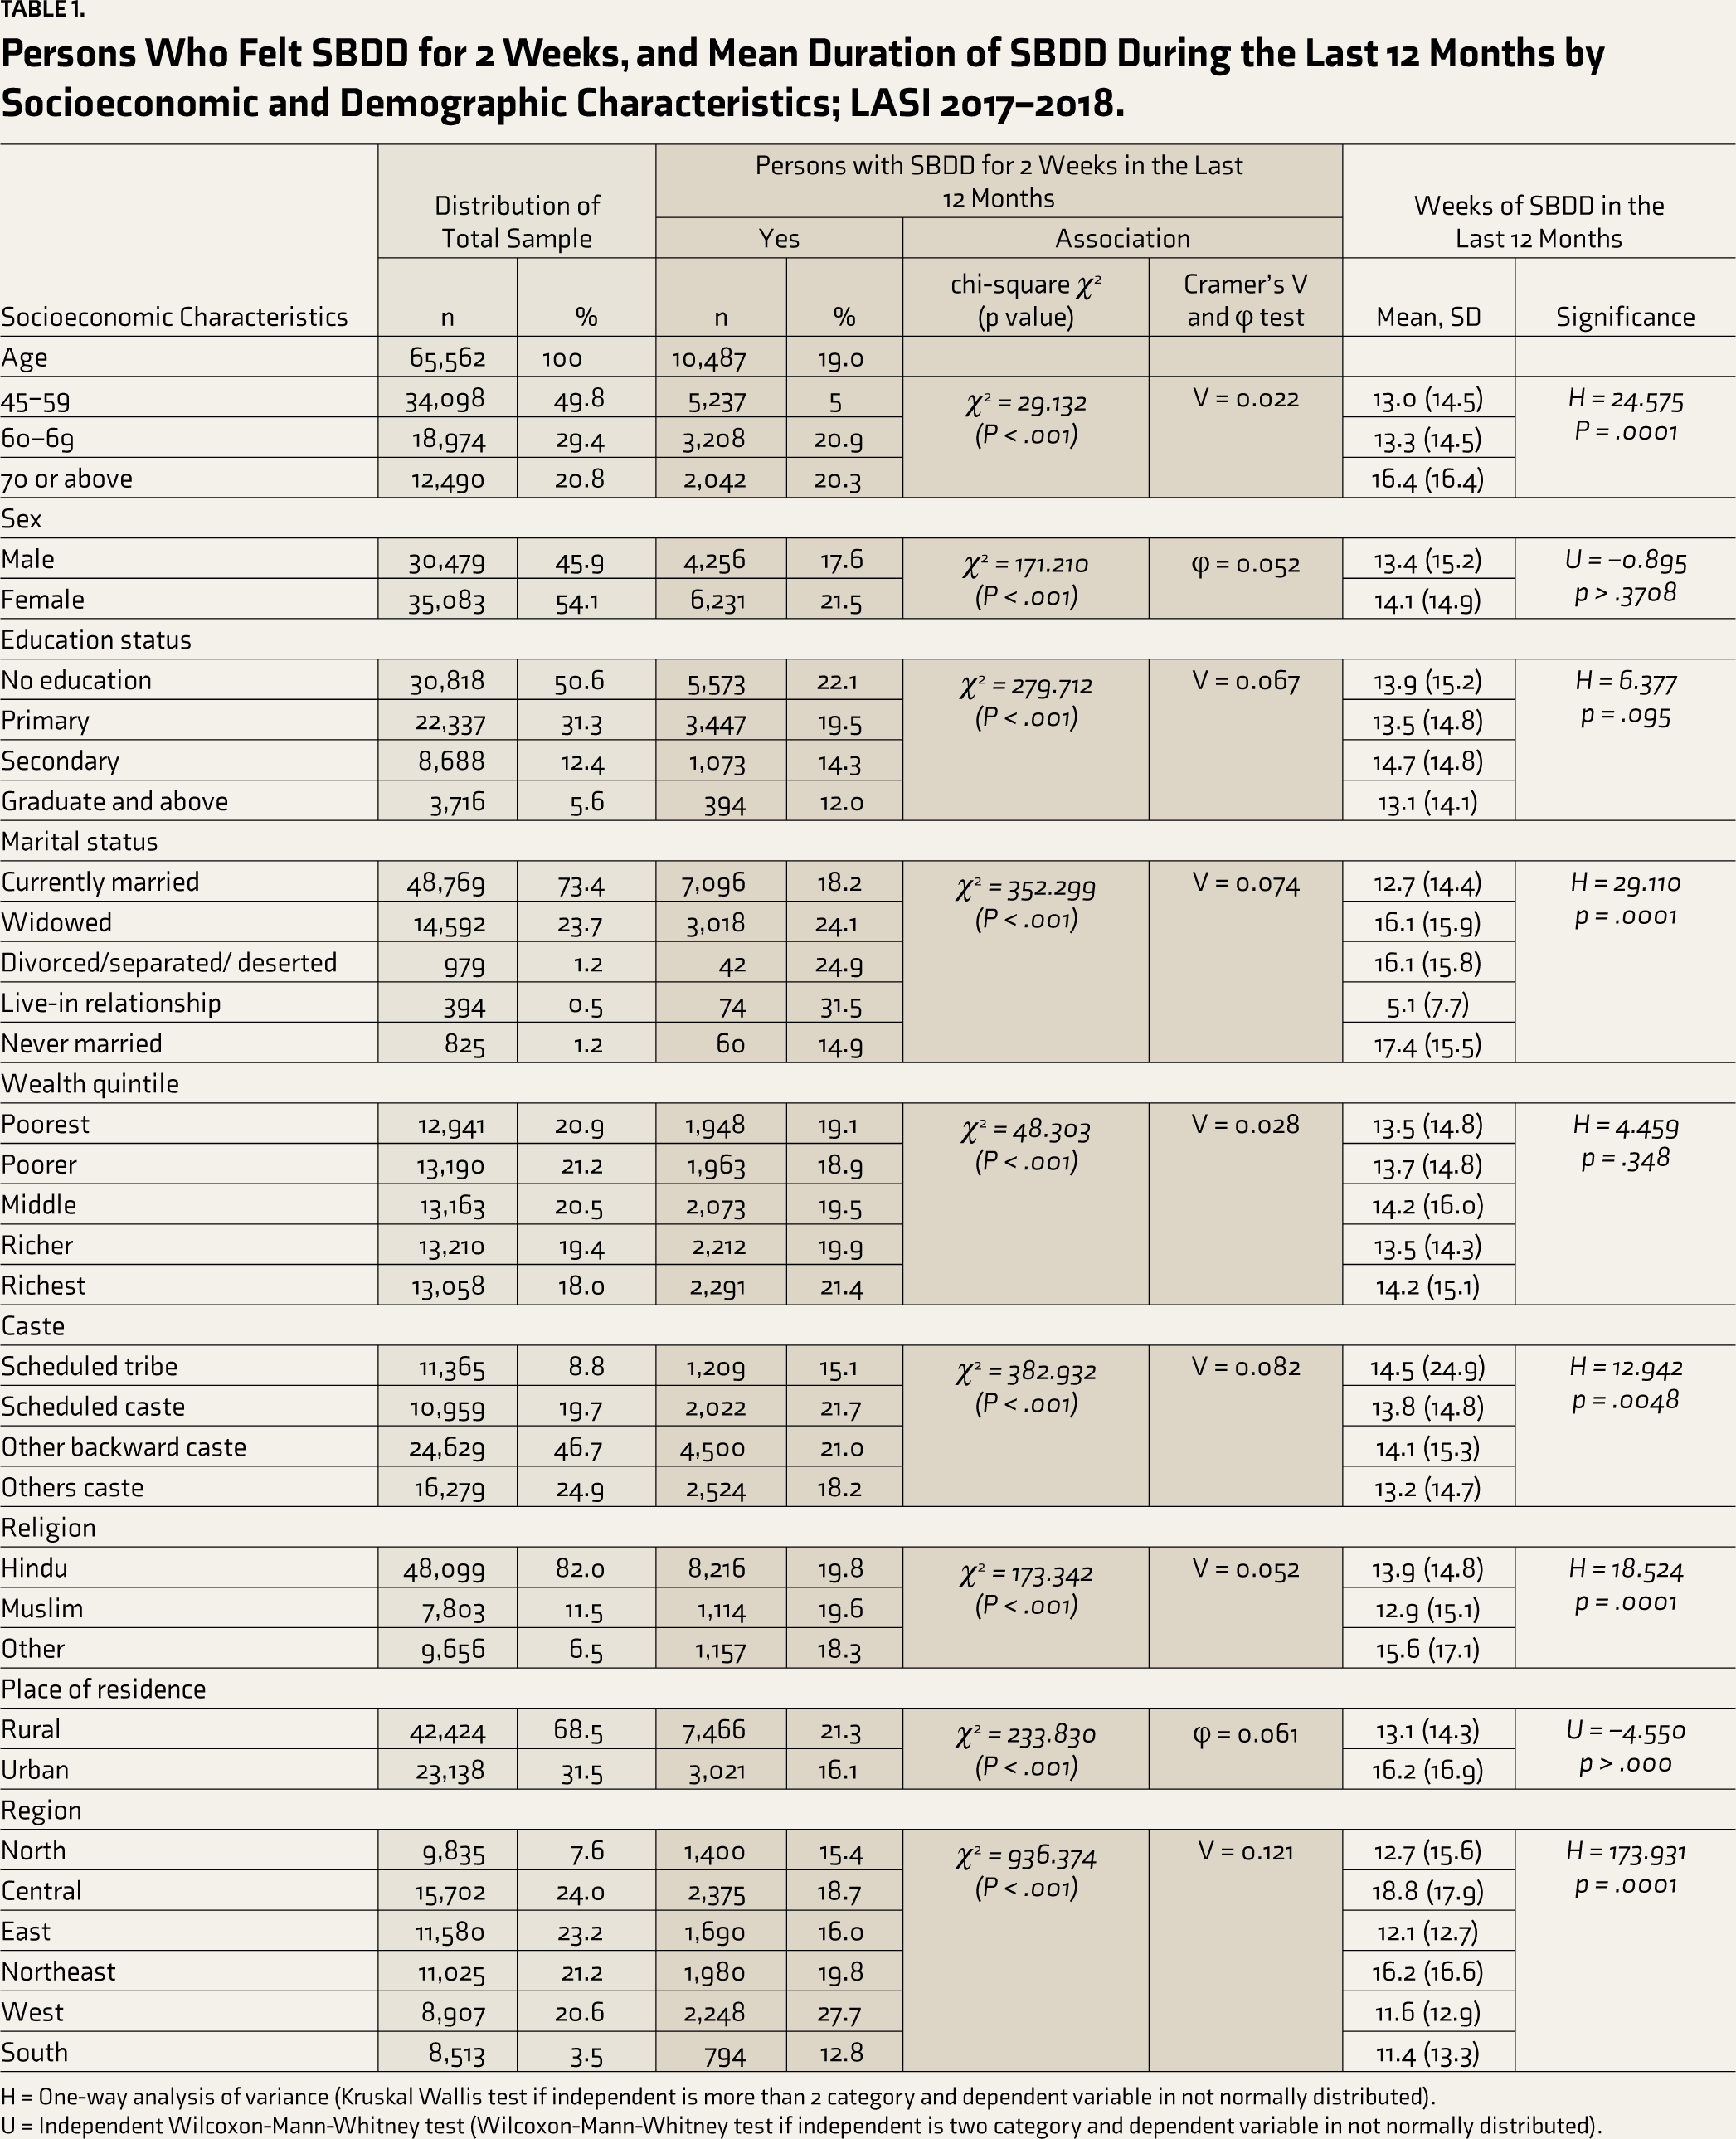
H = One-way analysis of variance (Kruskal Wallis test if independent is more than 2 category and dependent variable in not normally distributed).
U = Independent Wilcoxon-Mann-Whitney test (Wilcoxon-Mann-Whitney test if independent is two category and dependent variable in not normally distributed).
Table 1 also shows mean and standard deviation values detailing the duration (in weeks) when individuals felt SBDD out of 52 weeks during the past year segmented by various socio-economic factors. Significant variations are observed across demographics, such as age, where individuals aged 70 or above report a higher mean duration (16.4 weeks, P = .0001) than younger age groups. Marital status demonstrates substantial differences, with individuals in live-in relationships reporting the shortest duration (5.1 weeks), while those never married report the longest (17.4 weeks). Religion and region also display notable disparities, with individuals of “Other” religions and those from the Central region showing higher mean durations than others.
Of 10,487 respondents, approximately 1 in 5 people (19.4%) experienced SBDD in the past year. Most people who experienced SBDD (28%) had feelings lasting all day long. Approximately 1 in 4 people (29%) had SBDD feelings lasting about half the day. Only about 1 in 5 people (20%) had SBDD feelings lasting less than half the day. Among 5,910 respondents, 37.9% reported feeling the described way almost every day, and 42.67% indicated that they felt this way every day. 19.5% of respondents stated that they experienced these feelings less often than every day. From this data, many respondents reported feeling this way daily. The combined percentage of respondents who reported experiencing these feelings either every day or almost every day is quite high (80.57%).
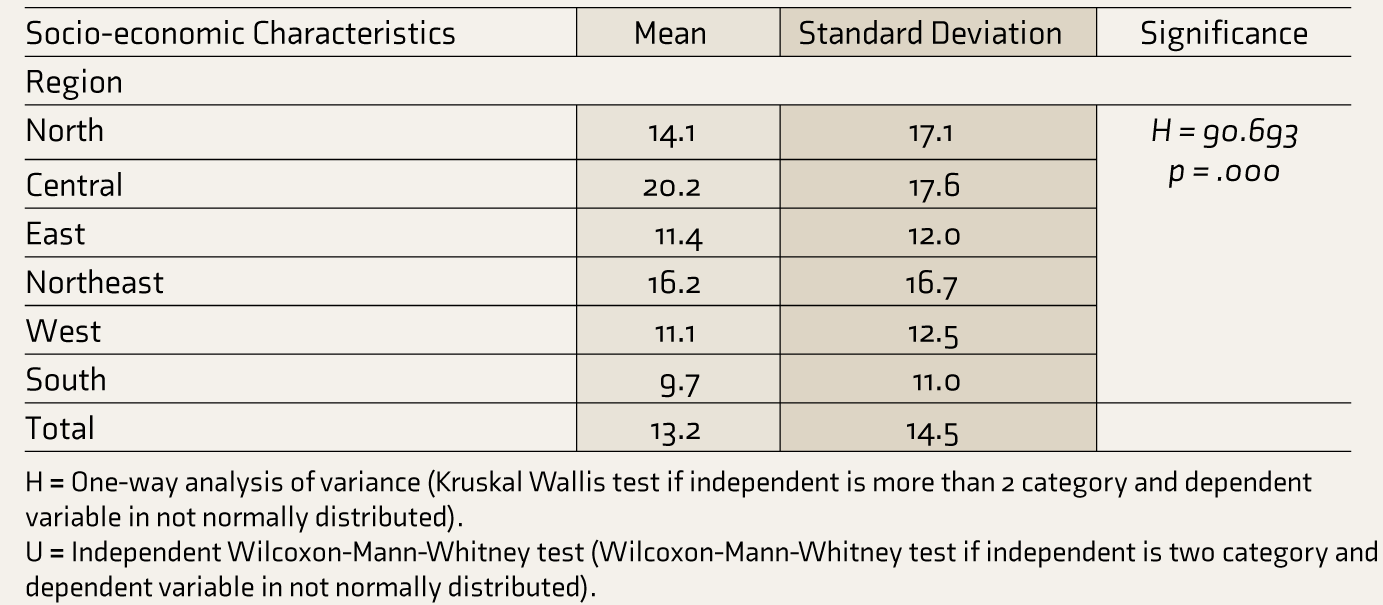
Mean and standard deviation values depicting the duration individuals lose interest in activities they typically enjoy, segmented by selected socio-economic factors during the past year, are provided in Table 2. Individuals aged 70 or above report a higher mean duration (15.2 weeks, P < .000) than younger age brackets. Similarly, those not currently married show longer durations than their married counterparts (P = .001), with individuals in live-in relationships displaying the shortest duration (9.3 weeks). Regional disparities are evident, notably with the Central region demonstrating the longest mean duration (20.2 weeks, P = .000), followed by the Northeast. In contrast, individuals in the South exhibit the shortest duration (9.7 weeks, P = .000). Religion also showcases variations, with individuals from the “Other” religious category manifesting a higher mean duration (14.3 weeks, P = .034) than Hindus.
Mean and [Standard Deviation] for Weeks Losing Interest in Most Things Like Hobbies, Work, or Activities That Usually Give You Pleasure During the Last 12 Months By Selected Socioeconomic Characteristics; LASI 2017–2018.
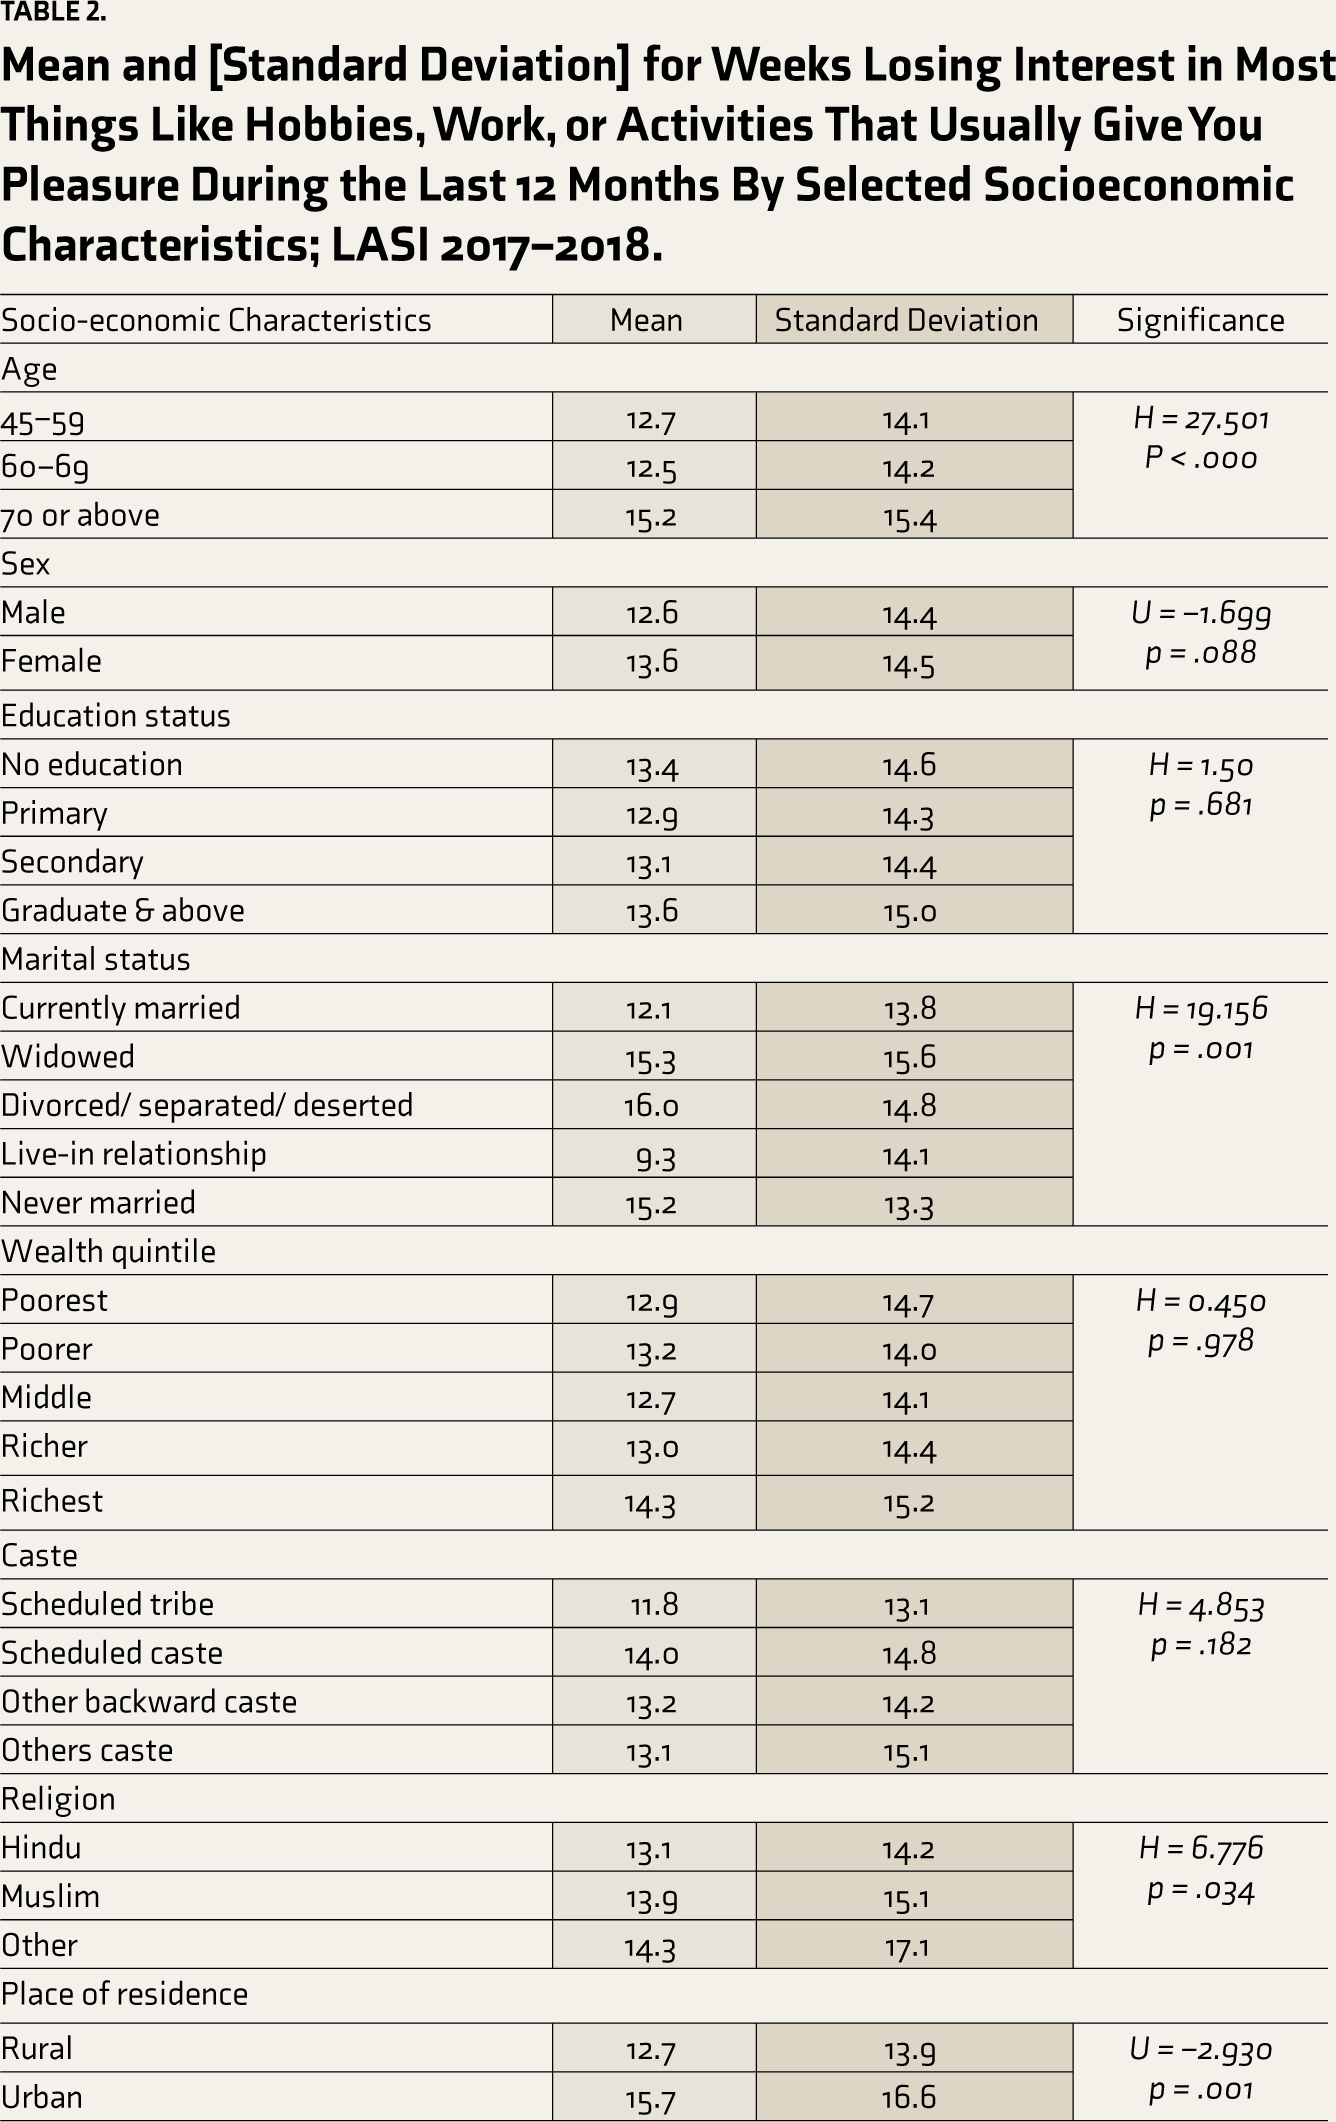
H = One-way analysis of variance (Kruskal Wallis test if independent is more than 2 category and dependent variable in not normally distributed).
U = Independent Wilcoxon-Mann-Whitney test (Wilcoxon-Mann-Whitney test if independent is two category and dependent variable in not normally distributed).
Table 3 provides insights into the association between socio-economic characteristics and the likelihood of individuals reporting feelings of SBDD for 2 weeks within the past year, based on the LASI 2017–2018 survey data. Results show that individuals aged 60–69 are 7.7% more likely (RR, 1.077) to report these feelings than those aged 45–59. Females are 20.4% more likely (RR, 1.204) to report these feelings than males. Individuals with primary education are 12.3% less likely (RR, 0.877) to report these feelings than those without education. However, individuals with graduate and above education are 28.3% less likely (RR, 0.717) to report these feelings than those with primary education. Individuals from the richest quintile are 31.7% more likely (RR, 1.317) to report these feelings than those from the poorest quintile. Individuals from scheduled castes and other backward castes are 44.1% and 42.6% more likely (RR, 1.441 and 1.426, respectively) to report these feelings than those from scheduled tribes. Individuals from the West region are 77.7% more likely (RR, 1.777) to report these feelings than those from the North region.
Relative Risk (RR) of Person Who Felt SBDD for 2 Weeks During the Last 12 Months by Socioeconomic Characteristics; LASI 2017–2018.
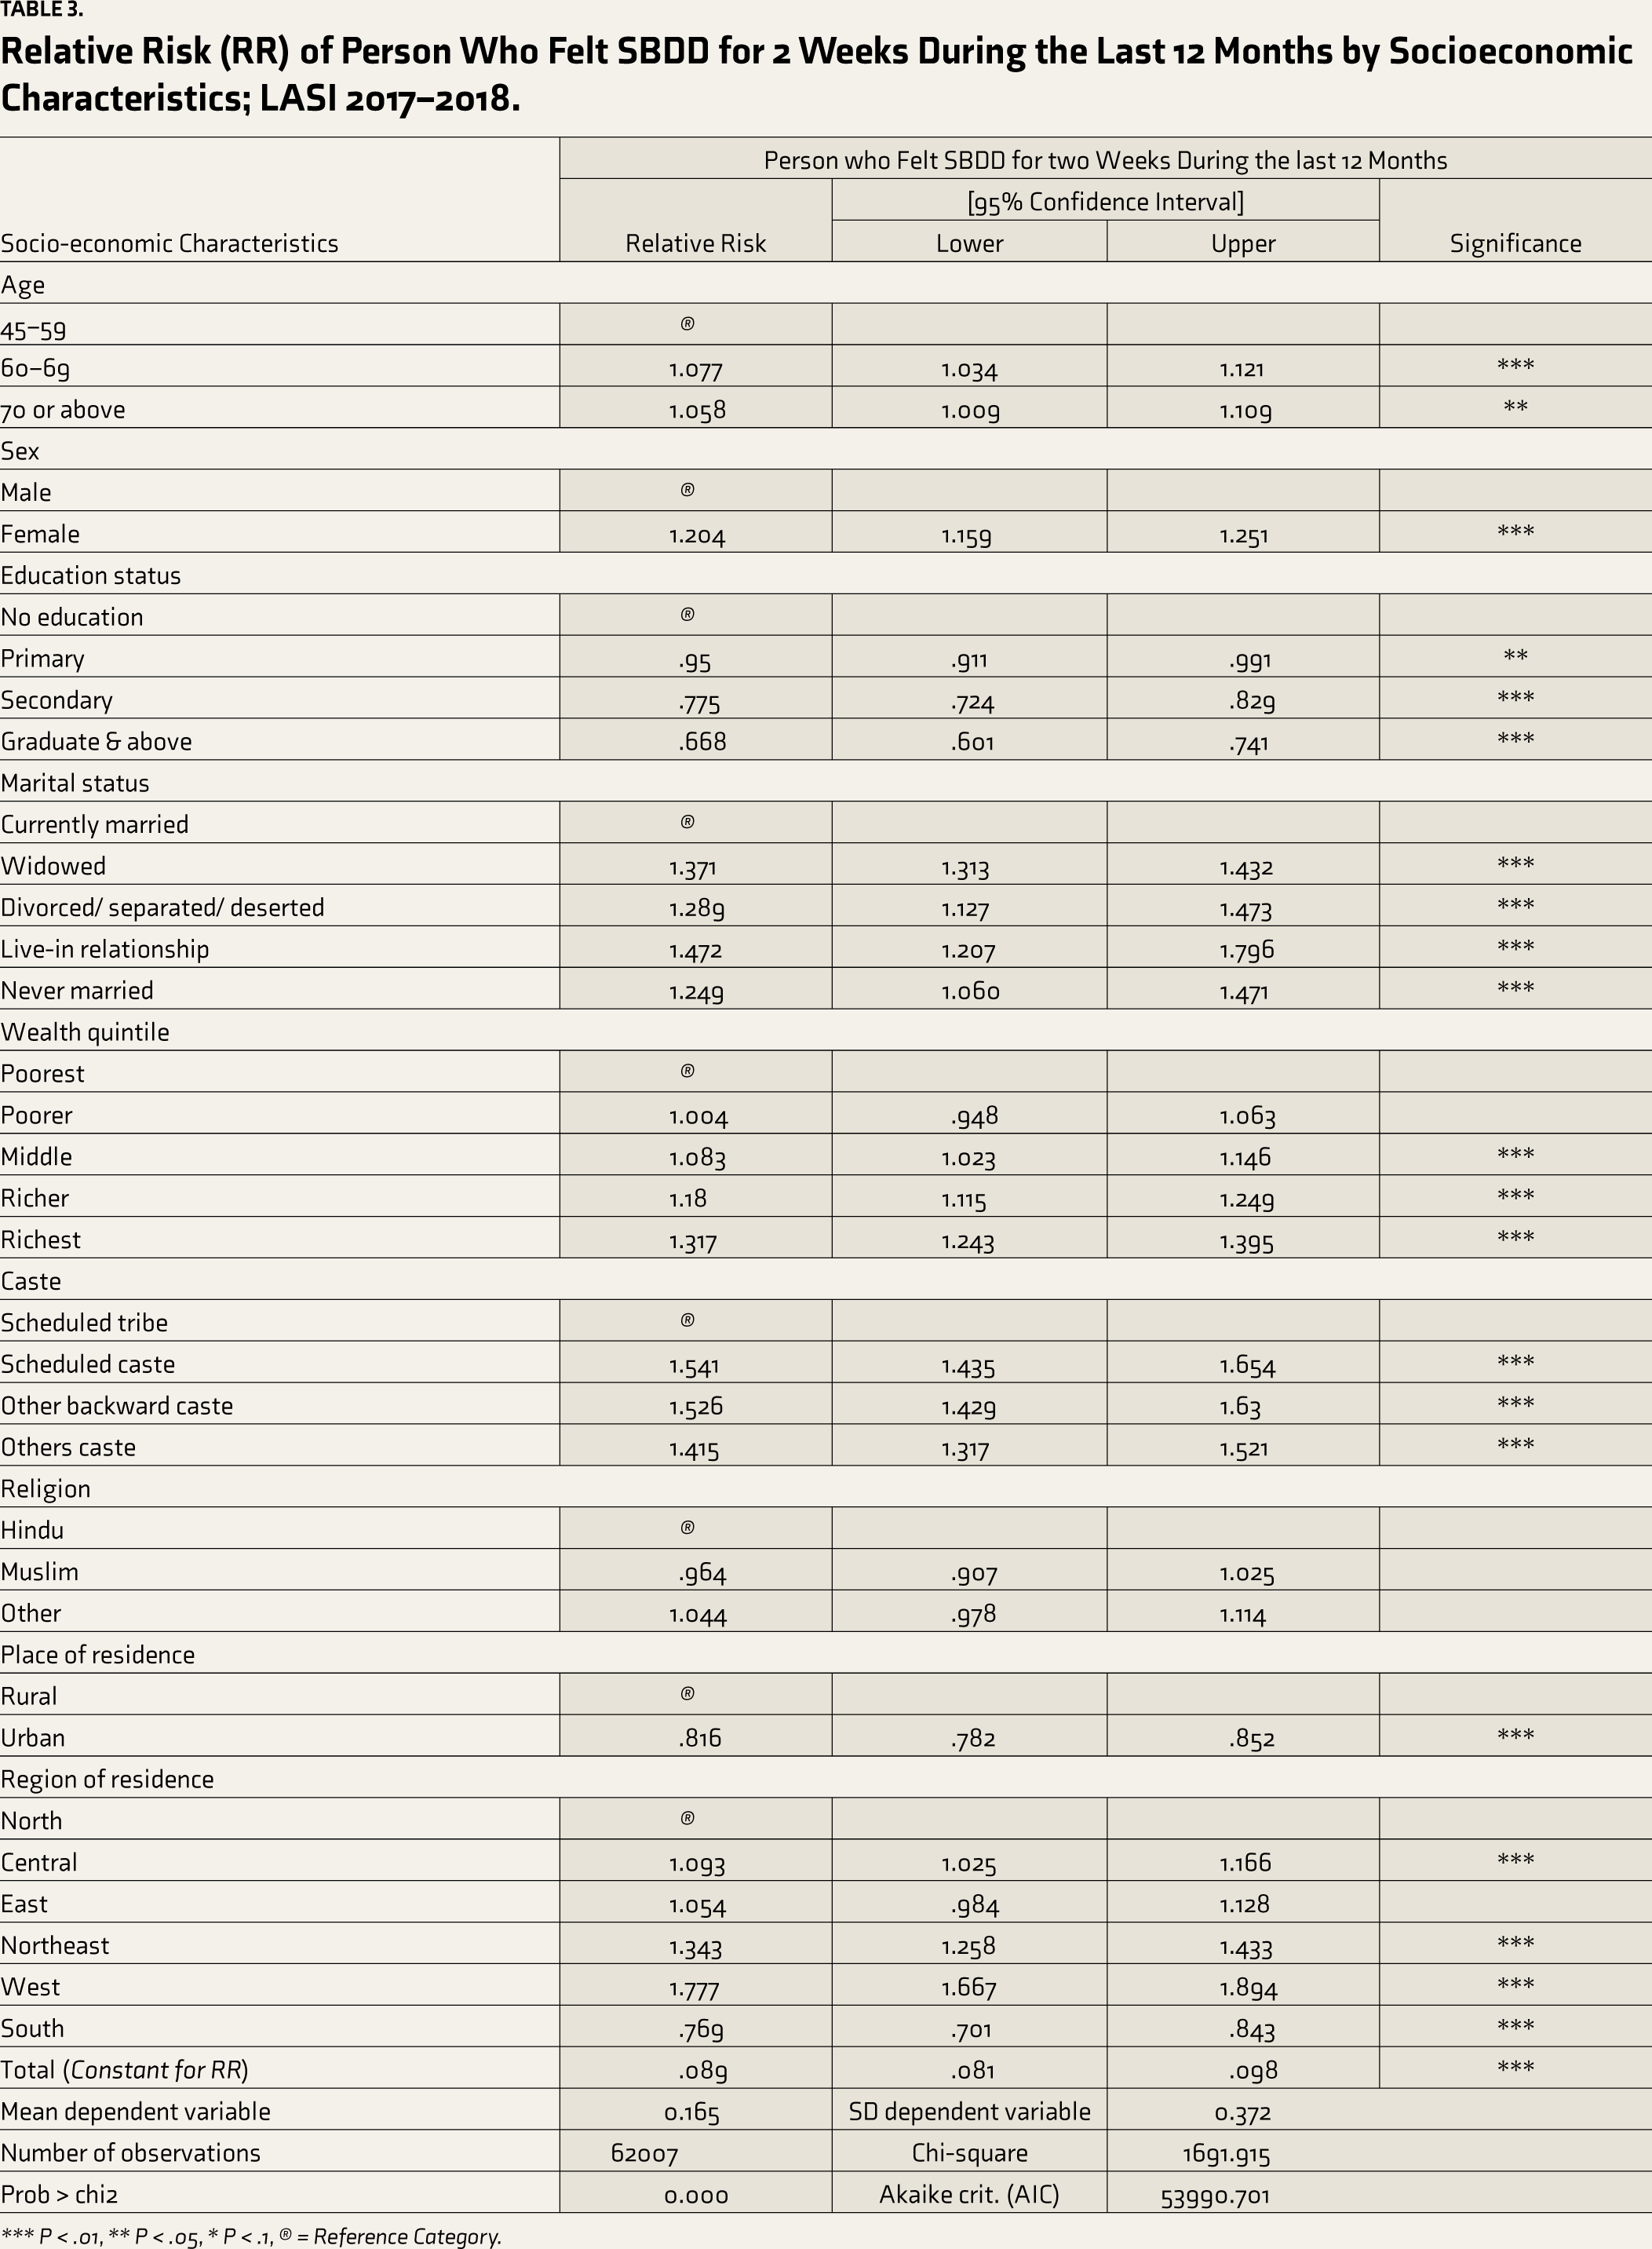
*** P < .01, ** P < .05, * P < .1, → = Reference Category.
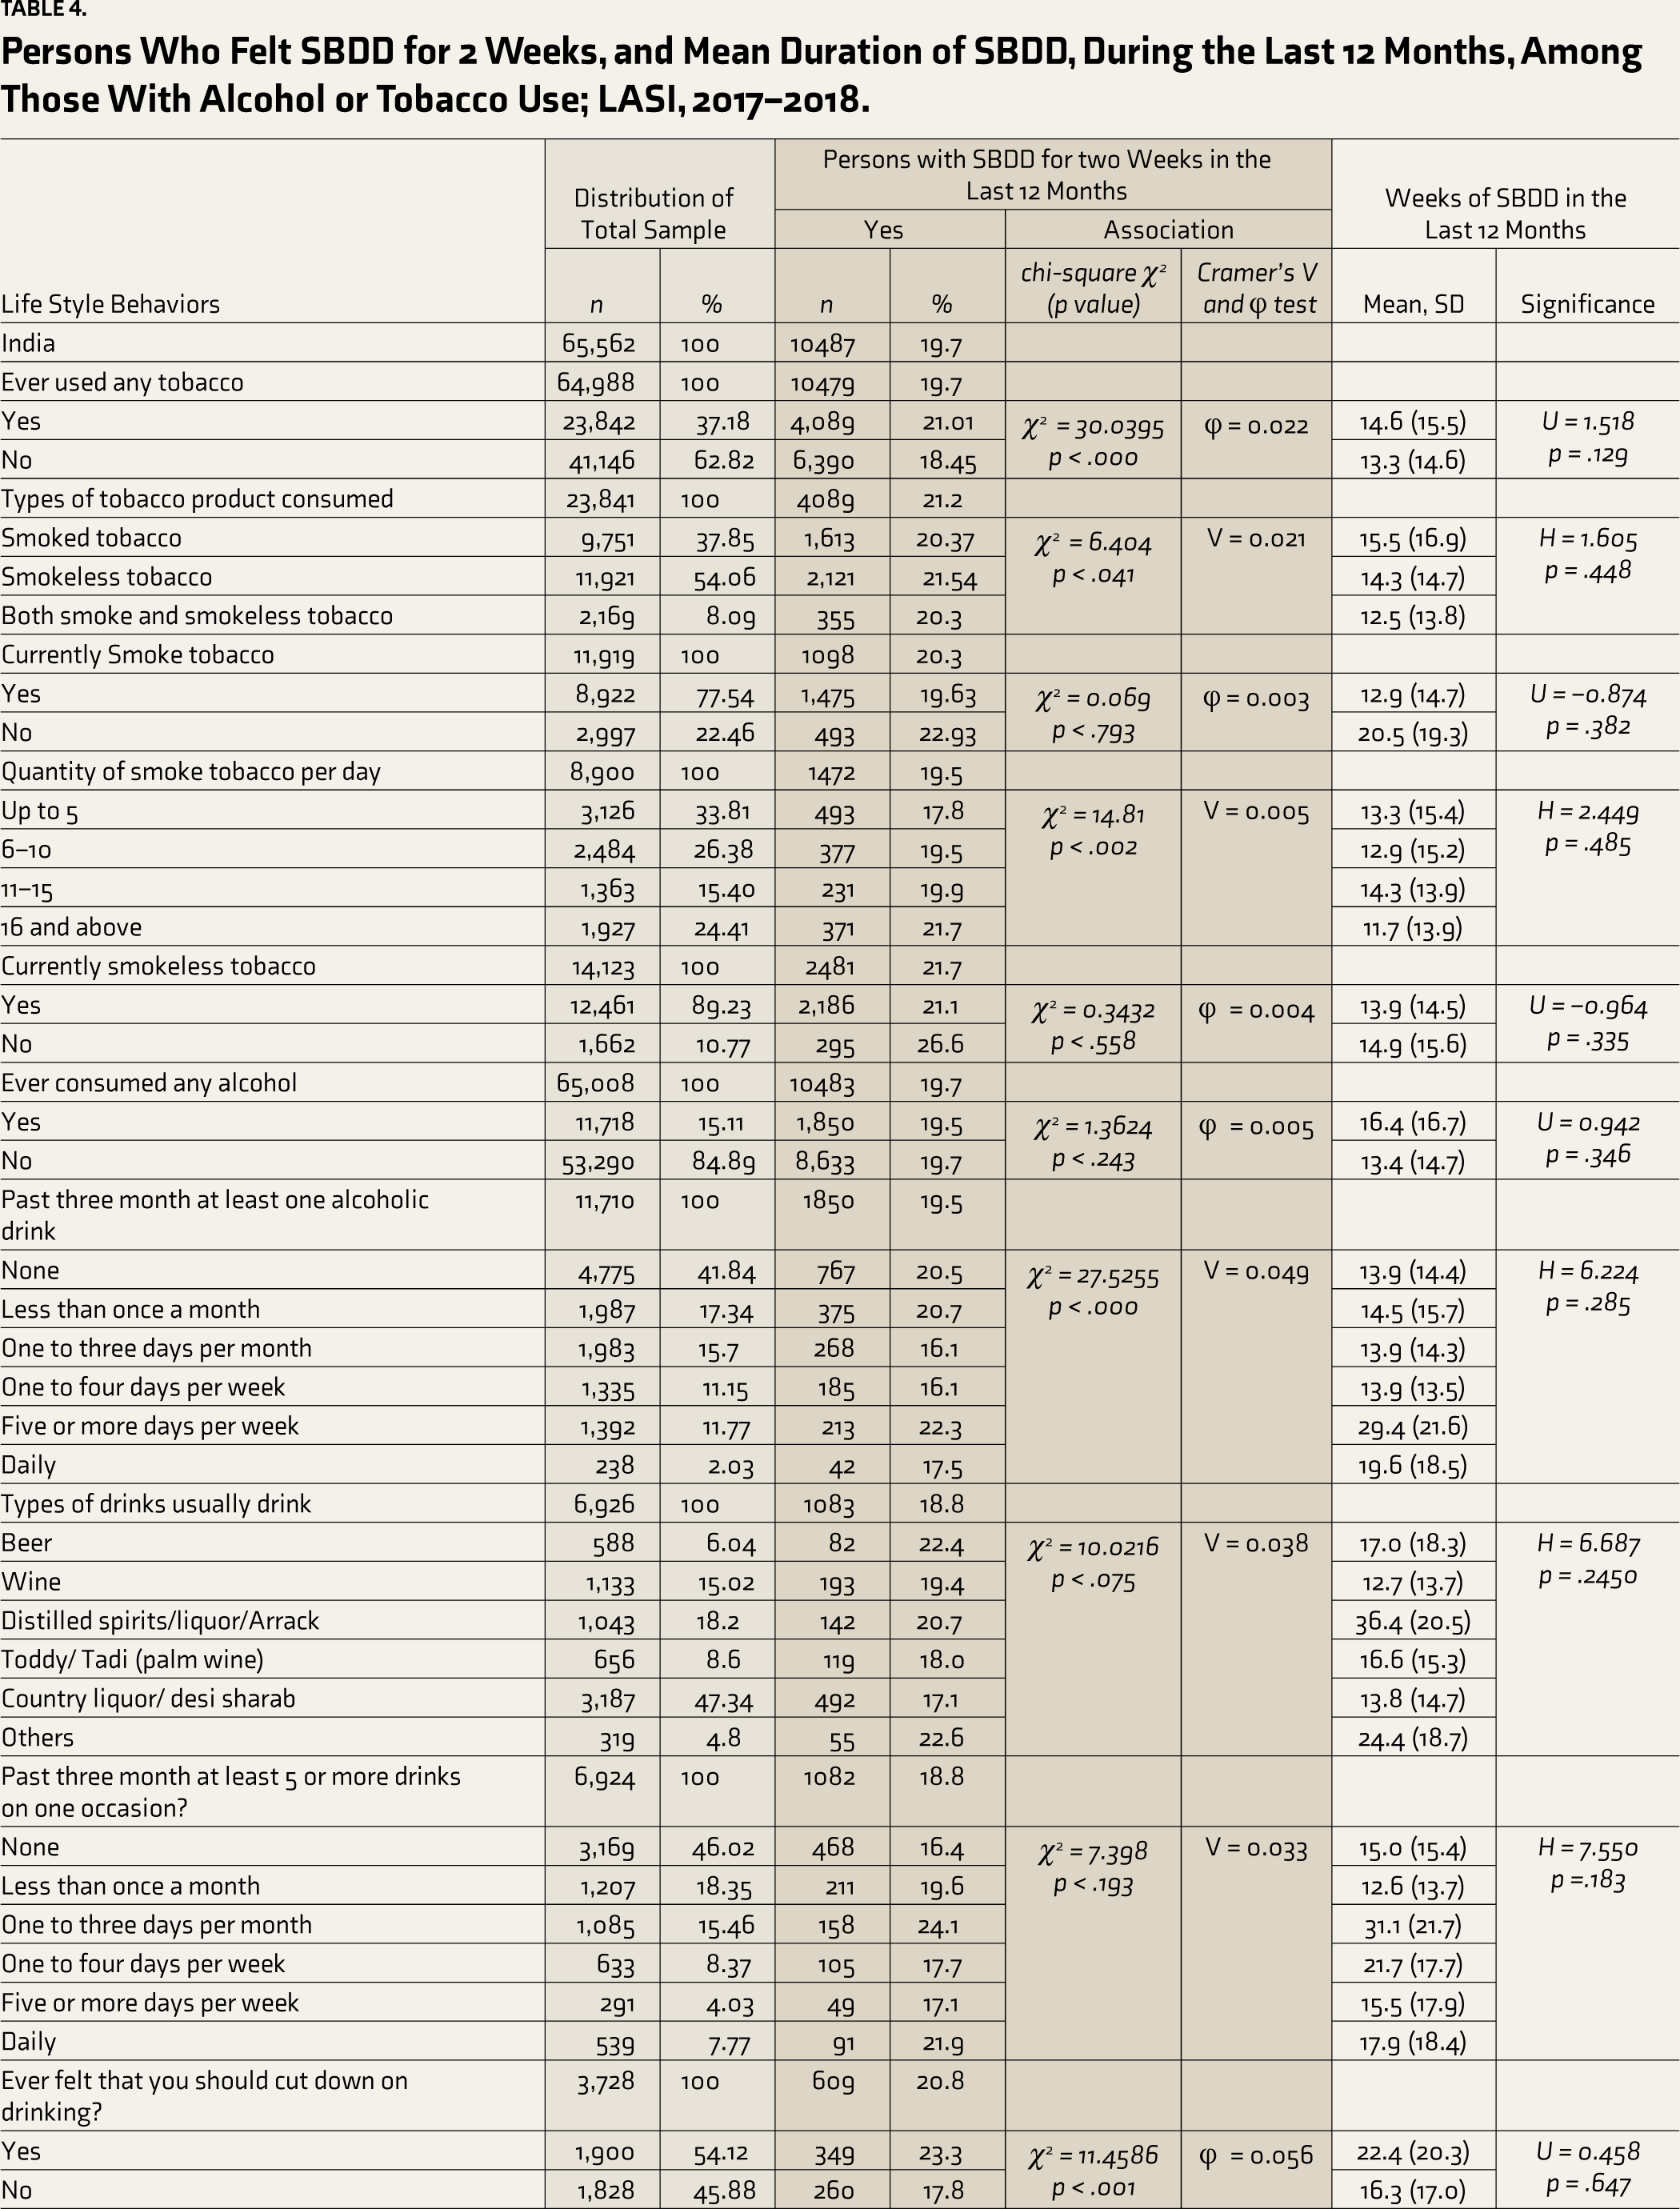
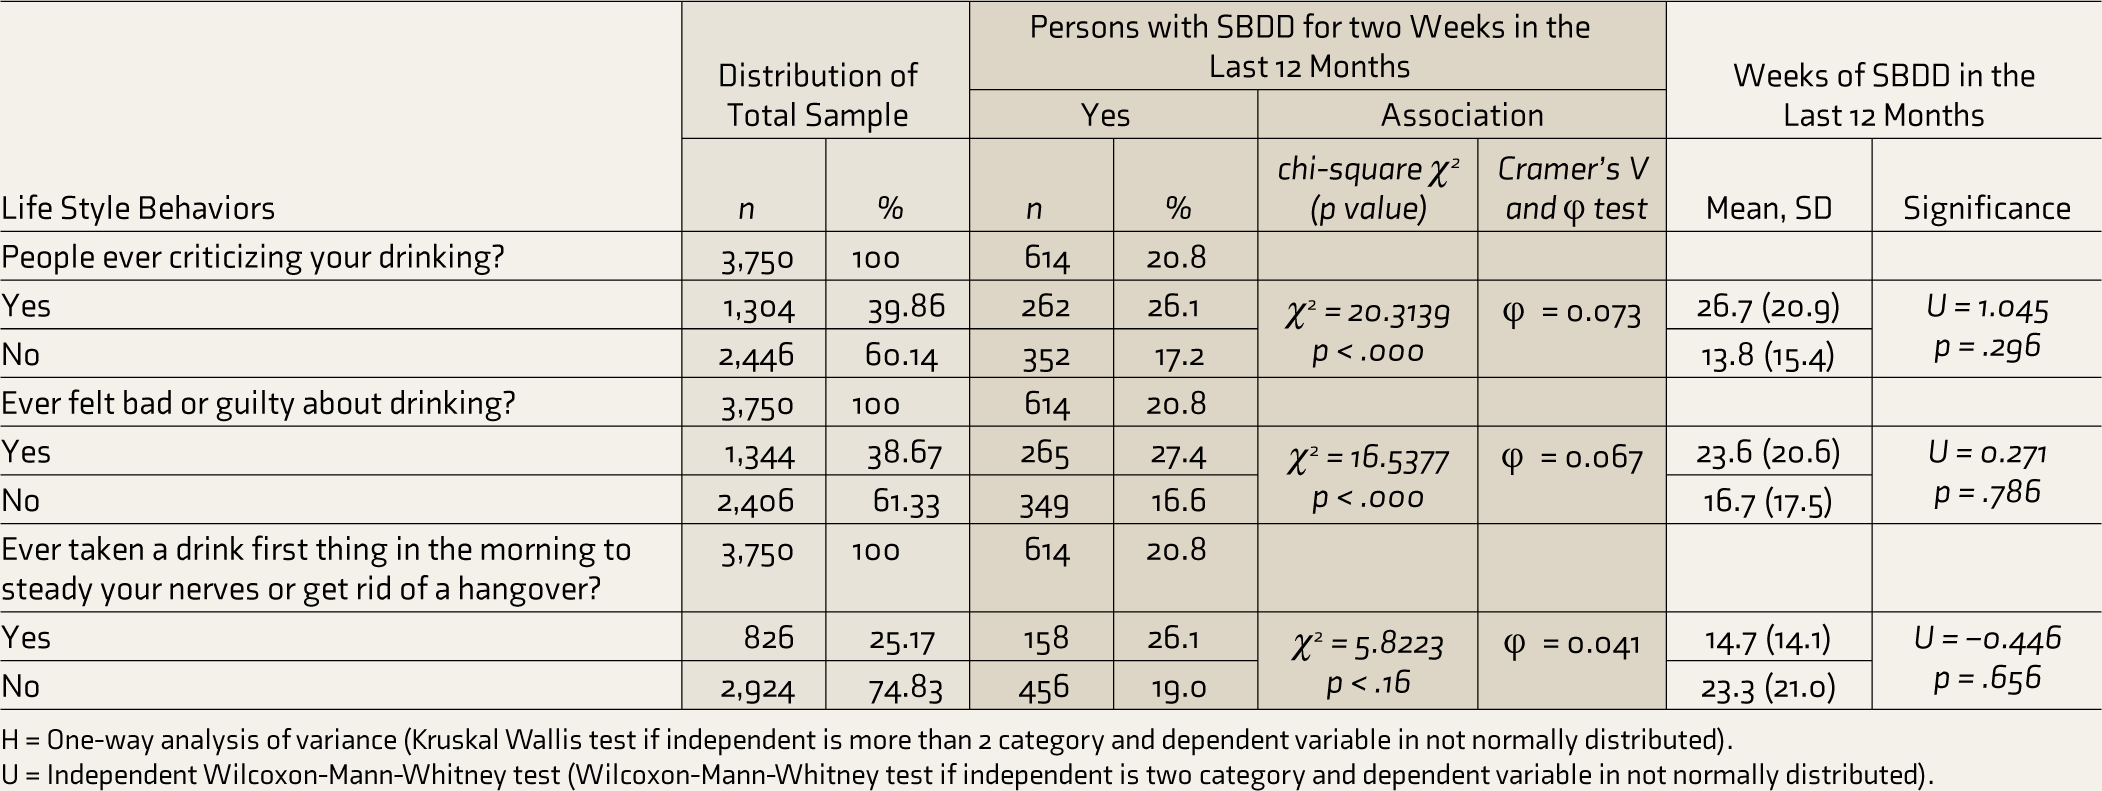
Table 4 presents the distribution of alcohol and tobacco use and its association with SBDD. Of the total sample of 65,562 respondents, 37.18% reported ever using tobacco, while 62.82% did not. Among those who used tobacco, it was categorized into “Smoke tobacco” (37.85%), “Smokeless tobacco” (54.06%), and “Both Smoke and smokeless tobacco” (8.09%). A portion of respondents (22.46%) currently smoked tobacco, with varied daily quantities: up to 5 (33.81%), 6–10 (26.38%), 11–15 (15.40%), and 16 and above (24.41%). Some respondents felt the need to reduce their drinking (54.12%). People criticizing their drinking was reported by 39.86% of respondents. Additionally, 38.67% of respondents felt bad or guilty about their drinking habits. Finally, 25.17% admitted to taking a drink first thing in the morning to steady their nerves or get rid of a hangover. Those using tobacco reported more symptoms of SBDD (21.01%) compared to those who did not use tobacco (18.45%). Individuals who felt the need to cut down on their drinking behavior reported more symptoms of SABD.
Mean and standard deviation values illustrate the number of weeks individuals felt SBDD out of 52 weeks within the last year, categorized by alcohol and tobacco use (Table 4). Those who consume alcohol five or more days per week report substantially higher mean durations (29.4 weeks, P = .000) compared to other consumption frequencies. Additionally, individuals consuming distilled spirits/liquor/Arrack (36.4 weeks, P = .000) and those drinking other types of alcoholic beverages (24.4 weeks, P = .000) exhibit significantly longer durations of feeling sad or depressed. Those who have consumed alcohol at least once a day in the past 3 months also report notably higher mean durations (19.6 weeks, P = .000). Conversely, individuals not currently consuming smoked tobacco, those consuming lower quantities of smoked tobacco per day, and those who have not experienced criticism or guilt due to drinking exhibit relatively lower mean durations of SBDD.
Persons Who Felt SBDD for 2 Weeks, and Mean Duration of SBDD, During the Last 12 Months, Among Those With Alcohol or Tobacco Use; LASI, 2017–2018.
H = One-way analysis of variance (Kruskal Wallis test if independent is more than 2 category and dependent variable in not normally distributed).
U = Independent Wilcoxon-Mann-Whitney test (Wilcoxon-Mann-Whitney test if independent is two category and dependent variable in not normally distributed).
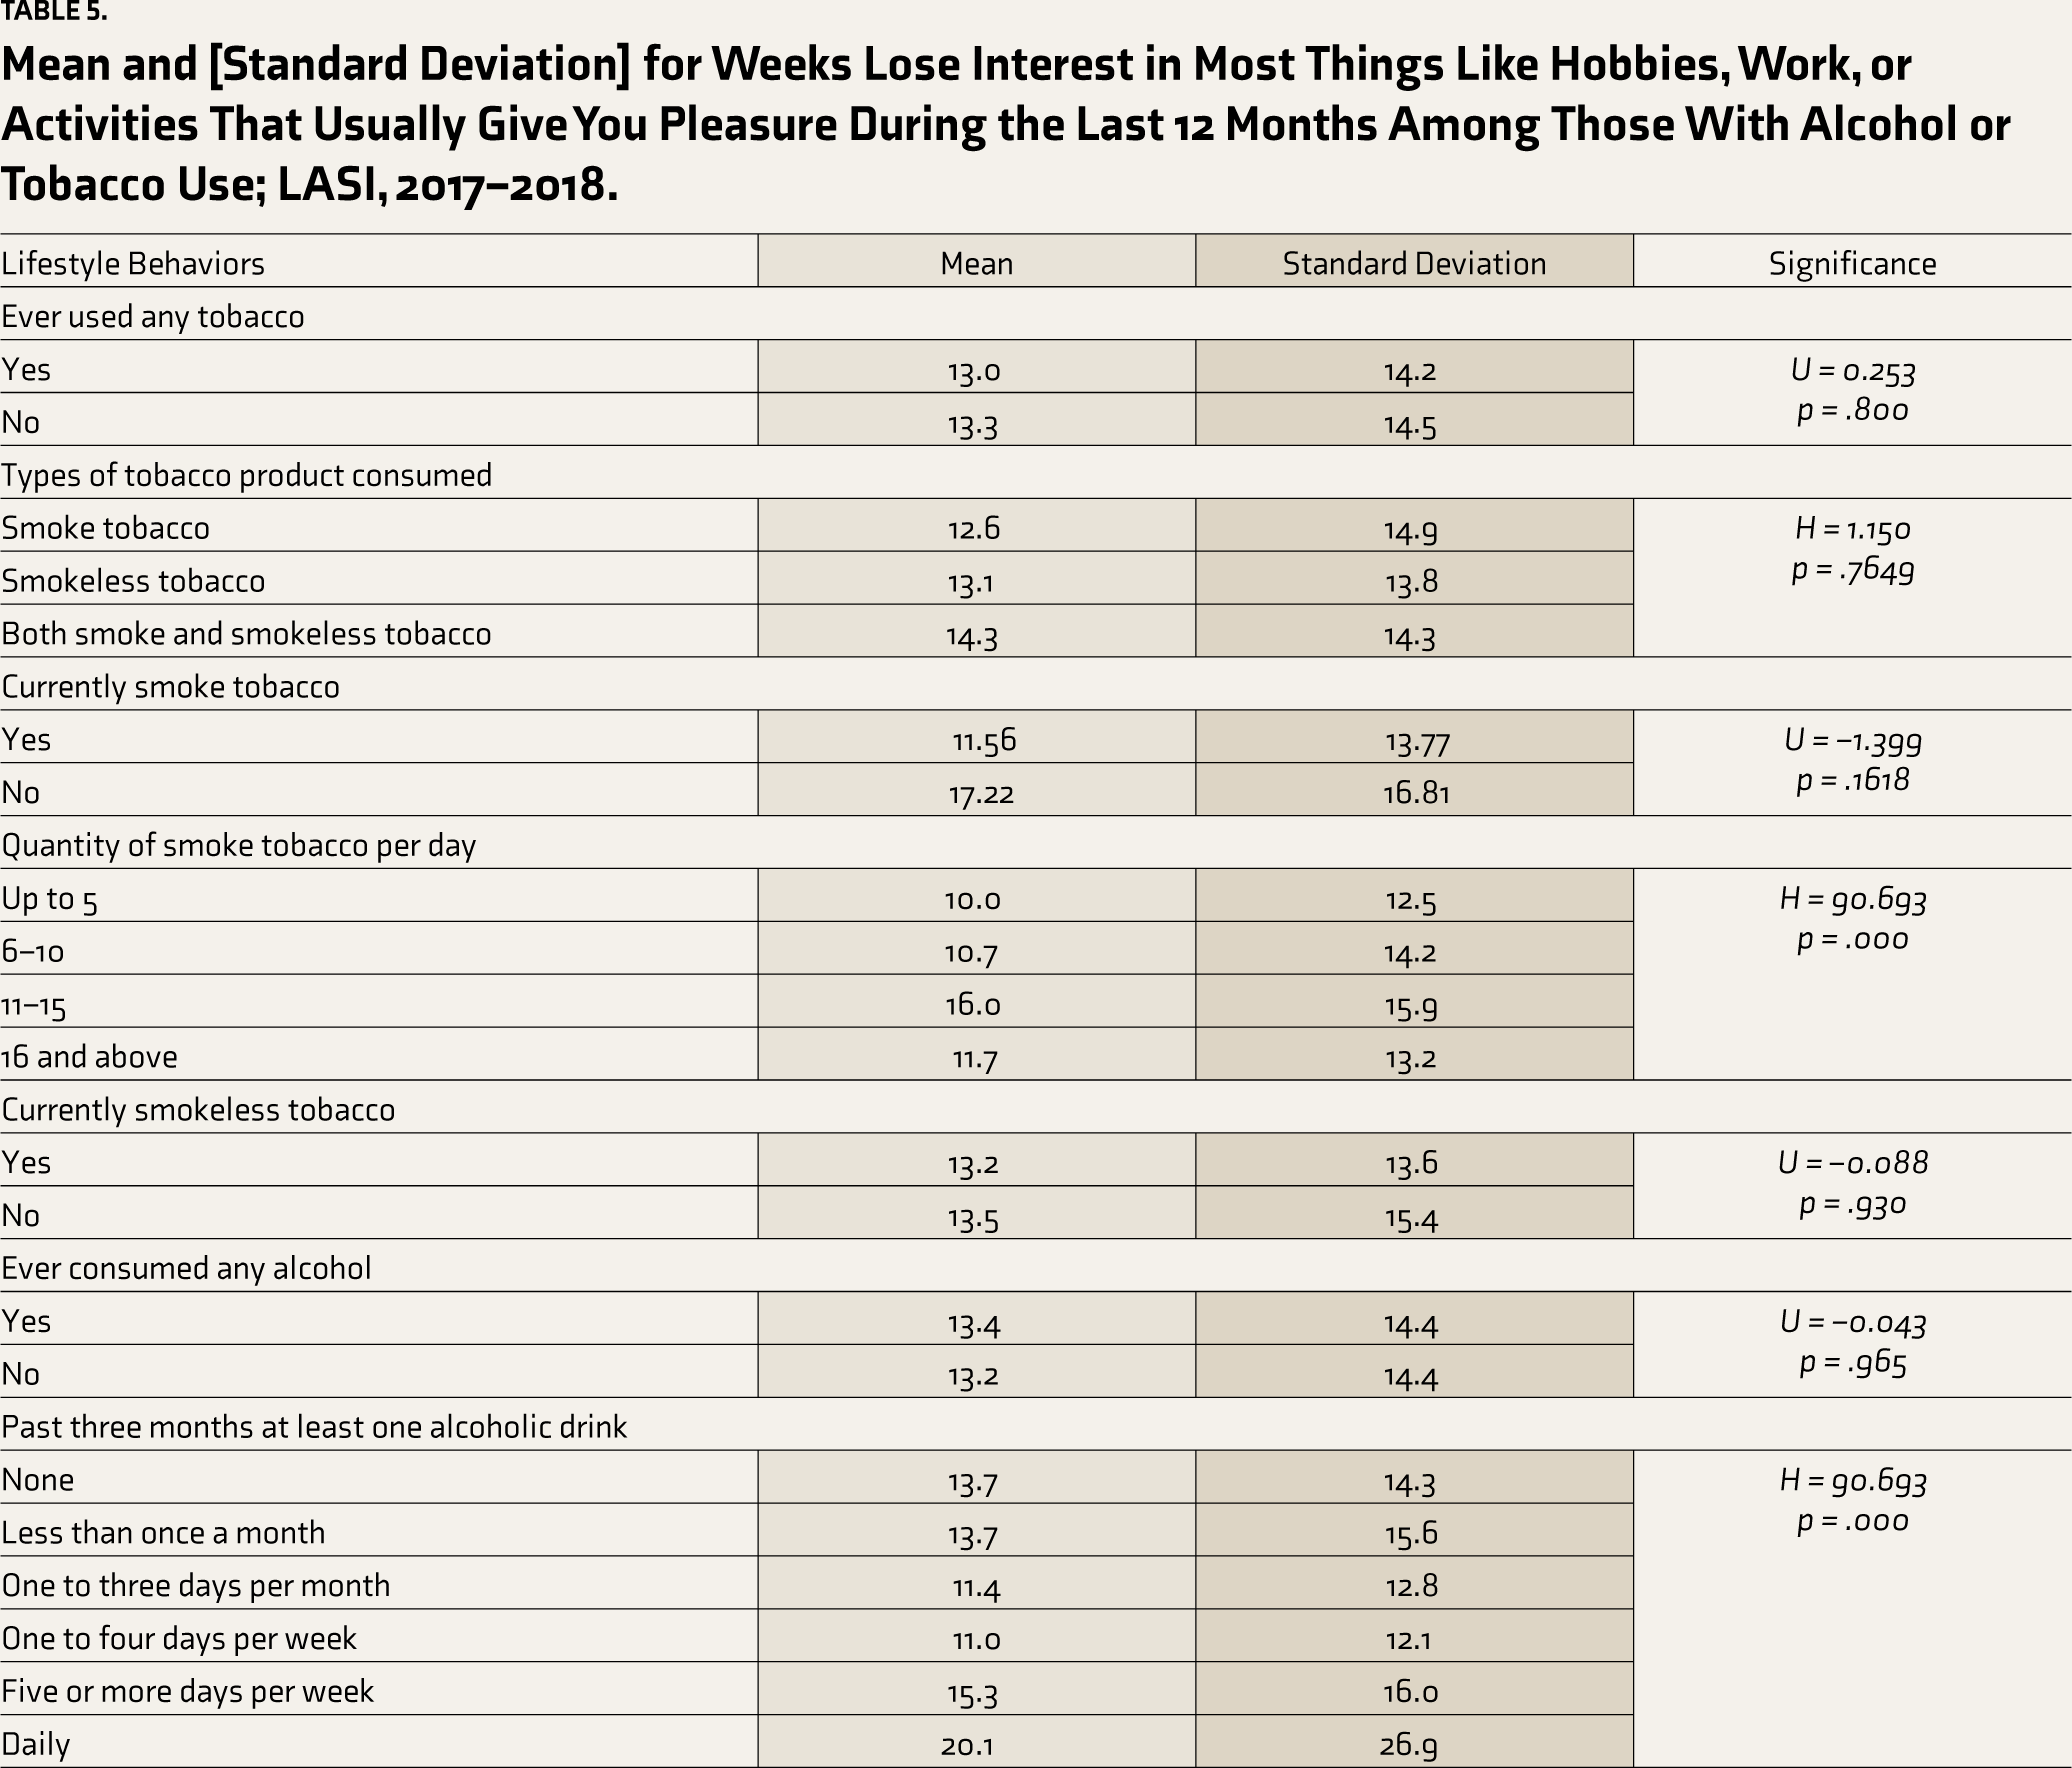
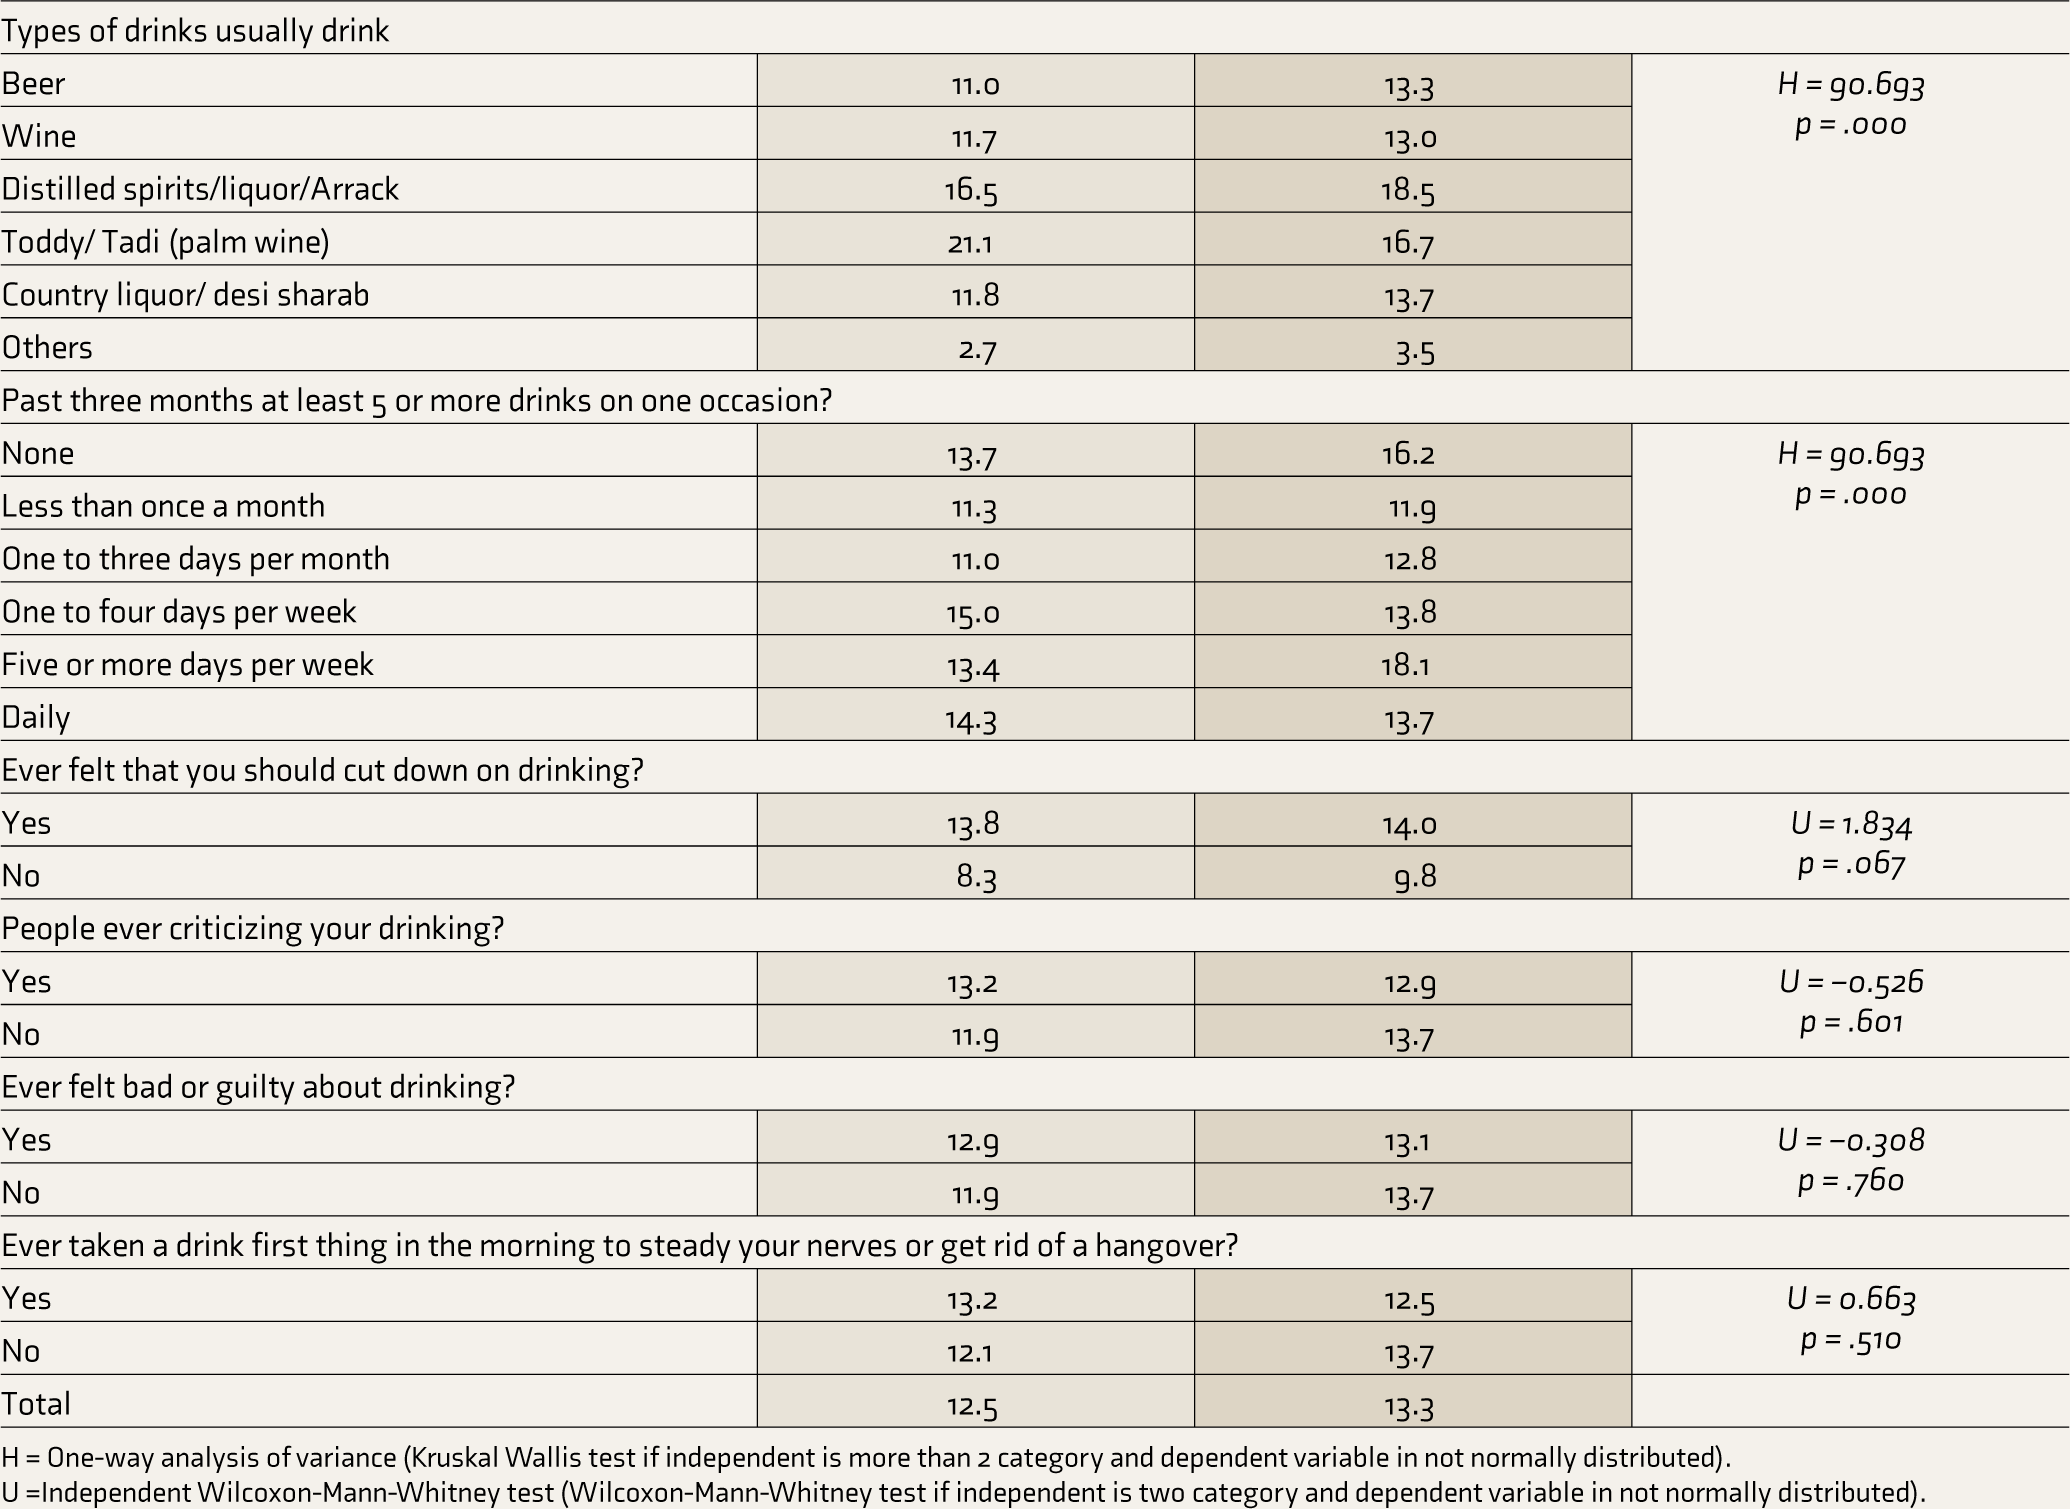
Table 5 details mean and standard deviation values, highlighting the correlation between alcohol or tobacco use and the duration individuals experience losing interest in activities they typically enjoy over the past year. Notably, certain behaviors exhibit notable associations. For instance, those who consume 16 or more units of smoked tobacco per day tend to report a higher mean duration of losing interest (16.0 weeks, P = .000) compared to other consumption levels. Similarly, individuals drinking toddy/palm wine (21.1 weeks, P = .000) or engaging in daily alcohol consumption (20.1 weeks, P = .000) manifest longer durations of losing interest. Moreover, those feeling the need to cut down on drinking display a higher mean duration (13.8 weeks, P = .067) compared to those who do not, while individuals not experiencing criticism for their drinking habits demonstrate a slightly lower mean duration (11.9 weeks, P = .601).
Mean and [Standard Deviation] for Weeks Lose Interest in Most Things Like Hobbies, Work, or Activities That Usually Give You Pleasure During the Last 12 Months Among Those With Alcohol or Tobacco Use; LASI, 2017–2018.
H = One-way analysis of variance (Kruskal Wallis test if independent is more than 2 category and dependent variable in not normally distributed).
U =Independent Wilcoxon-Mann-Whitney test (Wilcoxon-Mann-Whitney test if independent is two category and dependent variable in not normally distributed).
The association between alcohol and tobacco use and the likelihood of experiencing prolonged feelings of SBDD over the past year is provided in Table 6. Notably, the use of smokeless tobacco demonstrates a moderately elevated risk (RR, 1.07, 95% CI, 1.01–1.14), whereas using both smoke and smokeless tobacco simultaneously shows no substantial increase in risk (RR, 0.99, 95% CI, 0.89–1.10). Moreover, the quantity of smoked tobacco per day reveals a notable trend, with higher consumption levels associated with increased risk, notably at 16 or more units per day (RR, 1.22, 95% CI, 1.08–1.38, **). Drinking frequency, especially less than once a month, showed a significant risk of experiencing SBDD. However, consuming toddy/palm wine demonstrates a heightened risk (RR, 1.31, 95% CI, 1.01–1.69, *) (Table 5). Strangely, those who reported consuming less than once a month on one occasion had a significant risk of SBDD (RR, 1.18, 95% CI, 1.02–1.37). Individuals feeling the need to cut down on drinking, experiencing criticism for drinking, or feeling guilty about drinking showcase lower risks of prolonged sadness or depression. Similarly, those who have not consumed alcohol first thing in the morning to steady nerves or alleviate hangovers exhibit decreased risks.
Relative Risk (RR) of SBDD for 2 Weeks During the Last 12 Months, Among Those With Alcohol or Tobacco Use; LASI, 2017–2018.
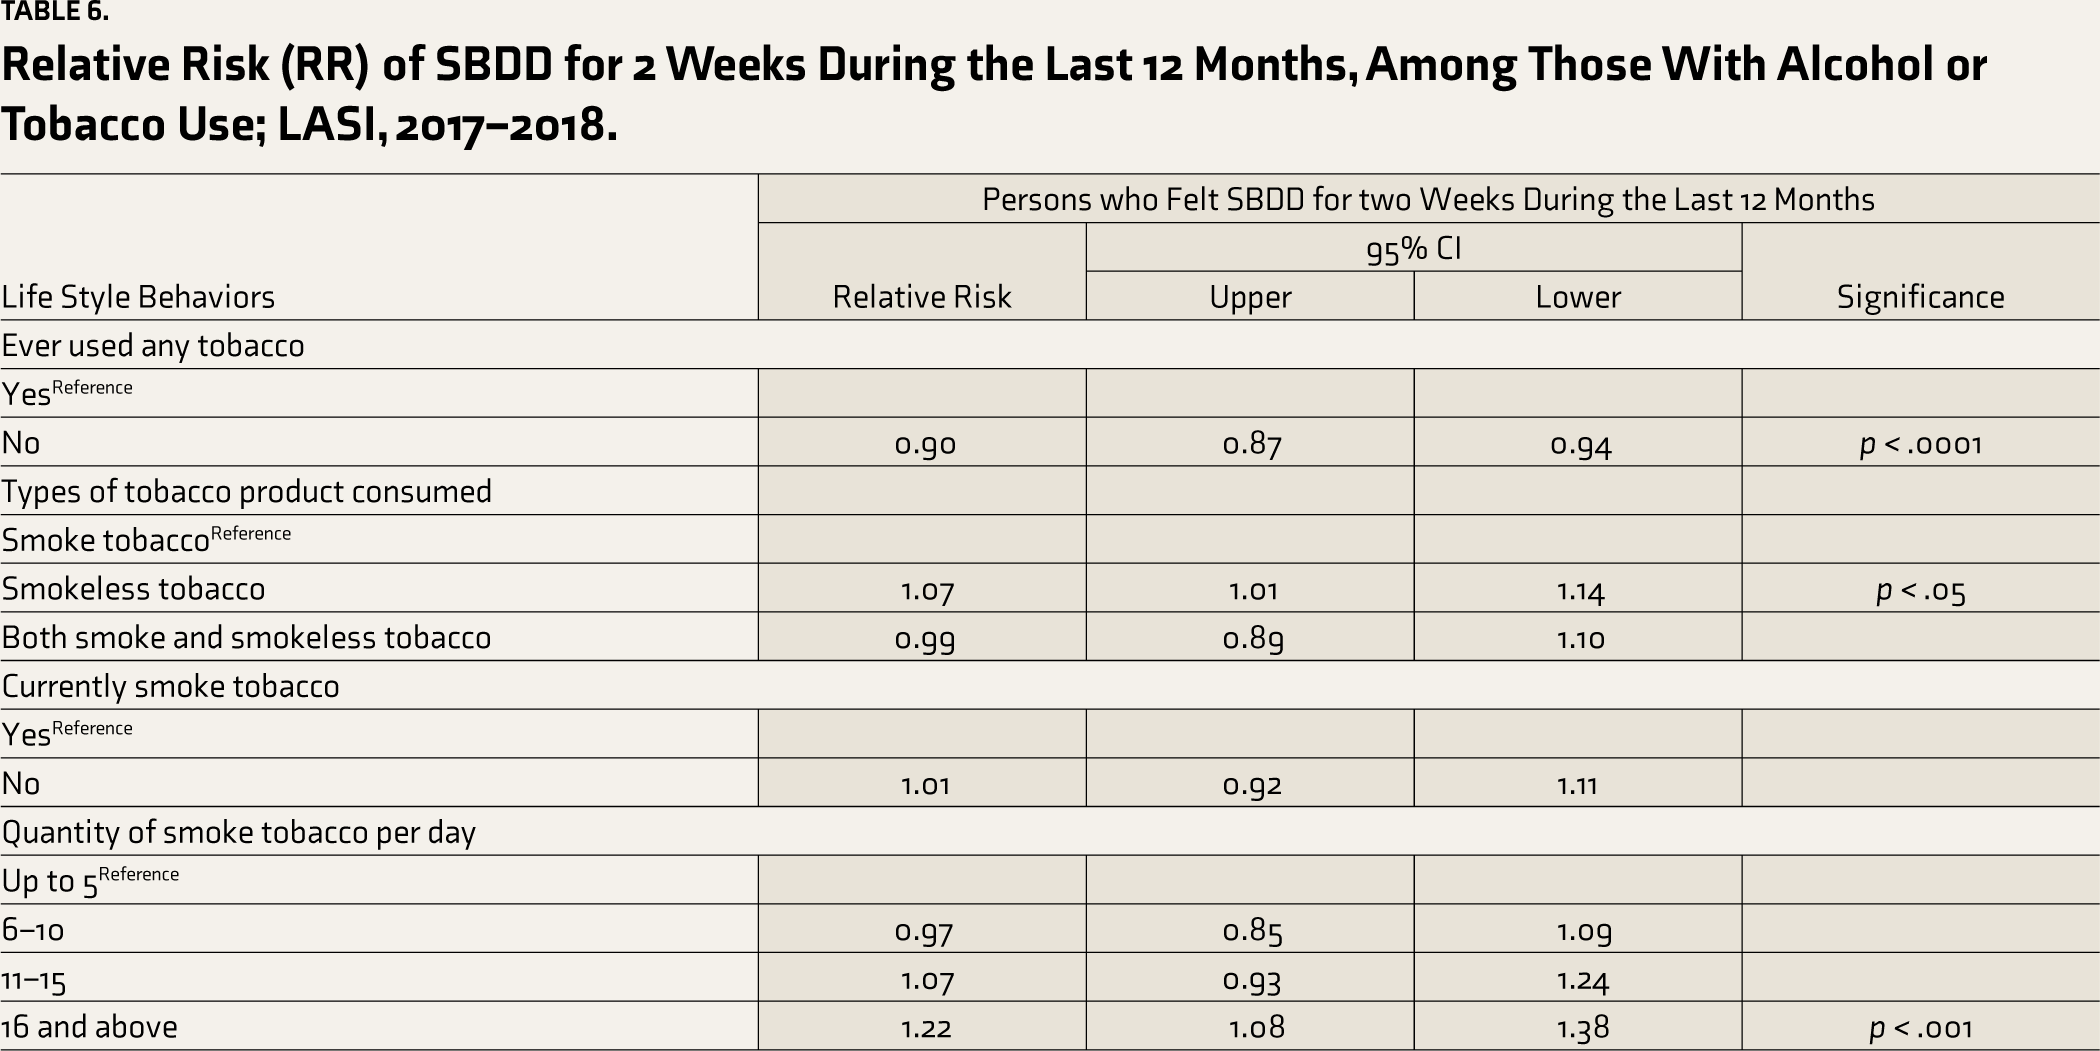
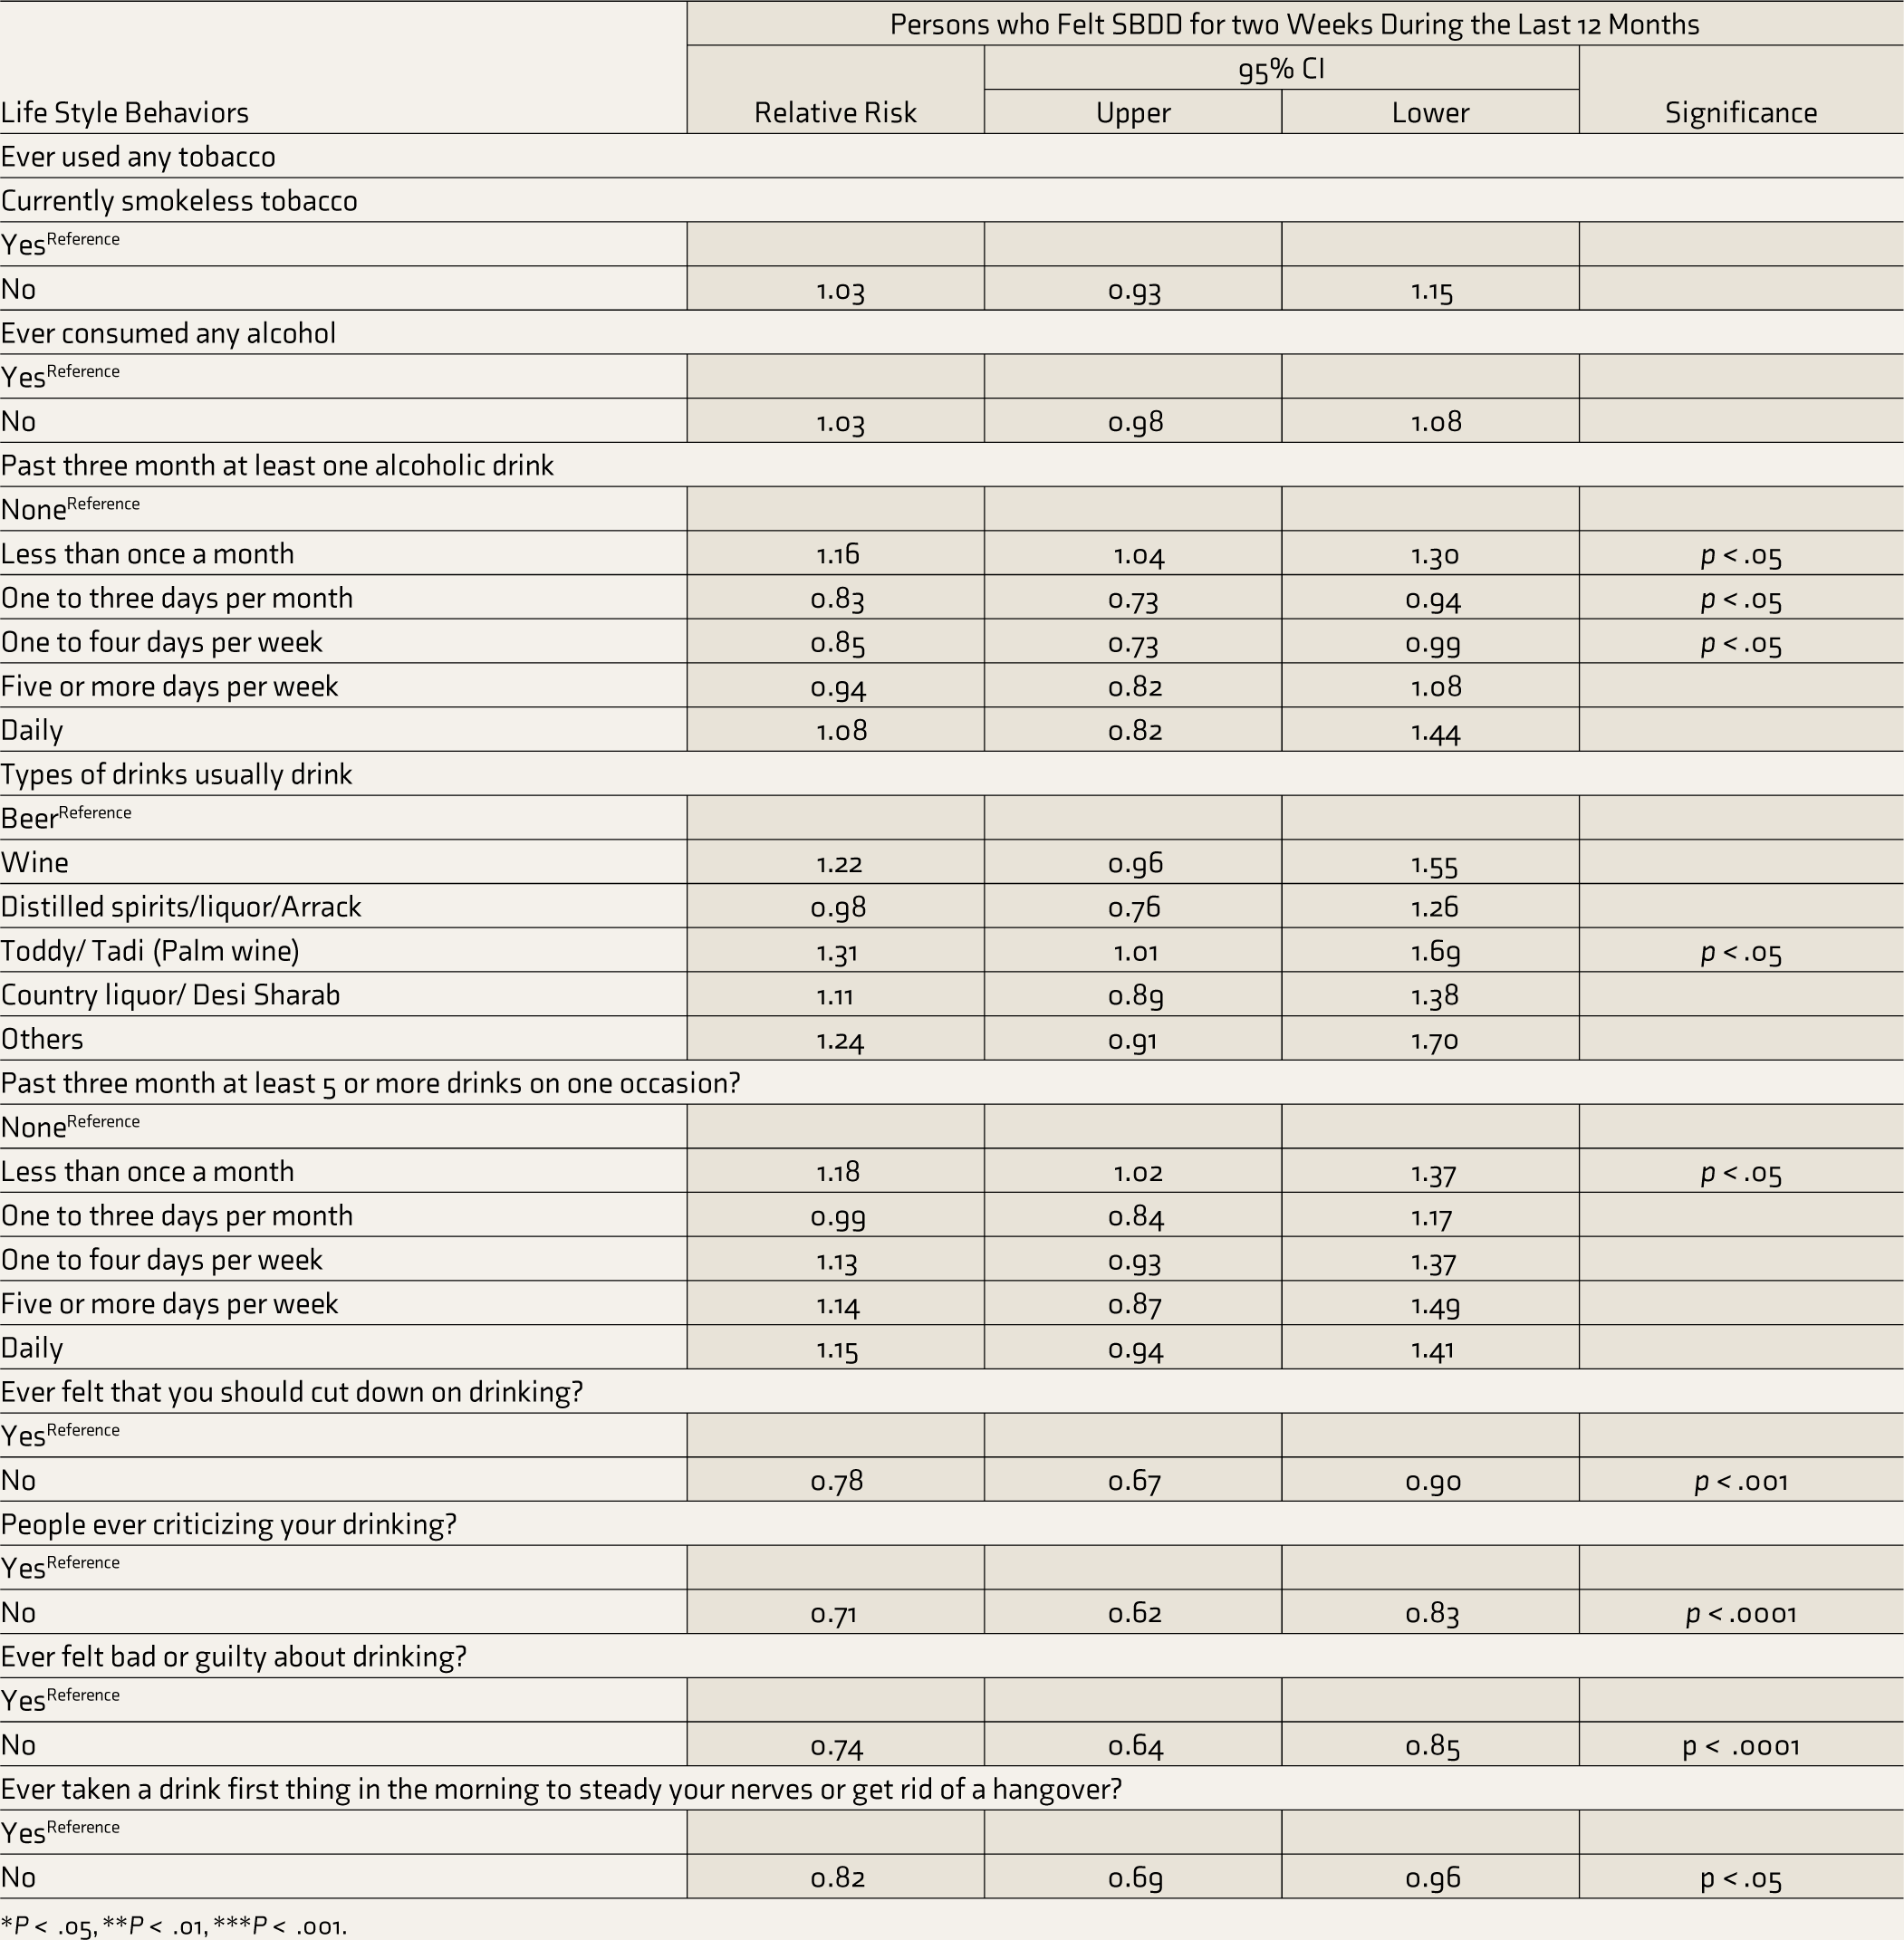
*P < .05, **P < .01, ***P < .001.
Discussion
This study delves into the complex interplay between alcohol and tobacco use and self-reported mood disorders, as measured by SBDD, among older adults in India. The findings paint a multifaceted picture, revealing significant associations between specific behaviors and mental well-being in this age group. Our study reveals a concerning prevalence of SBDD among older Indian adults, with nearly 20% reporting experiencing SBDD feelings in the past year. This aligns with previous research in India, reporting that one in five older adults (20.6%) report depression, suggesting a persistent mental health burden within the older adult population.15,16 The fact that nearly half of these individuals reported experiencing depression symptoms for half or all day further underscores the severity and potential impact of this condition among older adults.
The observed differences in depression prevalence across age groups, with older individuals reporting a higher percentage of SBDD, though marginal (for example, 20.3% of 70 years or above compared with 18.8% of 45–59 years reported SBDD in our sample), show similar findings as per previous research. 17 This could be attributed to increased physical health comorbidities, social isolation, and financial insecurity in later life.
Depressed mood (sadness or dysphoria) and loss of interest (anhedonia) are two core symptoms of Major Depressive Disorder (MDD) according to the DSM 5 that can be manifested differently in older adults compared to younger people. 18 Previous studies have highlighted “depression without sadness” characterized by a lack of interest, sleep difficulties, lack of hope, loss of appetite, and thoughts of death. 19 Our study analyzed responses concerning emotional and physical experiences during a specific 2-week period within the past year when these feelings were worst. Around 87% reported losing interest in most things, while 88.4% felt more tired or less energetic than usual. 82% experienced a loss of appetite, whereas 15.7% reported an increased appetite during that period. Difficulty concentrating was prevalent, with 84.4% facing this challenge. Feelings of worthlessness affected 72.9% of respondents, and thinking about death occurred for 55.4% during those weeks. Sleep disturbances were common, with 78.3% facing trouble falling asleep.
The study highlights the significant association between alcohol consumption and tobacco use with higher frequencies and quantities linked to longer durations of feeling SBDD. This aligns with existing research suggesting that alcohol use can exacerbate depressive symptoms and contribute to the development of depression. 20 The heightened risk associated with toddy/palm wine consumption is particularly concerning due to its low costs, which require further exploration. Numerous studies have linked the use of illegal and excessive alcohol consumption to an earlier rate of cognitive deterioration in older persons, particularly in men. 19 Studies have shown that compared to older persons who did not smoke, those who smoked had a 15% significantly greater chance of experiencing cognitive impairment [OR, 1.15, CI, 1.01–1.31]. Muhammad et al., 21 using nationally representative data, found that, compared to older persons who do not chew tobacco, those who chew tobacco had a 62 percent substantially increased chance of cognitive impairment [OR, 1.62, CI, 1.46–1.80].
The study provides valuable data on the association between alcohol and tobacco use and SBDD among older adults in India. The study findings highlight the potential for interventions to reduce alcohol and tobacco use among older adults as preventive and therapeutic strategies. As substance use among older adults shows rise, effective screening and diagnosis becomes increasingly critical. Further research exploring the underlying mechanisms and potential for targeted interventions is crucial to combat depression and improve mental health outcomes in India effectively. Investigating the mechanisms underlying the observed associations between specific behaviors and depression is crucial for future research. For instance, exploring the role of stress, social support, and coping strategies in moderating or mediating these relationships could inform targeted interventions.
The strength of this study lies in its utilization of robust and comprehensive data from the Longitudinal Ageing Study in India (LASI) Wave 1, conducted from 2017 to 2018. LASI provides a nationally representative sample of older adults in India. This enhances the external validity of the study’s findings, allowing for the generalization of results to the broader older adult population in the country.
This study has limitations, including its cross-sectional nature, which precludes causal inferences. Additionally, the reliance on self-reported data may introduce biases. Future research employing longitudinal designs, objective measures of depression, and nuanced assessments of sociocultural factors could provide deeper insights.
Conclusion
Lifestyle choices such as alcohol and tobacco use play a role in the duration and association of negative emotions such as SBDD among older adults in India. Collaborative efforts and innovative strategies focused on understanding these unique factors can help older adults survive and thrive, with their emotional landscapes painted in vibrant hues of joy and well-being.
Footnotes
Data Availability Statement
This study utilized the LASI wave 1 round data, available for individuals on a request basis. The authors have data from IIPS Mumbai on a request basis for this study.
Declaration of Conflicting Interests
The authors declared no potential conflicts of interest with respect to the research, authorship and/or publication of this article.
Declaration Regarding the Use of Generative AI
None used.
Ethics Approval
This study used data from LASI (2017–2018). LASI obtained ethical consent from the Institutional Review Committee before the survey and received approval from the Indian Council of Medical Research (ICMR) Ethics Committee. During the survey, the respondents gave written consent once they agreed to take part in the study.
Funding
The authors received no financial support for the research, authorship and/or publication of this article.