
Abstract
Background:
Guts, Resilience, Integrity, and Tenacity (GRIT) is an optimistic character that mixes passion and dedication. It is a driver of achievement and success, independent of and beyond what intelligence and talent contribute. The study aimed to assess GRIT and factors influencing it among mid-adolescent school students (13–18 years) in the Perambalur district, Tamilnadu, India.
Methods:
A cross-sectional study was conducted among mid-adolescent school students. We used a self-reported questionnaire to collect the data on sociodemographic characteristics and parents’ details and the standard eight-item GRIT questions. Analysis was done with the total and subscale scores.
Results:
Among the 1663 participants, 966 (58.1%) were males. The mean (SD) age was 15.6 (1.19) years. The mean GRIT score was 26.65 (4.12). Most students (755) showed medium (45.4%) GRIT scores. The age factor had a weak negative correlation with GRIT (r = −0.052, p = 0.033) and females had higher scores (t = 9.13, p = 0.002). Perseverance of effort was significantly more in those from a rural background (t = 1.9, p = 0.012), while consistency of interest was more in those from urban background (t = 0.63, p = 0.03).
Conclusion:
Most students had average or medium GRIT scores, with higher GRIT among females. The concept of GRIT should be properly addressed among children during their school years in order to inspire them to dream with passion and perseverance.
GRIT is important in adolescence as the period warrants focus and pursual of long-term objectives with unwavering dedication. The study found a medium GRIT score among most adolescents. GRIT decreased with age, and female students outperform male students in terms of consistency of interest and total GRIT score. Perseverance of effort was more in rural subjects and consistency of interest was more in urban ones.Key Messages:
GRIT stands for Guts, Resilience, Intention, and Tenacity.1,2 Guts refer to the trait of willingness to take risks in a state of uncertainty. Resilience refers to the ability to bounce back and recover quickly from challenges. Intention or intensity is the inner self-confidence of who you are and what you can do. Tenacity refers to the determination to move forward against all setbacks. GRIT refers to passion and perseverance for long-term goals and was presented as a trait by leaders in various fields.3–6 Passion is derived from the inner self, and this makes the person internalize an activity in terms of time and energy. Perseverance is a quality that motivates people not to give up when they face problems and challenges. 7 Research shows that GRIT entitles a person to continue a purposive action despite hindrances, troubles, or despair. 8 A person is not born with GRIT; rather, character strength can be learned. The development of GRIT is steady and is nurtured with training, experiences, and practice. 9
In the adolescent phase, that is, the period from 10 to 19 years, the individual gets molded and relationships with peers and family members advance, introducing new educational and occupational demands and responsibilities and establishing a sense of identity. 10 With focussed direction in life and satisfaction, they develop higher self-esteem, self-report better health, have more friends, perform better at work, and potentially even live longer. 11 On the other hand, the setbacks or challenges in life in terms of failures or the introduction to new hormonal sexual changes may reduce the meaning and satisfaction in life. The presence of GRIT acts as a buffer or a lubricant and makes the adolescents strive back against all the negative impacts of life. Figure 1 shows how high GRIT influences adolescent problems.12,13
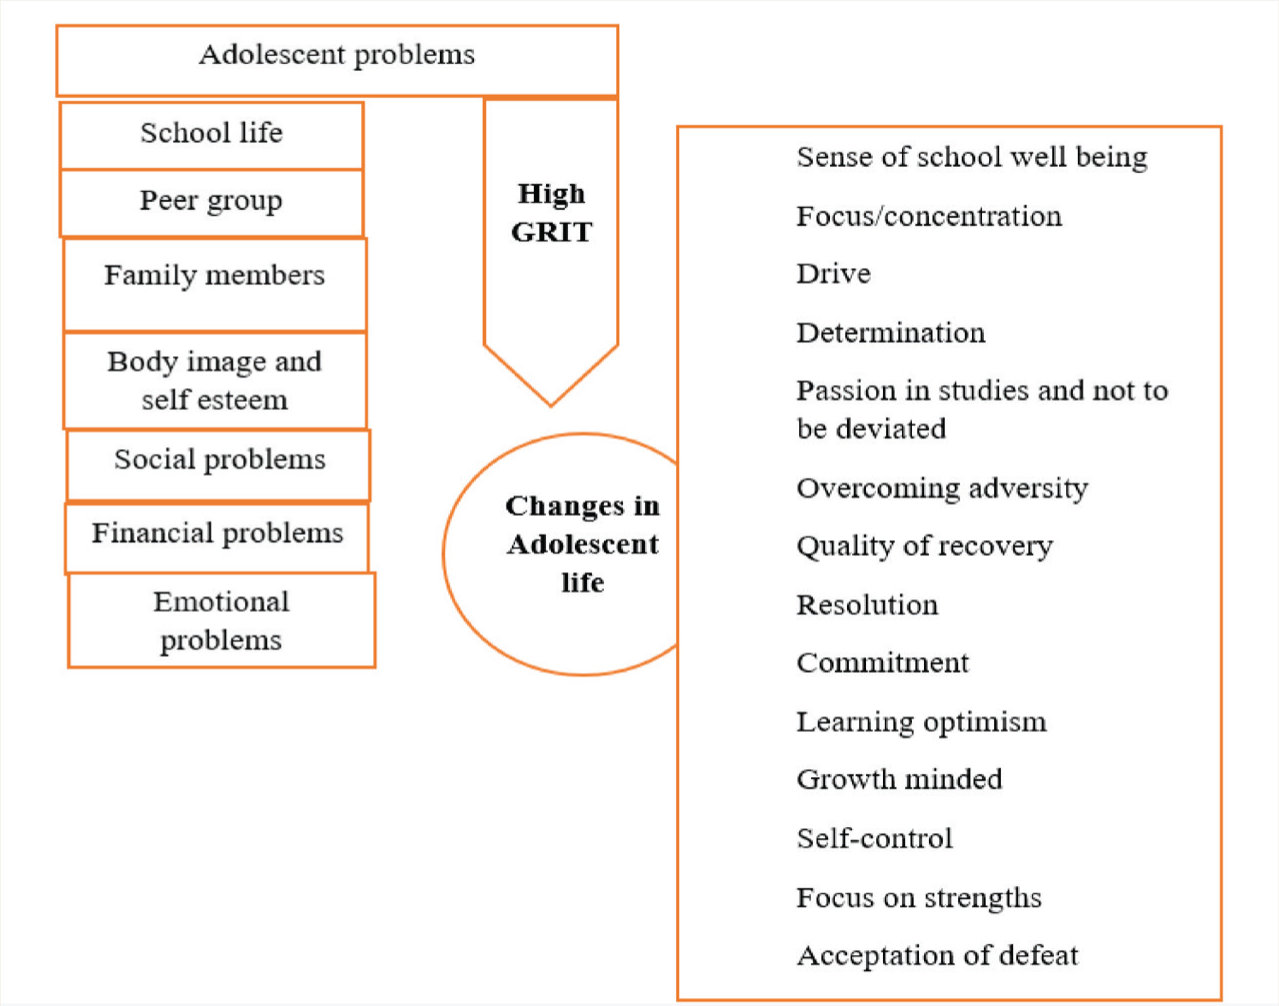
GRIT: Guts, Resilience, Integrity, and Tenacity.
Students who are GRITters have better academic performance and are more likely to perceive their goals. 3 Adolescents who regularly participate in physical activity have better GRIT than sedentary youth. 14 GRITty people are likely to be less prone to adverse mental health outcomes, due to their propensity to experience obstacles and failures positively. 15 The Indian education system focuses on the cognitive factors of students, and teaching necessary skills for students is absent, unlike in foreign countries. 16 The literature on GRIT and various factors affecting it is scarce in our country. A few studies have been conducted among the youth, which showed that GRIT highly influences a person’s psychological well-being.16,17
Against this background, the objectives of this study were
to assess GRIT among school students aged 13–18 in the Perambalur district and to explore the various factors associated with GRIT among them.
Materials and Methods
We conducted a cross-sectional study within a period of two months (February–April 2022). The data were collected from students of four private schools, including both English and Tamil mediums of education.
The sample size was calculated using the anticipation that 50% of the school students have high GRIT scores, and after applying the formula, n = Zα2PQ/d2 (Zα = 1.96, P = 50, Q = 50, d = 5), the sample size came up to 384. The Institution’s Ethics Committee approved the study (IECHS/IRCHS no: 164, January 23, 2022‑Dhanalakshmi Srinivasan Medical College Hospital). Informed consent from parents or guardians was obtained beforehand (through the student diary), and assent from students was taken during the study.
Study Procedure and Selection Criteria
Data were collected from 1663 subjects. The subjects were asked to fill out the questionnaire schedule individually. The students were given an orientation session before they start, and the investigators cleared doubts on an individual question basis. We included adolescents in classes 9–12th grade in the age group of 13–18 years, studying in the selected schools. Exclusion criteria were students whose parents did not give consent and those who were absent on the day of the interview.
Questionnaire
The questionnaire had three parts: (a) Sociodemographic details including name, age, sex, number of siblings, class of study, residential area, and other personal details like hours of study, extracurricular activities, and time spent for the above. (b) Parents’ details like education, occupation, annual income, and the number of family members. (c) Standard Short GRIT Scale (GRIT-S, also known as standard Angela Lee Duckworth’s eight GRIT questionnaire). It comprises eight questions that assess commitment and likelihood to complete long-term goals. 18 The eight-item questionnaire is divided into two subscales – perseverance of effort and consistency of interest. It uses a 5-point Likert scale (1 = not like me at all, 5 = very much like me). The internal consistency of the questionnaire showed a Chronbach’s alpha of 0.85. 19
The questionnaire was circulated to the students in bilingual forms (English and Tamil). The questionnaire was translated and back-translated with the help of experts in the field like community psychologists and assessed for its quality. They were asked to self-assess the degree to which each statement matches their perceptions. Questions 2, 4, 7, and 8 measure the sub-score perseverance of effort, and questions 1, 3, 5, and 6 measure the sub-score consistency of interest. 18 Four items require reverse scoring, and higher total scores reflect higher levels of GRIT. The possible total score is 8–40 after reverse scoring. For statistical analysis, the final score for each domain is divided into categories based on percentiles (low: ≤25th, medium or average: 25–75th, high: ≥75th). 20 Also, the mean score was taken by dividing the total score by the total number of questions, and classification was made as high for GRIT > 3.5, moderate for GRIT = 3–3.5, and low for GRIT < 3. 21 The study outcome measured was the mean score of GRIT, and predictors included age, sex, number of siblings, class of study, residential area, and other personal details like hours of study, extracurricular activities, time spent for the above, and parents’ details like education and annual income.
Statistical Analysis
The data were entered in Microsoft Excel, and analysis was done using SPSS 23 (Armonk, NY, IBM Corp). The sociodemographic details were expressed as appropriate with mean, standard deviation, frequency, and percentage. The GRIT scores with subscale scores were calculated and expressed as mean and standard deviation. Exploratory analysis of the relationship of the GRIT scores with different variables related to the students and parents was done after testing the normality of the variables by plotting a histogram and by using Shapiro-Wilk’s test. The relationship of GRIT scores with categorical variables like sex, residence type, schooling level, parents’ education, and so on, was assessed using the Independent t-test or One-way ANOVA test. Correlation analysis was done between continuous variables such as age and GRIT scores, using the Pearson correlation test. A p-value <0.05 was considered statistically significant.
Results
Sociodemographic Details
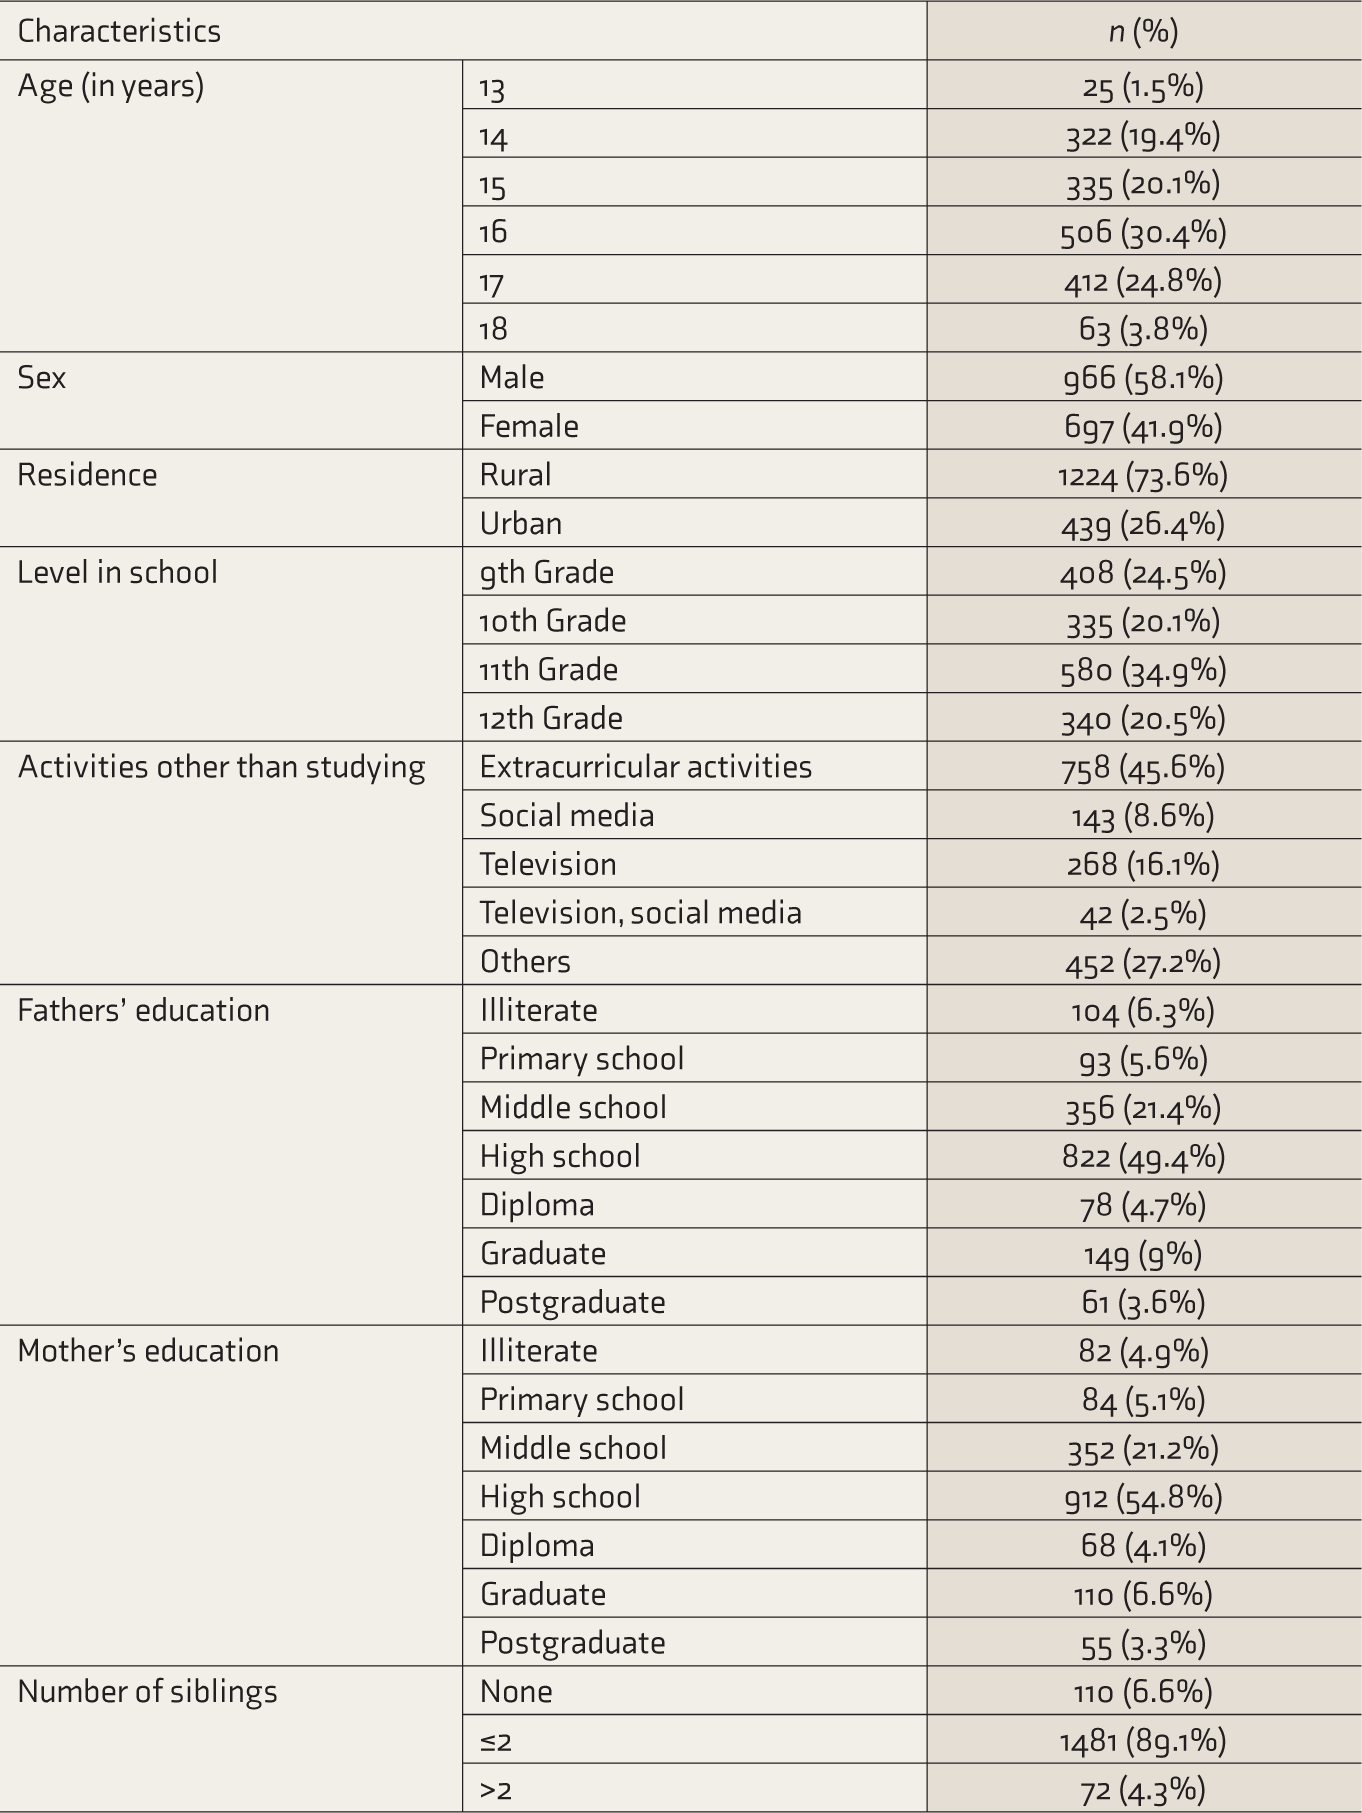
Among the 1663 participants, most were males, 966 (58.1%). Most (30.4%, n = 506) were aged 16 years, followed by 17 years (24.8%, n = 412). The mean (SD) age was 15.69 (1.19) years. The other sociodemographic details are presented in Table 1. Among the participants, 108 (6.5%) had heard of the concept GRIT.
Sociodemographic Characteristics of Participants, n = 1663.
GRIT Scores
The mean total score of GRIT was 26.65 (4.12), with a range of 14–40. Most (45.4%, n = 755) showed medium GRIT scores, 525 (31.6%) showed low scores, and 383 (23%) showed high scores. Figure 2 shows the independent question-wise response.
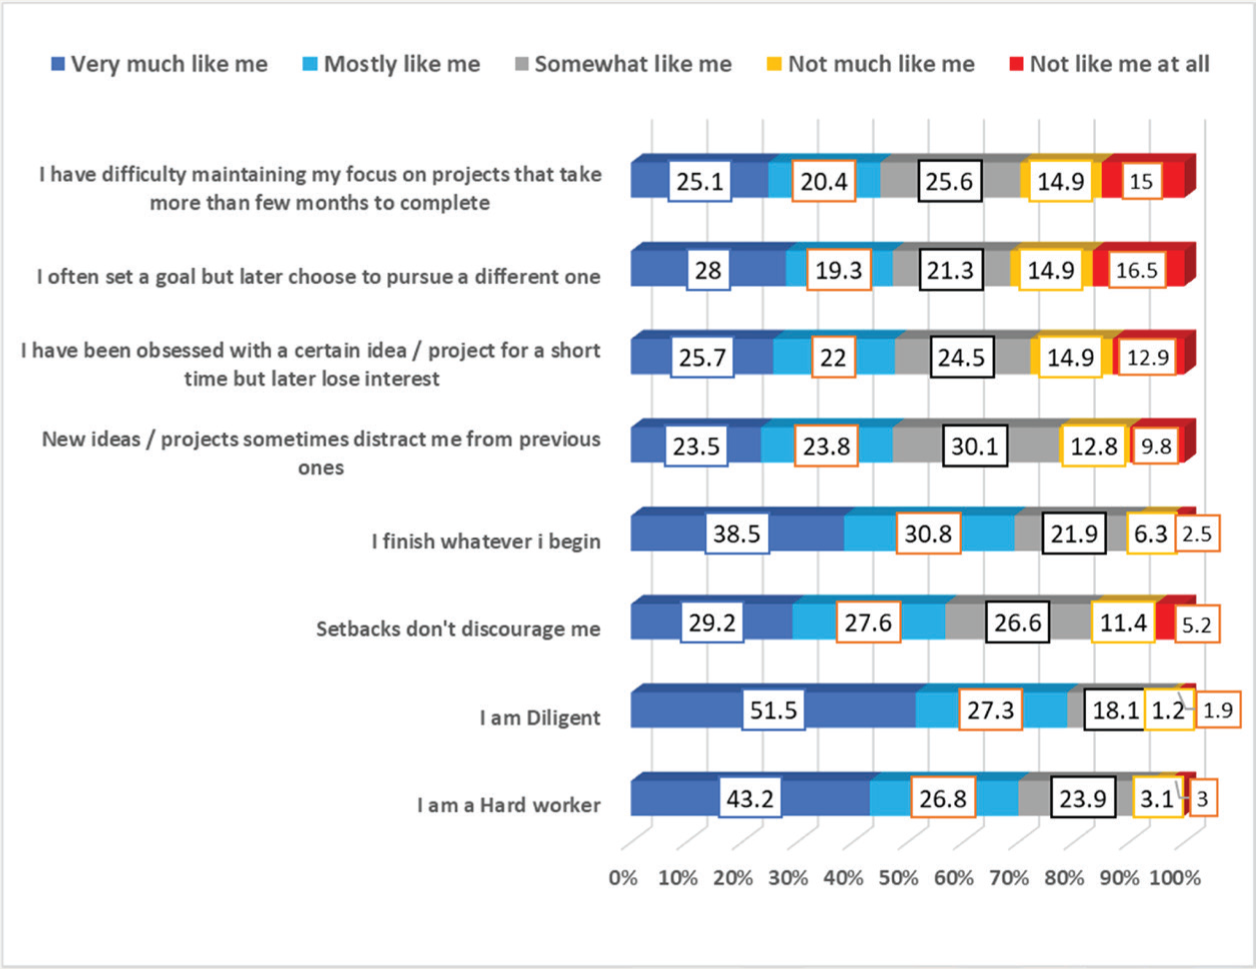
GRIT: Guts, Resilience, Integrity, and Tenacity.
The mean score of GRIT was 3.33 (0.51), with a range of 1.75–5.00. Among the students, 30.6% showed higher GRIT (>3.5), 31.6% showed lower GRIT (<3.00), and 37.8% showed moderate GRIT (3–3.5). The mean perseverance of effort subscore was 3.98 (0.63) and the consistency of interest subscore was 2.69 (0.86).
Exploratory Analysis of GRIT Score and its Subscales with Various Variables
Females had a significantly higher total GRIT score (p = 0.002, Table 2). Students in the younger grade had higher scores in both subscales. Higher perseverance of effort was seen in rural students (15.99 (2.50) vs. 15.64 (2.53), p = 0.012) while higher consistency of effort was seen in urban students (11.05 (3.42) vs. 10.64 (3.47), p = 0.03). Significantly high GRIT score was seen among subjects whose father had a postgraduate degree. In subscales, the perseverance of effort score was high among subjects whose parent education was nil or up to middle school. A higher consistency of interest score was seen among subjects whose parent had a postgraduate degree.
Association Between Sociodemographic Characteristics and GRIT Among School Students of Grades 9–12, n = 1663.
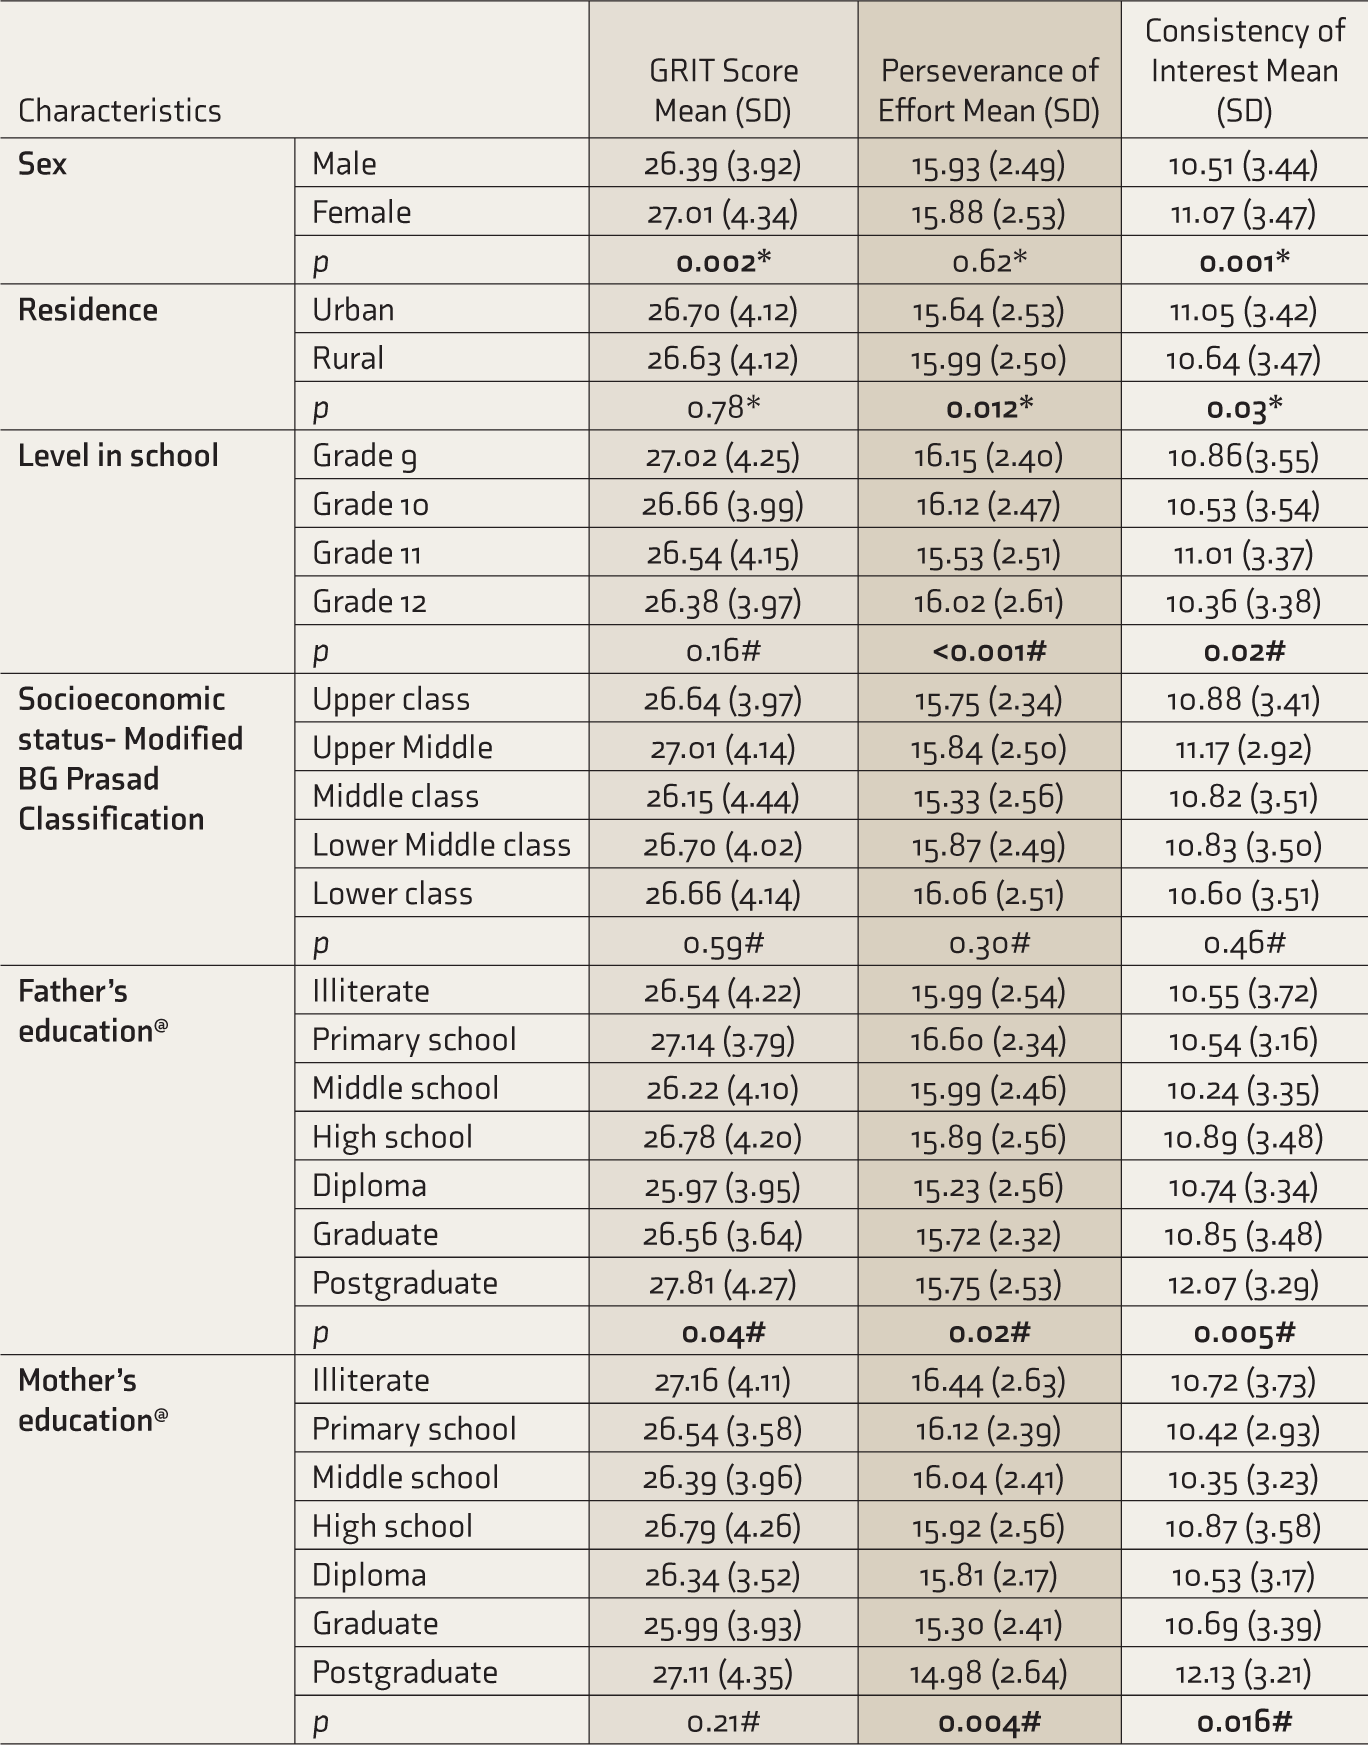
Bold p values, p < 0.05 (statistically significant). * Independent t-test. # One-way Anova test. @ Statistically significant comparisons (significant at 0.05 level) in post hoc Tukey test - Father’s education: Total GRIT; postgraduate = middle school (mean difference-1.59), perseverance of effort: primary school = diploma (1.37), consistency of interest: post-gradute = middle school (1.83), post-graduate = high school (1.18). Mother’s education: Perseverance of effort; primary school = graduate (0.82), primary school = post-graduate (1.14), consistency of interest: post gradute = middle school (1.78). GRIT: Guts, Resilience, Integrity, and Tenacity
Age had a statistically significant negative correlation with GRIT (r = −0.052, p = 0.033). Pearson correlation coefficient test was conducted to test the multicollinearity, where between overall GRIT and perseverance of effort, the collinearity was 0.55, and between overall GRIT and consistency of interest, collinearity was 0.79.
Discussion
This study aimed to assess GRIT and its associated factors among school students. Most students showed medium GRIT scores, and age, sex, and residence site influencing on GRIT.
The mean (SD) score of GRIT was 26.65 (4.12), with a range of 14–40. According to the categories, the majority of the students (45.4%) showed medium or average GRIT scores. In a study done in Thailand among school students, 57.3% showed average GRIT scores. No previous studies have compared any population’s GRIT and parenting styles. Our study showed 37.8% moderate GRIT (3–3.5) in terms of the mean score. In a study done among nursing students, 60.7% had moderate GRIT levels. 21 The variation in the proportion and mean score may be due to varied study populations, study settings, and criteria in selecting subjects.
The mean perseverance of effort subscore, 3.98 (0.63), was higher than the consistency of interest subscore, 2.69 (0.86). This supports the assumption that a person’s sub-score for persistence in effort will typically be a little higher than that for constancy in interest, further indicating that the two aspects of GRIT—passion (consistency) and perseverance—are distinct. The explanation is that while scores of both the facets increase with time, the perseverance score—which indicates that a goal has been attained—would be more meaningful compared to the consistency of interest, which suggested that deliberate planning had gone into achievement.
In our study, there is a weak negative correlation between age and GRIT and no significant correlation with age and subscores. A study among adult persons found that GRIT is positively correlated with age. 12 That study also showed GRIT was the lowest among 25–34-year-olds and highest among those ≥65years and that GRIT “grows with age and that one learns from experience that processes such as quitting plans, shifting goals, and starting over repeatedly are not good strategies for success.” In another study among college students, GRIT score had a mild positive relationship with age. 22 A study among older adults found that GRIT was stable throughout older adulthood and that it may serve as a shielding factor that supports active adaptation to the developmental challenges of aging. 23 Another study conducted in Mexico among 9th and 12th-grade children revealed that the measured consistency of interest increases with relative age (age with respect to classmates) and drops to a lesser amount with absolute age (age at measurement), whereas the measured perseverance of effort increases with absolute age but not with relative age. 24 The different findings of various studies may be due to the varied age group of study participants. The finding of negative relation with age can be explained by the fact that younger students may feel more stable in their decisions and may feel consistency of their goals for the time being. Older students have to face many different circumstances that make them inconsistent about the current goal situation. The above explanation may be applicable for both the increased perseverance of effort and consistency of interest seen in younger grade students.
We found females to be GRITtier than males. In subscale analysis, consistency of interest was more among females, and perseverance of effort showed no difference between the sexes. Chathurika et al. found that female students were more likely to score high on GRIT than male students. 25 In another study conducted experimentally to assess interpersonal and intrapersonal competition, GRIT was significantly higher among females. 26 In a study done in the United States, females had higher scores in consistency of interest over time, good study habits, and steady perseveration in pursuit of a goal. 27 In a study done in Thailand, females showed lower GRIT scores. 20 However, our finding has been contradicted by a few researchers who observed no sex difference in GRIT.12,16,22,28,29 The females have been consistent in aiming and being more self-controlled, contributing to higher GRIT. Their findings that contradict ours – the ones in favor of male sex and that of the lack of significant sex difference for GRIT – can be explained. The patriarchal nature of those societies may have led the males to be more perseverant and consistent in achieving long-term goals, thus increasing. The nil sex difference on GRIT can be due to higher age of the study group where the male–female differences cease to exist due to either achievement of goals or reach of saturation level.
There was no difference between students from urban and rural backgrounds in terms of total GRIT score, but significantly higher perseverance of effort was seen in rural students and higher consistency of interest in urban students. Both these dimensions of GRIT contribute considerably to success as the perseverance of effort enables the accomplishment of mastery despite failure, and consistency of interest is a key to a deliberate attempt to achieve mastery in that skill. Rural students persistently try to achieve academic success while urban students consistently keep their interest based on the opportunities they have in their area.30,31 Hours of study and hours spent in extracurricular activities showed no significant association with GRIT score. We found no significant association in terms of socioeconomic status, similar to a discussion done to assess the influence of socioeconomic status on GRIT. 32 In a study by Huang et al., students from higher socioeconomic status had a higher self-perception of their persistence or grittiness than students from lower socioeconomic homes. 33 The difference may be due to the varied study groups and the influence of the educational institutions from where the data was collected.
Parent’s education influenced GRIT. In post hoc analysis, differences were seen between certain subgroups. Different studies have commented variedly about the influence of parent’s education on GRIT, as the age group of study subjects differs, the influence either weaned off or had nil significance.34,35 The perseverance of effort that a person maintains constant effort in the face of hurdles may be more pronounced for those students whose parents have less education since they also belong to a lower socioeconomic level where they encounter numerous difficulties. The people with less education wish to acquire something for themselves or for their family and begin the process of aiming to enhance their current situation even with any obstacles. The consistency of interest where subjects are keeping consistent interest and maintain the passion for longer time may be more common among those whose parents had higher educational levels, which in turn are associated with higher economic levels. As a result, these subjects can consistently have resources and support (mental, economic, and social) to sustain the attention for a long time.
Further studies assessing other social factors like parents, peers, school, and finance against GRIT should be promoted. Longitudinal and retrospective studies should be conducted to assess the influence of extracurricular activities on the development and sustainment of GRIT. Future studies on GRIT can be done with mixed methodology using qualitative techniques to collect granular data, amalgamate the trends, and thus cater to school-level activities.
Limitations
First, the study was conducted only in private schools, and the data may not be generalizable to government schools. Second, the questionnaire used was a self-report questionnaire, so social desirability bias is possible. Another limitation is the non-inclusion of other confounding behavioral factors like the assessment of self-esteem, emotional intelligence, and parent-, peer-, and school-related factors.
Conclusion
This study aimed to assess GRIT and its associated factors among mid-adolescent school students. Most of the students had average or medium GRIT scores. The study showed higher GRIT scores among females and a smaller negative correlation with age. The rural students showed higher perseverance of effort, and the urban students showed higher consistency of interest. The perseverance was higher among subjects who had parents with lower levels of education and higher consistency was noted with those with parents who had higher education levels. The concept of GRIT is a new area in the field of education, so its development is important for future generations and should be included in trainer’s curricula. To enhance productivity, adolescents should be reminded that participation in particular activities might increase GRIT.
Footnotes
Declaration of Conflicting Interests
The authors declared no potential conflicts of interest with respect to the research, authorship, and/or publication of this article.
Funding
The authors received no financial support for the research, authorship and/or publication of this article.