
Abstract
Background:
The Empathic Accuracy Task (EAT) is an objective measure to assess empathic accuracy. Due to the variability in the number and linked emotions of the narrated events, we adapted EAT for the Indian sociocultural setting as Indian EAT (I-EAT).
Methods:
Eight videos were adapted in three languages (English, Hindi, and Kannada), narrating emotional events with a uniform representation of age groups, different emotions, and sex. The adapted I-EAT was then validated by cross-sectional comparison with different tests similar to EAT and those that assessed concepts different from or similar to empathy, in 29 healthy young adults, 23 healthy older adults (aged ≥60 years) along with clinical groups of 15 young people with depression, 15 older people with depression, and 15 young people with schizophrenia.
Results:
We selected eight videos with good content validity and internal consistency (Cronbach’s alpha = 0.73. We obtained satisfactory concurrent validity of the EAT scores with the self-reported empathic assessments using the Questionnaire of Cognitive and Affective Empathy (Cognitive empathy score = 0.29, p = .034; Total score = 0.29, p = .035) and Interpersonal Reactivity Index (Empathic concern score = 0.45, p = .001). Good divergent validity was revealed in the high inverse correlation recorded with the Apathy Evaluation Scale ( = –0.67, p < .001). I-EAT did not correlate significantly with measures of social cognition. Known-groups validity was adequate in young adults with the significantly lower EAT scores (Cohen’s d: 0.77 to 1.15) in the Schizophrenia group and higher EAT-N scores (Cohen’s d: 0.51) in the Depression group, compared to the Healthy group. The Healthy group of the geriatric population also achieved significantly higher EAT scores (Cohen’s d: 0.71 to 0.85) than the Depression group.
Conclusion:
With a good validity and internal consistency, I-EAT can be used in the Indian population to assess empathic accuracy without compromising performance of the original EAT.
1. Indian adaptation of Empathic Accuracy Task, I-EAT, was adapted in English, Hindi and Kannada 2. Achieved satisfactory internal consistency and was validated for young and old adults 3. Good concurrent validity with cognitive empathy part of subjective empathy questionnaires 4. Known group validity achieved with two psychiatric disorders, depression and schizophrenia 5. Inverse correlation with Apathy Evaluation Scale provided divergent validityKey Messages:
Empathy is defined as the recognition and understanding of the emotional state of another person, along with the affective experience, by oneself, of the inferred emotional state. 1 The former component is called cognitive empathy (CE), and the latter component is called affective or emotional empathy (AE).1,2 The consensus on the boundaries of this complex emotional phenomenon is moderate. It becomes restricted to one among the concepts of ‘theory of mind’ and ‘perspective taking’ 3 or is expanded to include the sympathy and prosocial behavior. 4
Due to its centeredness on emotion, dysfunction in empathy has been considered in various psychiatric illnesses. 5 Under DSM-5, it forms an essential criterion for the diagnosis of personality disorders, neurocognitive disorders, and conduct disorders. 6 Furthermore, patients with schizophrenia and related disorders have a lower CE but similar AE compared to healthy adults.7,8 In autism spectrum disorders, AE appears to be impaired, 9 though the recent evidence also supports CE impairments in them.10,11 Though some research on depression had shown a lower CE 12 and a higher AE,12–14 a couple of studies had demonstrated a higher CE too.13,15
Therefore, empathy must be assessed precisely to the best extent. However, its assessment has been influenced by the issues related to its definition. Scales adapted in earlier times, such as Interpersonal Reactivity Index (IRI), 16 Balanced Emotional Empathy Scale, 17 Questionnaire of Emotional Empathy, 18 are more away from the current concept of empathy than recent ones, Questionnaire of Affective and Cognitive Empathy, 3 Basic Empathy Scale, 19 Affective and Cognitive measure of Empathy. 20 However, many of these measure empathy through self-reports. Two recent meta-analyses consistently found that these self- reporting scales could account for <1% of the variance in the behavioral scales and were prone to bias in validly assessing self-empathic ability.21,22 The objective behavioral scales assess empathy in many ways. They involve basic emotion recognition tasks or may ask questions in detail about thoughts, emotions, and relationships. Capturing the individual’s ability to track others’ emotions over a period of time provides the best estimate of CE and is referred to as Empathic Accuracy (EA).23,24 This can be assessed by the Empathic Accuracy Task (EAT), where the Perceiver, whose EA is to be measured, is shown a series of video clips of another person (target) describing a life event.8,25
After Zaki et al. 25 proposed the EAT, many studies have utilized this paradigm to assess EA.8,23,26–29 However, they had introduced variations such as incorporation of negative emotions beyond sadness23,29 and in the number of video clips (12 to 40) and duration of the videos (28 to 158 seconds), limiting the reproducibility and validity of their findings. Most of these studies had limited validation for these adaptations in accordance with the recommendations for validation of an adapted scale.30–32 Considering the possible effect of expressivity on EA8,25,26 and the influence of culture on communication and understanding, 33 cultural relevance is needed between Perceiver, target, and events narrated.34,35 Furthermore, cultural aspects can vary with different age groups. 36 Besides, previous studies usually included young adults (20–40 years) as targets, excluding older adults.23,28,37,38 Hence, this study was planned to adapt the EAT paradigm to Indian culture and languages for both young adults and older adults and test its feasibility and validity.
Materials and Methods
The study was conducted in Department of Psychiatry, National Institute of Mental Health and Neurosciences (NIMHANS), Bengaluru, India. We present the methods in two phases. The first was the Adaptation phase, which included the adaptation of the Indian Empathic Accuracy Tool (I-EAT) and the demonstration of its content validity. The second was the Validity phase, where concurrent, construct, and known-groups validity of the adapted tool were examined. After receiving approval from the Institute Ethics Committee, the adaptation phase was carried out from May 2018 to January 2019. This was followed by data collection for the validity phase from February 2019 to February 2020.
Adaptation Phase
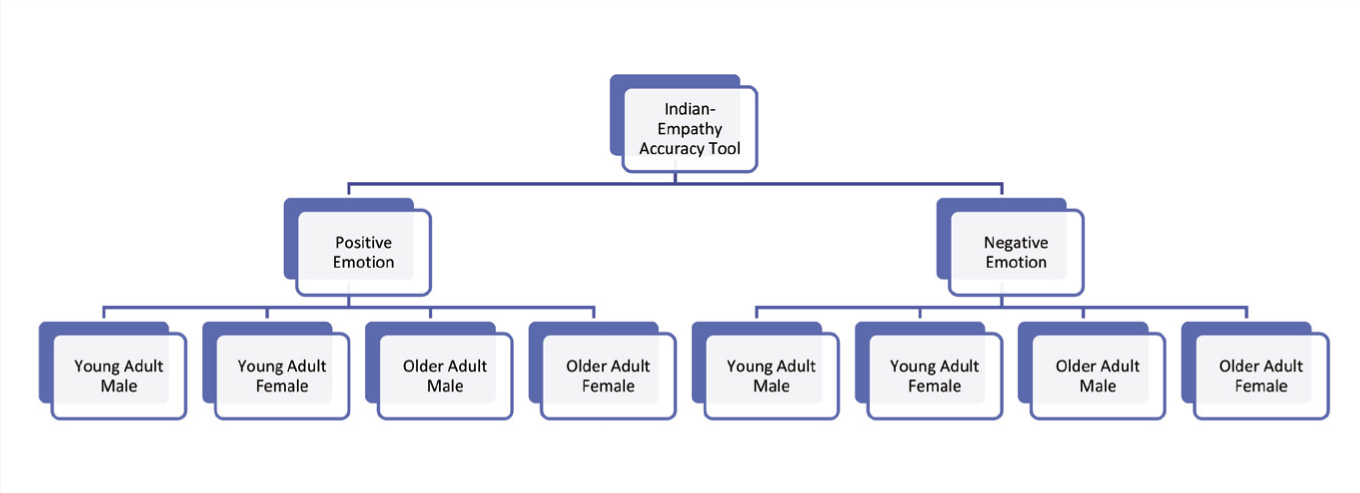
During this phase, we adapted I-EAT from the original EAT. 25 The adaptation was done simultaneously in three languages: English and Hindi (two official languages of the Government of India) 39 and Kannada (the official language of the Karnataka, India). We kept eight narrative videos, each lasting 60–120 seconds. Four videos represented positive emotions, and the remaining four represented negative emotions; each group had an equal representation of the sex and two age groups (young adults under 60 years of age, older adults ≥60 years of age) (Figure 1).
Distribution of Videos in the Indian Empathy Accuracy Tool.
Participants as Targets
People whose narrated videos were used for the administration of I-EAT were called Target. The Targets were first asked to narrate any mildly emotional life event. If the expressivity level appeared reasonable, the relevant emotional events were asked, along with their overall rating of emotion for the event. Based on this information, they were asked to narrate the emotional life events they were comfortable describing. The narration of the positive life event was recorded first, followed by the negative events. Usually, the first recording was selected. In a few cases, a retake was carried out if the first recording seemed inadequate. The Target was explained in detail about the concept and process of the administration of this tool and the purpose of these videos. No effort was made to evoke the emotion in the Target so that the narration appears natural.
We recruited a total of 22 volunteers (mean ± standard deviation [SD] age = 45.68 ± 19.98 years; M:F = 11:11) as Targets after obtaining informed consent, including the confidentiality aspects of the narrated personal life events. They were selected from the institute staff or relatives of patients admitted under the Department of Psychiatry after clinically screening for any psychiatric or neurocognitive disorders. Ten of them were older adults, and 12 were young adults. They were fluent in at least one of the three languages in which I-EAT was adapted. Eight Targets recorded the narration in more than one language. Each Target narrated one or more sets of two personal events, one of which represented a negative emotion and the other, a positive emotion. The Targets then watched their own videos and continuously rated the emotion from beginning to end, while watching themselves narrating the said event. The rating was performed using a 10-point Likert scale within a computer-based application. The scores ranged from 1 (least intense positive/negative emotion) to 10 (most intense positive/negative emotion). These ratings were saved as Target ratings.
Content Validity
A total of 64 videos of the targets were recorded. Then, three experts were asked to rate all the videos independently for their ability to evoke an empathic response to the said emotion appropriately and suitability to Indian culture and both age groups. The rating was carried out on a Likert scale of 1 to 5, from ‘very poor’ to ‘very good’. Videos that received a rating of ≥3 by at least three of the five evaluators were selected. These experts were mental health professionals with postdoctoral experience of >10 years in their field. The experts did not rate the emotional state of the target during the video. Therefore, they were not involved in this study as the Perceivers (described below).
Validation Phase
I-EAT was evaluated for three main types of validity separately for the young adults and Geriatric groups, as described below. Data were collected cross-sectionally for both groups. The description of the scales used during the validation is given in the supplementary file (for the online version only).
Reliability: Overall internal consistency was calculated with Cronbach’s alpha, and split-half reliability was tested with the Guttman Level 4 reliability coefficient.
Concurrent validity: Here, the I-EAT score of healthy participants was compared with their scores on two commonly used standard measures of subjective empathy, the IRI 16 and the Questionnaire of Cognitive and Affective Empathy (QCAE). 3 Considering that the correlation among different measures of empathy is still an area of research in the population with different psychiatric disorders, we did not perform concurrent validity in participants with depression or schizophrenia.
Construct validity: It was determined by assessing the convergent and divergent validity in healthy samples.
Convergent validity: It was determined by comparing the I-EAT score of healthy participants with their measures of social cognition. 40 Measures of social cognition used were the Social Cognition Rating Tool in Indian Setting (SOCRATIS) 41 and the Tool for Recognizing Emotions in Neuropsychiatric Disorders (TRENDS). 42
Divergent validity: It was determined by comparing the I-EAT score of healthy participants with their measure of apathy, the Clinician-rated version of the Apathy Evaluation Scale (AES-C). 43 Empathy is inversely associated with apathy in the normal population. 44
The relationship between EA, social cognition, and apathy is not properly understood in those with depressive disorder or schizophrenia. Hence, we avoided these populations for construct validity.
Known-groups validity: This was assessed by examining the ability of I-EAT to differentiate between Schizophrenia, Depression, and Healthy groups of participants through its scores. In older adults, only Depression and Healthy groups were considered.
Administration of I-EAT
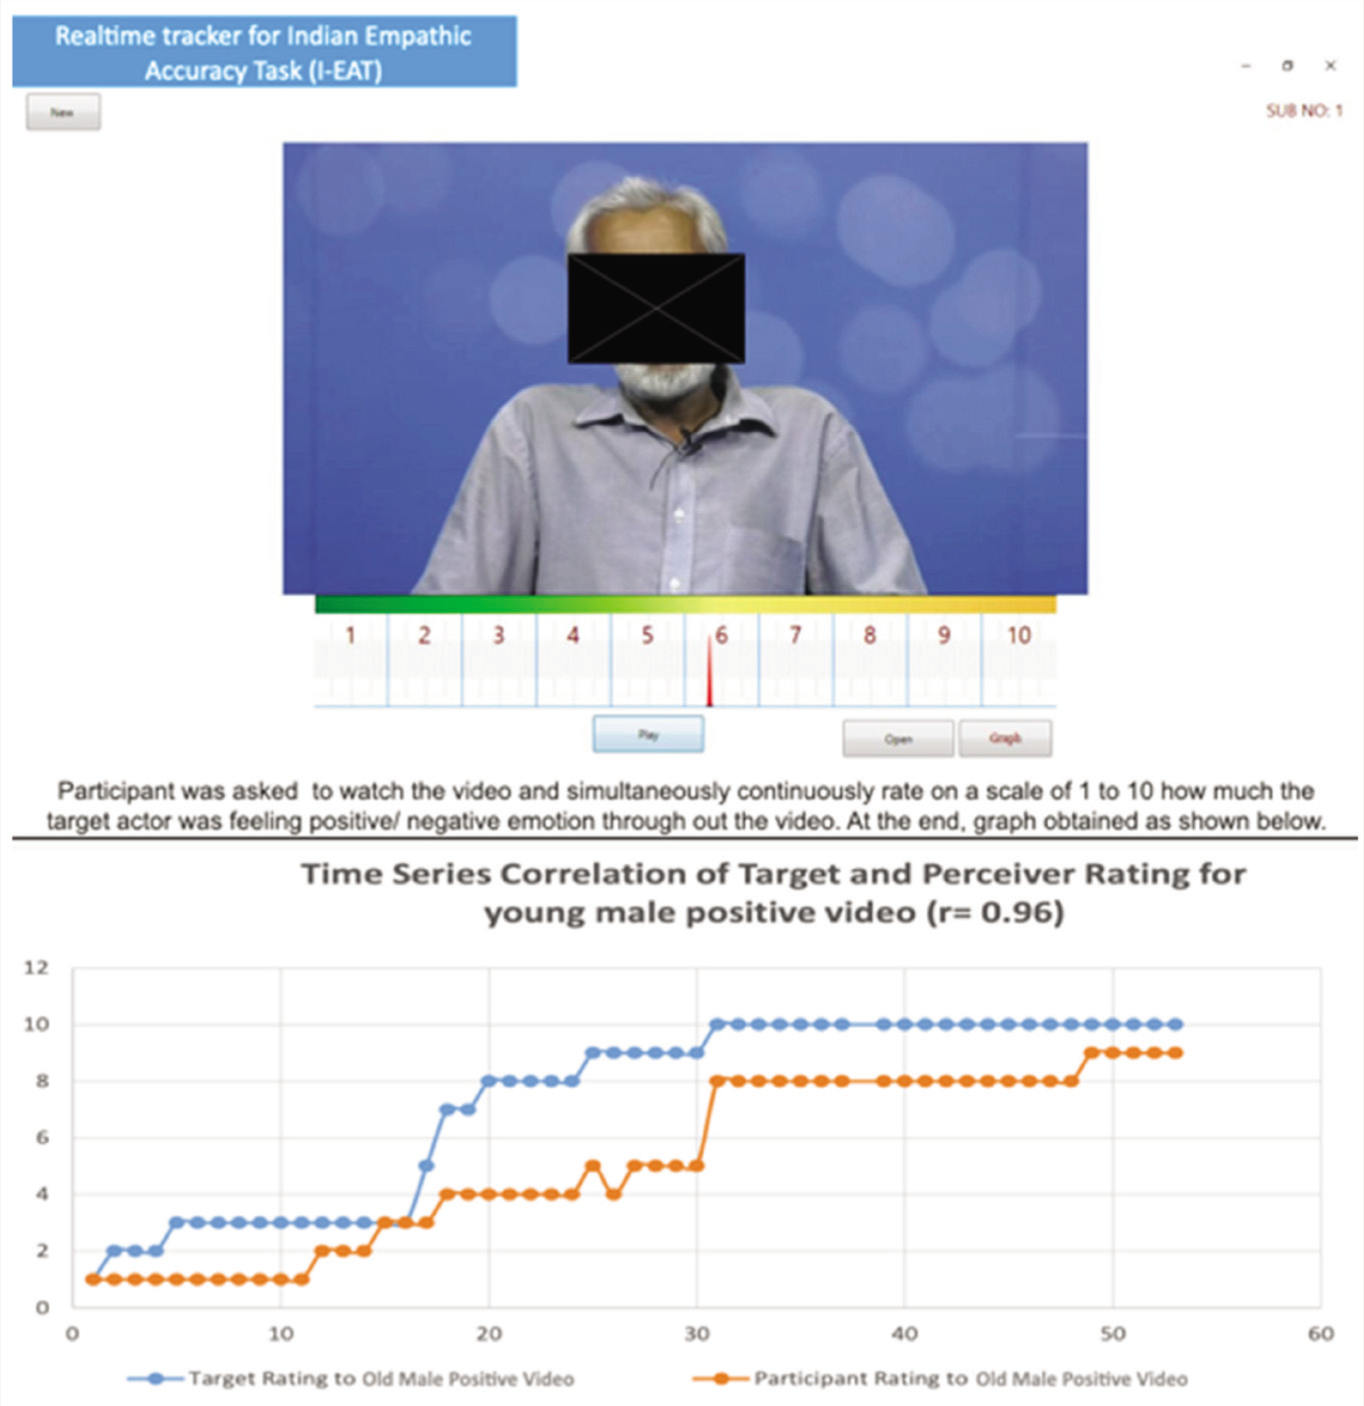
During the validation phase, the tool was administered to another set of participants to assess the level of their EA. They were called Perceiver, that is, the person whose EA is measured with the tool I-EAT. The Perceiver is distinguished from the Target. The Perceiver would watch all eight videos consecutively, with a break of 2 min after every video to refresh their mind. While watching the video, the Perceiver would continuously rate the severity of the emotion, as it would have been felt by the Target throughout the narration in the same computer-based application (Figure 2). The application would then calculate the degree of correlation (Spearman’s r) between the existing Target’s self-emotion rating and the Perceiver’s rating of the Target’s emotions and save the correlation value as the Perceiver’s EA score for the respective video. The Perceiver’s EA score for the eight videos would be similarly obtained, and the average of the eight individual EA scores would be considered as the final EAT score of the Perceiver. The total time to complete the administration is expected to be 30–35 min. Detailed instructions for administering the tool are mentioned in the online-only Appendix A.
Realtime Tracker Showing the Process of Indian Empathic Accuracy Task (I-EAT).
Participants as Perceivers
A total of 29 young adults and 23 older adults were recruited into the Healthy control groups. Fifteen young people with depression, 15 older people with depression, and 15 young people with schizophrenia were taken for the clinical groups. Participants in these clinical groups were recruited from the psychiatric wards of a tertiary care hospital in India. The Depression group had a diagnosis of moderate or severe depression (ICD-10 F32.1 to F32.3/F33.1 to F33.3), with a score of ≥17 on the Hamilton Depression Rating Scale (HDRS). 45 The Schizophrenia group had the diagnosis of schizophrenia according to ICD-10 (F20.0 to F20.9). The severity of schizophrenia was evaluated using the Positive and Negative Syndrome Scale (PANSS). 46 All participants were screened for psychiatric disorders using the Mini International Neuropsychiatric Interview. 47 Subjects with a history of or clinically determined uncorrected visual/hearing impairment, diagnosis of dementia or other neurodegenerative disorders, mental retardation, and comorbid dependence on substances (except nicotine) or other psychiatric disorders were excluded from the study.
Statistical Analysis
Sociodemographic and Clinical Variables
All data were tested with the Shapiro–Wilk test for the normality of distribution. 48 One-way analysis of variance (ANOVA) was performed for all continuous, normally distributed variables when the number of comparing groups was >2. Among them, where the data were heteroskedastic (significant Levene’s test), Welch’s ANOVA was performed to adjust the F value. Following significant ANOVA results, the Bonferroni post hoc test was used for homoscedastic data, and the Games–Howell post hoc test was used for heteroscedastic data. The independent sample t-test was performed for continuous variables when there were two comparing groups. Variables that had a nonnormal distribution were analyzed with the Mann–Whitney U test. Pearson’s chi-square analysis was used for categorical variables. The measure of effect size was Cohen’s d. In the clinical groups, we also examined the association between EAT scores and the severity of symptoms using a correlation analysis. Pearson or Spearman was used based on the distribution of data.
EAT Scores and Other Measures of Empathy and Related Constructs
Results
Description of Perceiver Groups: Sociodemographic Profile, EAT Scores, and Clinical Ratings
The distribution of sociodemographic characteristics and EAT scores of the two Healthy groups and the three clinical groups is shown in Table 1. In general, the male and female ratio was equal, and the majority were of urban background, married, and employed. The mean (SD) PANSS Total score for the Schizophrenia group was 48.40 (16.26). For the subcategories, the mean values were as follows—PANSS Positive: 11.07 (5.52), PANSS Negative: 12.87 (6.09), and PANSS General: 24.47 (7.06). None of these scores was correlated with any EAT score. Among the Depression groups, the mean HDRS score was 24.00 (5.17) for the Young Depressed group and 20.47 (4.95) for the Geriatric Depressed group. HDRS was negatively correlated (ρ = –0.41; p = .026) with the negative EAT score for the combined group of Depression (Young and Geriatric).
Sociodemographic Profile and EAT Scores of the Five Groups.
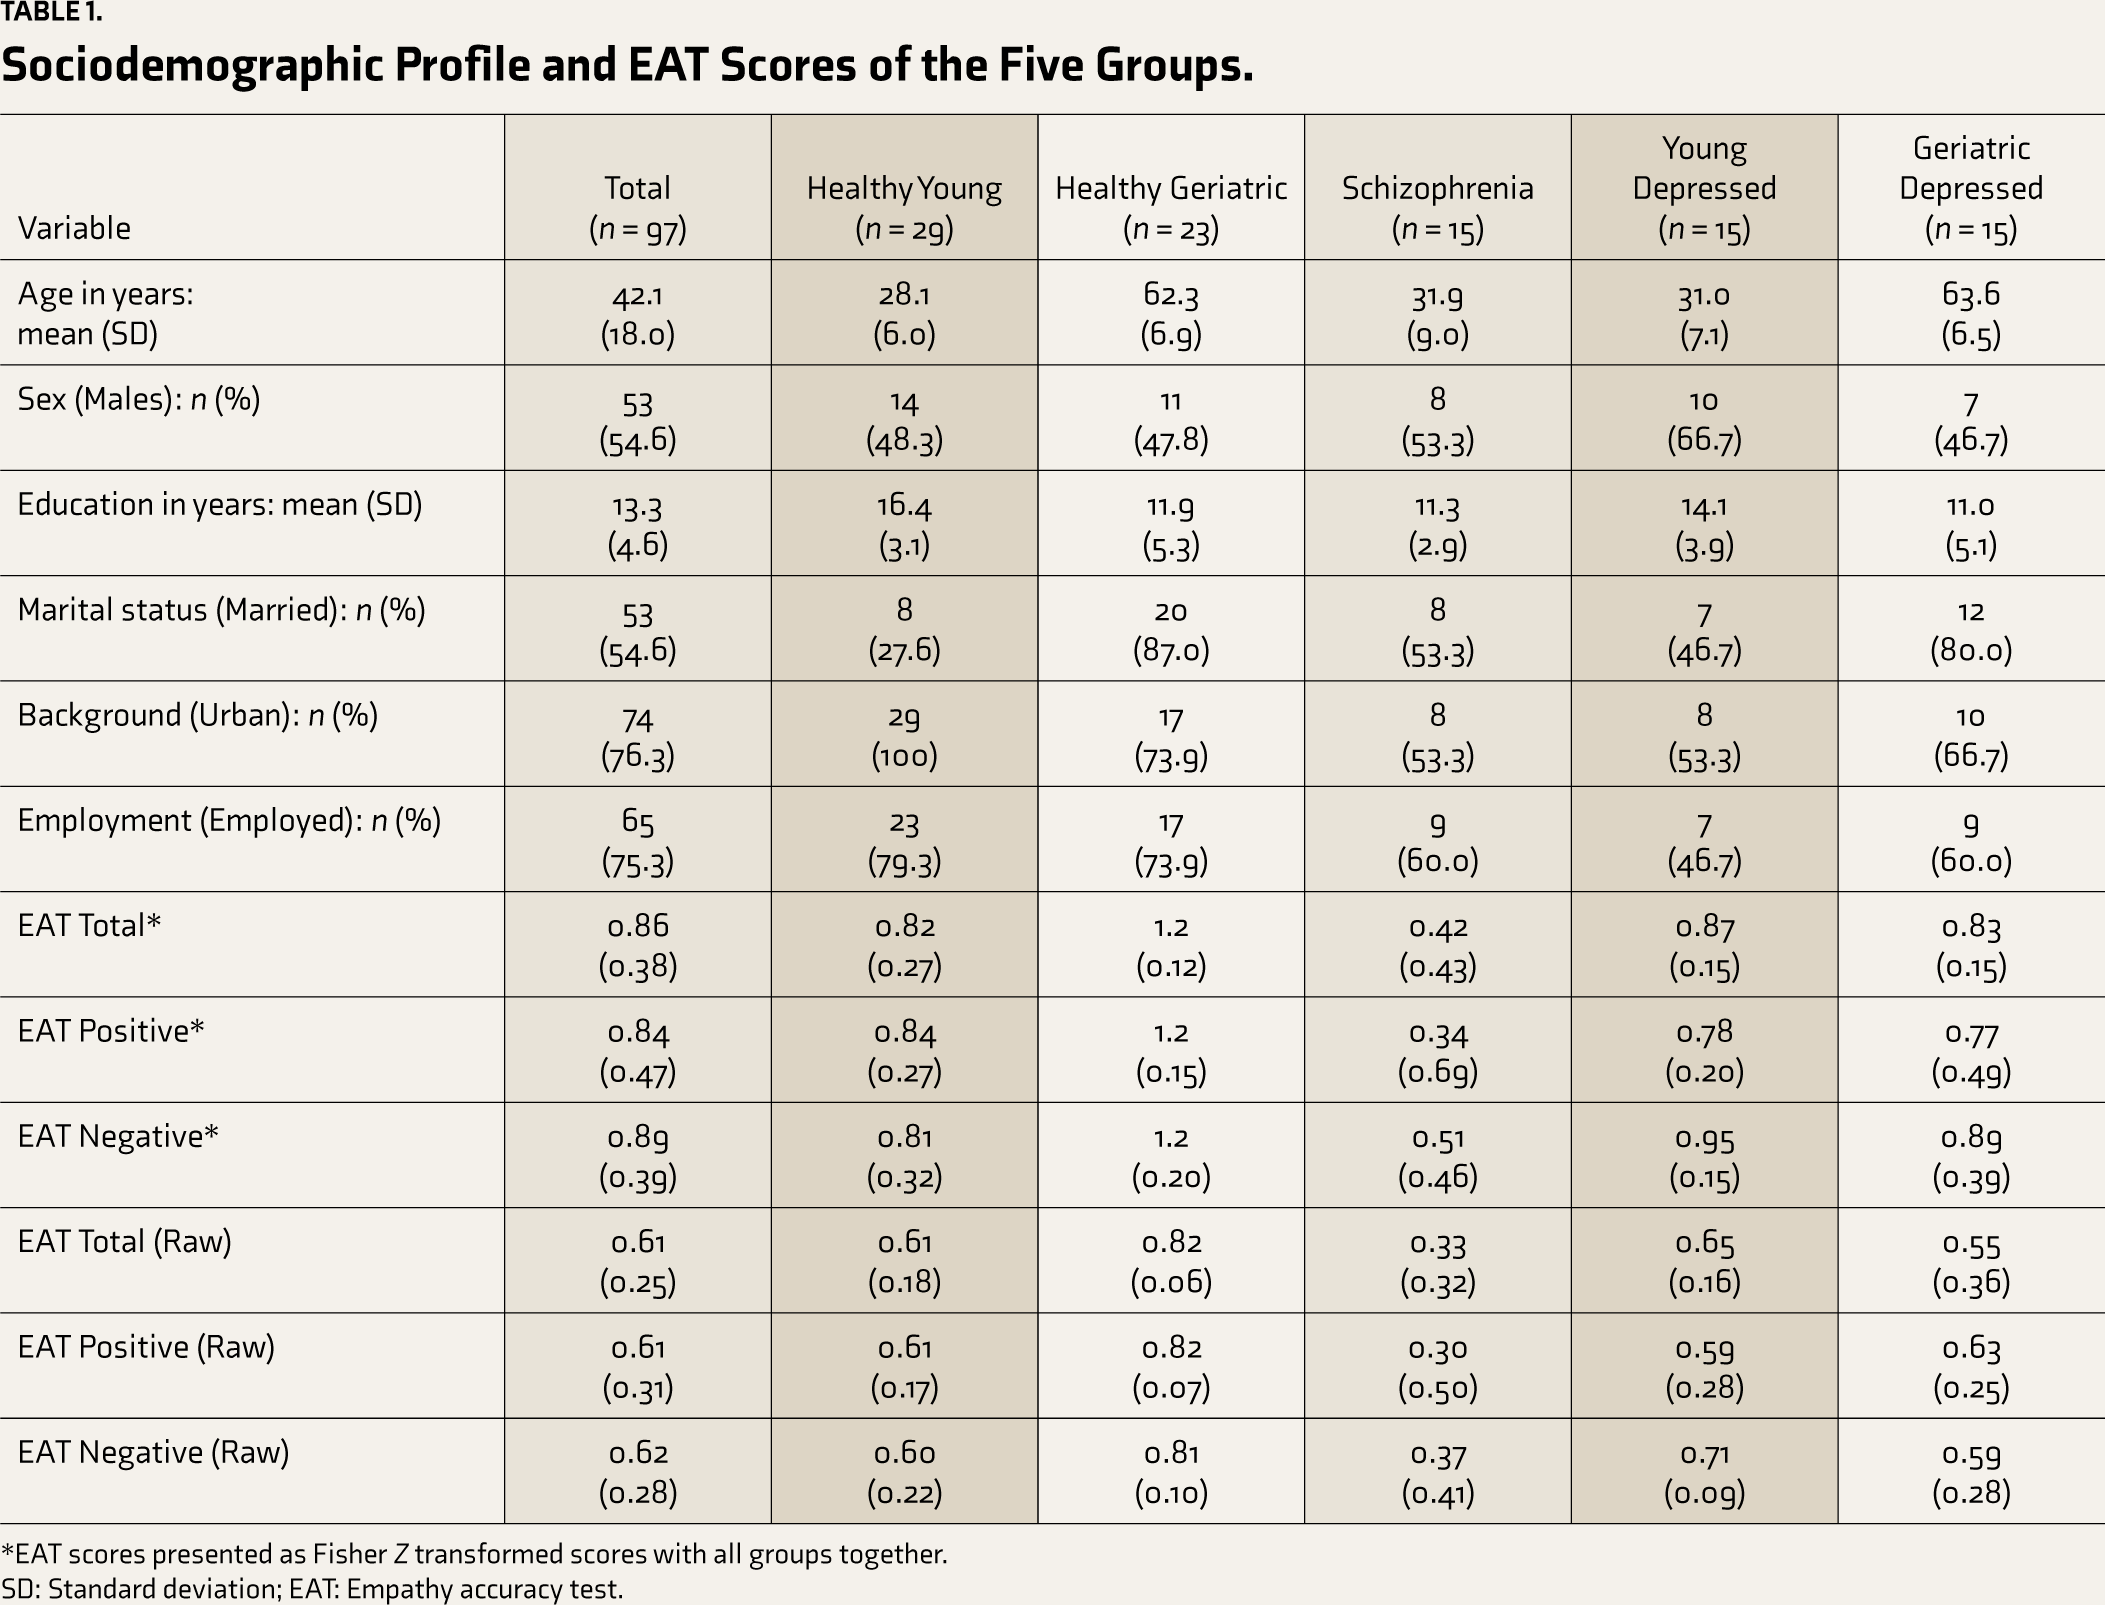
*EAT scores presented as Fisher Z transformed scores with all groups together.
SD: Standard deviation; EAT: Empathy accuracy test.
Reliability Measures
On evaluating the internal consistency of all eight videos of I-EAT, we got Cronbach’s alpha of 0.73. The Guttman split-half reliability coefficient was 0.84 when splitting the negative emotion videos from the positive ones.
Distribution of and Association with Other Measures of Empathy and Related Constructs
Other measures of empathy and related constructs were administered to only Healthy Perceivers (Table S1). A higher level of empathy was found in the Healthy Geriatric population than in the Healthy Young group for all QCAE scores. The Healthy Geriatric group also had a lower level of apathy in AES than Healthy Young. All of these differences were statistically significant. In the IRI test, only the empathic concern score was significantly higher in the Healthy Geriatric group compared to the Healthy Young group. The distribution of different scores under SOCRATIS and TRENDS is shown in Table S2. The Healthy Young group achieved statistically significantly higher TRENDS scores than the Healthy Geriatric group. Both groups performed similarly in the rest of the aspects of social cognition.
Correlations of EAT with Other Measures of Empathy and Related Constructs
Correlation coefficients among the different EAT scores ranged from 0.583 to 0.891 (p < .001). The highest correlation was between EAT Total and EAT Negative. The three EAT scores were negatively (–0.5 to –0.67) and significantly (p < .001) correlated with the AES score. EAT positively correlated with all three QCAE scores, while we did not find a significant correlation between EAT negative and any QCAE scores. EAT Total score correlated with total and cognitive scores of QCAE. In IRI, the three EAT scores correlated only with empathic concern. Here, EAT Positive had a maximum correlation of 0.49 (p < .001). EAT Total also negatively correlated with TRENDS. None of the EAT scores was significantly correlated with the score of any SOCRATIS section (Table 2).
Correlations of EAT with Other Measures of Empathy and Related Constructs in Healthy Participants.
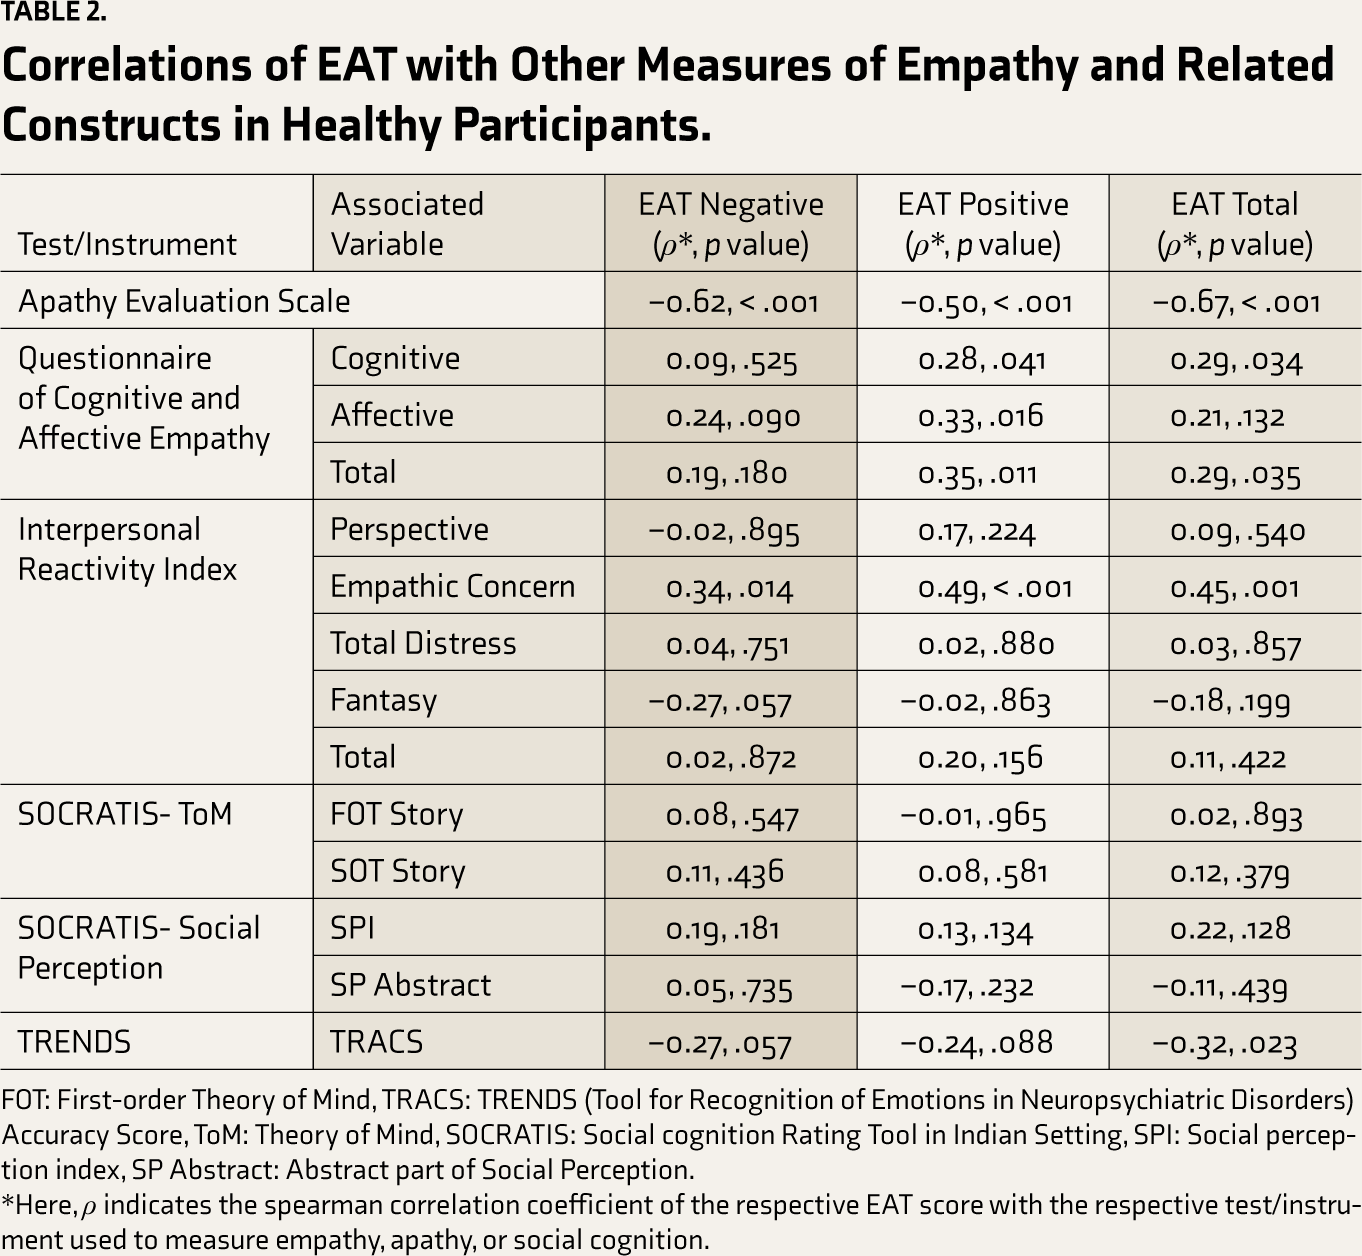
FOT: First-order Theory of Mind, TRACS: TRENDS (Tool for Recognition of Emotions in Neuropsychiatric Disorders) Accuracy Score, ToM: Theory of Mind, SOCRATIS: Social cognition Rating Tool in Indian Setting, SPI: Social perception index, SP Abstract: Abstract part of Social Perception.
*Here, ρ indicates the spearman correlation coefficient of the respective EAT score with the respective test/instrument used to measure empathy, apathy, or social cognition.
Known-groups Validity
Young Groups
A one-way ANOVA of individual sociodemographic variables showed a significant difference for age (F = 5.14, p = .028) and education (F = 12.24, p < .001). Post hoc Bonferroni comparison was significant for years of education between the Healthy Control and Schizophrenia groups (standardized mean difference = 5.60, p = .018). In the young adults group, on the chi-square test, there were no significant differences in sex, marital status, or employment.
In ANCOVA, with education as a covariate and group as a fixed factor, the effect of education was insignificant for all EAT scores. The group emerged as a significant factor for EAT Total, EAT Positive, and EAT Negative. In the Games–Howell post hoc analysis for ANOVA, all EAT scores could differentiate the Schizophrenia group from the Healthy group and the Depression group (Table 3). However, the difference between the Healthy group and the Depression group was significant for EAT Negative only. The effect size was maximum for the comparison between the Depression group and the Schizophrenia group in the young population.
Comparison of EAT Scores Among the Three Young Adult Groups.
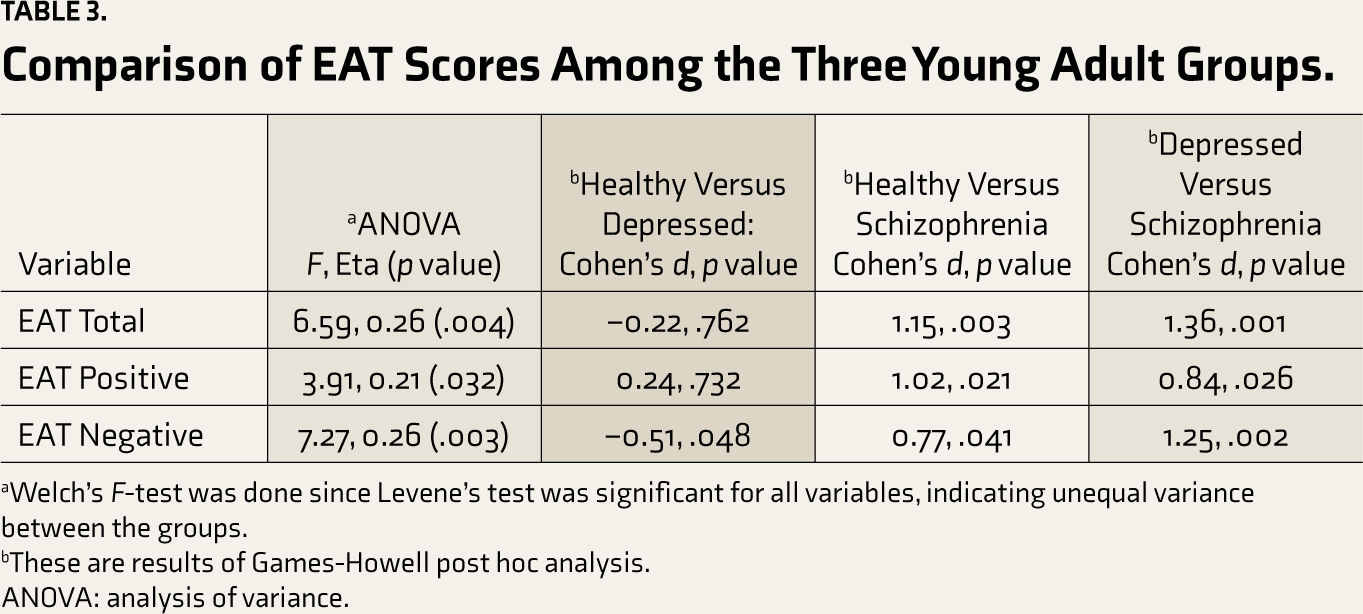
aWelch’s F-test was done since Levene’s test was significant for all variables, indicating unequal variance between the groups.
bThese are results of Games-Howell post hoc analysis.
ANOVA: analysis of variance.
Geriatric Groups
No significant differences in any sociodemographic factor were observed between Healthy and Depressed older adults. For the three EAT scores, the Healthy group had significantly higher values than the Depression group on the t-test (Table 1). The effect size was 0.85 (t = 4.25, p = .003) for EAT Total, 0.77 (t = 4.13, p = .003) for EAT Positive, and 0.71 (t = 3.32, p = .009) for EAT Negative scores.
Healthy Groups
The two Healthy age groups did not differ in sex or employment ratios. Years of education were significantly more (p = .001, Cohen’s d = 1.05, t = 3.655) in the Healthy Young group than in the Healthy Geriatric group (Table 1). Married participants had a higher share in the Geriatric group than in the Young group in the chi-square analysis (chi square = 18.2, p = .001). ANCOVA ruled out the effect of education and marital status on any of the EAT scores. All EAT scores were strikingly higher in the Healthy Geriatric group than in the Healthy Young group; EAT Negative as partial η2 = 0.40, p = .001, EAT Positive as partial η2 = 0.43, p = .001, and EAT Total as partial η2 = 0.48, p =< .001.
Mixed-model Analysis
In the mixed model analysis, the participant group was a significant factor with random effect. The restricted log-likelihood ratio was 1262.62, with ICC = 0.25 (p = .039). None of the participant parameters (age, sex, and education) that were placed as covariates was significant. In general, participants had higher EAT scores for the female targets than male. Among various groups of participants, the EAT score of both Geriatric groups was higher for older targets than younger targets (Table 4). On the contrary, the Young Schizophrenia group recorded higher scores for videos narrated by the young aged targets. This group also performed better with videos that depicted negative emotions. On the other hand, the Young Healthy group had a higher EAT score with videos that depicted positive emotions.
Estimates of Fixed Effects of Different Parameters of Target on EAT Scores.
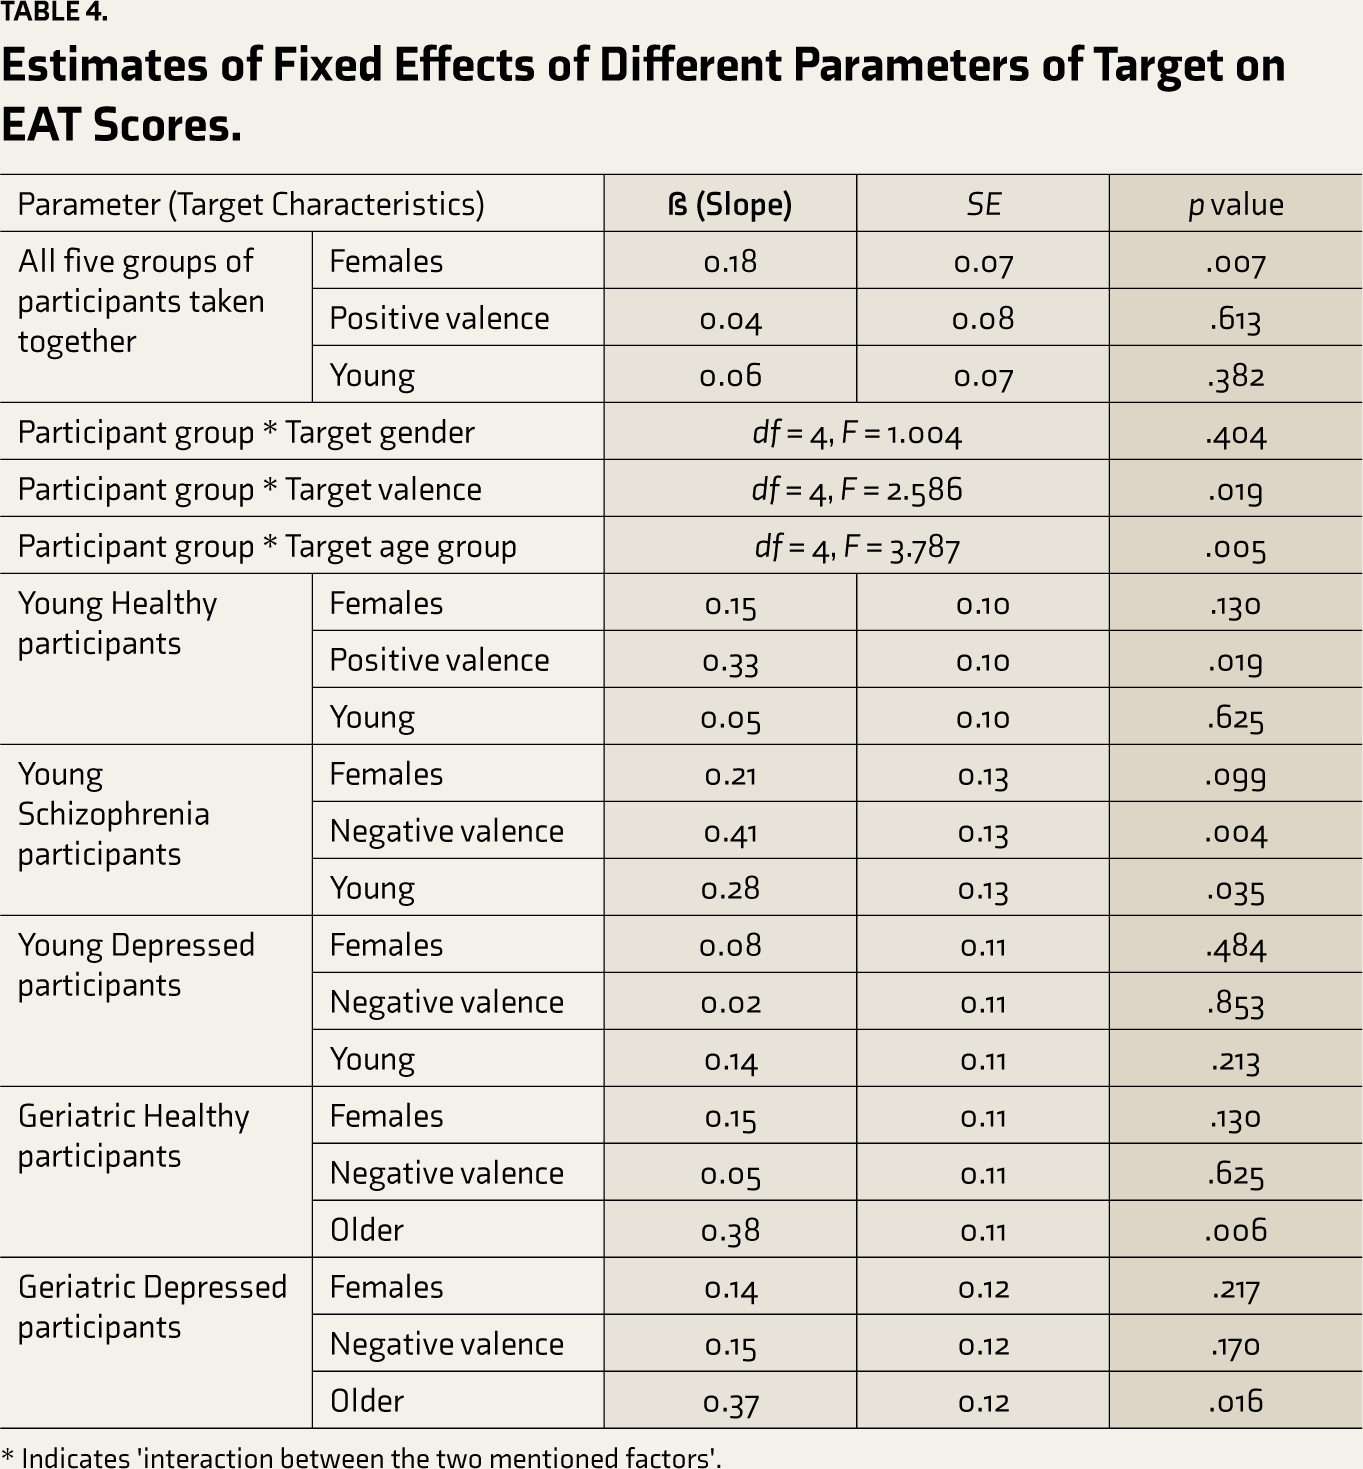
* Indicates 'interaction between the two mentioned factors'.
Discussion
Adaptation of EAT to Indian Culture and Different Age Groups: Content Validity and Internal Consistency
Empathy is an important psychological component and a quite a complex part of human expression. EAT can objectively capture and assess CE. 25 The cultural characteristics of countries such as India are distinct from those of western countries and play a role in expressing mental health, empathy, and social cognition.49–51 We could adapt EAT appropriately to Indian culture without compromising its ability to measure EA. These videos were selected after experts approved their suitability for culture and empathic content. The fact that we used videos recorded in English and Hindi, the official languages of India, and Kannada, the regional language of Karnataka, India, confirms the language compatibility of EAT and indicates that it can be comfortably translated to other regional languages of India.
Our mean raw EAT score (0.61) was also comparable to that of the original EAT study (mean = 0.47). As in the original EAT and previous adaptations, in I-EAT, we also kept an equal proportion of videos with positive and negative emotions. 25 The high split-half reliability coefficient for I-EAT with grouping based on emotion further confirms the significance of valence for empathy accuracy assessment. We preferred 1 to 10, instead of the range of 0 to 9, to rate emotion on the 10-point Likert scale, to simplify the rating for the participant. Although the original EAT had a total of 40 videos, we kept only 8. This is the minimum number we could consider representing sex, age groups, and the valence of emotions. The Cronbach’s alpha coefficient of >7 indicates good internal consistency among all eight videos. The reduced number of videos received enough cooperation from participants in all groups, including those with psychiatric illness. In a recent study measuring EA in schizophrenia using EAT, the authors used 4 out of 20 videos from a Dutch version 26 and underlined the issue of non-cooperation from subjects having any psychiatric illness in the presence of a larger number of videos. 8 Otherwise, Martin-Key, Brown 29 used 12 videos, expressing 6 emotions each in 2 videos, to assess EA in adolescents with conduct disorder. A few studies also limited the videos to ≤8 when assessing the aged population for emotion recognition and its dynamic perception.52–54
We specifically included older adults as separate target groups in I-EAT to bring it closer to real everyday life contexts, particularly for perceivers of geriatric age groups. This can be considered an important step toward ecological validity. 55 Older participants were more accurate in scoring empathy for videos of older adult targets than those of younger targets. Life events in the same age group may have appeared more relevant to the older adults. The greater personal relevance of the narration had contributed to better scores in previous studies in the case of AE 56 and CE. 57 Among various groups of young adults, the Schizophrenia group also perceived empathy more accurately for videos of young targets. Their better performance for negative valence emotion could be related to a higher emotional contagion for negative valence emotion they have observed in the past. 58 The pattern of negative bias observed in schizophrenia59–61 could have further influenced the lower EA capacity for positive valence. It would be worth exploring this aspect of empathy in schizophrenia and its causes in future research. In contrast, the Healthy young group had a statistically significant difference in their performance of EA, favoring videos related to positive emotions than negative ones. This pattern was seen in an earlier study that evaluated EA in adolescents, young, and middle adults. 62
In general, all participants as a single group could read empathy more accurately for female targets than for male targets. Women are generally more expressive,63,64 which could have helped participants identify the empathy of female targets with greater accuracy. Unfortunately, we do not have data on target expressivity to confirm this hypothesis.
Among the healthy sample, we found that the Geriatric group achieved significantly higher scores on I-EAT and QCAE than the young participants. The moderate effect sizes held the state even after adjusting for differences in education and the proportion of unmarried participants between the groups. Previous studies have largely supported our finding. Older adults had been found to have better CE and EA,65,66 particularly if target-rated films were used instead of the static emotion recognition task. 67 However, a few studies had found a greater capacity to perceive and understand empathy in the young adults.54,68,69
In terms of divergent validity, I-EAT had a good result. The three I-EAT scores correlated negatively with the AES score, the measure of apathy. Self-reported CE had been indirectly associated with lower levels of apathy. 70 In fact, empathy, in general, is positively associated with sympathy and prosocial behavior, the construct opposite to apathy. 71
Construct and Concurrent Validity
Empathy in terms of sharing experiences, mentalizing, and empathic concern is related to the individual’s goal and understanding the target’s level of emotions and feelings. We noted a strong positive correlation of all I-EAT scores with the Empathic concern score of IRI and therefore also attained good concurrent validity for I-EAT. Furthermore, I-EAT Total was positively correlated with Cognitive and Total scores of QCAE, the subjective measure of CE and AE. I-EAT Positive score, but not the I-EAT Negative score, was correlated with the Cognitive, Affective, and Total scores of QCAE. Empathic emotional regulation of the individual is governed by a self-approach of hedonism versus pragmatism for positive and negative emotions. 72 This, in turn, can influence the understanding of self-empathic ability differentially for the two opposite valences of emotions, as noted in the relationship of QCAE with the I-EAT Positive and Negative scores.
We did not get the correlation of I-EAT with any measure of SOCRATIS, a social cognition test. Original and adapted versions of EAT have not been validated with respect to social cognition tests. A recently adapted version evaluated its correlation with the faux-pas tests but did not find a significant result. 8 Possible reasons may be that EA provides objective correctness of the person’s dynamic understanding of the emotional state of others. Since it is dynamic and taps the flow of intensity in the overall valence of emotion, its dependence on higher skills in different aspects of social cognition, such as perspective-taking, attributional styles, and abstract abilities, may be limited. EAT Total score inversely correlated with the ability to recognize emotions in pictures, as measured by TRENDS. This again indicates that the ability to accurately perceive empathy in an easily recognizable emotional situation lasting for a period of time may be different from the ability to recognize a complex emotion by cross-sectional observation of the face. This is evident in schizophrenia patients who have hyperactivity of the precuneus during the emotion recognition and facial processing task compared to healthy controls but did not have similar activity of the precuneus during EAT. 73
Known-groups Validity
We got good known-groups validity for the adapted I-EAT. We found significantly lower scores for the Young Schizophrenia group compared to those of the Young Healthy and Young Depressed groups. This is in good agreement with the findings noted in the EA-related test 8 as well as subjective instruments of empathy58,74 in previous studies. Clinical scores in the Schizophrenia group were not correlated with any performance in EAT. A few previous studies support this result,8,75 although the smaller sample size in our study was probably insufficient to obtain the correlation.76,77 Among young participants, the Depressed group had significantly higher EA than the Healthy group for negative valence videos. This is supported by our finding of the differential accuracy shown by the Young Healthy group to predict empathy for positive and negative valence. In contrast, Healthy geriatric participants performed better in videos related to both emotions compared to depressed geriatric participants. The severity of depression measured with HDRS was also negatively correlated with the Total EAT score. It agrees well with a systematic review 37 that found an association of CE with depression when objective measures of evaluation are used but not with subjective measures. Similarly, a recent study using IRI and MET found no deficit in CE in a depressed population. 78
Conclusions, Limitations, and Future Directions
The adapted version of the EAT, an objective measure of one’s empathic capacity, ‘Indian EAT, I-EAT’ as we call it, could achieve good face and concurrent validity with significant correlation with QCAE and IRI (to a limited extent). It also provided large group differences between the Healthy and clinical groups. By getting large inverse correlations with an opposite construct, such as apathy, I-EAT also achieved good divergent validity. Our attainment of convergent validity was partial and has not yet been attempted for the original task.
Our study had certain limitations that should be considered while interpreting our results. We did not administer all aspects of social cognition to older adults; some of these scores might have correlated with I-EAT. We also did not include a children and adolescents group, a relevant clinical group for them, such as autism spectrum disorders. Our small sample size of individual groups can also be considered a limitation. Another limitation was the lack of a measure of the expressivity of the target persons. Lastly, we could not use an objective measure of empathy for the concurrent validity because we did not find a well-validated objective measure of empathy.
We hope that future studies will use I-EAT to assess CE in Indian populations with various neuropsychiatric disorders, so that the findings would be more reliable and comparable across studies. We also wish that other regions and countries would standardize EAT and adapt it to their needs so that the inference related to EA of those tests would be more consistent.
Supplemental Material
Supplemental material for this article is available online.
Supplemental Material
Supplemental material for this article is available online.
Footnotes
Declaration of Conflicting Interests
The authors declared no potential conflicts of interest with respect to the research, authorship, and publication of this article.
Funding
The authors received no financial support for the research, authorship, and publication of this article.
References
Supplementary Material
Please find the following supplemental material available below.
For Open Access articles published under a Creative Commons License, all supplemental material carries the same license as the article it is associated with.
For non-Open Access articles published, all supplemental material carries a non-exclusive license, and permission requests for re-use of supplemental material or any part of supplemental material shall be sent directly to the copyright owner as specified in the copyright notice associated with the article.