
Abstract
Background:
The prevalence of mental health problems in adolescents has been identified as a global concern. Early screening and identification can offer benefits in terms of primary prevention and reduced healthcare costs. This study aimed to develop a tool to assess the risk of developing mental health problems in adolescents.
Methods:
The study followed an exploratory sequential design and was divided into five phases. The Multidimensional Psychosocial Risk Screen (MPRS) is a newly developed self-report measure. The various steps in its development and validation have been elaborated. The MPRS was evaluated with a sample of 934 adolescents aged 12-18, spread across the 8th-12th grade.
Results:
Exploratory and confirmatory factor analyses revealed a robust factor structure. The extracted five factors were named as Parent–Child Relationship (PCR), Self-Concept (SC), Teacher–Student Dynamics (TSD), Social Media Use (SMU), and Peer Interaction (PI). The reliability of the subscales ranged from 0.60 to 0.80. The overall reliability of the scale was good (a = 0.87). Convergent validity of the scale was established using standard measures of risk factors and emotional and behavioural problems.
Conclusions:
The MPRS can be considered an effective tool with an adequate factor structure and good psychometric properties. It can be beneficial in the early detection of vulnerabilities to mental health problems in adolescents and, therefore, seen as a key element in primary prevention and fostering individualized interventions.
Appropriate screening is vital to the primary preventive and promotion strategies for adolescents’ mental health. MPRS is a self-report measure that assesses the risk of mental health difficulties in adolescents. It has promising psychometric properties and would help the clinicians and professionals in the school set-up in early identification, opening the window for effective interventions.Key Messages:
As per World Health Organisation (WHO), adolescents comprise 16% of the global population. 1 India has the highest number of children and adolescents worldwide.2,3 The need to focus on adolescents’ mental health is highlighted in different epidemiological studies conducted globally, 4 since half of all mental health disorders have their onset during adolescence.5,1 Adolescence is a developmental period characterized by rapid changes in physical and mental capabilities 6 combined with difficulties in emotional and behavioral control. 7 These changes and challenges during adolescence can increase one’s susceptibility to mental health problems.
The National Mental Health Survey of India (2016) concluded that around 9.8 million Indians aged 13-17 years have mental health problems.8,9 This suboptimal mental health functioning can interfere with a healthy transition from adolescence into adulthood and seriously impact the subsequent generation.10,11 Poor mental health can make adolescents vulnerable to high-risk behaviors, including self-harm, substance use, and risky sexual behaviors. In severe cases, it can even lead to suicide, a leading cause of death among older adolescents.12,1 The need for primary prevention and adequate mental health is emphasized by mental health professionals12,13 and policy makers because mental health has been considered crucial to achieving sustainable development goals. 14 Promoting and protecting mental health can lead to a better quality of life, strong human capital, and global socioeconomic development. 15 However, there are a variety of reasons why adolescents may not access mental health services, such as the lack of awareness about mental health problems, the stigma associated with such difficulties, and inadequacy in the structures of healthcare systems. 16 Research has identified the potential the schools have as a space to promote mental health awareness, due to their access to adolescents attending schools regularly and the existence of their already established relationship with the school authorities. Additionally, child guidance clinics might have limited resources to promote mental health awareness among adolescents.
Primary prevention requires appropriate screening and identification of various risk factors for developing mental health problems.17,12 The American Academy of Paediatrics (2012) recommends regular screening and assessment of children’s mental health and provision of effective primary care. 18 Given these findings, the role of mental health screening tools becomes crucial. The scientific literature describes a wide range of assessment tools for identifying symptoms of mental health disorders. 4 However, the goal of primary prevention is to identify the risk before it manifests itself into a problem. Other limitations are present in the form of the disorder-specific nature of the tools, 4 insufficient accuracy of diagnostic instruments to justify their use in isolation for diagnostic purposes, 19 possibility of overdiagnosis as a result of disorder-specific tools such as depression screening tool, 20 and lack of availability of trained staff to identify these disorders in school students. 21 In light of these limitations, this article discusses the process of developing a screening tool to assess risk factors in adolescents’ mental health. We have named this tool as Multidimensional Psychosocial Risk Screen (MPRS). Research indicates that positive and cost-effective outcomes can be attained through the early intervention paradigm because of its accessibility and acceptability to young people. 22 This tool would be useful in the early identification of adolescents at risk of developing mental health difficulties, especially of socioemotional and behavioural nature, so that early intervention can be initiated to prevent that difficulty or to delay its progression into a clinical disorder.
This study aims to develop and examine the psychometric properties of MPRS as an approach to evaluating mental health risk in school-going adolescents. To develop a model of the most significant and modifiable risk factors, literature was systematically reviewed to synthesize the evidence on various factors having adverse effects on the mental health of adolescents, were amenable to change, and could be easily screened. Some risk factors, such as fixed markers that could not be modified, were excluded. For more details, refer to online-only supplementary file 1. A total of six databases were searched and that yielded 41 studies, of which 24 were cross-sectional, 16 were longitudinal, and 1 was case-control. The risk factors were classified into five major domains: individual, family, peers, school, and media. There were variations in the mental health outcomes across studies. The most prominent individual-related risk factors included emotional dysregulation, problematic coping mechanisms, certain cognitive schemas, low self- esteem, and personality traits, including low agreeableness, neuroticism, impulsivity, and psychopathic traits.23-35 With respect to the factors within the family system, the parent–child relationship (PCR) emerged as the strongest predictor of mental health problems among adolescents, especially in authoritarian and controlling parenting.36-41 Peer-related loneliness and bullying emerged as strong risk factors.42-46 Research had also found that using social networking sites increased the vulnerability to internet addiction.31,47 These factors were further validated through various phases explained in the methods.
Materials and Methods
Study Design
The study employed an exploratory sequential design and was carried out in five phases. The period of data collection was between July 2020 and December 2021. The details of the participants of each phase are described further.
Participants
Phase 1: Personal Interviews
The participants of this phase comprised 12 mental health professionals. Maximum variation sampling was used to attain a variety of mental health specialties within the sample. Four specialties were selected to represent a wide range of experience. Through this process, three psychiatrists, three clinical psychologists, three counsellors, and three psychiatric social workers were recruited in the final sample. The work experience of the participants ranged 5-22 years in the field of adolescent mental health. The participants were contacted through email, and their consent was taken. The direct interviews were audio-recorded. No incentive was offered to the participants.
Phase 2: Focus Group Discussions
The participants of this phase were recruited through purposive sampling. The sampling design consisted of three strata. The first comprised school-going adolescents (n = 26), the second was secondary and senior-secondary school teachers (n = 27), and the third strata included parents of adolescents (n = 23). The age of the adolescents ranged from 12 to 18. Three FGDs each were conducted in different strata, making a total of nine FGDs. The number of participants in each FGD ranged from 6 to 10, which is an appropriate size as per Krueger and Casey (2002) guidelines. 48
Phase 3: Content Validity
Ten experts were contacted through email, out of which seven reverted. The participants comprised six experts in adolescent mental health and one from the department of languages. Experts were selected based on their expertise in research and work in the mental health of adolescents. Most of the panel members had more than ten years of experience. The questionnaire and the qualitative–quantitative rating scale were sent for their feedback.
Phase 4: Exploratory Factor Analysis (EFA)
Participants were recruited from nine schools through purposive sampling. Of these nine schools, three were from Uttar Pradesh, three from Delhi, and three from Haryana. The sample size for the EFA comprised 300 adolescents, based on Thompson’s guidelines. 49
Phase 5: Confirmatory Factor Analysis (CFA) and Psychometric Properties
A fresh sample of 634 adolescents was drawn for the CFA and for establishing convergent and divergent validity. In total, 934 adolescents aged 12-18 (M = 14.66, SD = 1.23) participated in the study. The participants were recruited from grades 8th to 12th and comprised 48.3% males and 51.7% females. Most participants belonged to nuclear family (62.5%) than joint family (37.5%). Efforts were made to match the samples for both EFA and CFA phases in terms of the background, grade, and age of the participants, to ensure an adequate factor structure.
Measures
Apart from the MPRS, the following tools were administered to the participants for establishing convergent validity during Phase 5 of the research.
The RADAR 4
It is an emotional-health screening tool for high school students aged 11-18. It consists of a combination of risk and protective factors related to the development of mental health difficulties. It has six subscales with five items each: school connectedness, family relations, academic success, peer acceptance, sporting interest, and acceptance of appearance. Each item is scored from 1 (not at all like me/my life) to 5 (very much like me/my life). The scores on each subscale are added to produce a total score ranging from 30 to 150. Higher scores on the total scale and subscales indicate lower mental health risk and better socio-emotional functioning. The scale has excellent reliability (a = 0.91). This tool is helpful for mental health professionals and educators in identifying students at risk of developing mental health problems. 4 Therefore, a significant correlation between MPRS and RADAR would help establish convergent validity, since MPRS also intends to measure the same.
The Strengths and Difficulties Questionnaire (SDQ) 50
It is a 25-item screening tool applicable to the age range of 4–17 years. It measures difficulties as well as positive attributes using five subscales: hyperactivity, emotional symptoms, conduct problems, peer problems, and prosocial scale. There are different versions available; this study used the self-report version. The items are scored on a 3-point scale of 0 = not true, 1 = somewhat true, and 2 = certainly true. The scores on subscales are summed up to get a total score ranging 0–40. The youth-version of SDQ has satisfactory reliability (a = 0.80). It has been widely used in research both in the west and in an Indian setting. Moreover, it predicted a risk of psychiatric diagnosis of a clinical disorder as assessed by the structured diagnostic interview. This tool was used to establish convergent validity because it measures behavioral and emotional problems in adolescents. A positive correlation between SDQ and MPRS would demonstrate good convergent validity.
The Brief Multidimensional Students’ Life Satisfaction Scale—PTPB (BMSLSS-PTPB) Version 51
It is a revised version of the BMSLSS 51 that measures satisfaction in school students with respect to domains such as self, school experience, family life, friendships, place of residence, and overall life satisfaction. The responses are assessed on a five-point Likert scale ranging from 1(very dissatisfied) to 5(very satisfied). The total scores range 1–5 and greater scores suggest higher satisfaction. The scale has good psychometric properties. Item response theory analysis from a psychometric study revealed that response alternatives in the original BMSLSS were not distinct. 51 Therefore, this version was used.
Procedure
The study was reviewed and approved by the Institutional Ethics Committee. Each phase, along with its aims, is depicted in Figure 1.
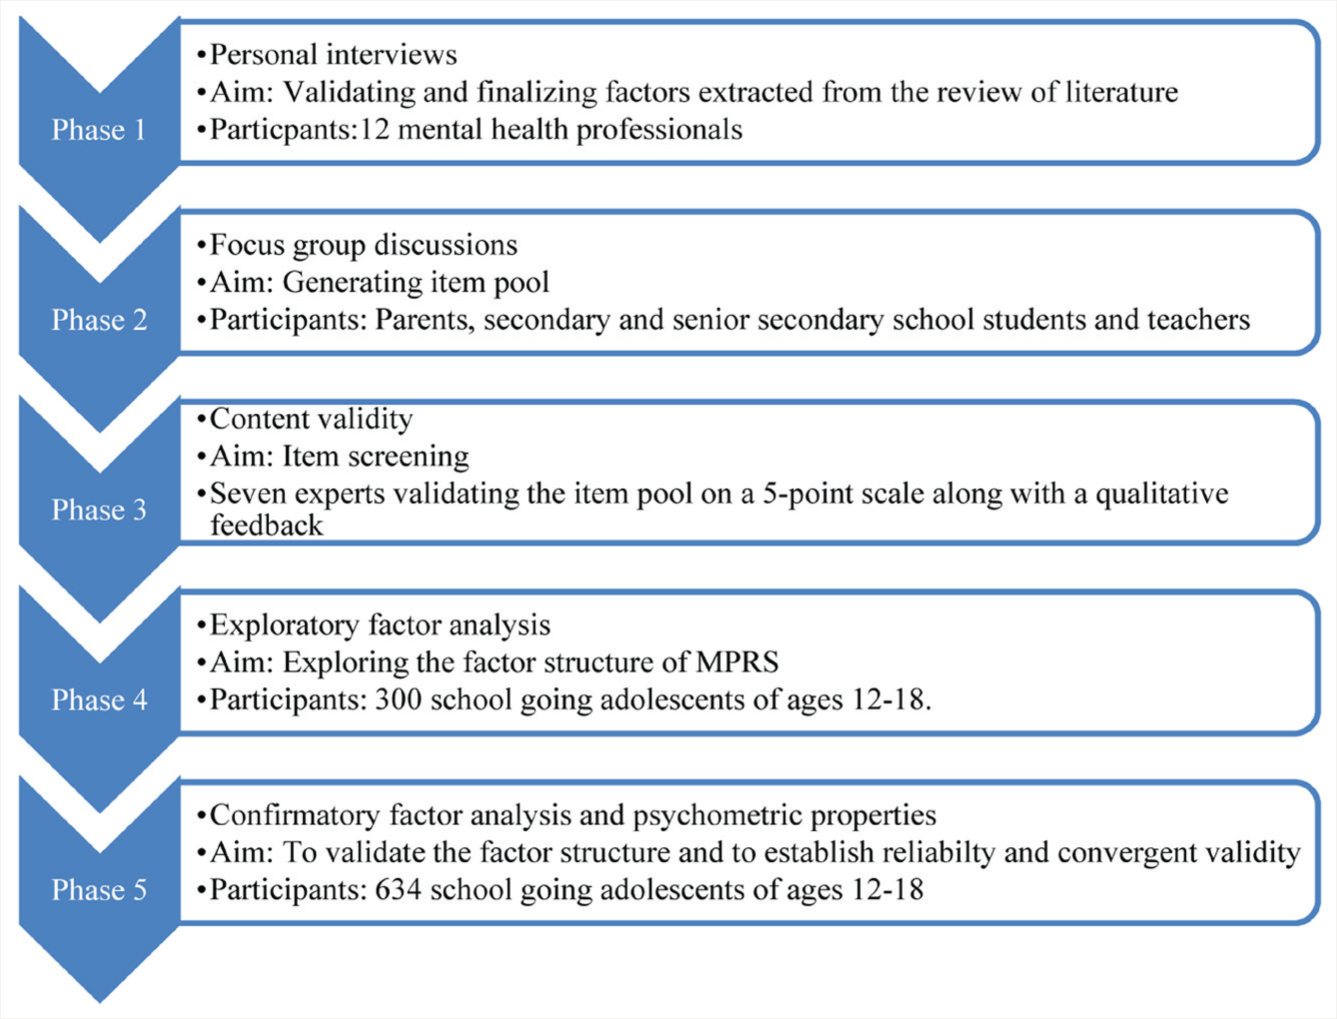
FGDs, focus group discussions; MPRS: multidimensional psychosocial risk screen.
Phase 1: Personal Interviews (PIs)
A qualitative design employing semi- structured qualitative interviews was used. The objective of this phase was to explore the most significant and modifiable risk factors with the help of mental health professionals’ clinical experience. An interview guide was developed by the authors and validated by three experts. Consenting participants were approached for the interview, and all 12 interviews were audio-recorded. The interviews were transcribed and reviewed for accuracy. The transcripts were analyzed using content analysis based on Bengtsson’s guidelines. 52 The authors along with one more team member reviewed the results in meetings and discussions and arrived at a final coding scheme. Open coding was done, followed by axial coding. The most prominent concepts and ideas were identified. The most significant factors were listed as per their frequency of occurrence. Member checking was performed to establish the trustworthiness of the findings. As per the interview guide, the participants were also asked to rank the factors on a scale of 1–5, with 1 being the most significant and 5, the least significant.
Phase 2: Focus Group Discussions (FGDs)
The objectives of this phase were twofold. The first was to validate whether the factors derived from the review and personal interviews were applicable to the target population. The second objective was to understand the meaning of these factors from three different perspectives and to generate items for the questionnaire to truly represent the experiences of the target population. Participants were divided into three strata: adolescents, teachers, and parents. Three FGDs were conducted in each of these strata. FGD guide was developed by the authors and validated by three experts. The discussion aimed to explore the meaning of different risk factors from the participants’ frame of reference. Schools were contacted for the recruitment of the participants. Written consent was taken from all the school principals. After obtaining consent from the school authorities, consent was taken from the parents and teachers, and assent was taken from the adolescents. The first author carried out the FGDs with a facilitator until data saturation. All nine FGDs were audio-recorded and transcribed. The data were coded and analyzed using Krueger’s manual. 48
The codebook was created by the first author and reviewed by the other two team members, for both PIs and FGDs. The members reviewed the results in meetings and discussions and arrived at a final coding scheme. There were no major disagreements among the team members. Refer to online-only supplementary file 2 for more details.
Phase 3: Content Validity
The objective of this phase was to establish the content validity of the questionnaire. An initial item pool of 300 statements was generated based on the results of the systematic review conducted by the authors, PIs, and FGDs. The items were framed to precisely represent the participants’ excerpts. This phase aimed at item selection and finalizing the response and scoring format. Most of the statements in the questionnaire were negatively worded. A few statements were positively worded also (the ones written with a positive descriptor and without a negative word, that is, “not”). The positively worded statements were considered for reverse scoring, to overcome response bias. The content validity was established with the help of seven experts. The experts analyzed and rated the items using a qualitative–quantitative (1-5) scale for language clarity, content clarity, the fitness of the item to the domain, and relevance of the item. The language expert provided feedback on the grammatical structure of the statements.
Phase 4: EFA
The objectives of this phase were item reduction and understanding the factor structure. The total sample size for this phase was 300, which is an adequate sample size for EFA. 53 An EFA was carried out to explore the basic factor structure of the data, using SPSS 21. Principal Axis Factoring was used as a method since it is considered more suitable for data that are not normally distributed. 4 Factors were rotated using oblique rotation, since a possible correlation between the factors was expected. Item discrimination and item-total reliability were also computed as a part of the item analysis. The items had to meet five main criteria for inclusion in the scale: (a) item discrimination index value must be ≥0.2, (b) corrected item-total correlation must be ≥0.3, (c) items must strongly load onto their main factor with a minimum cut-off of 0.4, 54 (d) items must not load above 0.3 on any other factor, and (e) items must represent the subscale on which they loaded as per their face validity. An eigenvalue of ≥2 was selected. A parallel analysis engine using R was also used to calculate the number of factors to retain. 55
Phase 5: CFA and Psychometric Properties
The first objective of this phase was to confirm the existing factor structure. The second objective was to establish the convergent validity of the scale. Analysis was carried out using SPSS Analysis of Moment Structures. Additional analysis was conducted to establish the reliability and validity of the scale and its subscales. Apart from the descriptive statistics of the scale, reliability was assessed using Cronbach’s a, and convergent validity was assessed by evaluating the correlation of the scale with the RADAR, SDQ, and BMSLSS-PTPB. Since higher scores on MPRS would indicate a greater risk for mental health problems, it should correlate negatively with the RADAR and positively with the SDQ (except for the prosocial scale) and BMSLSS-PTPB.
Results
Phase 1: PIs
In the individual-related factors, the themes revolved around self-concept (SC), personality traits, coping mechanisms, cognitive schemas, etc. In the family-related factors, PCR and parenting, relationship with siblings, attachment, the relationship between parents, and expectations emerged as important themes. Bullying, peer pressure, peer relationships, and peer-related loneliness were crucial to the peer-related factors. With respect to the teachers, academic pressure and expectations, discrimination, teacher–student relationship, teachers’ support, and labelling were found to be important. Media also emerged as a strong factor, especially in terms of its excessive use, watching violent content, comparison, and lack of parental control in social media use (SMU). Societal norms and expectations were also highlighted in the interviews. As per the rating by the participants and existing review of the literature, the most significant factors were found to be parenting, SC, personality traits, teacher–student dynamics (TSD), peer relationships, SMU, and coping mechanisms. These factors were included in the scale before further analysis.
Phase 2: FGDs
As per the FGDs conducted on the adolescents, parents, and teachers, the major themes with respect to parenting revolved around concepts like communication with the parents, parents’ expectations, the extent of parental control in the adolescent’s life, lack of affective involvement with the child, accepting the adolescents’ thoughts and feelings, involvement and interest in the adolescent’s problems and day-to-day life, inconsistency in parents’ behaviors, comparison with others, and understanding between the parents and adolescents. SC was explained in terms of not accepting oneself, lack of confidence in one’s abilities, difficulties in having one’s own viewpoint, an incapability to take one’s own decisions without being influenced, the role of others’ perceptions, an inability to believe in oneself, etc. Impulsivity, difficulties in regulating one’s emotions, sensitivity to criticism, self-harm tendencies, etc., were the associated themes with pathological personality traits. The themes about TSD were characterized by teachers’ attitudes towards the students, comparing the students with others, disrespecting the students, labelling the students, not understanding their needs, lack of guidance and support from the teachers, etc. All three groups described peer relationships in terms of bullying and name-calling, the negative influence of peers, lack of acceptance from peers, lack of close friends, distracting and degrading other students, etc. The major themes around SMU were excessive consumption of social media, use despite knowing its harmful consequences, comparing one’s life with the others on social media platforms, ignoring other important activities, getting easily distracted by notifications, a need to impress others, etc. Finally, coping mechanisms were elucidated in the form of escape and avoidance behaviors, maladaptive behaviors in response to stressful situations, not taking help from others, not discussing the problems with significant others, blaming oneself, punishing oneself, inability to channelize energy into productive tasks, etc. The participants’ explanations were represented verbatim in the scale to best represent their experiences.
Phase 3: Content Validity
An item pool of 300 statements was generated covering the seven domains mentioned in Phase 1. Eighty statements were discarded based on redundancy and repetitiveness. As per the experts’ analysis, 190 statements were finalized. A six-point Likert-type measure was selected for the response pattern based on the likelihood of the experience: “Not true at all,” “Rarely true,” “Sometimes true,” “Often true,” “Usually true,” and “Always true”. This six-point Likert-type format was used in the scoring pattern as 0 (not true at all), 1 (rarely true), 2 (sometimes true), 3 (often true), 4 (usually true), and 5 (always true). Most statements were designed to be scored in this fashion; however, a few reverse-worded statements were reverse-scored. This scoring pattern was decided based on existing literature on questionnaires measuring similar constructs, and also, this scoring pattern has a high trend of discrimination and reliability since it does not allow the participants to choose a middle value while responding to the statements. 56
Phase 4: EFA
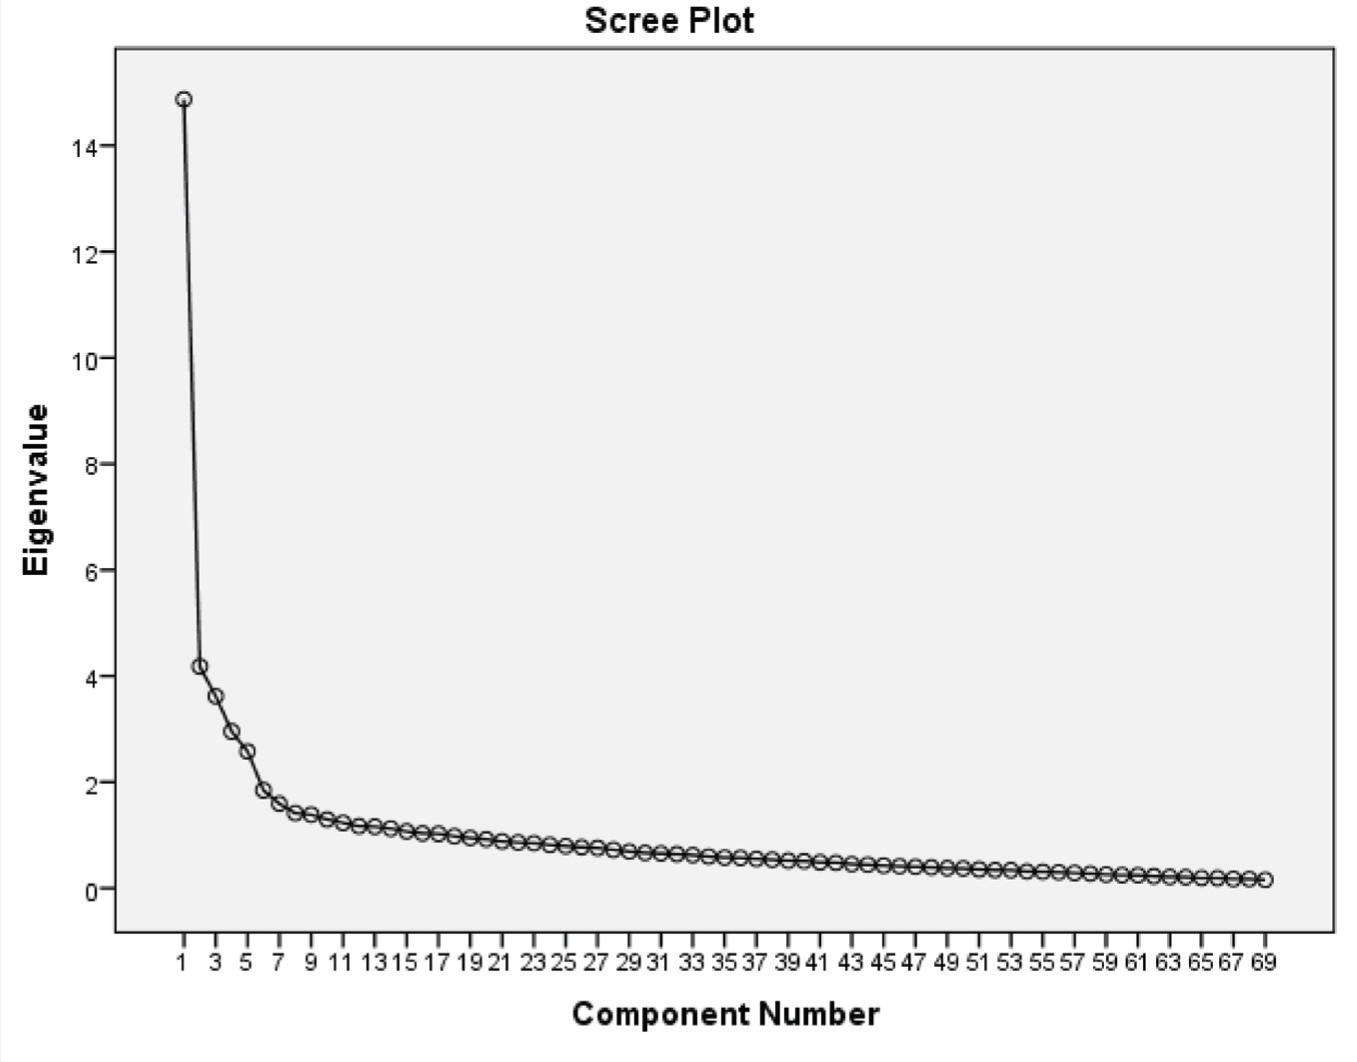
A total of 360 parental consent forms were distributed, and 330 parents gave their consent. Three hundred participants filled out the questionnaire. Thirty forms were left unfilled and therefore excluded from the sample. There was no missing data in the final sample (n = 300). The Kaiser–Meyer–Olkin measure of sampling adequacy was 0.89, which is interpreted as good, 57 and Bartlett’s test of sphericity was significant, X2(2346) = 9234, P = <0.001. As a result of content analysis, 190 statements were finalized. Out of them, 71 had a low item-discrimination index and corrected item-total correlation. Therefore, the remaining 119 items were subjected to three rounds of EFA until a clear factor structure emerged. Fifty items were deleted after the third round of EFA because those items either had a factor loading < 0.4 or loaded on more than one factor. Sixty-nine items were finally retained after the third round of EFA. A five-factor model emerged, which accounted for 42% of the total variance, considering an eigenvalue of ≥2 (Figure 2). There were more than five items in different factors. However, only the top five items that met all the five criteria mentioned in the procedure under Phase 4 were selected, to ensure adequate brevity of the scale and were subjected to further analysis. The findings were further validated by parallel analysis. The items loading significantly on the five factors were reviewed and named as PCR, SC, TSD, SMU, and peer interaction (PI). The factor loadings of the top five items on each subscale are presented in Table 1.
Scree Plot Depicting Eigen Values.
Exploratory Factor Analysis Loadings on Participants of Phase 4.
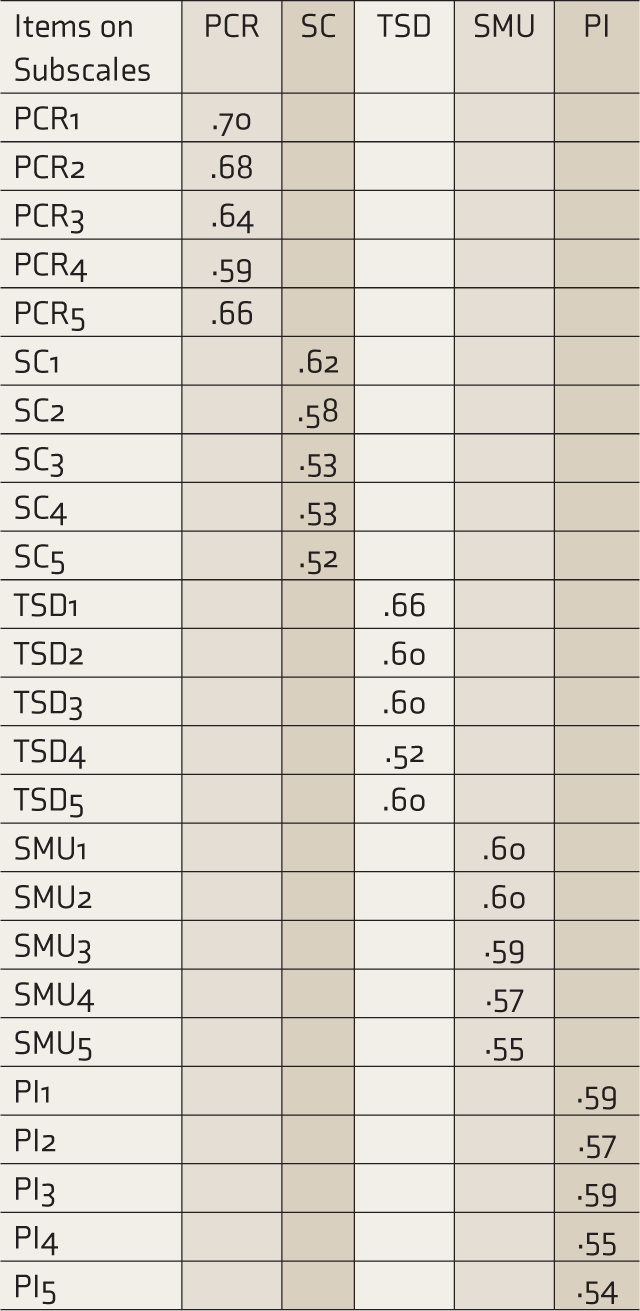
PCR: parent–child relationship, SC: self concept, TSD: teacher–student dynamics, SMU: social media use, PI: peer interaction.
Phase 5: CFA and Psychometric Properties
A total of 670 parental consent forms were distributed, out of which 650 parents responded. Sixteen participants responded to only a few questions and were therefore excluded from the sample. The final sample size for this phase was 634. The model demonstrated adequate fit (Table 2). The authors chose to run CFA on 25 items out of the 69 items derived through EFA, based on the method used by Burns and Rapee. 4 Loadings of individual items and correlations between subscales are illustrated in Figure 3. Each subscale showed adequate Cronbach’s α, ranging from 0.60 (PI) to 0.80 (PCR, Table 3). The overall reliability of the scale was found to be good (α = 0.87). Table 4 shows its correlation with the RADAR and the SDQ. As predicted, the MPRS showed a significant negative correlation with the RADAR total score and its various subscales (except for the Sporting Interest Scale) and a strong positive correlation with the SDQ total and its subscales (except for the Prosocial Scale). No significant correlation was seen between BMSLSS-PTPB and MPRS.
CFA Goodness of Fit Indices.

GFI: good of fit index, CFI: comparative fit index, TLI: Tucker Lewis Index, SRMR: standardized root mean residual, RMSEA: root mean square error of approximation.
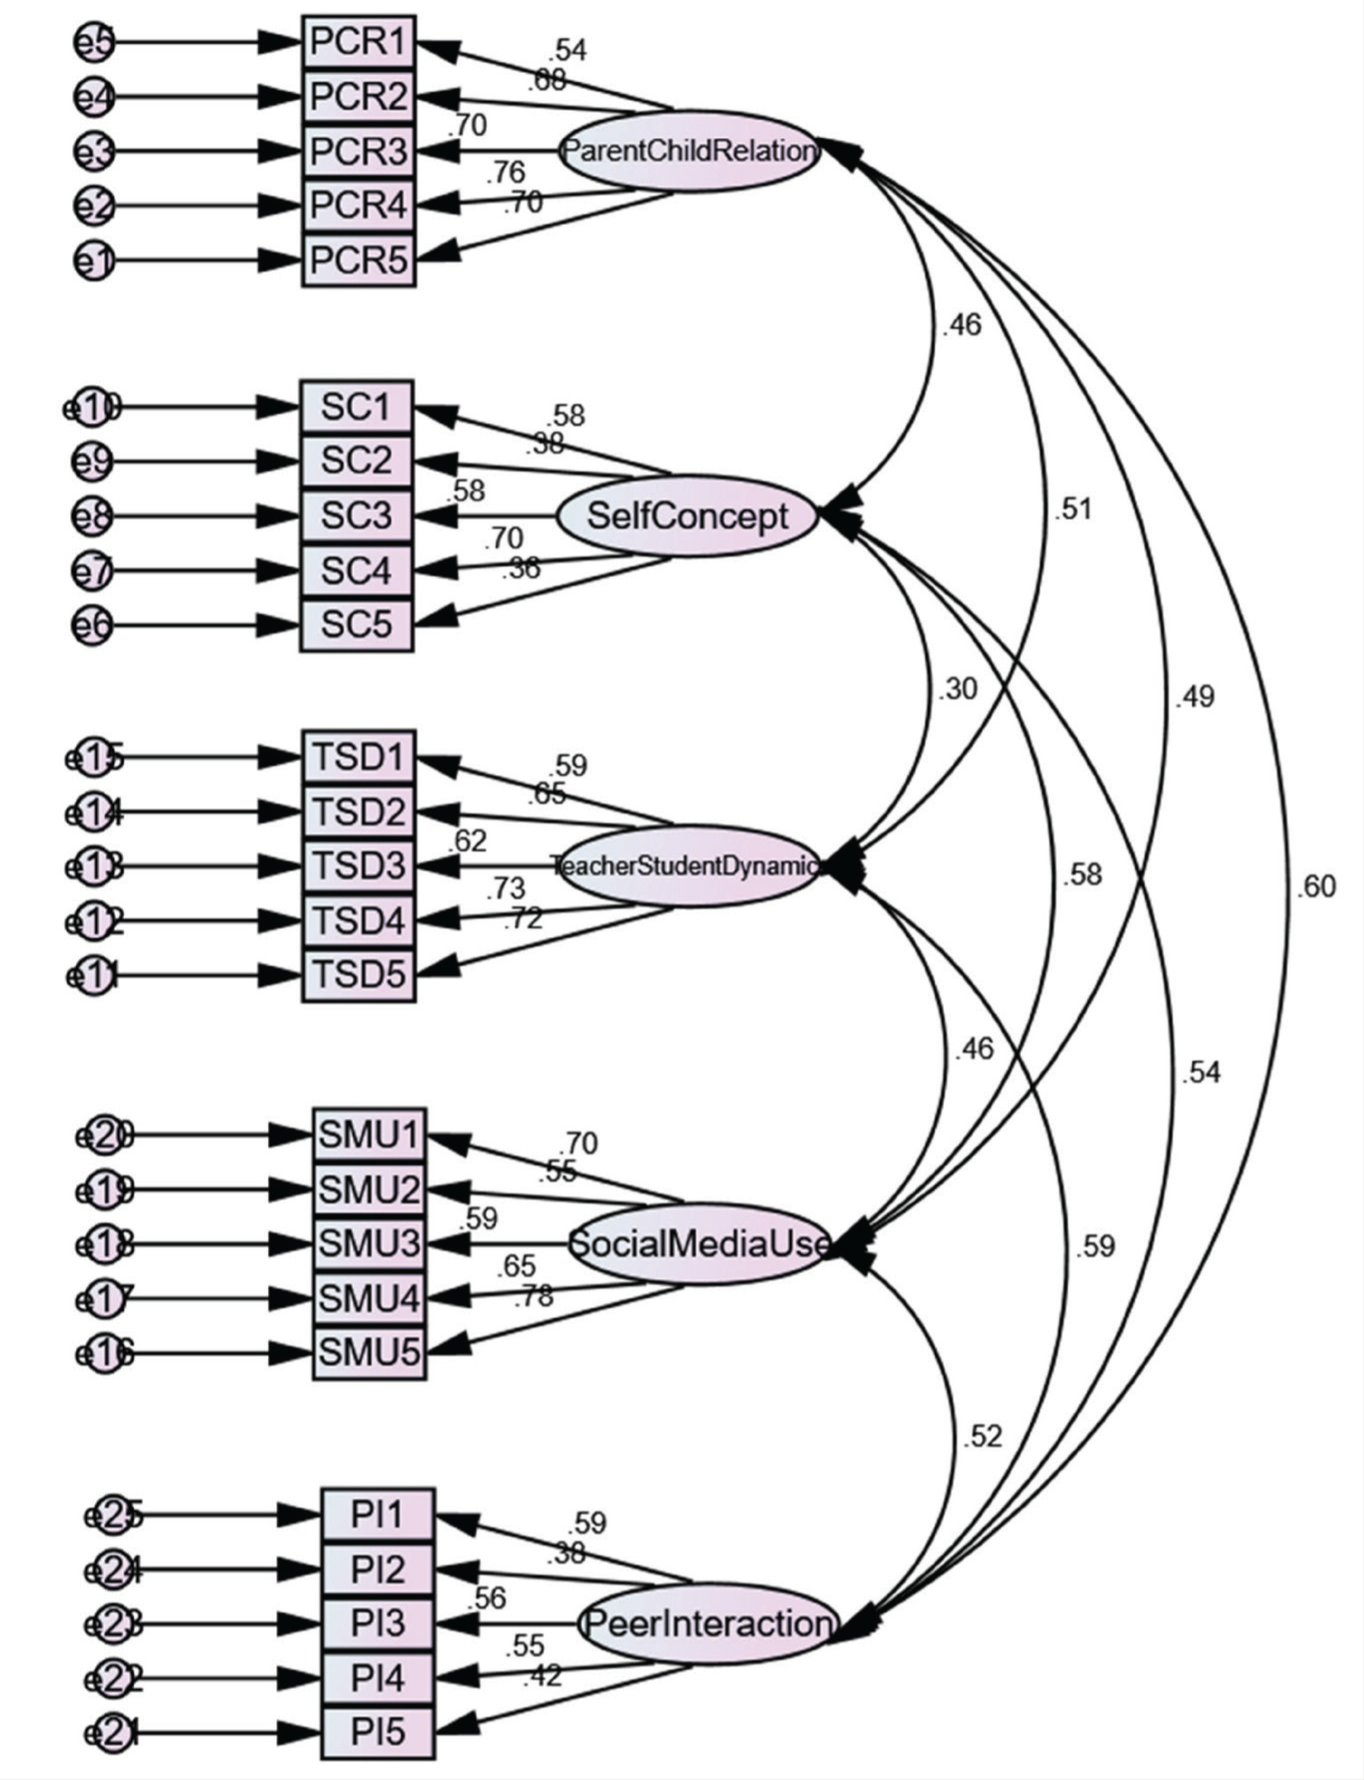
PCR, parent–child relationship; SC: self-concept; TSD: teacher–student dynamics; SMU: social media use; PI: peer interaction.
Descriptive Data and Cronbach α of the MPRS and Subscales.
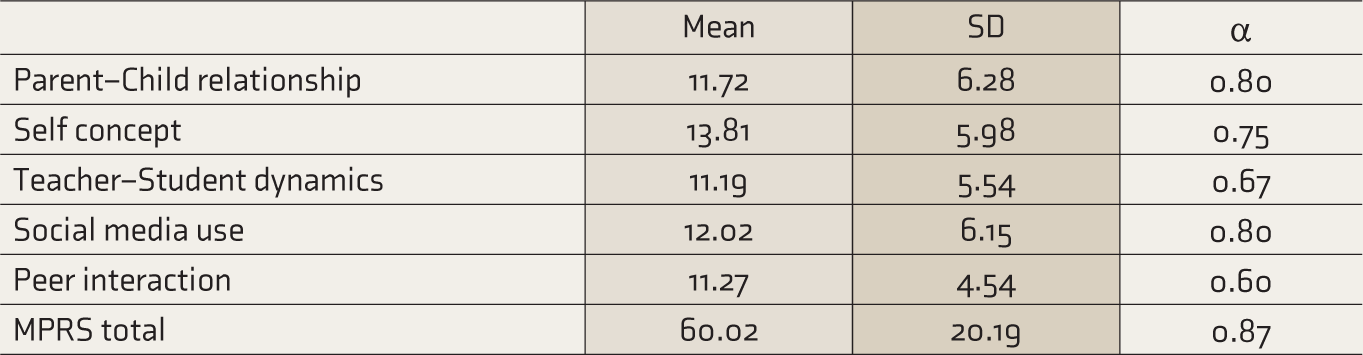
MPRS: multidimensional psychosocial risk screen.
Correlations between MPRS Scales, RADAR, SDQ and BMSLSS.
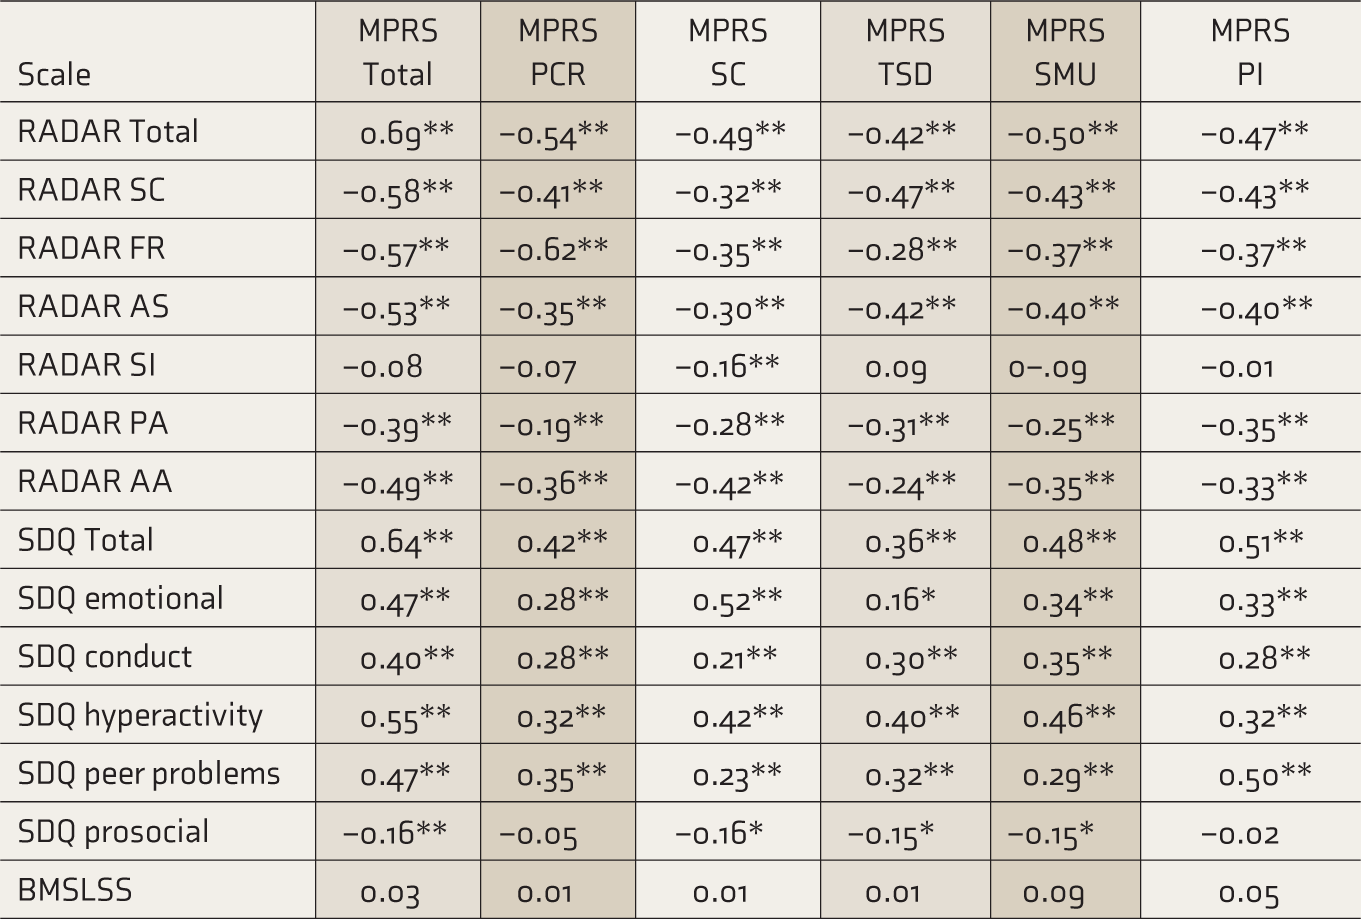
MPRS: multidimensional psychosocial risk screen, PCR: parent–child relationship, SC: self concept, TSD: teacher–student dynamics, SMU: social media use, PI: peer interaction, RADAR SC: school connectedness, RADAR FR: family relations, RADAR AS: academic success, RADAR SI: sporting interest, RADAR PR: peer acceptance, RADAR AA: acceptance of appearance, SDQ: strengths and difficulties questionnaire, BMSLSS: brief multidimensional students’ life satisfaction scale, **P < 0.01, *P < 0.05.
The analysis resulted in 25 items in the final MPRS. There were three reverse-worded statements, and scores on those statements were scored reversely to get a score on each subscale. The scores on the five subscales were added to get a total score. The mean score on the MPRS in this study was 60.02 (SD = 20.19). Therefore, a score higher than this cut-off value would indicate a higher risk for mental health difficulties (check online-only supplementary file 3 for sample items).
Discussion
Screening strategies and early intervention have been considered key elements in promoting and preventing mental health difficulties, especially during adolescence. 58 However, the target of early intervention in adolescent mental health is not yet completely accomplished. 58 A wide variety of tools are available for this population, but the majority are helpful only in screening for mental health disorders. Tools to assess the factors that may increase the vulnerability of mental health problems in the form of socio- emotional and behavioral difficulties are limited, especially in the Indian context. The study aimed to develop MPRS as a method to assess the risk for mental health problems in the school-going population. The scale did not attempt to measure the presence or absence of any mental health condition. Rather it assessed the school students on those risk factors significantly associated with mental health difficulties. Moreover, the development of this tool is based on a combination of rigorous qualitative and quantitative methodology, which had not been followed in the previous articles as per the authors’ knowledge. It takes into consideration a holistic approach emphasizing the perspectives of all the significant individuals, such as mental health professionals, adolescents themselves, parents as well as teachers, making this tool quite comprehensive. Therefore, it can be understood as a screening tool with a good scope from a primary prevention perspective. It can be helpful for clinicians and educational professionals to identify vulnerabilities in school students for mental health difficulties without labelling them. Several risk factors were excluded from the study, such as a history of mental illness in parents, gender, socioeconomic status, history of abuse, etc., for two reasons. First, these factors are difficult to modify; second, some of these factors can be easily identified without the need for a screener. Factors that could be changed were targeted (for more details, refer to online-only supplementary file 1).
The subscales of MPRS were supported both theoretically and empirically. Systematic review and personal interviews with the mental health professionals helped in conceptualizing the subscales. The PIs, as a part of the exploratory phase of the study, offered meaningful insights into practical insider knowledge, which is difficult to obtain through other methods. The findings helped validate the most significant risk factors identified through the literature review. With the help of FGDs, we were able to generate an item pool. Participants’ excerpts were used to frame the statements, to make them context-specific and more relatable. The qualitative analysis helped examine the most significant risk factors and highlighted the important themes pertaining to the description of these factors. Including parents and teachers enhanced the explanation of the subscales from a broader perspective. It helped validate and represent those factors and statements that could aid the process of identification by teachers and parents. Adequate measures were taken to frame the statements in an unambiguous and simple format. The experts’ feedback was incorporated in selecting items and deciding the response pattern, thereby adding to the scale’s content validity. A six-point Likert-type response format was decided after reviewing the existing scales measuring similar constructs, while keeping the issues related to response bias and reliability in mind.
Both exploratory and confirmatory factor analyses revealed a five-factor model with adequate statistical strength. The five subscales identified were PCR, SC, TSD, SMU, and PI. Each subscale showed acceptable reliability ranging from 0.60 to 0.80, and the overall reliability of the scale was found to be good (α = 0.87). The MPRS subscales strongly correlated with the SDQ and Youth RADAR subscales, demonstrating a good convergent validity. However, the PI subscale of the MPRS was the lowest in terms of reliability compared to the other subscales. The Peer Problems subscale of SDQ and the Peer Acceptance subscale of the RADAR have also demonstrated low reliability. 4 It can be inferred that peer relationships can be understood as a broad construct that might have different subcomponents that can independently contribute to various mental health difficulties. However, the PI scale was significantly associated with peer problems, thereby highlighting its importance as a risk factor. Also, this factor emerged as an important factor theoretically and based on qualitative findings. The MPRS subscales did not show any signi- ficant association with the BMSLSS-PTPB, demonstrating a finding contradictory to the existing literature. This lack of association can be attributed to individual differences in levels and correlates of life satisfaction across domains. 59 Also, researchers have found that not only physical and mental health status but broader indicators of well-being, such as school engagement and academic achievement, influence life satisfaction. It has also been stated that despite a relationship between life satisfaction and mental health problems, life satisfaction measures a different construct and is therefore distinguished from mental health difficulties. 59 Though RADAR already exists as a measure of risk and protective factors in mental health difficulties during adolescence, we attempted to design a context-specific screening tool for risk factors, to address the issue of cross-cultural variations. The use of qualitative data in selection of various factors and item pool generation makes MPRS distinct from the RADAR.
Both qualitative and quantitative evidence from previous studies in the context of mental health difficulties, though they had assessed the five subscales of MPRS separately, supports these findings. The role of parents,36-41 teachers, 60 peers,42-46 social media,61, 47, 31 and perception towards self62-63 in the mental health of adolescents has been well elucidated. Therefore, the MPRS showed promising findings with respect to content validity, factor structure, reliability, and convergent validity. It can be an efficient screening strategy that may foster a useful healthcare pathway. It may help take crucial steps before the onset of any mental health problem or prevent these problems from worsening. It has important implications from the “at-risk mental state” point of view, which focuses on transition of prodromal symptoms into clinical disorders. 64 Mental health difficulties may decrease the threshold for clinical syndromes. Therefore, early identification of these socio-emotional and behavioral problems can open pathways for prevention by delaying their progression into a disorder. Preventive interventions can be targeted as per the risk factors, thus making mental healthcare more personalized. For instance, peer mentoring, parent-training, school-based interventions, and programs targeting SC and coping skills can be initiated. These programs have shown promising results in affecting multiple outcomes, with sustained effects over a period of time. 65 MPRS measures risk factors in different contexts; therefore, the role of contextual factors on the effectiveness of a program can be monitored and tailored accordingly. Indicated interventions in the form of cognitive-behavioral therapy, social skills training, relaxation, social support, psychoeducation, etc., alter the trajectory of mental health conditions. 58 Therefore, based on the understanding of modifiable risk factors, these interventions can be designed since these factors are relatively easier to modify than fixed markers such as gender, socioeconomic status, parental history of mental illness, etc.
However, certain limitations need to be addressed. Studies can focus on using a more stratified sample to represent the population better, making the findings more generalizable. The self-report nature of the scale could have led to social desirability bias. The scale can be administered to a clinical population for better discrimination and the development of norms. This study was cross-sectional; therefore, a longitudinal follow-up would help examine the course of mental health difficulties in students over time. Even though the sample size was adequate for EFA, considering the number of items in the questionnaire, the sample-to-item ratio was low. The total variance explained by the five-factor model was low; however, the same model depicted adequate factor structure through CFA. Researchers have concluded that the goal of factor analysis is to explain variance with the smallest number of factors; in social science research, it can be less than 50%. 66 Additional empirical data for identifying optimal cut-off value with respect to the total score on MPRS are required. Nevertheless, the MPRS can be used as a screening tool by the clinicians and educational professionals in the school set-up to identify the students at an early stage so that their difficulties can be appropriately managed.
Conclusion
The study described in detail the development of a valid and reliable tool to assess the risk of mental health problems in adolescents. This tool would help design a preventive framework by identifying the risk factors that might modify early psychopathological trajectories. It resolves the issue of labelling and therefore be considered a more acceptable, appropriate, and context-specific tool with respect to the screening procedure. It would address the unique and psychosocial needs of adolescents, thus reducing the progression of these difficulties into mental health disorders in the long run. It would also help in managing the consequences of these difficulties more effectively.
Supplemental Material
Supplemental material for this article is available online.
Supplemental Material
Supplemental material for this article is available online.
Footnotes
Declaration of Conflicting Interests
The authors declared no potential conflicts of interest with respect to the research, authorship, and/or publication of this article.
Funding
The authors received no financial support for the research, authorship, and/or publication of this article.
References
Supplementary Material
Please find the following supplemental material available below.
For Open Access articles published under a Creative Commons License, all supplemental material carries the same license as the article it is associated with.
For non-Open Access articles published, all supplemental material carries a non-exclusive license, and permission requests for re-use of supplemental material or any part of supplemental material shall be sent directly to the copyright owner as specified in the copyright notice associated with the article.