
Abstract
Background:
Experiences that a child or adolescent goes through play a critical role in their development as an individual. To understand the world of adolescents and their mental health and well-being, it would be important to be able to access their experiences. Therefore, an objective measure to assess experiences is necessary. The study aimed to develop a scale to assess experiences and establish their psychometric properties.
Materials and methods:
My Experiences Scale (MES) is a newly developed 50-item, multiple-choice, self-report measure. Various steps involved in developing the MES and establishing its psychometric properties have been elaborated. The study was carried out across four phases, and the sample consisted of 1,260 school-going children and adolescents. The participants were representative of both genders, a wide age range, and diverse socioeconomic backgrounds.
Results:
MES was found to have good internal consistency (Alpha 0.85) and test–retest reliability (0.96). MES was found to have significant correlations with Strengths and Difficulties Questionnaire and global self-worth.
Conclusions:
The newly developed experiences scale shows promising psychometric properties and a wide scope for application.
Understanding the experiences that children and adolescents go through is pivotal to understanding their mental health and well-being. The newly developed MES is an objective measure with sound psychometric properties. It enables clinicians and researchers to explore various experiences that children and adolescents go through.Key Messages:
I am the total sum of all my experiences.
—Lisa Brockwell, Lighthouse Centre for Learning.
From conception till we part from our mortal lives and everything that happens in between while we live are “experiences.” From a very early age, children are actively making sense of how things happen and assimilating it as memories of the events and experiences of their lives. 1
A child requires a conducive environment that is stable, enriching, and replete with positive interactions and nurturing relationships for reaching his/her full potential. 2 However, beyond an ideal world, children are also exposed to negative experiences. Abuse, neglect, traumatic events, accidents, medical emergencies, and many more are a wide range of negative experiences that can impact a child adversely. 3 Negative traumatic experiences can have a life-altering capacity, impacting the physical, emotional, cognitive, and social development of a child. These types of traumatic events and experiences in childhood further make them vulnerable to various psychological problems, psychiatric disorders, and medical illnesses. 4 Negative traumatic experiences have a much deeper impact than positive experiences; this may be attributed to emotionally arousing qualities of these experiences 5 as well as the survival and protective value they have against a future threat. 6
Considering the paramount importance of understanding experiences and their impact on a child/adolescent’s mental health and well-being, this is an important area of inquiry for research, clinical practice, and developmental understanding.
The paucity of reliable, valid measures that are truly representative of the significant experiences of a child/adolescent’s experience acts as a hindrance in further work.
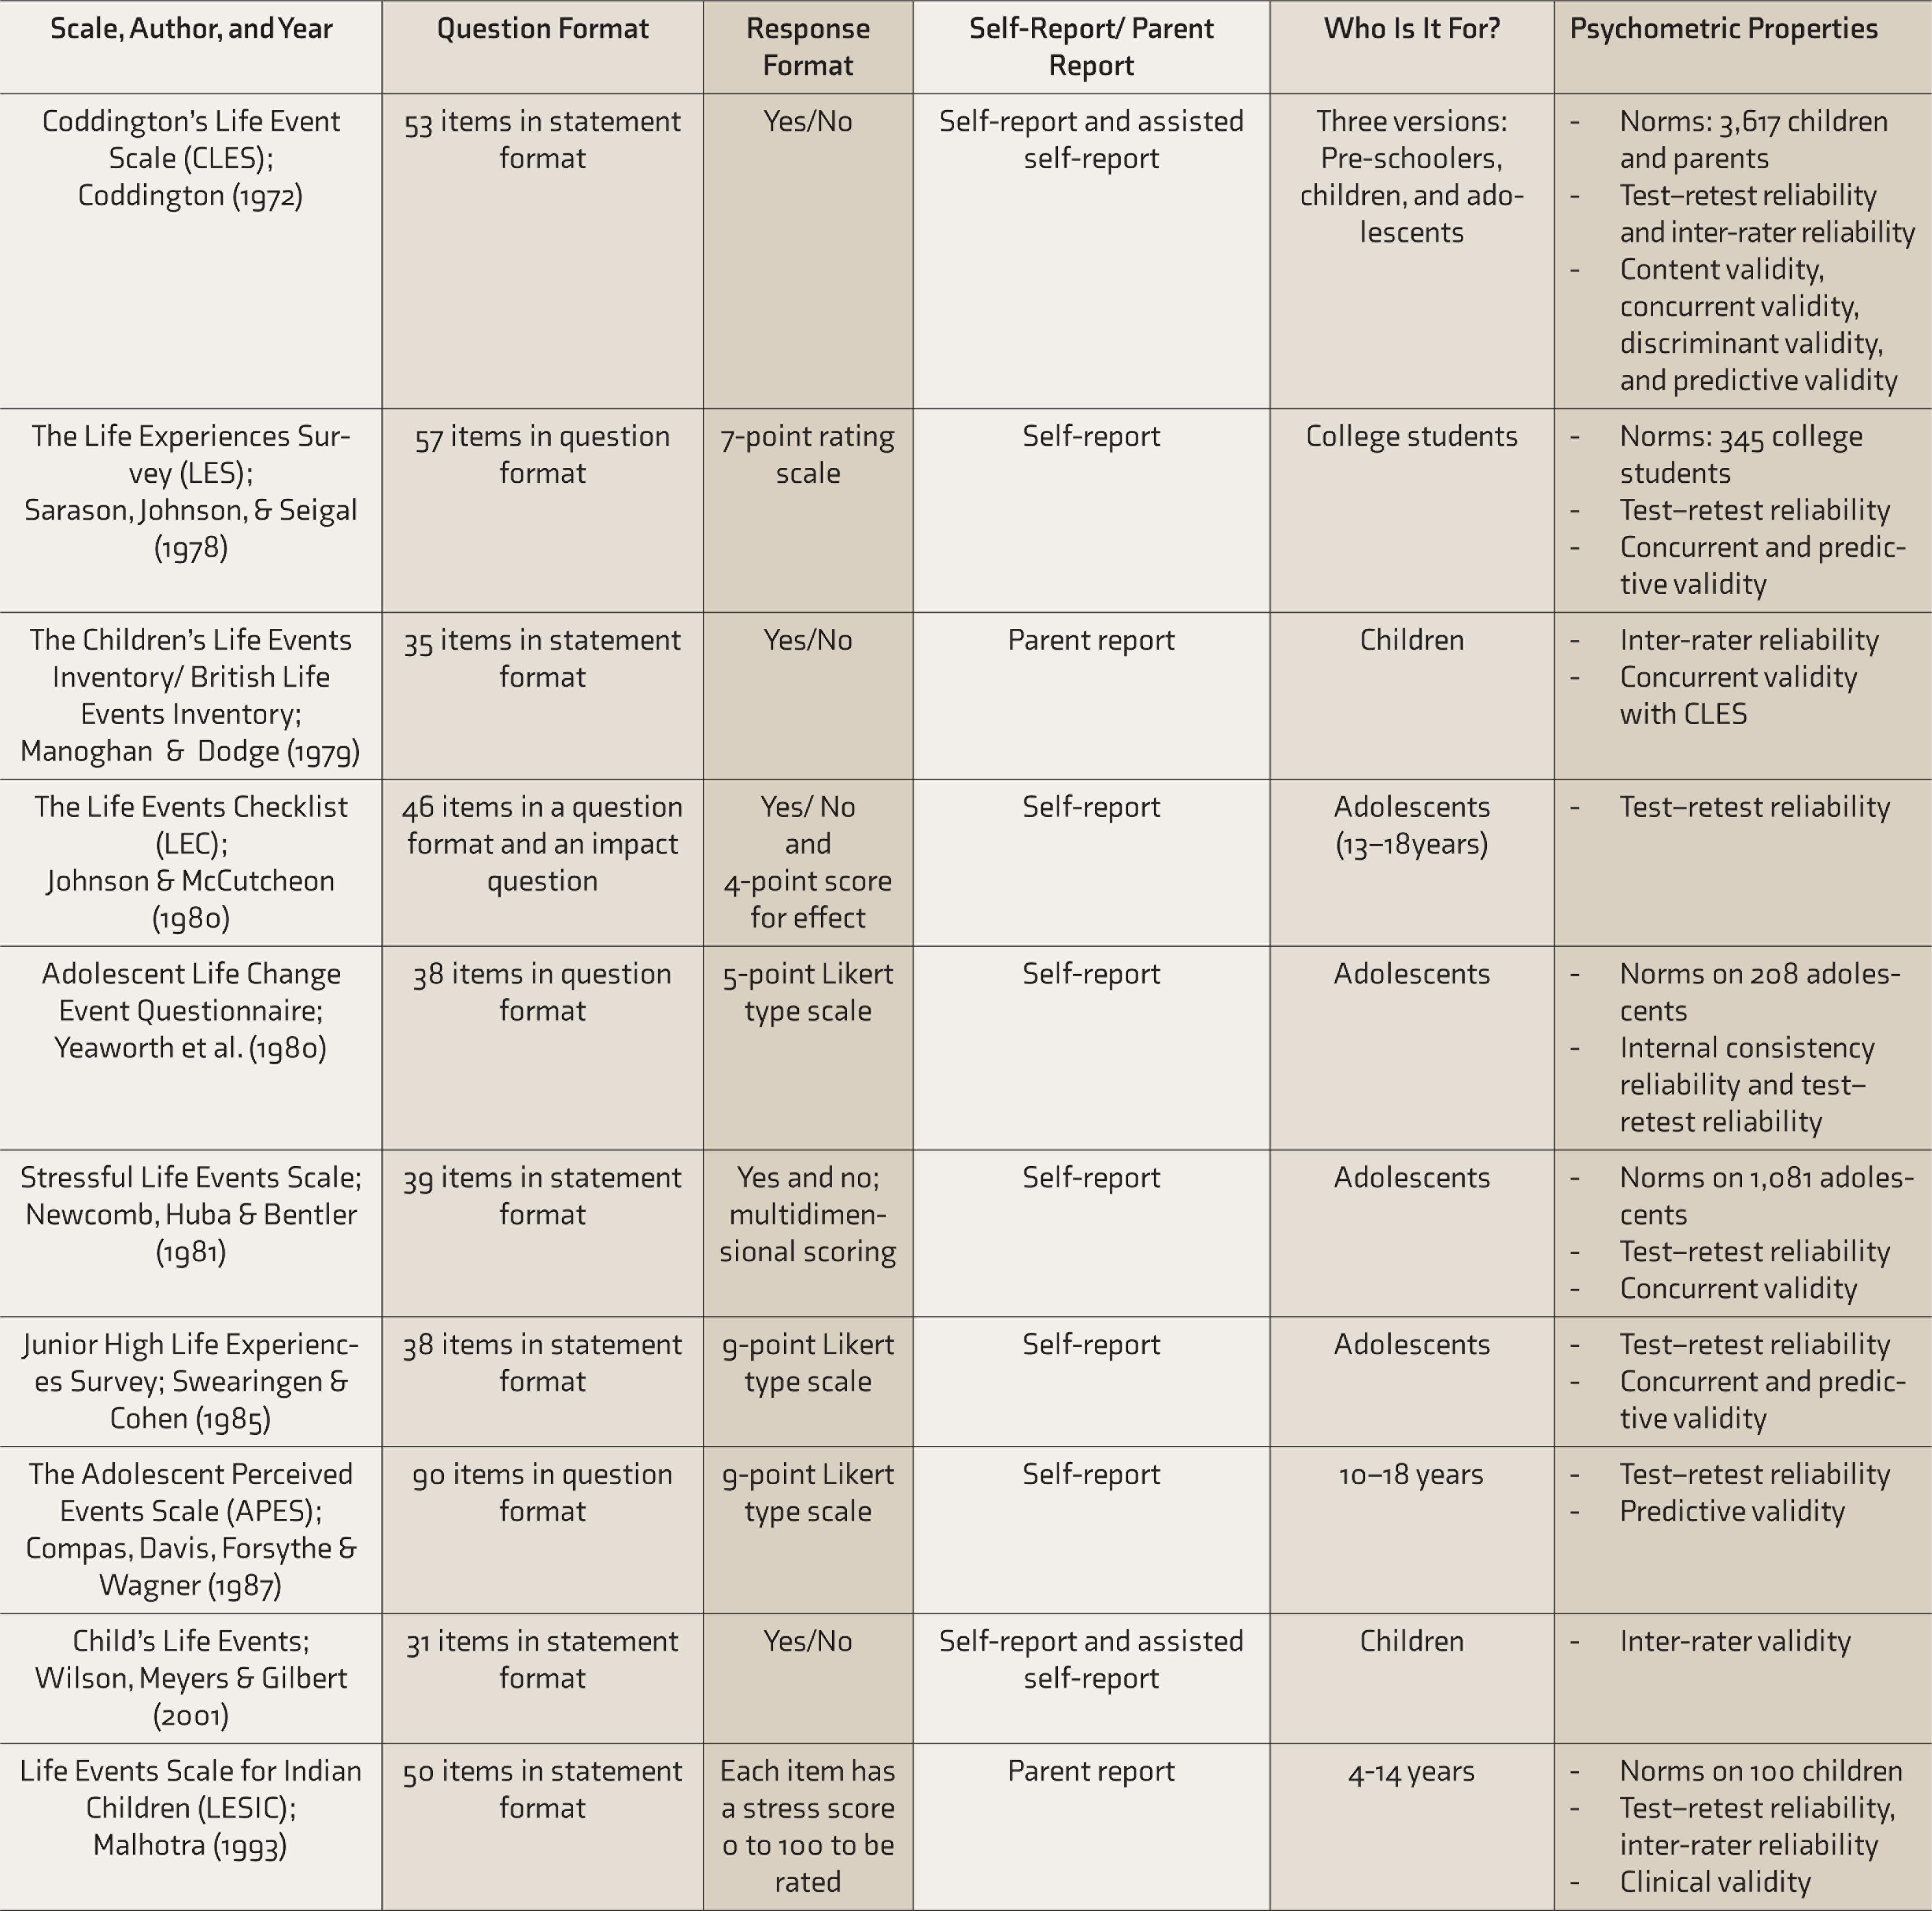
Table S1 clearly highlights that majority of the measures for assessing experiences are in the checklist format.7–10 Some of the scales reviewed were specifically for older adolescents and primarily assessed stressful events.11–15 The process of item generation for almost all the scales was through a review of the literature and they were standardized in the Western setting.
In the Indian setting, the Life Events Scale for Indian Children is a parent-report scale, and the clinical validity of the scale is promising. 16 The scale is adapted from the British Life Events Scale. 8 Apart from this, a careful evaluation of past research, as reported in a review of 50 years of research in National Institute of Mental Health and Neuro Sciences (NIMHANS), highlights that in India, experiences in children and adolescents are explored mainly through interviews. 17 The lack of reliable measures catering to the diverse socioeconomic-cultural background of India can be considered as an impediment to understanding and researching this imperative construct of “experience.” Given the paucity of standardized measures for the assessment of experiences, this study aimed at developing a standardized measure to assess the experiences of children and adolescents in India.
Available Scales to Assess the Experiences of Children and Adolescents
Material and Methods
The processes of constructing an experiences scale was initiated after the ethical considerations were reviewed and cleared by the Institutional Ethics Committee. This study is a part of the doctoral research of the first author, under the guidance of the second and third authors. The period of data collection was between November 2014 and March 2016.
Measures
Two measures were used in the study to establish the validity of the experiences scale.
The Strengths and Difficulties Questionnaire (SDQ) 18 : It is a behavioral screening tool with 25 statements, for children between 2 and 17 years of age. There are separate questionnaires available for younger children (2–4 years of age) and slightly older children (4–17 years of age). The questionnaire has parent completion, teacher completion, and self-report versions. It has five subscales with five items each: hyperactivity, emotional problems, conduct problems, peer problems, and prosocial behavior scale. Each item is scored as 0 for “not true,” 1 for “somewhat true,” and 2 for “certainly true.” The scores from the hyperactivity, emotional problems, conduct problems, and peer problems subscales can be summed to get total difficulties score ranging from 0 to 40. The SDQ has been used in various research studies in the Indian setting. 19 In this study, the self-report version was used.
Self-Perception Profile for Children 20 : The scale entitled “What I Am Like” is a revision of the Perceived Competence Scale for Children. This instrument consists of 36 items, 6 for each subscale. Each subscale taps five specific self-concept domains: scholastic competence, athletic competence, social competence, physical appearance, and behavioral conduct. Besides, a separate, sixth subscale taps global self-worth (or self-esteem). The subscales may be used separately based on the requirement of the study. In this study, The global self-worth subscale was used, which consists of six items and a sample item. An example of an item would be “Some kids are often unhappy with themselves, but other kids are pretty pleased with themselves.” The questions are designed in a format called “structured alternative format” to combat the tendency to give socially desirable responses and to provide participants with a range of response choices.
The scoring for each item is done on a four-point scale from 1 to 4, where a score of 1 indicates the lowest perceived competence or adequacy, and a score of 4 reflects the highest level of competence or adequacy. Starting at the left, items are scored as: Really True for Me = 1, Sort of True for Me = 2, Sort of True for Me = 3, and Really True for Me = 4. Reverse scoring is necessary for items 3, 4, and 5. Responses are then summed to produce a global self-worth score—the higher the score, the greater the child’s self-worth. Internal consistency reliability based on Cronbach’s alpha was found to be 0.84. The scale has been used previously for research in the Indian setting. 21
Procedure
The development of the experience scale was carried out in four phases. The objective, method, and results of each phase have been elaborated.
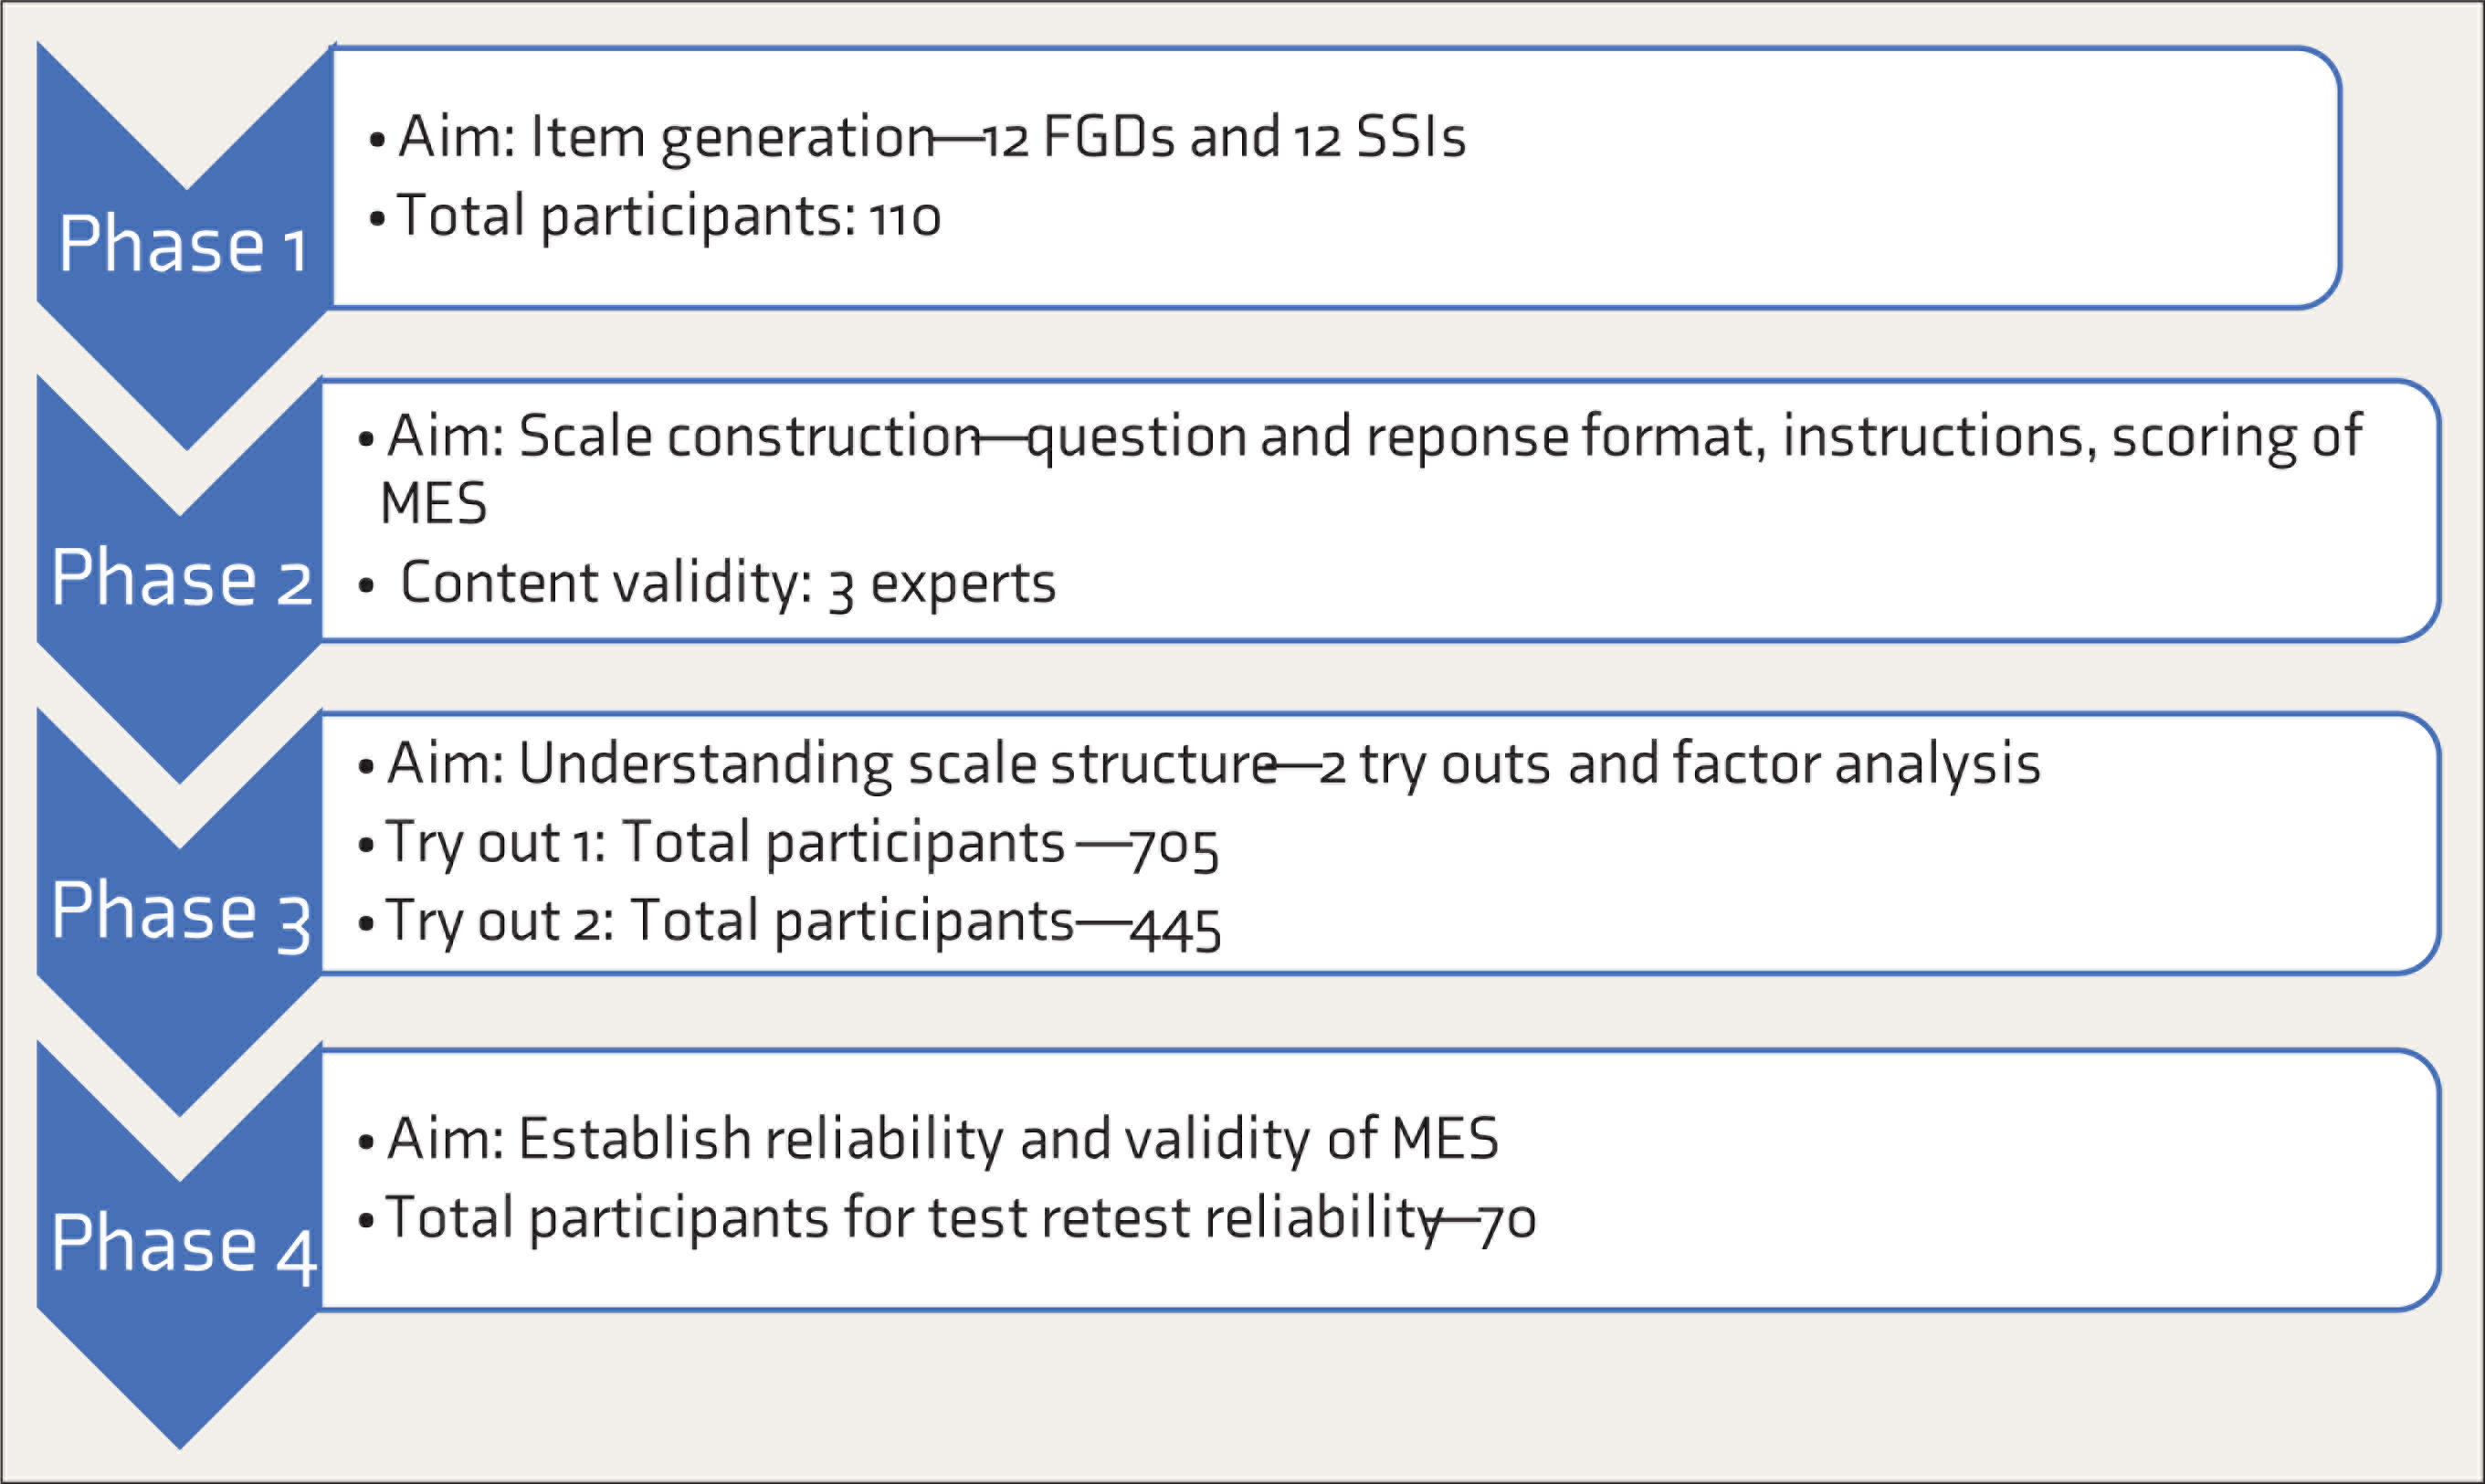
MES: My Experiences Scale; FGD: Focus Group Discussion; SSI: Semi Structured Interview.
The sample of the study comprised 1,260 participants from Bengaluru city of urban India. Sampling was purposive, and the participants were children and adolescents studying in six schools from different socioeconomic backgrounds (two schools catered to families from the higher socioeconomic background, one catered to families from the middle socioeconomic background, and three, to families from lower socioeconomic background). Nine schools were approached for the study, out of which six consented to participate. The participants were between the ages of 8 and 16 years. Efforts were taken to ensure that the sample had equal representation of both genders, age ranges, and socioeconomic backgrounds.
Written informed consent was taken from the heads of the schools and parents at every phase. Only after receiving the consent forms, written assent was taken from the child for participation in the study. They were explained that participation in the study was voluntary. Participants were assured of confidentiality, especially from school authorities, and were debriefed at the end of the interaction.
Phase 1
The objective of this phase was to generate items for the scale through focus group discussions (FGD) and semistructured interviews so that the scale is truly representative of the voices of the participants. Four schools of varied socioeconomic backgrounds consented to participate in this phase. Twelve FGD and semistructured interviews were carried out with 110 children and adolescents after consent was obtained from the school authorities and parents and assent from the participant. The participants were randomly chosen on receiving the parental consent form, to ensure an unbiased selection for FGD. To ensure optimum participation and to prevent the researcher from influencing the responses, it was decided to have minimal leads and probes for the discussions and the interview. The discussion focused on three major questions about what experiences are, various positive experiences, and various negative experiences. The opening question, leads, and probes were simplistic lay descriptions of positive and negative experiences. The age ranges (8–10 years, 11–13 years, and 14–16 years) ensured homogeneity within the groups. Since boys and girls were in separate groups, it ensured that there is less inhibition and more comfort in the discussion.
The group sizes ranged from 7 to 12 participants, and the mean (±SD) time of the 12 FGD was 35 (±7) minutes. For the 12 semistructured interviews, the mean time was 40 (±12) minutes. The study was carried out by the first author in library/games hour, ensuring that it did not disturb regular classes.
Phase 2
The objectives of this phase were the construction of the experiences scale and establishing its content validity. The phase started with item reduction, followed by finalizing the question format, response format, and scoring. This phase concluded by establishing the content validity of the scale.
Phase 3
The main objective of this phase was to understand the scale structure and item reduction. For this purpose, the scale was repeatedly administration to a large number of participants, and the responses were subjected to factor analysis.
Try-out 1 of MES was on a sample of 705 freshly recruited participants. A total of 897 parental consent forms were distributed, of which 705 parents consented to allow the students to participate in the study. Therefore, the participation percentage was 78.5%. The scale was administered in groups of 25–30 participants. The completed 705 questionnaires were number coded and entered in Microsoft Excel. The data set was then transferred to SPSS for factor analysis to be carried out.
Following the process of item reduction, the modified version of MES, along with the SDQ, was administered to a fresh sample of 445 participants after receiving parental consent. Efforts were made to match the background variable like the type of school, the background of the participants, and even area of the school to a large extent. This was done keeping in mind that the factor structure would perhaps get affected if there is a lot of difference in the type of sample in Try-out 2. For both the try-outs, the data were subjected to exploratory factor analysis, using principal component analysis and orthogonal rotation. The choice of rotation was based on the assumption that the new factors were not correlated.
Phase 4
The objective of this phase was to establish the reliability and validity of MES.
To establish test–retest reliability, the scale was re-administered to 70 participants after a gap of 15 days. At this point, the Global Self Worth Scale, 20 consisting of 6 items, was also given to the participants.
The newly developed scale was also translated and back-translated to Kannada and administered to Kannada-speaking children and adolescents. However, this article focuses on the English version of the MES and does not include any data on the Kannada version.
Results
Phase 1
The 12 audiotaped FGDs and semistructured interviews were transcribed, emerging themes were coded, and the content analyzed for item generation and understanding the construct of “experience.” The FGDs, once transcribed, were analyzed and reported using Kreuger’s manual on Analyzing and Reporting Focus Group Results. 22 Similarly, the semistructured interviews, once transcribed, were analyzed following the interpretative phenomenological analysis. 23
The themes and subthemes under positive and negative experiences were then categorized. The maximum themes in the domain of positive experiences reported were in the area of family relations (42%), followed by experiences in school (26%). Peer-relationships-related positive experiences themes and personal positive experiences themes were reported by 16% each.
Similarly, under the domain of negative experiences, the maximum negative experiences reported were in the domain of family relationships (32%). This was closely followed by personal experiences (17%), school-related experiences (15%), and abusive experiences (15%). Apart from this, negative experiences related to peer groups (12%) and experiences of societal pressure (9%) were also reported.
There were many subthemes under the broad themes in each domain of positive and negative experiences. SB and UH met to discuss the findings and reach a consensus regarding the dominant themes.
An exhaustive list of an initial pool of 75 items was sifted from the verbatims of the participants in the domains of positive and negative experiences.
Phase 2
The initial pool of 75 items was reduced to 60 items based on repetitiveness and relevance. The study aimed to develop a common self-report measure for both genders, for a wide age range of 8–16 years, and across different socioeconomic backgrounds; it was decided that only significant experiences that have been repeated across age ranges, socioeconomic backgrounds, and both genders would be retained.
Various formats of item presentation in self-report scales with children and adolescents were looked into. It was decided to frame the questions on the basis of four criteria: that they are direct, clear, precise, and relatively short. Keeping these criteria as a point of reference, it was decided to frame questions as “Have you experienced…?.” This would make the questions straightforward and less confusing, especially considering that the scale would be applicable across a heterogeneous sample of boys and girls from different age groups and different socioeconomic backgrounds.
The questions were framed in a way that they have closest resemblance to the verbatim provided by the participants in the FGDs and interviews.
Similarly, based on an extensive review of scales used to measure experiences, it was decided to have a four-point Likert type frequency measure indicating how often the experience has occurred: “Never,” “Once,” “A few times,” or “Many times.” This would be a simple format and address issues related to responders’ bias to mid-point ratings.
The scoring of the items was finalized as 0 (never), 1 (once), 2 (A few times), and 3 (Many times). There was a total of 40 items measuring negative experiences. Therefore, the maximum score for negative experiences is 3 × 40 = 120. Higher scores would indicate a higher number of negative experiences the child has been through. On the other hand, positive experiences were reverse-scored. There was a total of 20 items measuring them. Therefore, the maximum score on positive experiences is 3 × 20 = 60. Higher scores would indicate a lesser number of positive experiences. Total score is the sum of the positive and negative experiences scores. Higher total experience score would indicate more negative experiences and lesser positive experiences. Apart from the total score, the subscales of positive and negative experiences need to be looked into separately too. The scale was named My Experiences Scale (MES).
The content validity of the MES was established after being reviewed by three experts (two females and one male). The experts were mental health professionals with over 10 years of experience. Each expert was given the newly developed scale, instructions, scoring, and verbatim from which the items had been extracted. Apart from this, the experts were also given a feedback form with four criteria for evaluating the questions: wording, simplicity, clarity, and repetition. The experts had consensus on most of the items and provided their feedback about rewording certain items to simpler language, which was incorporated.
Sample Items and Response Format of MES
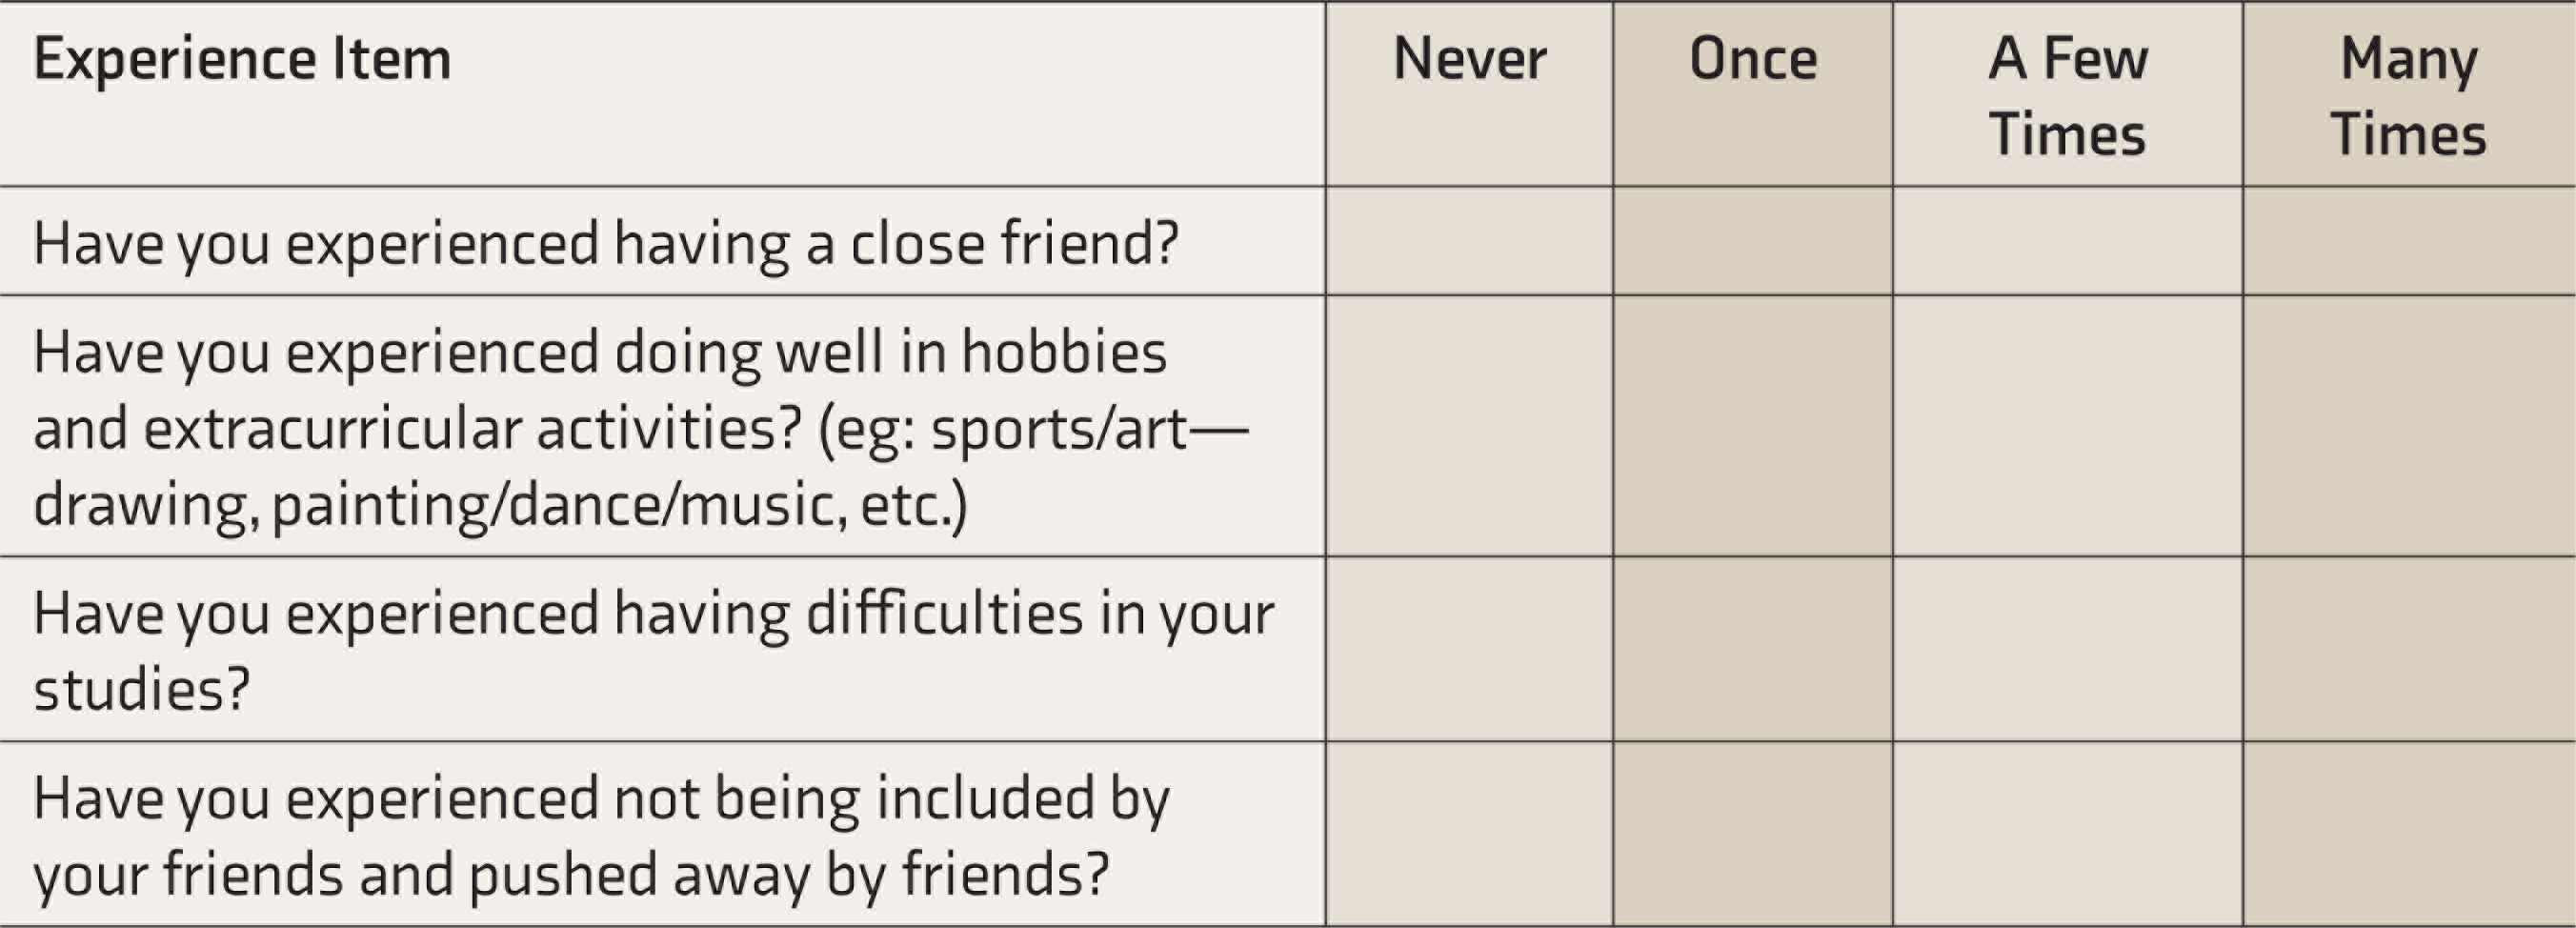
MES: My Experiences Scale.
Phase 3
In Try-out 1, the numbers of missing data were found for a total of 50 items, across the 705 questionnaires, which was found to be 0.12%, which is a negligible percentage. Exploratory factor analysis was carried out, and based on the Kaiser criterion, a total of 16 factors emerged, explaining 56.27% of the variance. Nine items were discarded in the first factor analysis. A new set of the scoring key was made, and the 51 items were rearranged randomly, forming the modified version of MES. The 16 factors that emerged were named, and the factor structure was understood.
In Try-out 2, the number of missing data was found for a total of 43 items, across the 445 questionnaires, which was found to be 0.99%, which was again a negligible percent. The data were subjected to exploratory factor analysis using principal component analysis and orthogonal rotation. Based on the Kaiser criterion, a total of 17 factors emerged, explaining 60.49% of the variance. However, in view of too many factors, and as quite a few factors had only one or two items, it was decided not to retain the factor analysis results for understanding the scale structure.
The possible range of scores on 51 items MES is 0–153. Higher score is indicative of a higher number of negative experiences and a lesser number of positive experiences.
Mean and SD on MES
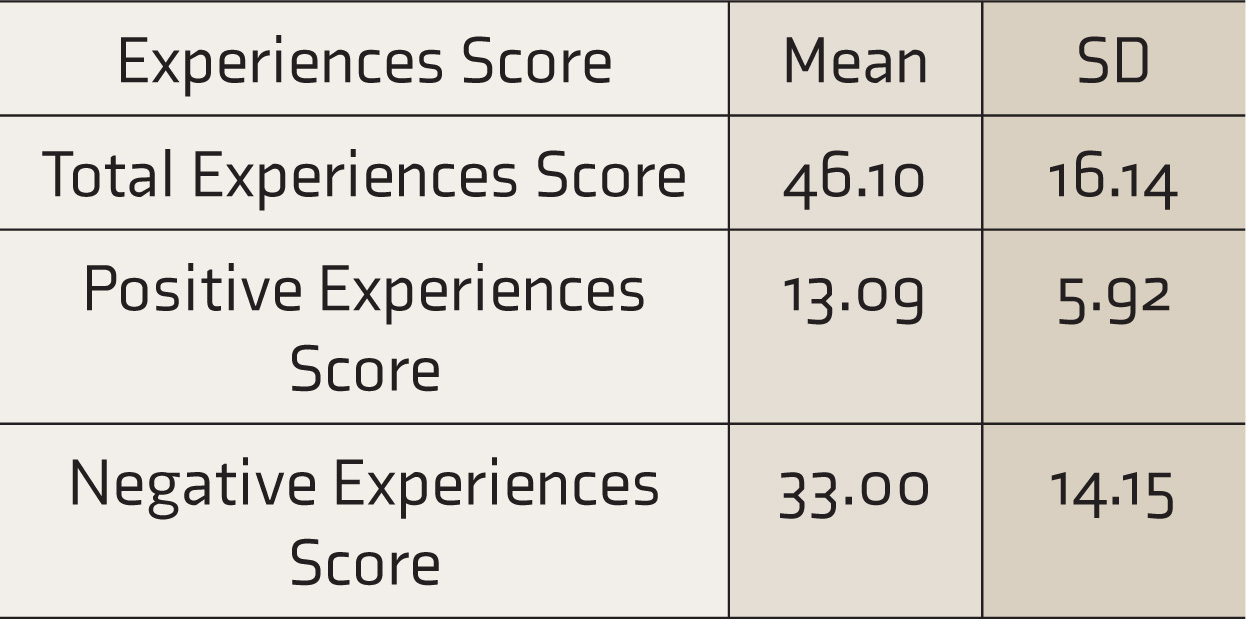
MES: My Experiences Scale, SD: standard deviation.
Phase 4
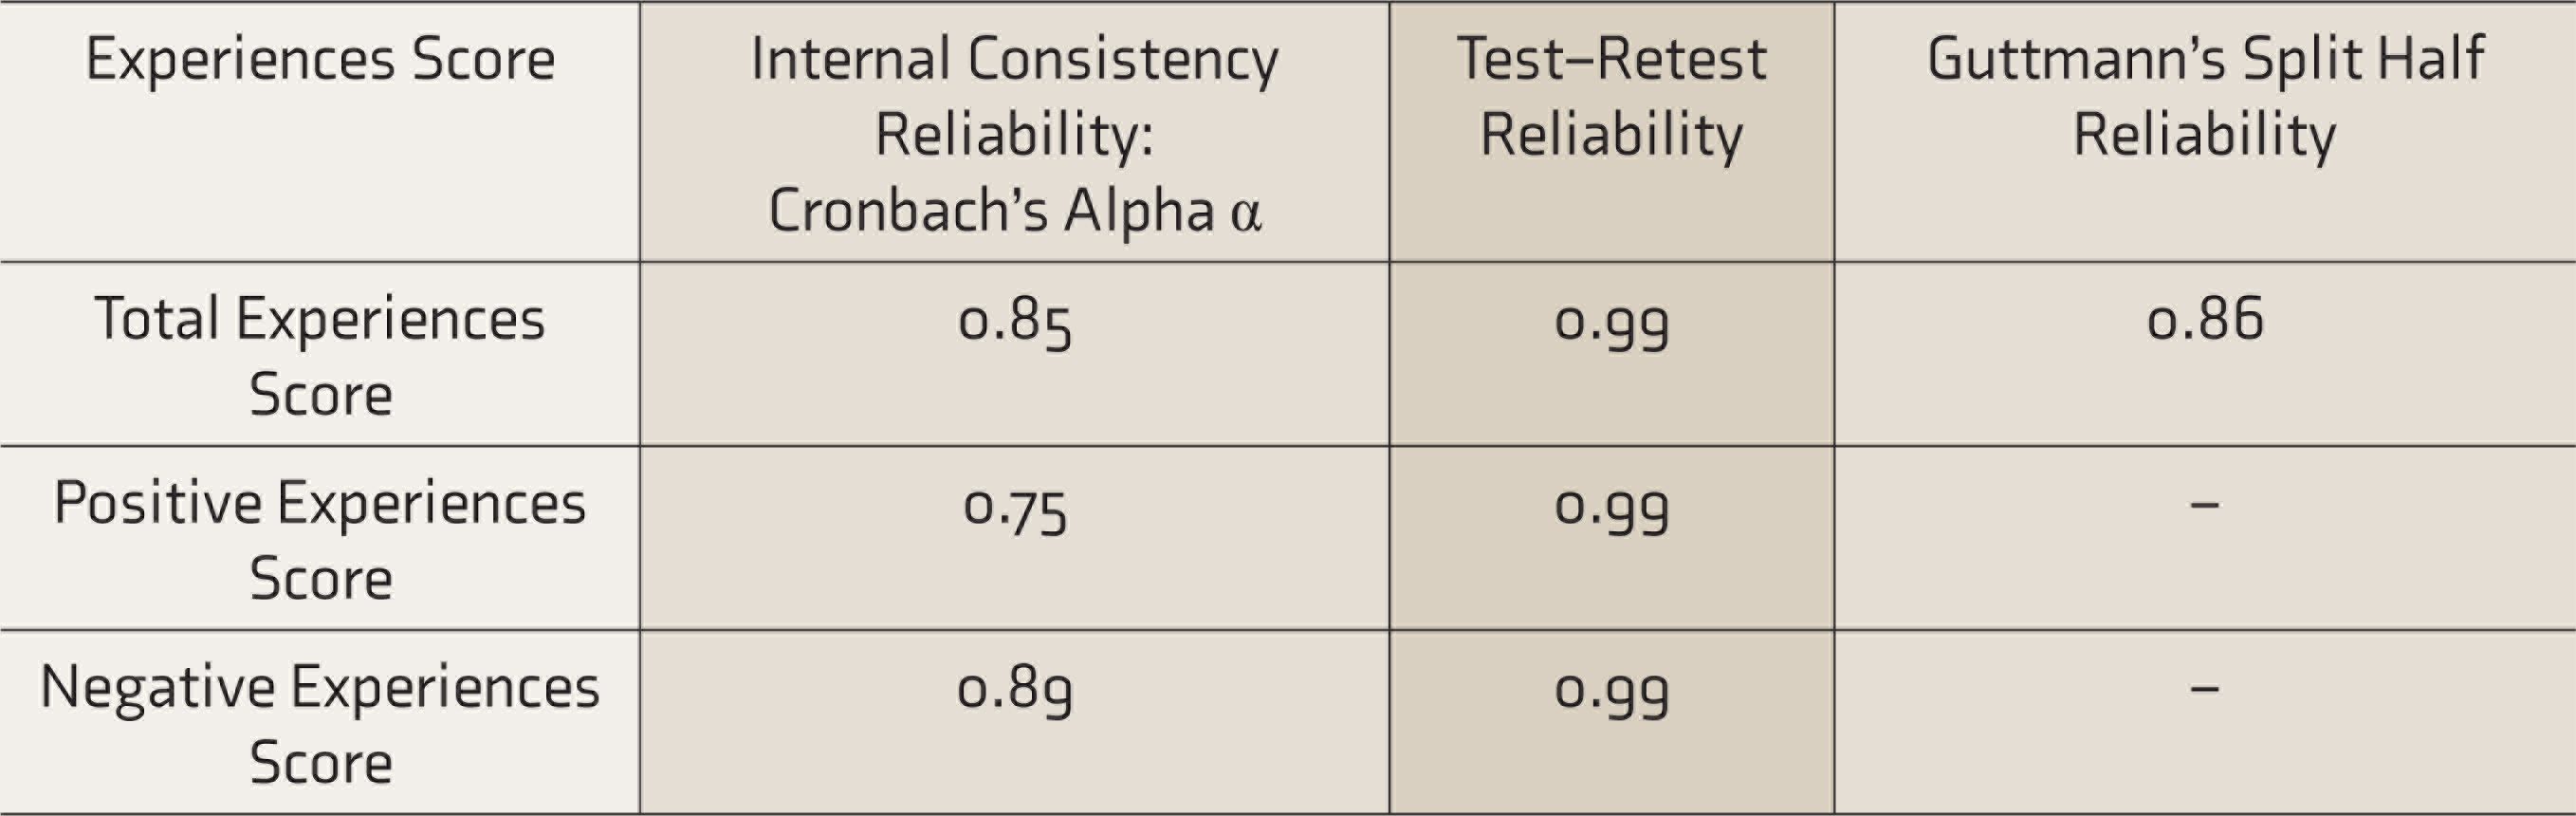
The internal consistency reliability of the scale calculated using Cronbach’s coefficient alpha was found to be good. Test–retest reliability was calculated by administering the test to 70 participants after a gap of 15 days. The test–retest reliability was found to be excellent by all standards. Guttmann’s split-half reliability is calculated by dividing the items in a test into two halves such that the covariance between scores on the two halves is as high as possible. The correlation coefficient was found to be good.
The total experiences score was significantly (P < 0.01) positively correlated with total difficulties, emotional problems, conduct problems, hyperactivity, and peer problems. This would imply that as the total experiences score increases (higher negative and lesser positive experiences), there would also be an increase in total difficulties, emotional problems, conduct problems, hyperactivity, and peer problems.
It was also found that the total experience score was significantly (P < 0.01) negatively correlated with prosocial behavior. This would imply that as the total experiences score increases (higher negative and lesser positive experiences), there would be a decrease in prosocial behavior.
Experiences score and global self-worth were significantly (P < 0.01) negatively correlated. This implies that as the experiences score increases (more negative experiences and lesser positive experiences), the self-worth reported by the participant was found to decrease.
These findings, in turn, establish the concurrent validity of the scale.
Discussion
The study set out to develop a scale to assess experiences in children and adolescents, across four phases. MES is a 50-item self-report scale to assess experiences in children and adolescents.
Reliability Correlation Scores of MES
Correlation Coefficient of Scores on MES with SDQ
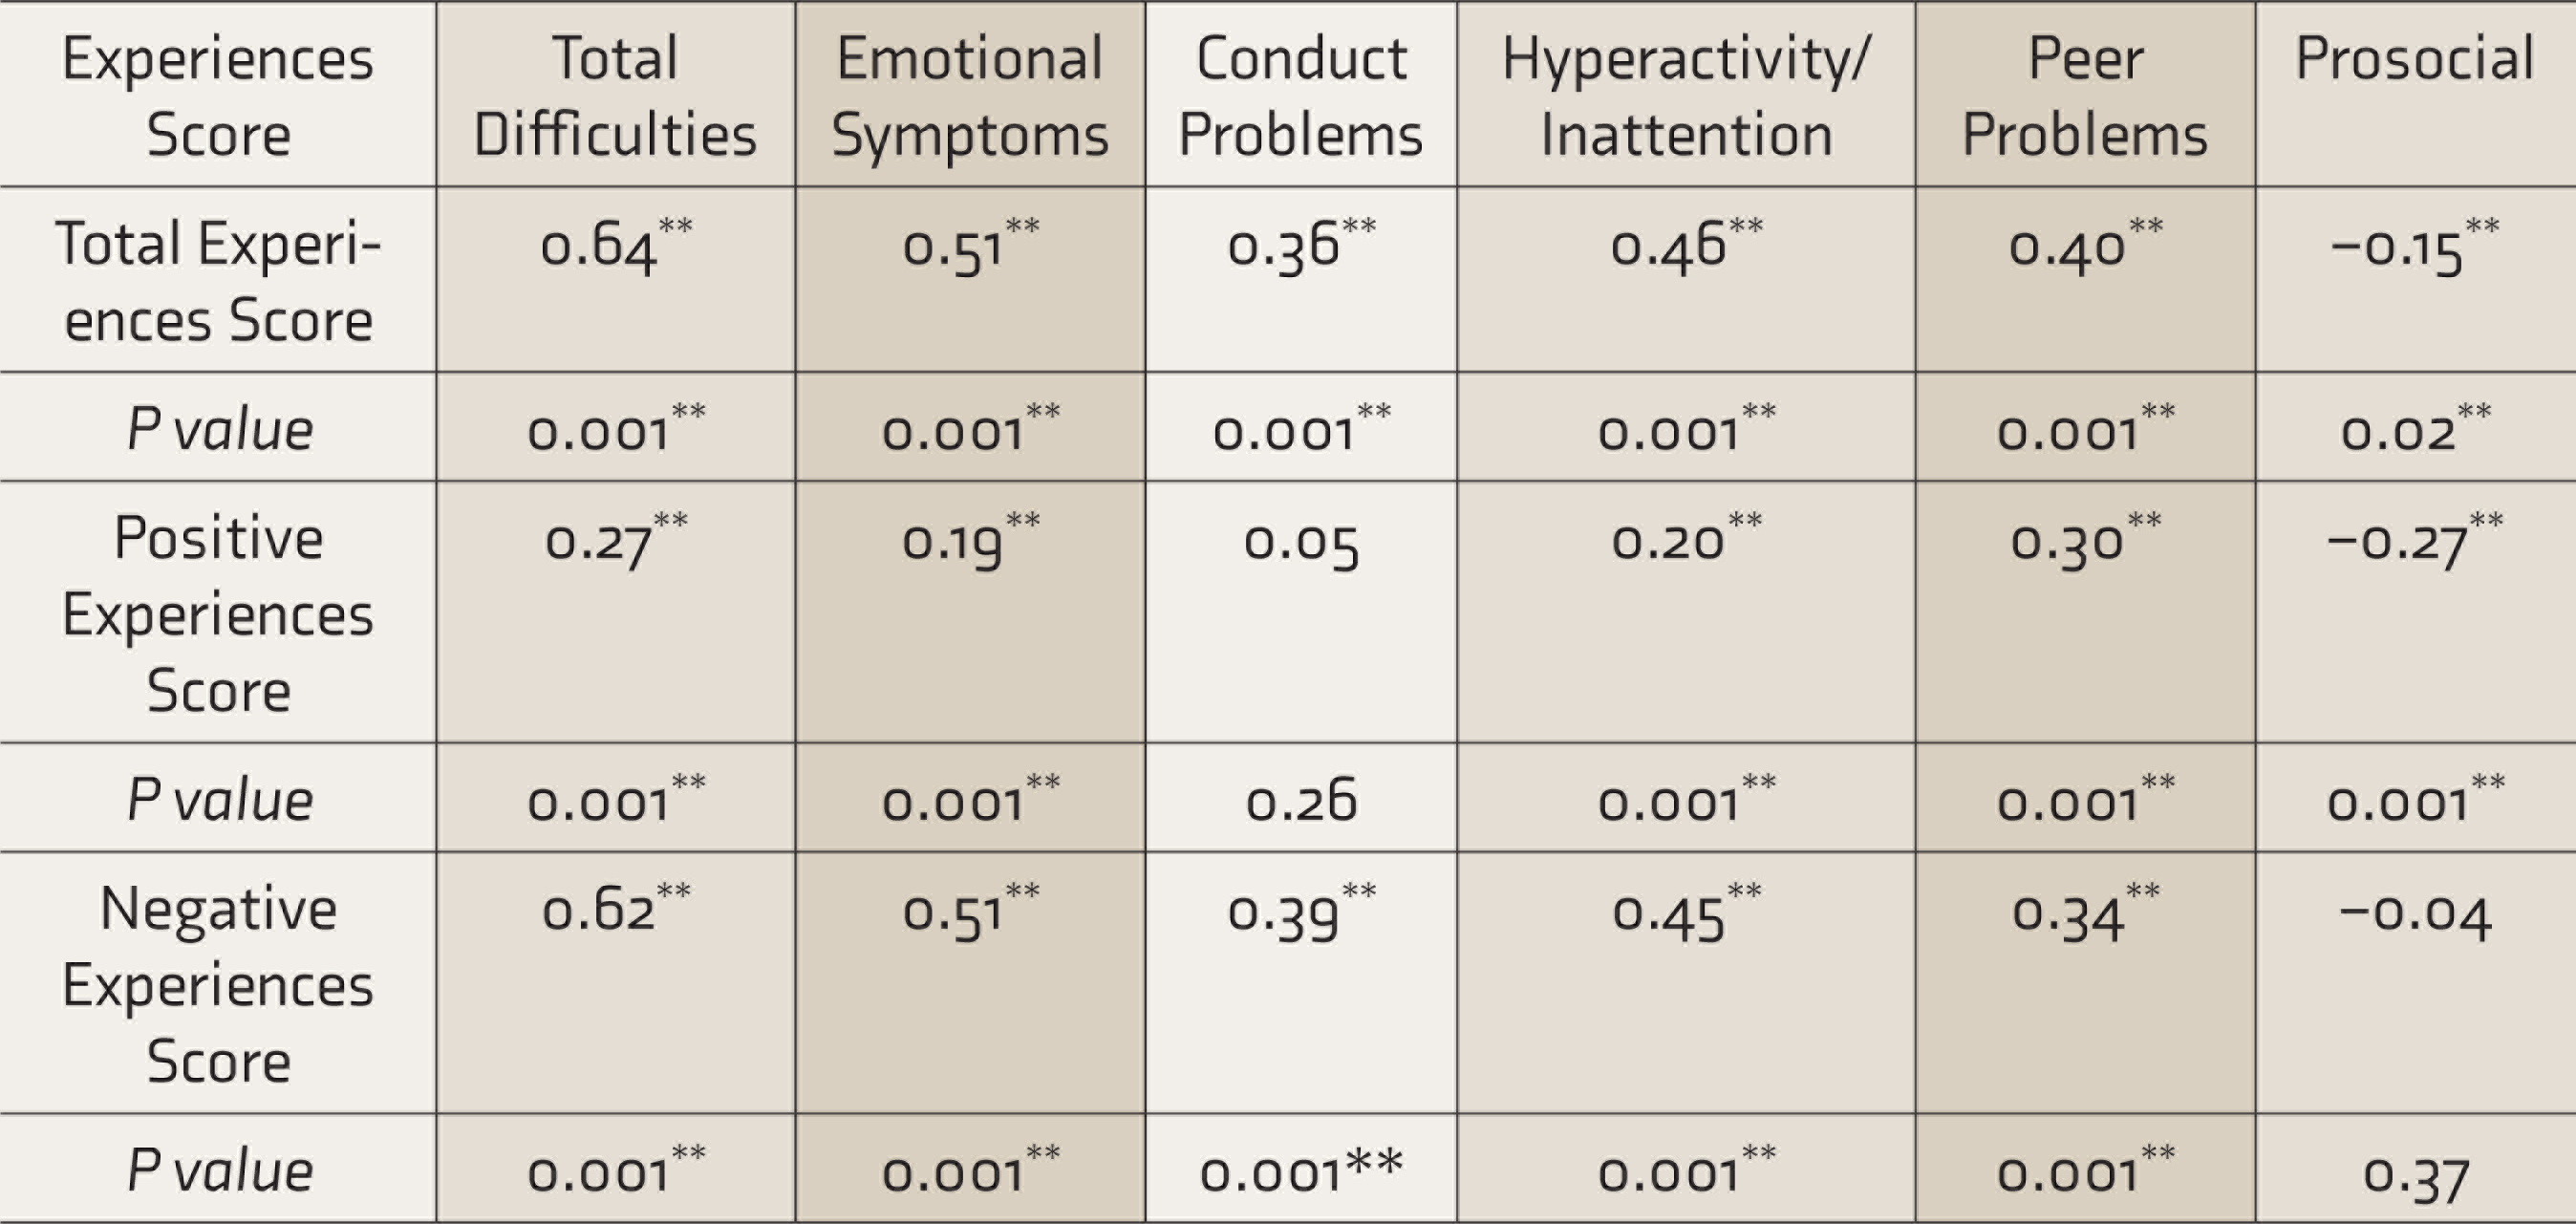
MES: My Experiences Scale, SDQ: strengths and difficulties questionnaire.**P < 0.01.
Phase 1 of the study focused on item generation through FGDs and interviews, which in turn contributed to further define the construct of experience. Phase 2 focused on scale construction.
Various formats of item presentation in self-report scales with children and adolescents were looked into. Most of the available event scales use the statement format (Table S1).7–9,11–13 In this study, it was decided to have a question format. Rigorous efforts were made to avoid framing questions that are ambiguous, double-barrelled, or with value-laden words and hypothetical questions.
The appropriate response format for the questions was found to be a 4-point frequency measure indicating how often the experience has occurred and it was finalized for the scale. This addresses issues about responders’ bias to mid-point rating when compared to previous events scales, as seen in Table S1, which were found to use a 9-point,14,15 7-point, 11 or 5-point Likert type scales for exploring experiences. 12
The intent of wording items both positively and negatively within the same scale is usually to avoid an “acquiescence,” “affirmation,” or “agreement bias.” These are interchangeable terms that refer to a respondent’s tendency to agree with the items irrespective of their content. 24 Similarly, reverse scoring also addresses one of the inherent flaws of survey methods, response bias.
The third phase of the study focused on further item reduction and understanding the structure of the newly developed MES using exploratory factor analysis. The first administration had a sample size of 705 and the second administration had a sample size of 445. Researchers suggest a ratio of about 5–10 subjects per item up to about 300 subjects. They suggest that when the sample is as large as 300, the ratio can be relaxed. 25 Therefore, the sample size for each administration was more than adequate. Items with a factor loading of less than 0.35 were dropped. This is as per the practice in social sciences to retain items with a minimum cutoff of 0.35. 26
The rationale for the two try-outs was primarily item reduction and understanding the scale structure. The researchers were hopeful that the second try-out might yield lesser factors; however, that was not the case. Two-factor models were attempted while analyzing the data; however, it was not found appropriate. Similarly, scree plot analysis also could not explain the dimensionality of the scale adequately. Confirmatory factor analysis could not be done due to the higher number of factors. It was then understood, after discussion with experts in the field as well as the qualitative analysis in phase 1 that it has more to do with the construct of experience itself. 27 Factor analysis may not be an appropriate statistical tool to understand the scale structure of a tool measuring the construct of experience. Further, none of the reviewed events and experiences scales had used factor analysis.
The scale also had promising findings on reliability with respect to Cronbach’s coefficient alpha, test–retest reliability, and Guttman’s split-half coefficient. Similarly, various forms of validity further strengthen the scale—construct validity, content validity, factorial validity, and concurrent validity.
With respect to limitations of the study, in spite of efforts taken to ensure optimum comfort in FGDs for participants to share their experiences, some experiences may not have been captured due to fear of being judged or evaluated (eg, experimentation with substances and pornography). The content validity of the scale could have been more comprehensive, with more experts from different backgrounds. Further, the data pertaining to consensus could have been analyzed statistically. Information about the child’s temperament, family relations, and academic problems were not explored. These variables could have contributed to a richer discussion but were beyond the scope of the study.
Work can be extended on the clinical validity of the scale in future research. The scale serves as a preliminary screening measure; the findings of the scale would need to be followed up with an interview. Subsequent research can also work towards developing a semi-structured interview format that can be followed up with after administration of MES for a structured enquiry about the responses of the participant.
Correlation Coefficient of Scores on MES with Global Self-Worth
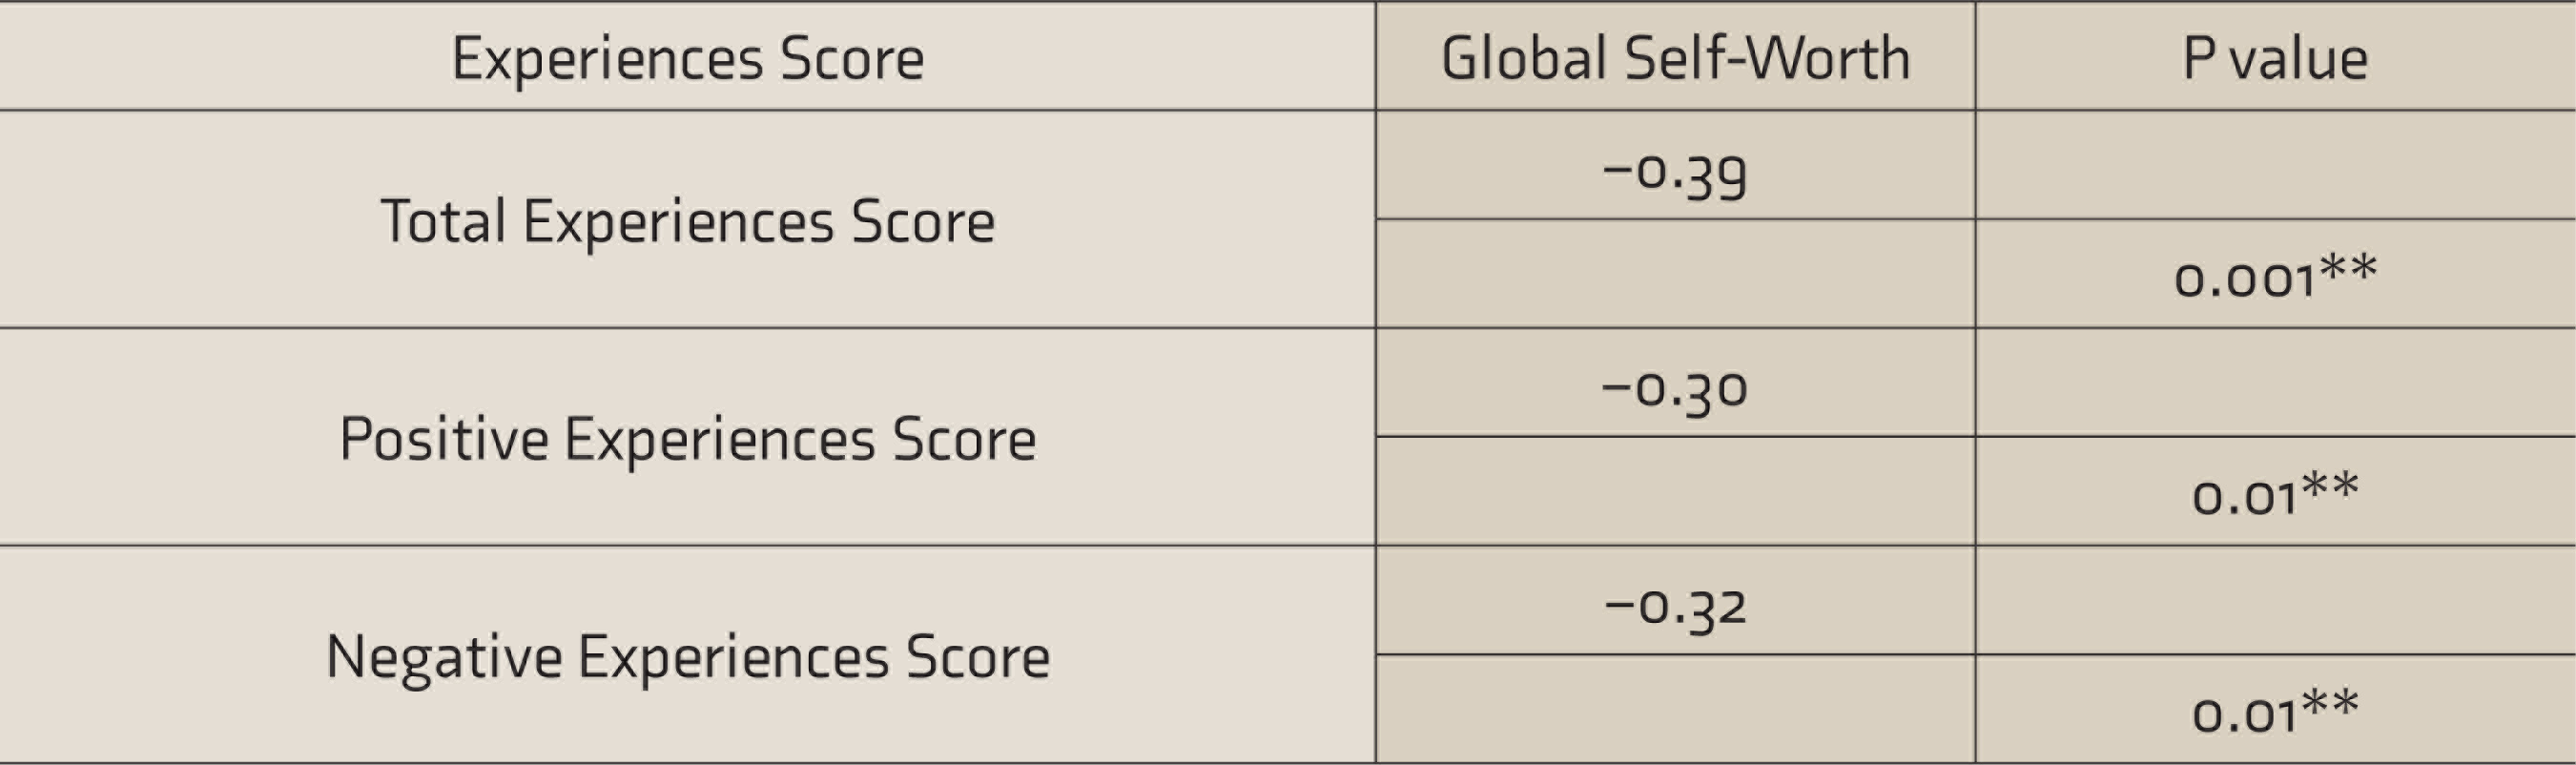
MES: My Experiences Scale. **P < 0.01.
Conclusions
The study brings clarity to the construct of experience and has developed a reliable and valid tool to assess experiences with children and adolescents in India. This sets a stable platform to extend research about the experiences of children in India. Experiences of children from different circumstances can be explored to a large extent, especially children from difficult circumstances and those in conflict with the law. The scale contributes to the area of assessment measures. The scale is a comprehensive measure of experience and goes beyond symptoms, thereby providing an experiential viewpoint about the pathology rather than a symptomatic viewpoint as often seen in the clinical setting. The findings also provide direction in therapy and will aid in the identification of domains of therapeutic work with children and adolescents. The findings on the experience measure can tap on experiences of subclinical populations where the manifestation of symptoms is often subtle and hence neglected.
Finally, efforts were taken to ensure that MES was developed “by the children and for the children” and that it echoes the voices of all the enthusiastic participants.
Supplemental Material
Supplemental material for this article is available online.
Footnotes
Declaration of Conflicting Interests
The author declared no potential conflicts of interest with respect to the research, authorship, and/or publication of this article.
Funding
The authors disclosed receipt of the following financial support for the research, authorship, and/or publication of this article: The paper is a part of the doctoral research work of the corresponding author. The author was a NIMHANS fellowship scholar for PhD.
References
Supplementary Material
Please find the following supplemental material available below.
For Open Access articles published under a Creative Commons License, all supplemental material carries the same license as the article it is associated with.
For non-Open Access articles published, all supplemental material carries a non-exclusive license, and permission requests for re-use of supplemental material or any part of supplemental material shall be sent directly to the copyright owner as specified in the copyright notice associated with the article.