
Abstract
Background:
Normal personality development, gone awry due to genetic or environmental factors, results in personality disorders (PD). These often coexist with other psychiatric disorders, affecting their outcome adversely. Considering the heterogeneity of data, more research is warranted.
Methods:
This was a cross-sectional study on personality traits in psychiatric patients of a tertiary hospital, over 1 year. Five hundred and twenty-five subjects, aged 18–45 years, with substance, psychotic, mood, or neurotic disorders were selected by convenience sampling. They were evaluated for illness-related variables using psychiatric pro forma; diagnostic confirmation and severity assessment were done using ICD-10 criteria and suitable scales. Personality assessment was done using the International Personality Disorder Examination after achieving remission.
Results:
Prevalence of PD traits and PDs was 56.3% and 4.2%, respectively. While mood disorders were the diagnostic group with the highest prevalence of PD traits, it was neurotic disorders for PDs. Patients with PD traits had a past psychiatric history and upper middle socioeconomic status (SES); patients with PDs were urban and unmarried. Both had a lower age of onset of psychiatric illness. Psychotic patients with PD traits had higher and lower PANSS positive and negative scores, respectively. The severity of personality pathology was highest for mixed cluster and among neurotic patients. Clusterwise prevalence was cluster C > B > mixed > A (47.1%, 25.2%, 16.7%, and 11.4%). Among subtypes, anankastic (18.1%) and mixed (16.7%) had the highest prevalence. Those in the cluster A group were the least educated and with lower SES than others.
Conclusions:
PD traits were present among 56.3% of the patients, and they had many significant sociodemographic and illness-related differences from those without PD traits. Cluster C had the highest prevalence. Among patients with psychotic disorders, those with PD traits had higher severity of psychotic symptoms.
Keywords
More than half of psychiatric patients have personality pathology. Patients with personality disturbance have an early presentation and, in some, more severe symptoms of psychiatric disorders. “Cluster C” had the maximum frequency, whereas persons with “mixed” traits had the most severe personality disturbance. Mood and neurotic disorders had the maximum personality disorder traits and personality disorders, respectively.Key Messages:
Normal personality development, once gone awry due to factors including genetic, psychological, environmental, or cultural, results in personality disorder (PD). 1 Based on common characteristics, PDs are often divided into clusters A, B, and C. 2 Personality traits, some in excess or in deficiency, correlate positively with PDs. 3 PDs often coexist with other psychiatric disorders, adversely affecting the outcome of the latter. 4 Diagnostically subthreshold personality difficulties are associated with marked psychiatric symptoms and negatively affect well-being; with an increase in personality dysfunction, the psychiatric symptoms further deteriorate too. However, viewing current diagnostic criteria of ICD-10, personality difficulties per se do not allow for a diagnosis, making their dimensional assessment highly important.5,6 With changing paradigm in diagnosing PDs in upcoming ICD-11 based on personality domains, higher domain traits are positively associated with PD severity. 7 Thus, early assessment and treatment of dysfunctional traits is imperative. However, the assessment gets difficult due to lack of culture-specific tools for PD severity, limited time in outpatient setting, and reluctance of clinicians.8–10 While Indian studies had shown 21.55% inpatients and 1.07% outpatients to have PD,11,12 studies from other countries had shown 14.5% having personality difficulties. 5 Considering the heterogeneity and little data on personality disorder traits’ (PD traits) impact on other psychiatric disorders, 13 more research is warranted. Hence, this study aims to assess the pattern of PD traits in psychiatric patients and the association between current psychiatric disorder and the underlying traits.
Materials and Methods
Study Setting and Design
It was a cross-sectional study conducted in the Psychiatry Department of Guru Gobind Singh Medical College and Hospital, Faridkot, Punjab. Data collection was done from March 2018 to March 2019. The Institutional Ethics Committee approved the study.
Sample Size Calculation
The prevalence of PDs ranged from 1.07% to 21.55% in various studies.11,12 In another study, the prevalence of personality difficulty, rather than disorders, was 14.5%.
5
For the current study, 20% error was taken for calculating sample size
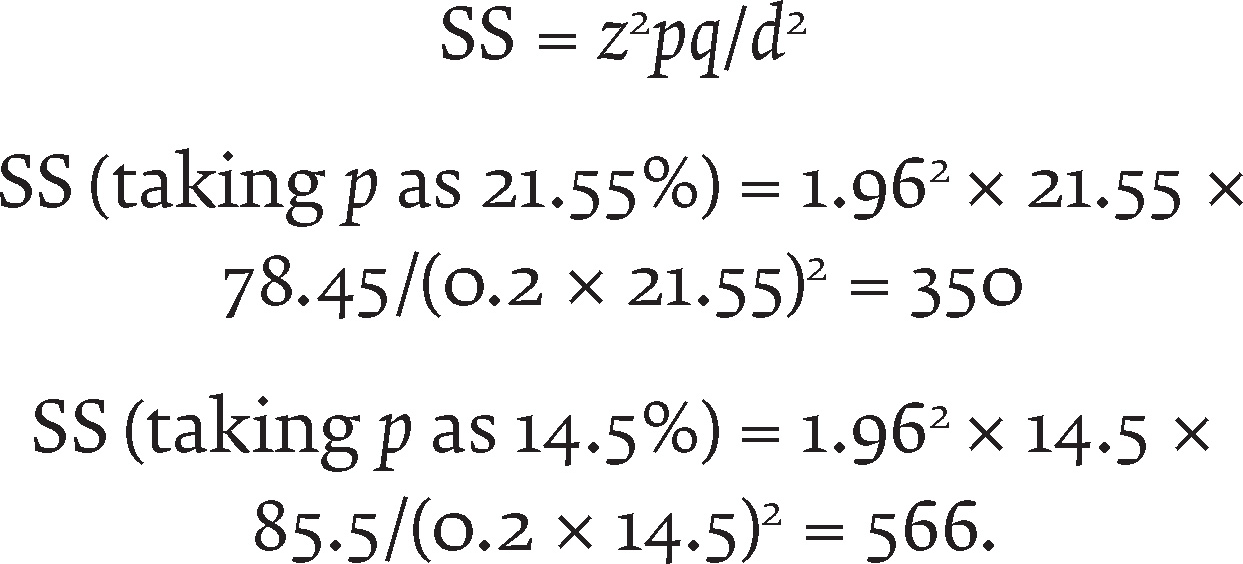
Considering the patients’ availability during the stipulated period of 1 year and the feasibility, the study’s final sample size was 525.
Inclusion and Exclusion Criteria
Subjects giving written informed consent, aged 18–45 years, and meeting ICD-10 criteria for substance use/psychotic/mood/neurotic disorders were included. Subjects with intellectual disability, head injury, neurological illness, or severe cardiorespiratory or other medical illnesses were excluded.
Study Procedure
Written informed consent was obtained from subjects and caregivers. Caregivers’ consent was taken to corroborate history and incidences explaining personality pathology, wherever applicable. Subjects were selected as per the inclusion and exclusion criteria and then evaluated for sociodemographic and illness-related variables. A consultant made the final diagnosis as per the ICD-10 diagnostic guidelines.
Further confirmation and assessment of symptom severity of psychiatric disorder were done using any of the following suitable structured scales: SDS—Severity of Dependence Scale (substance use disorders), 14 PANSS—Positive and Negative Syndrome Scale (psychotic disorders), 15 Hamilton Rating Scale for Depression (bipolar depression 16 and major depression), Young’s Mania Rating Scale (bipolar mania), 17 Y-BOCS—Yale– Brown Obsessive Compulsive Scale (obsessive–compulsive disorder— OCD), 18 and Patient Health Questionnaire–Somatic, Anxiety and Depression Symptoms Scale (anxiety, stress-related, somatoform, and other neurotic disorders). 19
The patients were subjected to appropriate investigations justifying inclusion/exclusion criteria (routine investigations of complete blood counts, liver and renal functions, blood sugar, serum electrolytes, viral markers, ECG, and chest X-ray; specific investigations like EEG or CT head, wherever required).
Enrolled patients were then subjected to the International Personality Disorder Examination (IPDE)-ICD-10 module, 20 which is a semistructured interview designed to assess PDs. IPDE was administered by a trained resident in the department, under the guidance of a consultant psychiatrist. Patients were subjected to IPDE only after achieving satisfactory remission from their current symptomatology, either in the stabilization/maintenance phase of treatment, to prevent confounding. Scoring is based on dimensional scores, which represent the PD’s unique characteristics. If a set number of criteria are met, it warrants diagnosis of the PD. IPDE has been validated previously by many professionals working in mental health field for assessment of personality dimensions. With respect to reliability, IPDE holds an overall weighted kappa value of 0.72 (pp. 79–80 of IPDE Manual). Kappa values for individual PD dimensions range from 0.71 to 0.90 (median 0.82). The manual elaborates on PDs being an exaggerated expression of traits; the dimensional scores thus elicit the same with high accuracy.
In the present study, PD traits were assessed using IPDE’s dimensional/criteria scores. Patients scoring positive for at least one dimension in any PD criteria were considered to have PD trait(s). To check for accuracy of this “one-dimensional” criterion for the presence of PD trait(s), a pilot study on 20 subjects was conducted in the department. Cronbach’s alpha was found to be 0.823. Construct validity was invoked by comparing the scale with detailed clinical interviews conducted by four consultants and found valid. In this way, the pattern of PDs and traits was assessed.
Association, if any, between psychiatric disorder and PD traits was assessed using appropriate statistical analysis. Following groups were made of psychiatric disorders as per ICD-10: Group A (substance use disorders—F10-F19), Group B (psychotic disorders—F20-F29), Group C (mood disorders—F30-F39), and Group D (neurotic, stress-related and somatoform disorders—F40-F48). Due to scale differences for measuring the severity of psychiatric disorders, Group C was divided into groups C1 (bipolar mania) and C2 (bipolar depression, major and recurrent depression). Similarly, Group D was divided into groups D1 (OCD) and D2 (anxiety, stress-related and somatoform disorders, excluding OCD).
Statistical Analysis
The data were entered in Microsoft Excel and analyzed using IBM SPSS v20.1. Descriptive statistics for categorical variables are presented in the form of frequencies, and continuous variables, in the form of mean and standard deviation. Association between various parameters was explored using Pearson’s chi-square test. P values of significance were determined, and values <0.05 were considered significant. Comparisons of mean score variables were made using the independent sample t test and one-way ANOVA test. Comparison between uneven samples was done using the Kruskal–Wallis test. Bonferroni correction was done where multiple comparisons were made.
Results
A total of 525 subjects were initially included. However, after an initial screening, we excluded 24 patients who did not fulfill the inclusion/exclusion criteria. The final analysis was thus conducted on 501 patients.
As shown in Table 1, PD traits were detected in 282 (56.3%) patients, and mood disorders were the diagnostic group with the highest prevalence. Among PD-trait clusters, the maximum was seen for cluster C and minimum for cluster A. Significant results were found for cluster A traits, which were minimum in neurotic (P = 0.001) and maximum in psychotic patients (P = 0.002). Overall, cluster C traits had a higher frequency (46.8%), and were more prevalent in neurotic disorders than in other diagnostic groups (P < 0.001). All psychiatric disorder groups had cluster C traits as the most common, except substance use disorders, in which cluster B was the most common. Across diagnoses, the most and least common PD-trait types were anankastic and borderline, respectively. Twenty-one (4.2%) patients had a PD, with 6, 8, and 7, respectively, in clusters A, B, and C; cluster B was seen only in the mood disorders group, significantly higher than rest (P = 0.004; after correction).
Distribution of Patients According to Personality Characteristics
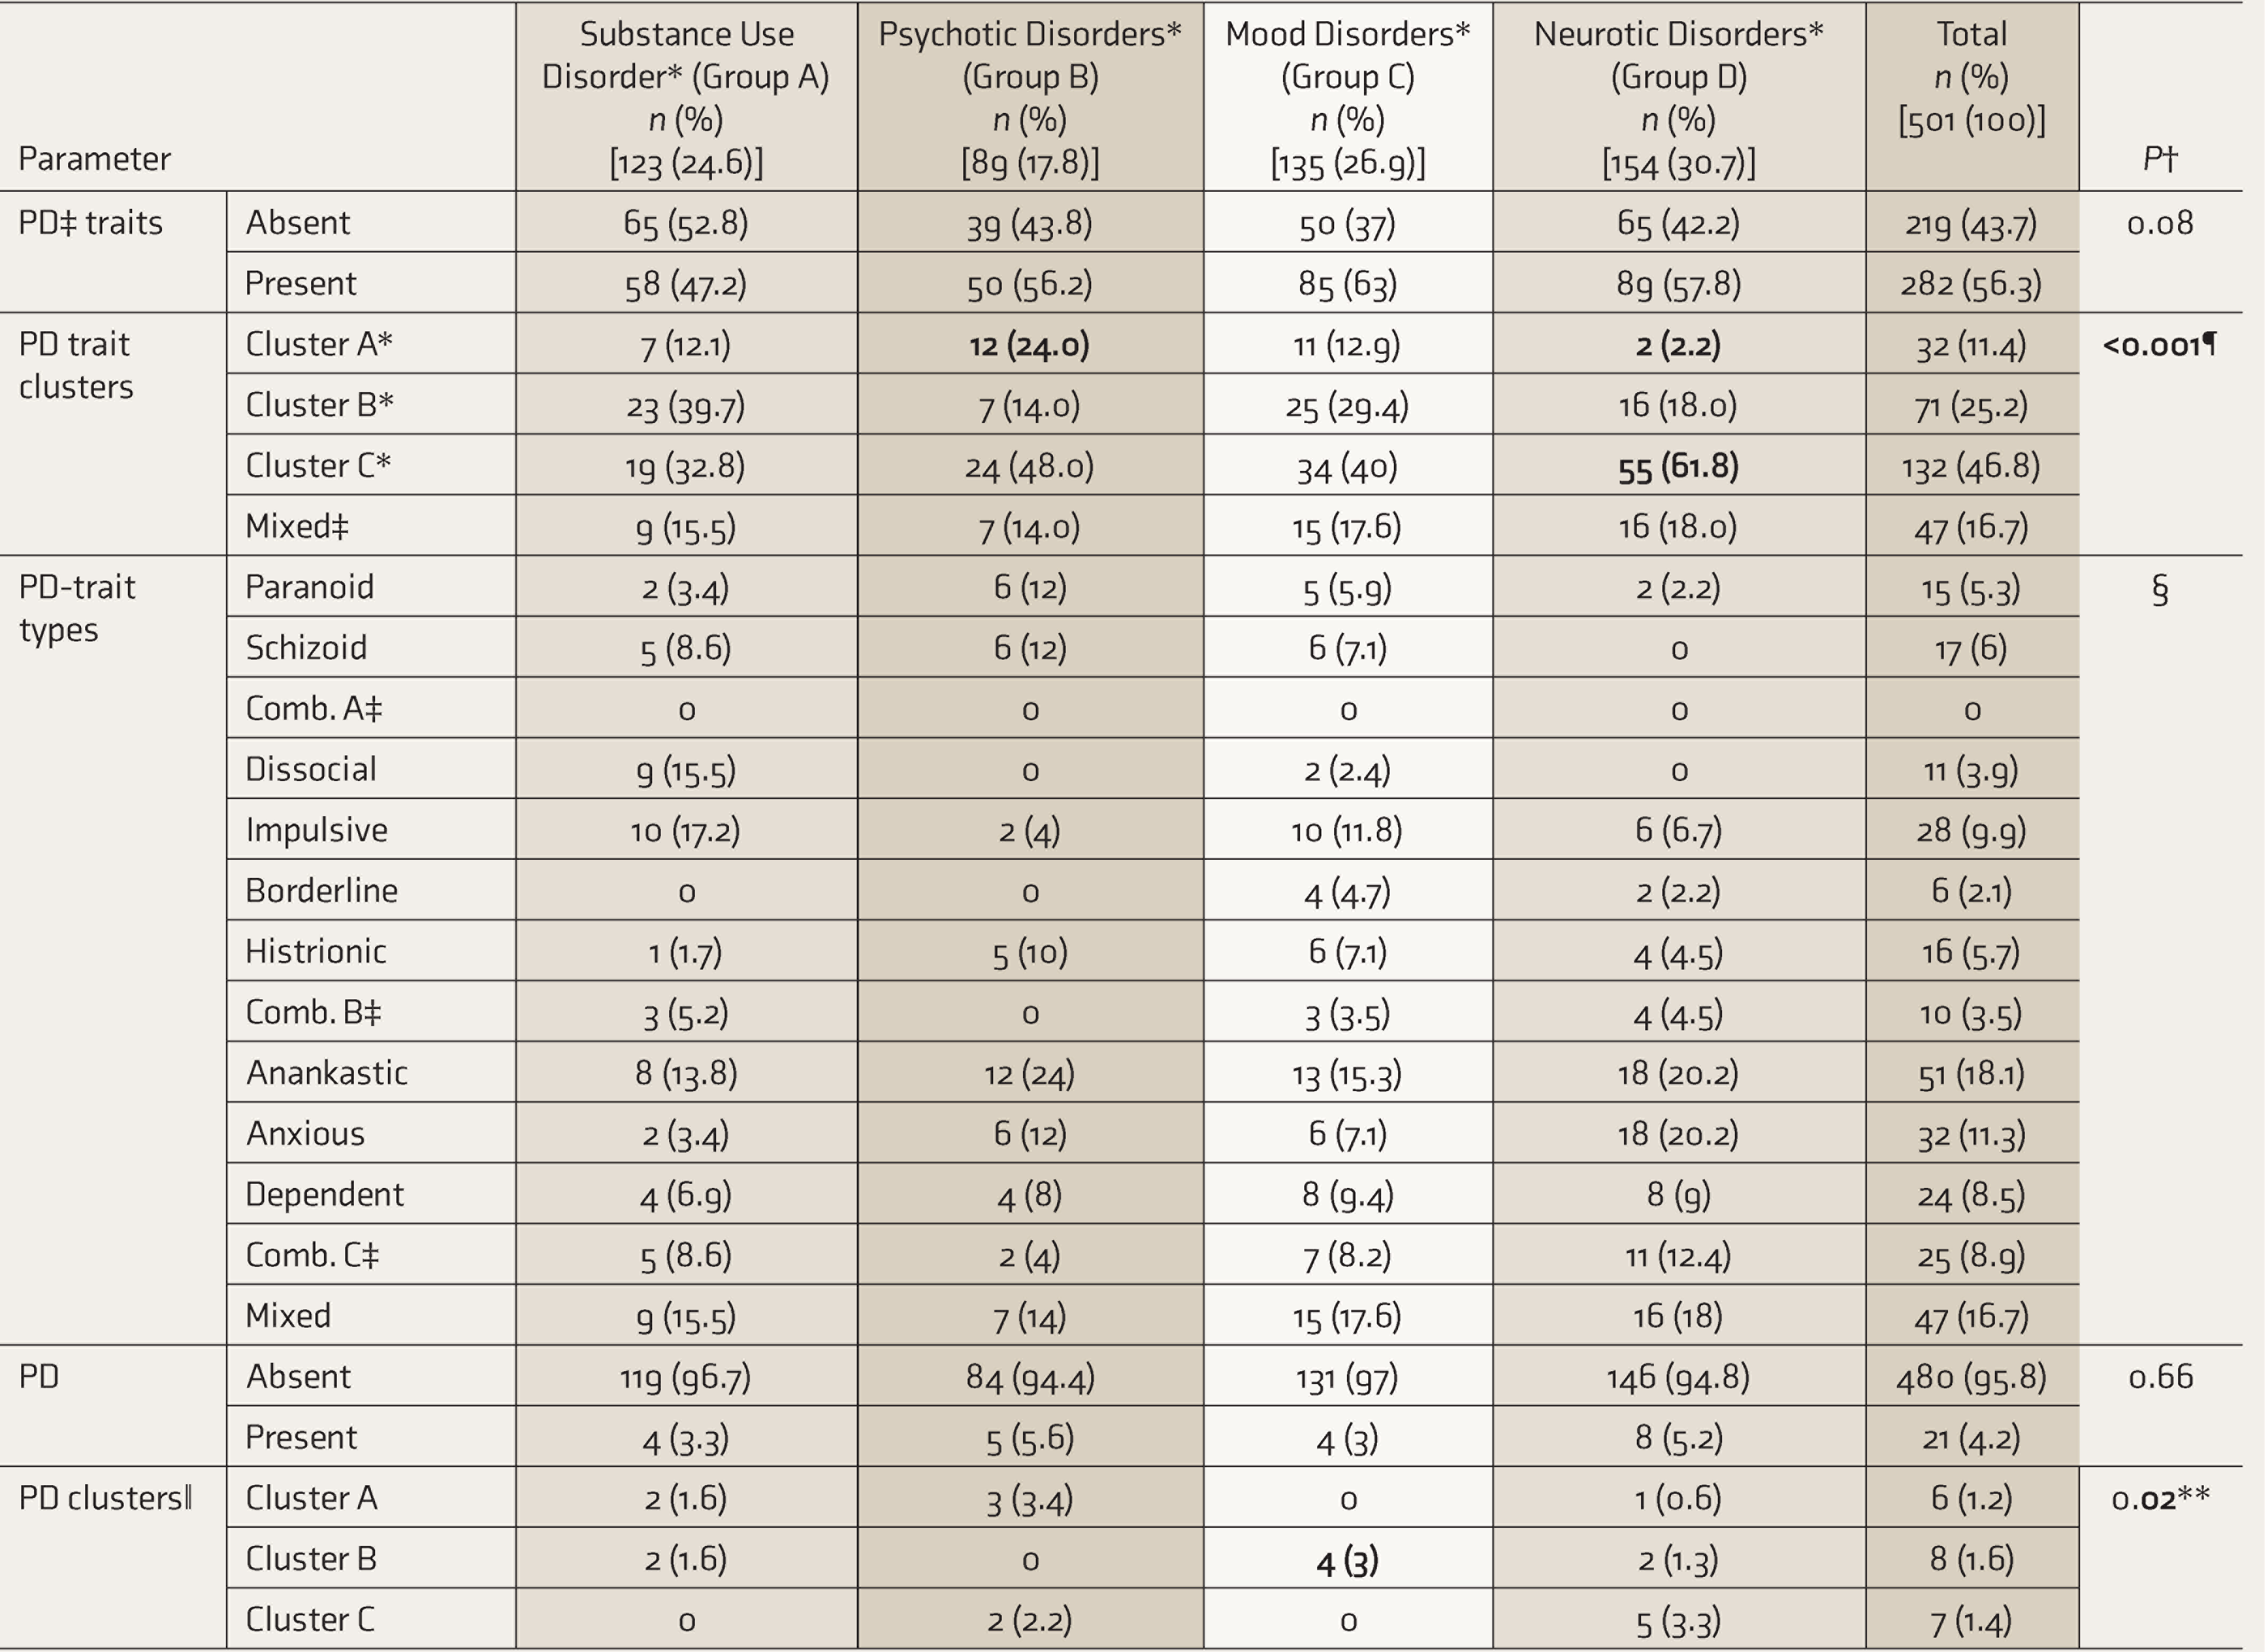
*Psychiatric disorder groups as per ICD-10. Personality disorder/trait clusters based on IPDE (ICD-10 module). †P ≤ 0.05 statistically significant. Significant comparisons have been made bold. The difference mentioned is between psychiatric disorder groups based on the respective parameter. ‡PD: personality disorder; mixed: subjects having >1 cluster traits; Comb. A, B, C: combination of subtypes of clusters A, B, and C, respectively. §PD trait types are for the descriptive purpose; no valid statistical results could be obtained using the chi-square test. ǁ Individual types of PD were maximally paranoid—4 (0.8%), followed by borderline and dependent types—3 (0.6% each). ¶ Adjusted P value of significance as per Bonferroni correction was set at ≤0.003. At this level, significant results were achieved among psychotic disorders for cluster A traits versus rest (P = 0.002) and among neurotic disorders for clusters A and C versus rest (P = 0.001 and P < 0.001, respectively). ** Adjusted P value of significance as per Bonferroni correction was set at ≤0.004. At this level, significant results were achieved among mood disorders for cluster B traits versus rest (P = 0.004).
As depicted in Table 2, Patients with PD traits had a younger age of onset (P = 0.011), belonged to upper middle SES (P = 0.007), and had positive past psychiatric history (P = 0.044). Patients with PDs had lower age of onset (P = 0.013) and were unmarried (P = 0.002) and urban residing (P = 0.028). Cluster A patients were least educated and had lower SES than others (P < 0.001), whereas cluster C patients had a higher SES than others (P = 0.003).
On comparing the mean severity of the psychiatric illness with the personality variables, it was found that psychotic patients with PD traits had higher positive subscore (24.9 ± 5.0 versus 24.3 ± 7.1) (P = 0.014) and lower negative subscore (15.4 ± 6.1 versus 19.1 ± 8.6) (P = 0.018) of PANSS as compared to those without PD traits. Amongst PD-trait clusters, psychotic disorders had the highest mean PANSS scores for cluster A traits (91.9 ± 15.0) and the least for mixed cluster traits (71.6 ± 13.2) (P = 0.042; CIs = 59.3–83.8, 82.4–101.4, respectively). No other significant results were found.
Comparison of Personality Variables Based on Sociodemographic Characteristics
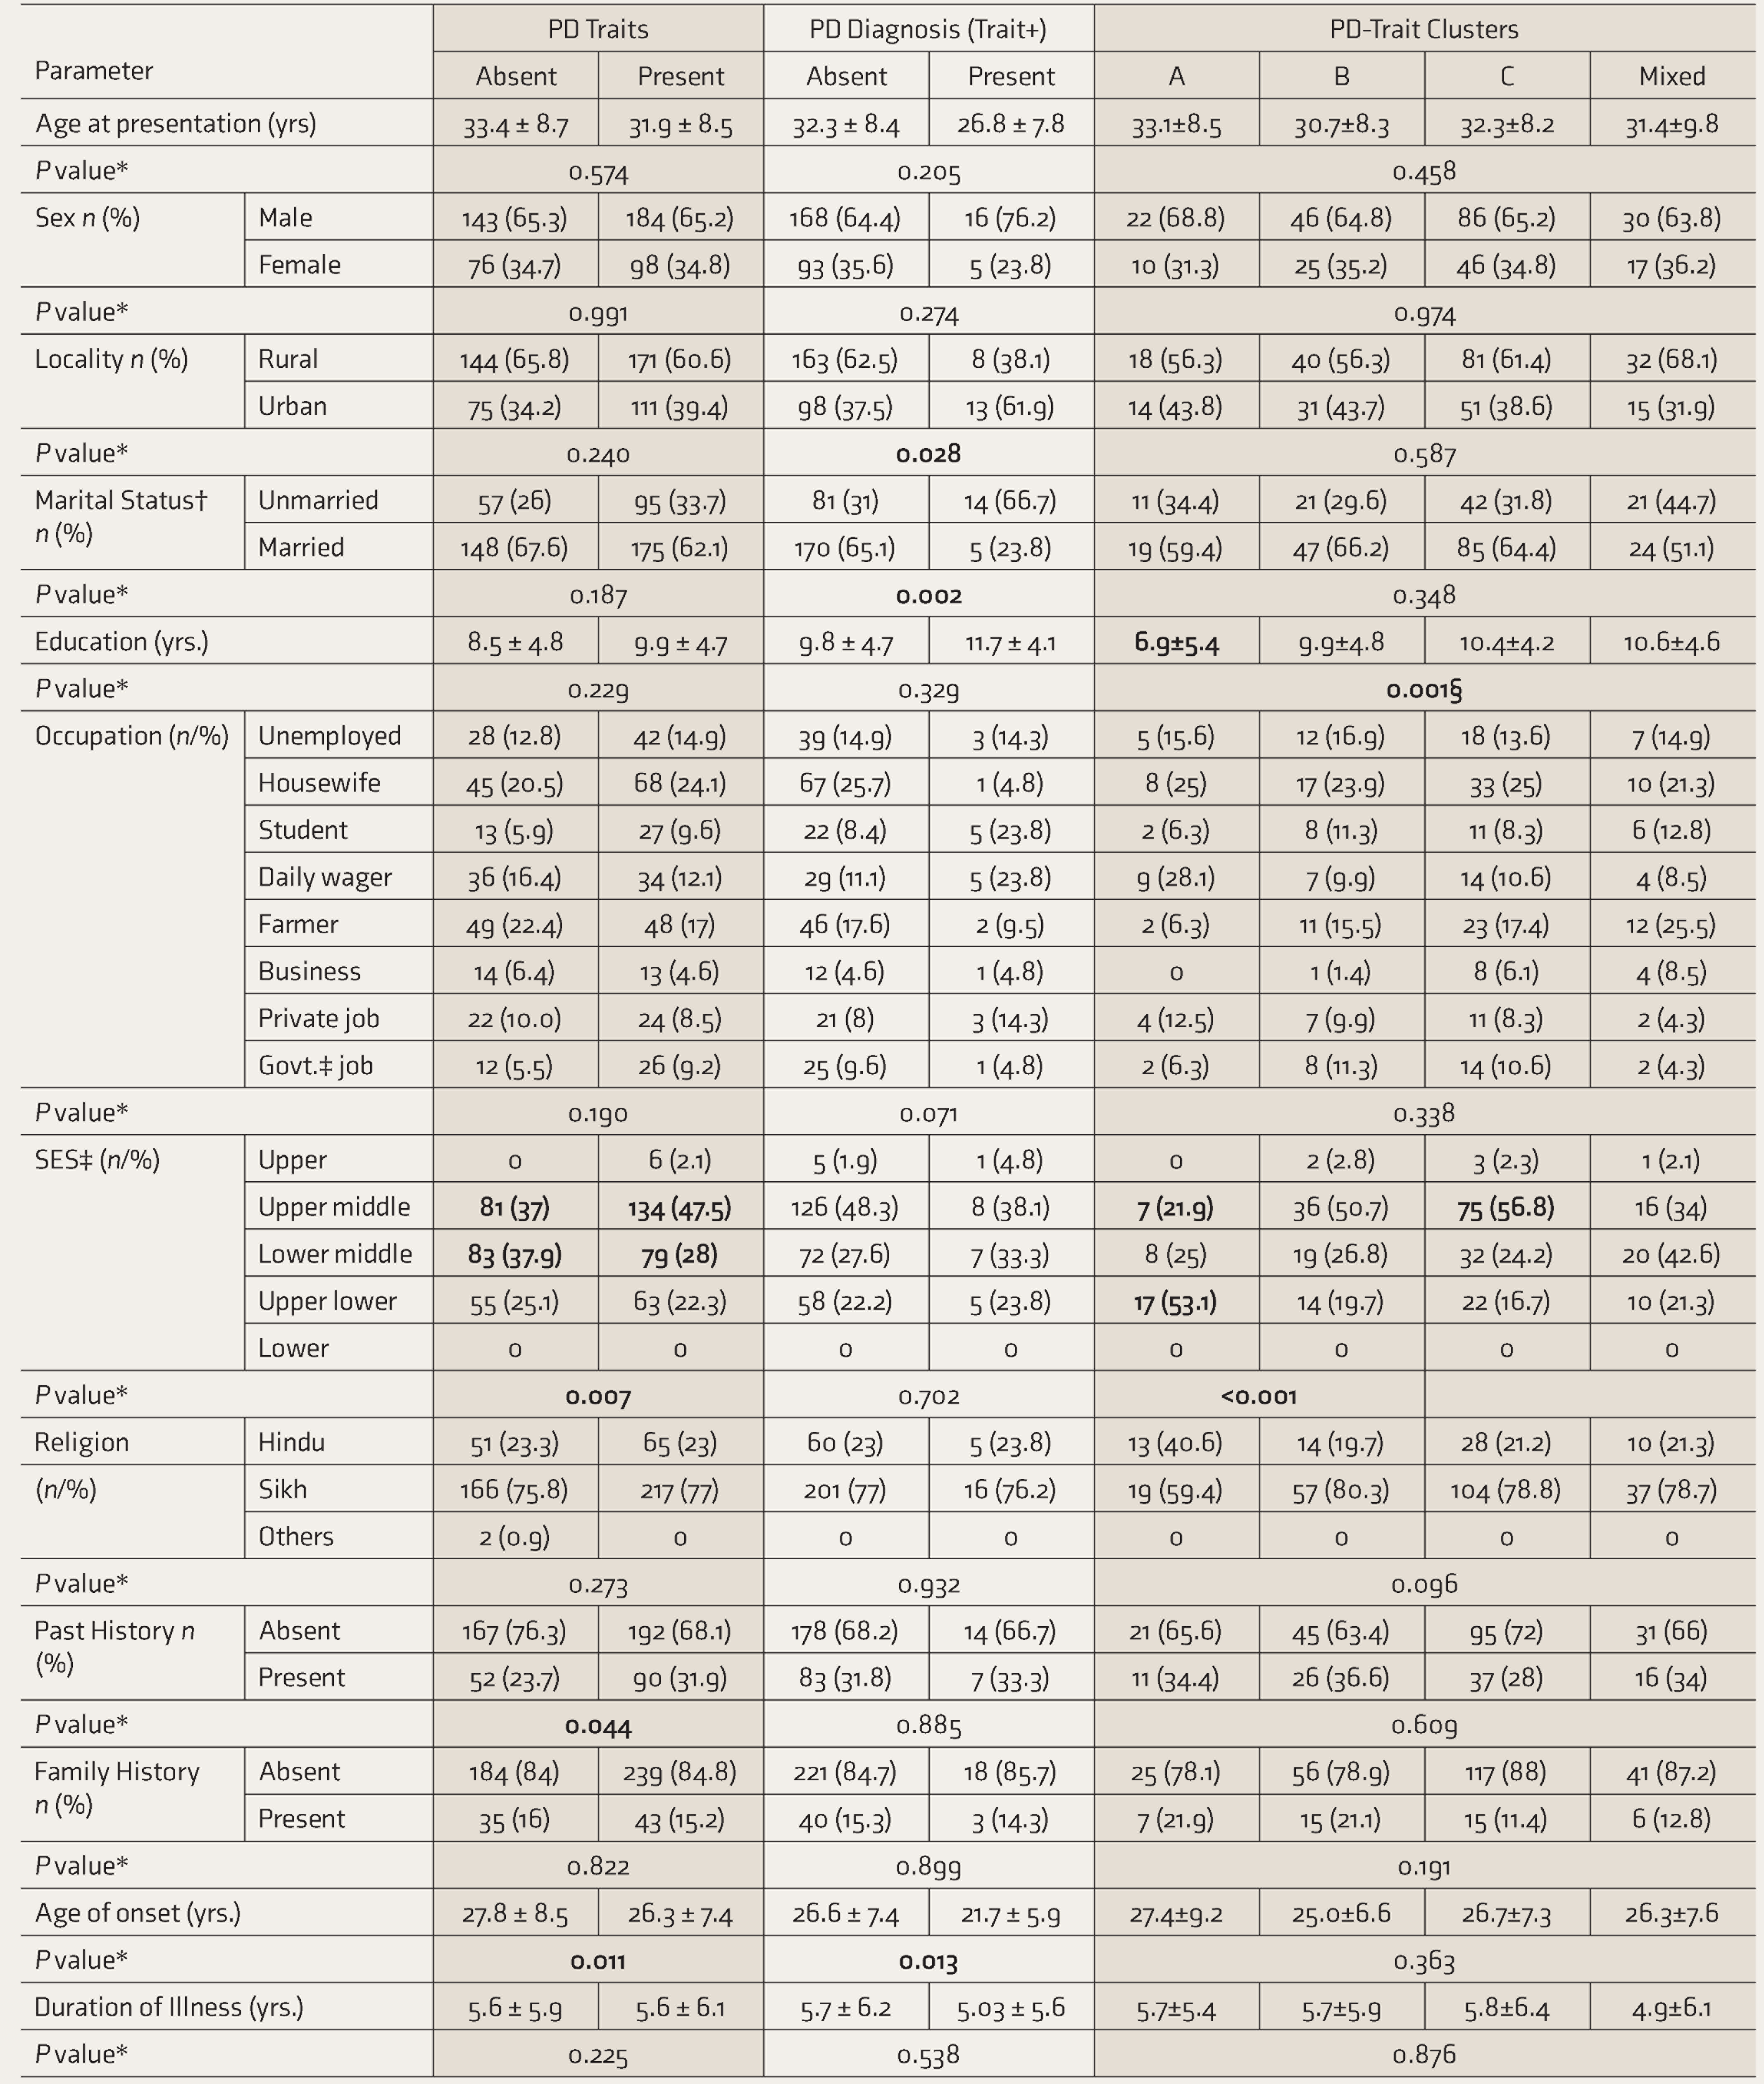
*P values ≤.05 considered statistically significant. Significant comparisons have been made bold. †Marital status included unmarried, married, widows, and divorced categories. Much less sample size belonged to widows and divorced, so only the two have been compared statistically. Among patients with PD, one was a widow and one, divorced. ‡Govt.: government, SES: socioeconomic status (as per modified Kuppuswamy socioeconomic scale). §Posthoc analysis with Bonferroni correction showed significant differences when we compared cluster A versus clusters B, C, and mixed traits (P = 0.017, 0.001, and 0.004, respectively). ǁAdjusted p-value of significance as per Bonferroni correction was set at ≤0.012. At this level, significant results were achieved for Upper middle and Lower middle SES, respectively, versus rest (P = 0.01 for both). ¶Adjusted p-value of significance as per Bonferroni correction was set at ≤0.003. At this level, significant results were achieved for Upper middle SES among cluster A and C traits versus rest (P = 0.002 and 0.003, respectively); and Upper lower SES among cluster A versus rest (P < 0.001).
Comparing mean IPDE criteria scores among the personality variables showed that amongst PD-trait clusters, the maximum score was of mixed (4.94 ± 3.44), followed by cluster A>B, and the minimum was of cluster C traits (2.77 ± 2.04) (P < 0.001; CI = 3.9–6.0, 2.4–3.1, respectively). When we considered a hypothesis that PD traits may be frequent in one and severe in another psychiatric disorder, no significant results were found, although all clusters were found to be more severe in neurotic disorders. Furthermore, correlation analysis done hypothesizing that increase in trait severity leads to an increase in the severity of psychiatric disorders did not reveal any significant results. Data tables for the above comparisons can be found as Supplementary Material.
Discussion
Prevalence Characteristics
Twenty-one patients (4.2%) had PDs, in the order of clusters B>C>A; the highest prevalence being for paranoid and borderline types. Overall, most patients with PDs had neurotic illnesses; individually, cluster B was significantly higher among those with mood disorders. World and US-national surveys had revealed a PD prevalence of 6.1% and 9.1% (maximum clusters A and C), respectively. Clusters B and C were associated with substance use and mood/anxiety disorders, respectively.21,22 Community estimates in one study were 10.3%–13.5% (developed countries) and 0%–2.8% (developing countries), 13 and 7.8% (clusters C>A>B) in another global study. 23 In primary care patients, the prevalence was in the order of schizoid>anankastic>borderline types. 24 Prevalence in clinical studies ranged from 0.3%–1.6% in one (most schizotypal), 13 6% in a second (cluster B> C>A), 25 28.7% in a third, 26 and 44.3% in a fourth study. 5 Most PDs were among depressive disorders, 5 whereas cluster B was more common in substance use/somatoform disorders. 25 Prevalence in psychiatric outpatients was 40%–92% in Europe, 45%–51% in US, 27 and 1.07%–1.1% in India (the highest prevalence being of anxious PD),12,27 whereas inpatients had mostly avoidant PDs (7.7%). 11 Individually, the prevalence of PDs in those with substance use disorders was 4%–15% prevalence (maximum being dissocial). 28 Substance use was associated with borderline PD; social phobia and PTSD were associated with avoidant PD; and depression with both PDs. 29 The prevalence of PD we obtained is different from that found in numerous previous studies, and this may be attributed to sociodemographic factors, the high prevalence in studies outside India, and methodological differences. Further studies are needed, considering scarce research in north India.
Patients with PD traits were 282 (56.3%), the highest prevalence being among those with mood disorders. Two previous studies had found personality difficulty in 14.5% and 48.3%, respectively,5,26 the highest prevalence being among those with depressive disorders. Substance use, depressive, and anxiety disorders were more among patients with personality difficulty, 5 unlike the current study. Methodological differences may account for the same. In our study, the prevalence of trait clusters was cluster C>B>mixed>A, the maximum being anankastic types. Except for substance use patients, who were more likely to be cluster B, all had cluster C traits maximally. Clusters A and C were maximum among those with psychotic and neurotic disorders, respectively. The most common PD-trait types among those with substance use, psychotic, mood, and neurotic disorders were impulsive, anankastic, mixed, and anankastic=anxious, respectively. Earlier research had found maximum histrionic traits among those with opioid addiction; 30 cluster B, mostly depressive and borderline, among at-risk psychotic patients; 31 avoidant and dependent traits among those with schizophrenia; 32 scrupulous/ rigid traits in bipolar and unipolar disorders; 33 cluster C traits among those with anxiety disorders; 34 and anankastic and borderline among those with OCD. 35 These studies mostly support our results on the prevalence pattern of PD-trait clusters.
Sociodemographic Variables
Patients with PDs were more likely to be urban residing and unmarried. Urban living is fast-paced, with rapidly changing stressors. Access to health care and awareness of mental problems may also promote early identification. Being unmarried is a bad prognostic factor in many disorders, probably explaining its significance in PDs. Besides, difficulty in maintaining relationships is one of the core manifestations in many PDs. Like us, Maanasa et al. also found no differences in age, gender, education, or SES, but they found no marital status differences as well. 11 Gupta and Mattoo found that most PD patients were Hindu, unlike the current study. 12 El Kissi found no gender differences, but patients with PDs were urban residing. 25 In contrast, Huang and Lenzenweger et al. found an inverse relation of age and education among personality clusters. Huang et al. found patients with clusters A/C in men and cluster C in those who are married or employed; Lenzenweger et al. found borderline PDs to be more common in those who are unemployed.21,22
Patients with PD traits had a past psychiatric history and belonged to upper middle class. Cluster A was least educated and with lower SES than others. While some studies among patients with personality difficulty had found no age differences, relatively higher prevalence of females,5,26 lower education, less working occupation, 5 higher unemployment rate, and more psychiatric admissions in the past, 26 others had found schizotypal traits in psychotic and cluster B/C traits in mood/anxiety disorders predicting lower age, 36 no significant locality differences, 37 paranoid and histrionic traits associated with divorce, 38 neuroticism/harm avoidance associated with lower SES, 39 Sikhs being described as scrupulous and rigid, 40 and high recurrence risk in depressive patients with psychiatric history in families having certain temperamental traits. 41 Differences in the sampled populations account for varying results; however, the traits seem intrinsic to past psychiatric episodes or may imply a future recurrence risk.
Impact on Other Psychiatric Disorders (Illness-Related Variables)
Patients with PD had a lower mean age of onset of psychiatric illness. In substance use and panic disorder, Parmar and Kaloiya and Ozkan and Altindag had found similar results.28,42 However, El Kissi found cluster B patients to have an earlier onset of substance use disorders. 25 In the current study, duration of Illness of psychiatric disorders was not affected by PDs. A previous study on schizophrenia’s course found similar results. 43 Another showed that chronicity in social and generalized anxiety disorder was associated with avoidant and schizotypal PD, respectively. 44 The cross-sectional nature of the current study impedes accurate measures of chronicity. No effect of PD on psychiatric disorder severity was found. Huang et al. found higher disability scores in persons with PDs. 21 Individually, in previous research, substance use disorder patients with PDs had higher alcohol/injecting-drug dependence/withdrawal scores, higher depression, and reduced quality of life.5,25,28,45–47 Among neurotic disorders, patients with PDs had higher depression scores in panic disorder 42 ; patients with avoidant PDs had higher anxiety severity 48 ; patients with clusters A and C and borderline PD had higher PTSD severity 49 ; and patients with borderline PD had more pain symptoms. 50 Most studies found a significant impact of PD on psychiatric disorder severity, however, of specific PDs in specific disorders. Considered in totality, however, as in the current study, PDs do not seem to influence illness severity. Furthermore, nonuniform time of presentation of patients may be a factor.
Patients with PD traits had a lower age of onset of psychiatric illnesses. Previous studies similarly showed younger age of onset of heroin use in those with impulsive traits, 51 of schizophrenia in those with avoidant traits, 52 and of mood disorders 53 and first-episode panic and agoraphobia in those with timidity. 54
PD traits had no impact on the duration of psychiatric illness in the current study. A previous study on addiction disorders found the duration of hashish use to be positively correlated with hypochondriacal, depressive, and schizophrenic traits. 55 A study on depressive disorders found trait negative emotionality correlating with illness chronicity. 56 However, illness duration calculated retrospectively provides limited information on chronicity, warranting further research.
PD traits significantly impacted psychiatric severity scores among psychotic patients, who scored higher for positive and lower for negative symptoms. Psychotic patients with cluster A traits had significantly higher symptom severity than those with other cluster traits. Previous studies among patients with personality difficulty had found higher illness severity and reduced quality of life scores 5 and significant association of traits with substance use, probable psychotic, and neurotic disorders. 26 Others had found higher severity of cannabis use among those with cluster B or avoidant traits, 57 higher PANSS scores among at-risk psychotic patients, 31 no difference in bipolarity index among cluster B patients, 58 higher depression severity among PD-double versus single traits, 59 higher impairments in patients with subthreshold PD in depression and panic, 60 higher panic severity in anankastic traits, 61 higher Y-BOCS score for cluster B>A in OCD, 35 higher PTSD severity in those with antisocial trait patients, 62 higher neuroticism and psychoticism in adjustment disorder, 63 severe symptoms among somatoform patients with neuroticism, 64 and higher severity among hypochondriac patients with anankastic/depressive traits. 65 Conclusively, distinct PD traits have an impact on the severity of related disorders.
Personality Dimensions
Among all diagnostic groups, IPDE dimension scores of patients with PD were higher than those without PD (but with PD traits), and this was the maximum in those with mood disorders. Studies had similarly found higher IPDE dimensional scores in patients with PDs, 24 specifically among those with substance use, psychotic, depressive, or anxiety disorders. 66 Individually, higher dissocial scores in opioid dependence, higher schizotypal scores in schizophrenia, 66 and increasing dissocial, histrionic, and anxious scores predicting recurrent depressive disorder have been found. 67
Mean IPDE dimensional scores across the PD-trait clusters were in the order cluster mixed > A > B > C. El-Rufaie found dimensional scores in an order of anankastic (1.76) > borderline (1.41) > anxious (1.40) > dissocial (0.22). 24 Individually, studies had found the highest dimensional scores of clusters C > A > B in substance use disorders, 68 schizotypal dimension of “odd beliefs” among psychotic disorders, 69 cluster B and anxious traits in depression, 70 and clusters C > B > A among OCD and anxiety disorders. 71 Overall, previous studies incline toward cluster C dimensions being more severe, but the current study found cluster C to be the most prevalent and the least severe. Nonetheless, replication is needed for better comparison.
Personality dimensions across psychiatric disorders found clusters A, B, C, and mixed, respectively, being more prevalent in psychotic, mood, and neurotic disorders, with all being severe in neurotic disorders. In one study, probable psychotic and neurotic patients obtained higher OR with increasing personality severity. 26 Another study found high trait severity among mood disorders. Severity was higher for clusters B and C among mood disorders and for clusters A and B in schizophrenia. 72 The inference is that particular traits associate with particular psychiatric disorders.
Strengths and Limitations
Strengths include a larger sample size compared to previous studies, especially those from north India. Multiple psychiatric disorders were compared with personality characteristics, providing ease of comparison. Rigorous inclusion criteria were set beforehand to reduce selection bias, data were corroborated from multiple reliable informants for reducing information bias, confirmation of psychiatric diagnosis and review of personality inventory scores were done by a consultant in the department for addressing the interviewer bias, and the personality interview was conducted after remission, to prevent confounding.
One limitation is the use of convenience sampling. A longitudinal study would provide insight into the course/prognosis of the patients with PD traits. Similarly, the direction of the relationship could not be assessed, due to the study’s cross-sectional nature. Furthermore, a larger sample size would make for a more comprehensive study. Control subjects as a comparison group would have better demonstrated the difference between no personality pathology, PD traits, and PDs.
Conclusion
More than half of patients (56.3%) had personality pathology, with significant sociodemographic differences overall, and higher severity among psychotic disorders. Cluster C traits were more frequent, whereas mixed traits were more severe.
Supplemental Material
Supplemental material for this article is available online.
Footnotes
Acknowledgements
I express sincerest gratitude to the department of Psychiatry, GGSMCH, Faridkot and my family for their strategic direction and enthusiastic encouragement of this research.
Declaration of Conflicting Interests
The authors declared no potential conflicts of interest with respect to the research, authorship, and/or publication of this article.
Funding
The authors received no financial support for the research, authorship, and/or publication of this article.