
Abstract
Following the assumption that trends of online queries may indicate intentions and help to predict human behavior, this study addresses the general issue of analyzing, nowcasting, and predicting migrant decisions through an analysis of Google search patterns in the case of Syrians in Turkey. Aiming to contribute to the literature on predicting migration patterns, we examine the relationship between Google search queries for province names in Turkey and the number of Syrians under temporary protection across provinces from January 2016 to December 2019 and demonstrate a positive and significant association. Then, we explore the predictive power of Google searches in predicting the stock of Syrians under temporary protection in Turkey across provinces. We exploit the alphabetical difference between Turkish and Arabic as the method of differentiation between host and migrant populations. Our findings indicate that Google searches can be good predictors for estimating refugee stocks, especially when traditional data are not available. They can also be helpful in forecasting the changing pattern of migrant stocks at frequent intervals, to which conventional socioeconomic indicators are less sensitive due to their less frequent reporting periods.
Digital trace data gathered the attention of social scientists more than a decade ago as a new data source, and ever since, the analyses and interpretation of digital footprints acquired growing interest. Digital trace data are especially helpful when traditional data, such as official registries, census data, or national surveys, are lacking or data collection is burdensome and limited due to sensitivity and confidentiality issues. Data on forced displacement often suffer for the lack of official registries and limitations due to data protection. Digital trace data analysis thus contributes to forced displacement and refugee studies by presenting information on communities to which researchers have limited access and almost no real-time access.
Migration literature has shown that intentions to move, if and when they can be measured, help explain patterns of migration behavior (De Jong et al. 1985). Assuming that online search queries indicate intentions and help to predict human behavior, this study addresses the possibility of predicting the decisions to move in the context of forced displacement using online search data. We aim to shed light on this issue by exploring the potential of online searches to predict the moves of Syrians inside Turkey. We exploit the alphabetical difference between the local and migrant populations as a method of differentiation. We use this difference first to demonstrate the association between Google search data and the number (stock) of Syrians under temporary protection (hereafter SuTP) who reside in Turkish provinces. Then, we test the predictive power of online searches in estimating SuTP stocks across provinces in Turkey. By testing the potential of online searches as a predictor for refugee stocks across provinces and by exploiting the alphabetical differences between host and refugee populations as a method of differentiation, we contribute to the research on forced displacement as well as to the literature on the use of digital trace data in general and online search data in specific.
Background
Digital Trace Data
The concepts of digital trace data and big data also referred to as online generated data, came to the attention of researchers in social sciences in the last two decades and paved the way for a growing literature in various fields. Being publicly available and easy to access, enabling real-time data collection, and providing opportunities to gain insight into hard-to-reach populations are the main advantages that digital trace data offer. At the same time, digital trace data also pose challenges, such as the problem of representativeness due to the lack of universal access to the internet and smartphones (Cesare et al. 2018). In response to the challenge of representativeness, the concepts of online populations and the digital divide emerged, addressed by different methodologies using online data sources such as Twitter (Yildiz et al. 2017) and Facebook (Gil-Clavel and Zagheni 2019).
Migration literature also benefited from the increased use of digital trace data in research, as this new source of data offered new insights where traditional data and official records were not sufficient or timely. The geolocation information provided by most social media platforms is used as a proxy to examine international migration. Thus, social media platforms such as Facebook (Zagheni, Weber and Gummadi 2017), Twitter (Hawelka et al. 2014), and LinkedIn (State et al. 2014) became important data sources to monitor and interpret international migration flows. In the forced migration context, online trace data are shown as a useful tool to nowcast the displacement in Ukraine following the Russian invasion of Ukraine in 2022 (Leasure et al. 2023).
The main source of digital trace data in this study, online search trends and query popularity attracted the attention of researchers as a possible estimator to predict future tendencies and events (forecasting) and to interpret the present, defined as now-casting. Examples of such research first emerged in economics and epidemiology; to predict certain macroeconomic indicators (Ettredge, Gerdes and Karuga 2005; Askitas and Zimmermann 2009; Choi and Varian 2009; Guzman 2011), and infectious disease outbreaks (Brownstein, Freifeld and Madoff 2009; Ginsberg et al. 2009; Pelat et al. 2009) respectively. Furthermore, demography literature provided evidence for an association between internet search patterns and abortions (Reis and Brownstein 2010), fertility (Billari, D’Amuri and Marcucci 2016; Wilde, Chen and Lohmann 2020), and causes of mortality (McCarthy 2010; Song et al. 2014; Chang et al. 2015; Solano et al. 2016; Ricketts and Silva 2017).
Online search data has undoubtedly attracted the attention of migration studies. Two strands of research appear in migration studies that use online search behavior as a predictor. The first strand considers online search data as a proxy for migration and mobility trends, while the second focuses on public opinion on immigration and migrants (Mellon 2014; Lorenz et al. 2022) as well as among migrants (Bail, Merhout and Ding 2018; Chykina and Crabtree 2018). This study builds on and contributes to the first strand that uses online search data as a measure of intention to move to analyze and predict migration patterns.
Google Trends data are influenced by micro- and macro-level factors, as shown in the case of Puerto Rican migration to the US (Vicéns-Feliberty and Ricketts 2016). Migration-related online searches have a positive and significant association with international migration flows in the cases of Latin American migration to Spain (Wladyka 2017), migration to OECD countries (Böhme, Gröger and Stöhr 2020), migration to Switzerland from selected European countries (Wanner 2021), and Japanese migration to Europe (Leysen and Verhaeghe 2023). While these studies establish the predictive capacity of online search data in the migration context, Böhme, Gröger and Stöhr (2020) further provide evidence of their predictive performance in analyzing international migration flows by out-of-sample predictions and showing that they outperform Gallup survey indicators for migration intentions. Building onto their findings, Google Trends data are proven to be useful predictors for short-term forecasting (now-casting) of Romanian migration to the UK (Avramescu and Wiśniowski 2021).
In the context of internal migration and mobility, online search data improve the strength of the statistical models to forecast US domestic migration (Lin, Cranshaw and Counts 2019) and interregional migration between Moscow and St. Petersburg (Fantazzini et al. 2021). Online search data are also used as a predictor to analyze how the COVID-19 pandemic has changed intentions to move and residential mobility preferences (Lei and Liu 2022). In the forced displacement context, Connor (2017) demonstrated the association between the online queries made in Arabic in Turkey for the word Greece and the asylum applications by Syrian refugees in Greece up until the EU-Turkey Deal in 2016. Yandex search data were also shown to present a timely tool for mobility as a proxy for the intention to move in the case of Russians leaving the country after the Russian invasion of Ukraine (Anastasiadou, Volgin and Leasure 2024).
This study builds on Connor's (2017) analysis of the case of Syrian refugees. From 2016 onwards, the movement of Syrian refugees was restricted to Turkey, which allows us to observe the movements of a large group of displaced people within boundaries. In contrast to Connor's (2017) strategy to exploit the language difference for country names in online inquiries, we exploit the difference in the alphabet, as the province names mostly remain the same over different languages. Exploiting the alphabetical difference in searching for province names, we analyze whether Google Trends can predict the stocks of refugees within a country.
Syrians under Temporary Protection in Turkey
The civil war in Syria, which broke out in 2011, escalated in the following years. Its effects extended well beyond the country's borders, especially in 2014–2015, as the refugee influx into the Mediterranean countries reached a peak. As a neighboring country, Turkey began receiving Syrian refugees with the start of the war, yet experienced the height of the crisis in 2014–2015. The European Union, through Greece and Italy, was also shaken by the Syrian refugee crisis. As the urgency of the situation became evident, the Turkish government became a part of the Syrian Regional Response Plan (SRRP) in cooperation with the UNCHR (Kirişçi and Ferris 2015) and signed the controversial readmission agreement with the EU (known as the EU-Turkey Deal) in 2015. The EU-Turkey Deal imposed Turkey to intercept refugees who wish to enter the EU borders through Turkey, to strengthen its capabilities to register, accommodate, and facilitate Syrian refugees, and to close the passageway to the EU to refugees through Turkey, which reflects the central policy of the EU (McMahon and Sigona 2021). The deal also conditioned the EU to accept one Syrian refugee to be resettled in the EU for each Syrian refugee being returned to Turkey by the EU. The EU-Turkey Deal is important for this research as it marks the starting point of the period analyzed in this research, as the provincial-level data only became available after the conditions it placed on Turkey.
Understanding the settlement patterns of SuTP is important in the case of Turkey. Once the biometric registration of Syrian refugees after their arrival to the country is complete, they hold the status of temporary protection (hereafter TP), a status created to address the Syrian refugee crisis exclusively (Temporary Protection Regulation 2014). Less than 2% of the SuTP in Turkey live in camp environments, while the remaining majority live in urban areas. Although unregistered Syrian refugees certainly exist, the TP status enables access to free healthcare, education, and other forms of assistance through national and international initiatives. Access to public services is only possible in the province of registration; therefore, obtaining and maintaining the TP status is considerably beneficial. SuTP outside the camps can move to different provinces, provided they get a travel permit that can be issued for various reasons such as work, family visits, healthcare, and education by the Provincial Directorate of Migration Management (PDMM). After they move to the new province, they need to register in that province to continue to benefit from the rights and privileges of TP status. By the end of December 2019, when our empirical analysis ends, the total number of Syrian refugees under the temporary protection status was 3,576,370. Figures 6 and 7 in the Appendix show the change in the distribution of Syrian refugees across provinces by depicting the situation at the beginning of 2016 and the end of 2019, respectively, using Directorate General of Migration Management 1 (hereafter DGMM) data.
Data
This study explores the association between the official number of registered SuTP across provinces in Turkey and online search popularity for the province names in Turkey. The analysis period begins with the enactment of the EU-Turkey Deal in January 2016, when detailed regular statistics on Syrian refugees under temporary protection started to be published and ends on December 31, 2019. The two principal data sources, official records and Google Trends, are prepared for this time frame at the province level (81 provinces).
Official Data
The data source for the number of SuTP is the DGMM, the public body responsible for collecting and publishing information on international migration. In line with the requirements of the EU-Turkey Deal, SuTP are registered at the province level, and the data have been publicly available since January 15, 2016. 2 While the DGMM publishes weekly data on the registered SuTP by province, the preceding data disappear on the public webpage with each update. We addressed this problem by using the Wayback Machine. The Wayback Machine captures and archives webpages through web crawls to save and retrieve the data lost for public access (Arora et al. 2016). Furthermore, we scanned the National Thesis Center 3 database as the distribution of SuTP across provinces is occasionally provided as descriptive statistics in theses and dissertations (Arslan Erol 2018; Erkan 2018; Gök 2019; Önder 2019) 4 on SuTP. We were able to build a data set of 122 weeks spanning from January 2016 to December 2019. Most of our data for the number of SuTP was obtained through our weekly downloads on the DGMM website and via Wayback Machine. For the data on province-level population and GDP per capita, we used the official end-of-year statistics reported by the Turkish Statistical Institute (hereafter TurkStat).
Google Trends Data
The online search popularity data source for the province names in Turkey is Google Trends. Google Trends provides a normalized score for the online search popularity of selected queries for the specific location and time frame rather than the sheer online search volume of the said queries. According to the guidelines provided by Google, the Google Trends data are computed by dividing each data point by the total searches in the specific location and time range to compare relative popularity, and the resulting numbers are then scaled on a range of 0 to 100 (Google 2022). The weekly Google Trends data correspond to the average daily search popularity in a week and is reported each Sunday.
Google Trends data come with certain limitations that need to be acknowledged. The online popularity score of a given query is not calculated based on the total amount of searches on Google but based on a sample with an unknown size, which the algorithm deems representative enough. Google Trends justifies this approach by pointing out that the actual volume of online searches is over a few billion per day and calculations on the entire data for user-specified time periods would be too cumbersome. For each Google Trends query, the algorithm uses a different sample; therefore, reiterated queries are never based on the same sample. Google Trends output also does not allow the calculation of the number of total searches or any connection of online searches to internet users. In the migration context, this means that we cannot tell the number of people engaged in online information seeking, whether the same people do searches for multiple destinations or who turn the intention to move into action and who do not.
Migration literature using online search data has so far been more focused on labor migration from the perspective of both internal (Lin, Cranshaw and Counts 2019) and international migration (Wladyka 2017; Böhme, Gröger and Stöhr 2020; Avramescu and Wiśniowski 2021; Wanner 2021; Leysen and Verhaeghe 2023). These studies include an elaborate set of keywords to capture the online information search of potential migrants. The possible migration destination is taken as part of the online search query. Using a large set of keywords together also allows us to escape from the noise in the data or lack of data due to the Google Trends algorithm that deems the popularity of searches negligible for reporting.
In the context of forced displacement, however, we have less information about the keywords/phrases used by refugees and no chance of conducting a survey to determine them, especially while they are on the move. Therefore, we use only the province names in Turkey as the online search query, similar to the approach used by (Connor 2017). We exploit the alphabetical difference to distinguish the host and refugee populations. Province names rarely change in different languages, and if it does, it applies only to the large and well-known provinces. This approach allows us to observe the interest in the potential destination province and keeps the queries comparable between the hosts and refugees, as their information needs are expected to be different. The lack of Google Trends data, due to low interest and popularity, is less problematic in this approach. We consider too low interest as zero or having too many zero values in a time series not as a lack of capturing online search queries but rather as a lack of interest in the relevant place.
In our study, the specified query index is the names of provinces in Turkey in Arabic and Turkish letters. 5 For the spelling of Turkish province names in Arabic, we used the version in the Wikipedia pages of each province in Arabic. We have also taken into account alternative spellings or misspellings for province names in Arabic letters and considered them together with the original/most common spelling.6,7 The keywords used for the Google Trends inquiry are reported in Table 2 in the Appendix.
The advantage of using alternative spellings, especially in our study where we do not have phrases for information gathering but the name of the potential destination (province) in Turkey, is to capture the popularity of the word better and with less noise in the data. We demonstrate this with the example of the province of Adana and using Google Trends’ comparison feature. Google Trends allows up to five keywords to be compared in terms of popularity, and the comparison feature normalizes the results not only by the given time and location but also among the selected keywords. Taken separately, each query shows only the normalized score for that query for the given time and location. We visualize the alternative spelling approach in two steps. First, we look at the popularity of different spellings for Adana in Arabic letters as well as all spellings together as separate queries (Figure 8 in the Appendix). We then look at the four different spellings for Adana in Arabic letters and all spellings together comparatively (Figure 9 in the Appendix). The comparison, in which the results are normalized relative to each other, shows that using all possible spellings captures the popularity better than even the closest-performing single query (Figure 1).
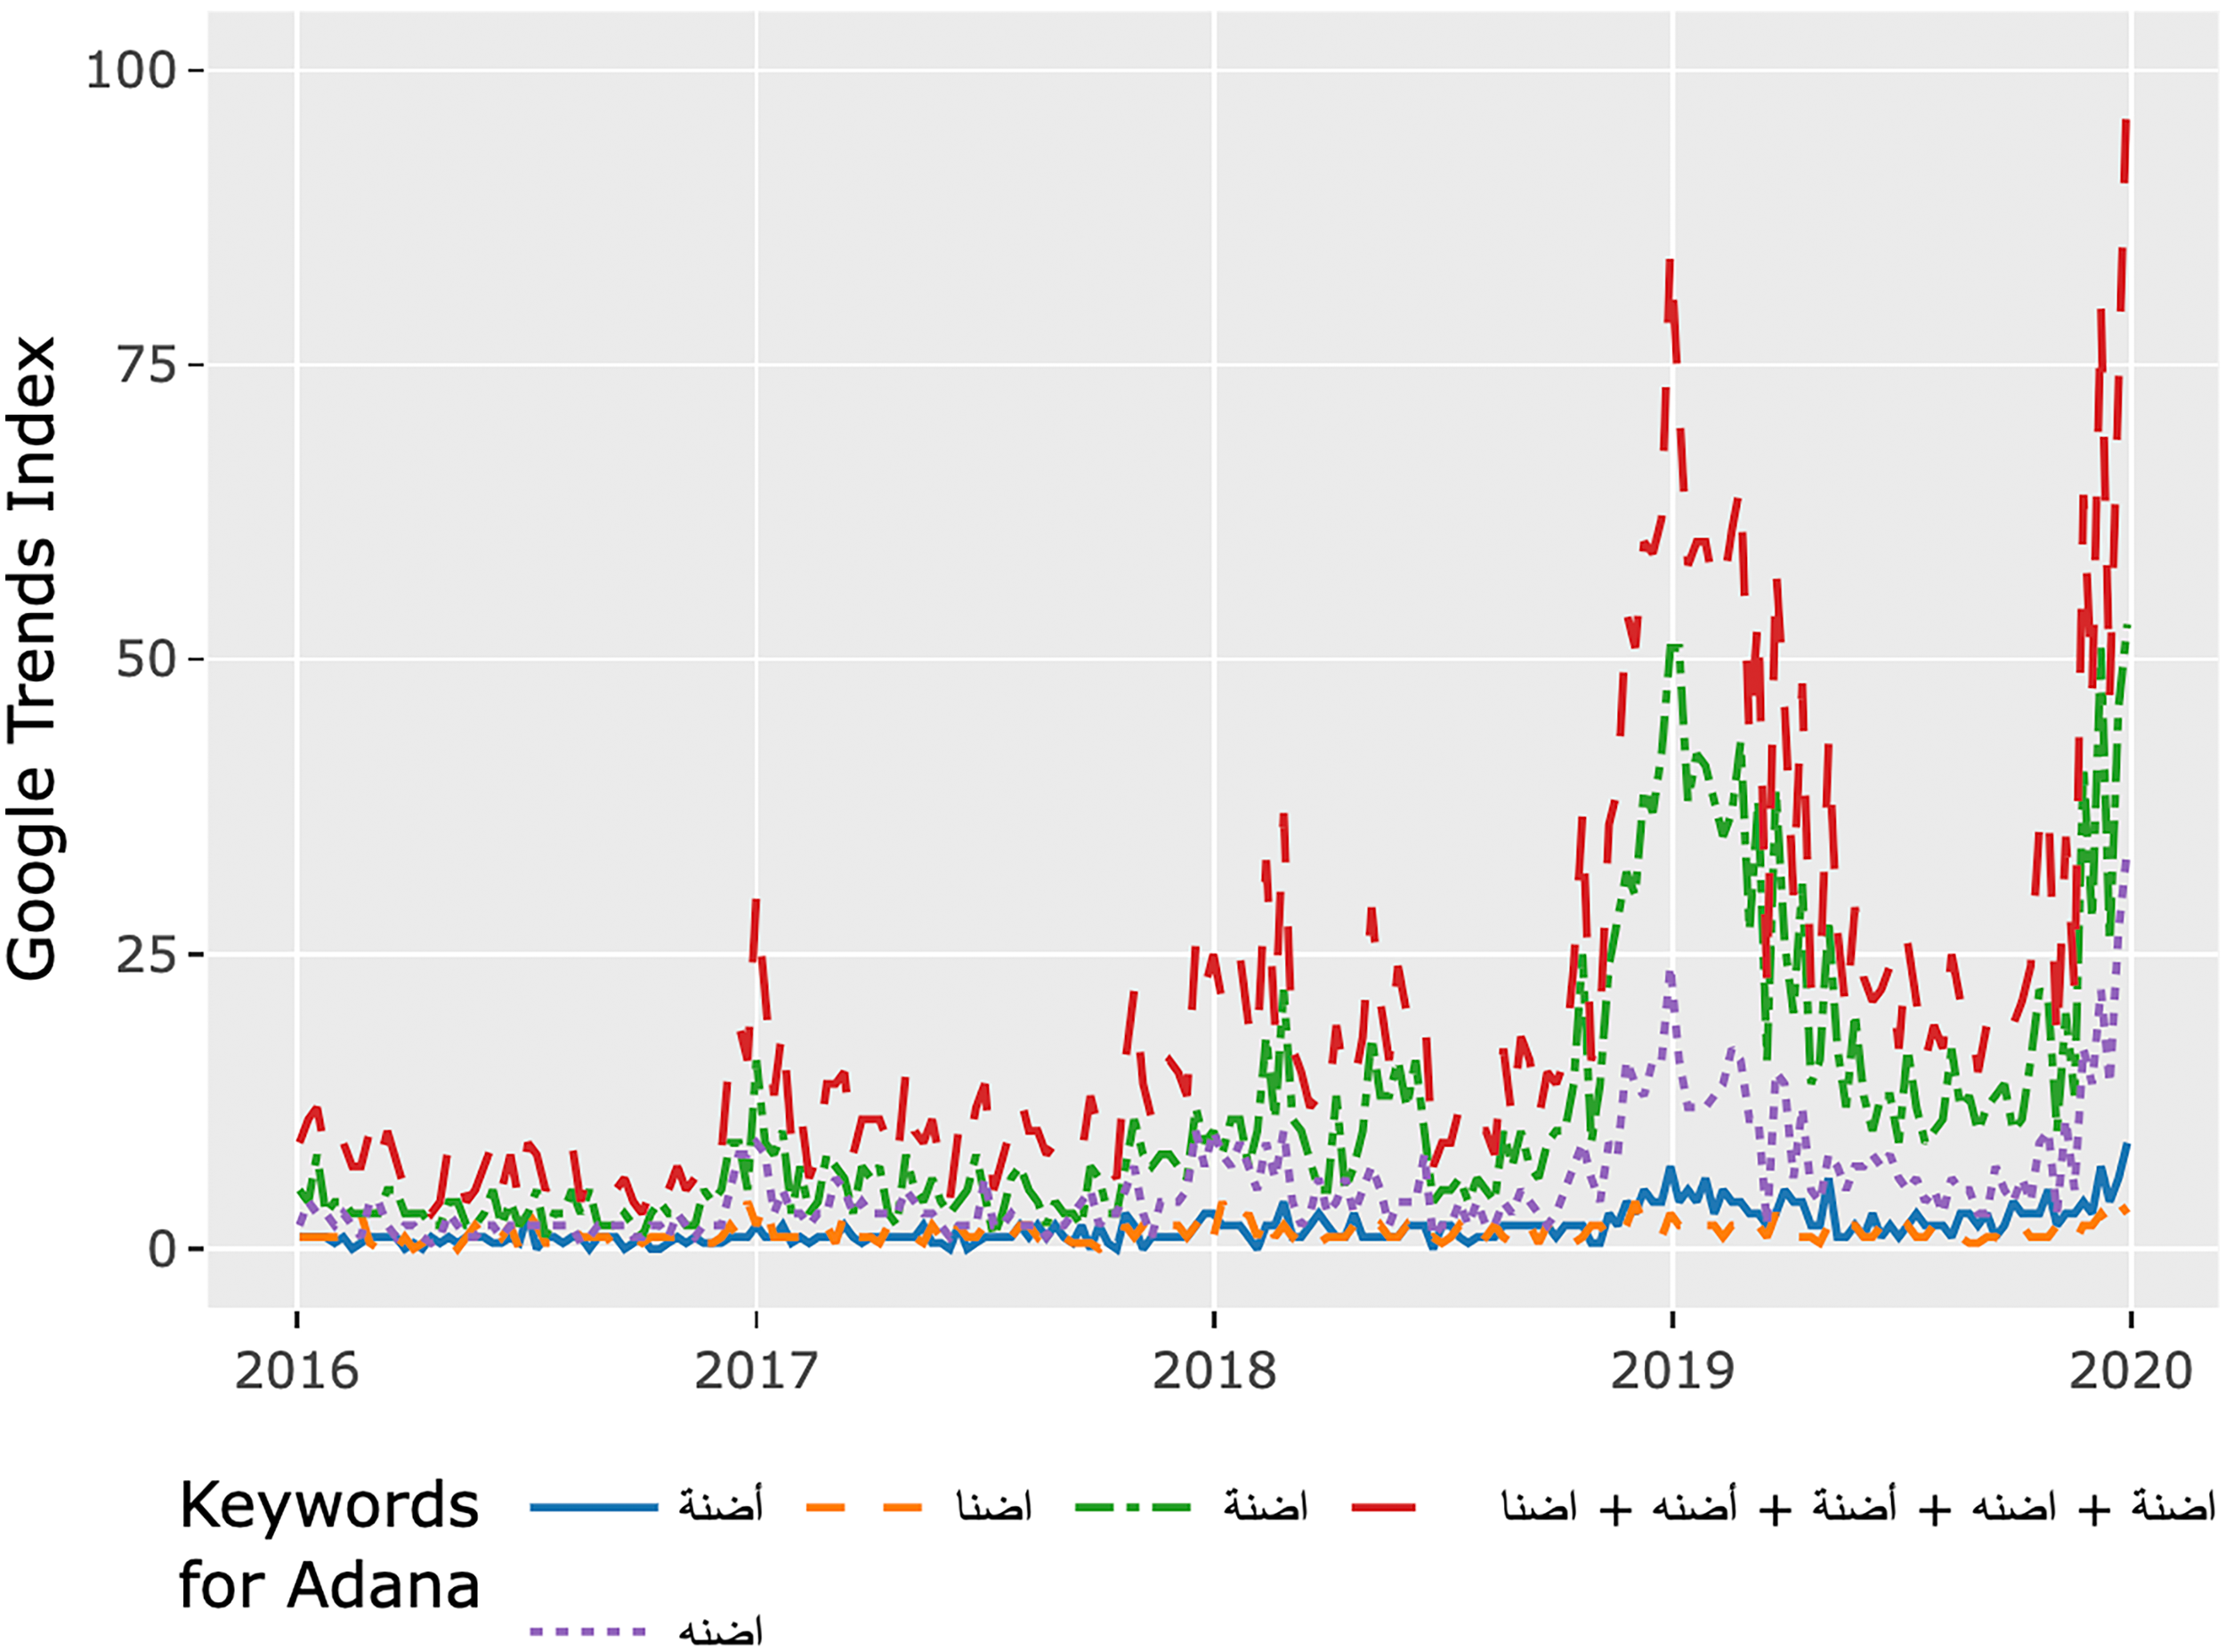
Comparison of alternative spellings for the province of Adana.
The period of our empirical analysis is from January 1, 2016, to December 31, 2019. We set the time frame for the Google Trends data to begin on November 15, 2015, and end on December 31, 2019. The data for 2015 is used as the lagged search popularity and was not matched with the registry data of SuTP. For controls, we used Google Trends data for the same time period and query index in Syria, both in Arabic and Turkish letters, as well as the international spelling of province names without special characters 8 in both Turkey and Syria. To test the potential bias of Google Trends sampling, we downloaded the data more than twice to see the difference between different samples but did not observe any significant change.
Data Preparation
Using the sources above, we created a unique panel data set covering four years, which includes 216 weeks of Google search data in six categories (Arabic letters in Turkey, Turkish letters in Turkey, English letters in Turkey, Arabic letters in Syria, Turkish letters in Syria and English letters in Syria) and 122 updates for the official number of SuTP in 81 provinces. On this data set, we first calculated the main explanatory variable as the ratio of search popularity score for province names in Arabic letters over Turkish letters in Turkey (search popularity in Arabic lettersi,t / search popularity in Turkish lettersi.t). The variable is referred as the search popularity ratio, hereafter SPR. Introducing a search popularity ratio as the predictor is a novel approach of this paper to better understand the divergences in the online search behavior of the refugee population with respect to the local population. The reason for using SPR instead of separate search popularity scores for Arabic and Turkish spelling is thus to absorb the effects of potential local or seasonal popularity of provinces. If a province in Turkey becomes popular for any extraordinary events or incidents, the search popularity for the name of the province is expected to rise among both SuTP and Turkish citizens.
In the data preparation step, we calculated the time-lagged SPR variables and matched the official statistics for the number of SuTP across provinces with the Google Trends data (SPR). The official statistics of SuTP are published on weekdays, while Google Trends reports weekly data for each Sunday; therefore, the two data sources can be matched by week and not by day. As the SPR variable refers to the searches made in the same week of the update in the official registries for SuTP, this variable accounts for the nowcasting predictor in our model. As forecasting predictors, we calculated the six lagged variables with one-week intervals and for both the SPR variable and the search popularity for controls over 216 weeks. Once all the SPR and search popularity variables were set, we matched the dates of 122 updates of SuTP registry data with the dates of SPR and search popularity control variables by week. We then dropped the weeks that we could not match with the data on SuTP, and this way, we ensured that time lags were not lost or mismatched due to the shrinking sample size.
Our assumption in using Google Trends data to predict SuTP stocks is that they are an indicator of interest, and this interest might signal a move to the relevant province. However, Google Trends does not provide us with an absolute value but an index of popularity, and low interest, as interpreted by Google, is shown as zero. While this is challenging for doing research with online search data, we interpret that the lack of interest could also be meaningful for our predictions. We create three dummy variables that take the value one if the index value provided by Google Trends is 0. As the interest in Turkish provinces in Turkey using Turkish letters is never zero, we have three dummy variables for the absence of online search popularity; the first is for Turkish spelling with the location Syria, the second is for Arabic spelling with the location Syria and the last is for Arabic spelling with location Turkey.
Methods
The main aim of this study is to assess the association of online search popularity with the SuTP stock across provinces in Turkey and explore its predictive power on the latter. In this case study, we seek to understand how Google search data can be used to predict SuTP stocks. In contrast to the previous literature on this topic, we focus on refugee stocks instead of refugee flows. The reason for this choice relies on the characteristics of the selected case and the data availability. The SuTP registry data only gives the aggregate number of SuTP for each province and does not distinguish between new arrivals and relocations. As the relocations are not distinguished, the registry data also does not provide any information on the previous location of residence. The province-level SuTP registry data started being published after the EU-Turkey Deal and marked the beginning of our research period as 2016. At the beginning of 2016, Turkey was already hosting 2,540,784 9 SuTP. Therefore, we must assume that the changes in the SuTP stock of provinces during our research period may be due to both new arrivals and relocations. In addition to the limits set by the registry data, the Google Trends data also favors an analysis of stocks rather than flows in this context. We set the location parameter for the Google Trends data as Turkey (country-level). While province-level Google Trends data would have provided us more insight into our research, they are more noisy and prone to an inflation of zero values, if available at all. It is, therefore, currently not possible to conduct an analysis of online interest in provinces at the province level or make assumptions on flows of SuTP between provinces. We need to assume that online searches that include the province name may be done while residing in the same province, making the Google Trends data we use in our research more suitable for analyzing stocks.
We define two hypotheses in our study. The first hypothesis (H1) suggests that online search popularity is positively associated with the number of SuTP in a given province and is a useful predictor for SuTP stocks. The second hypothesis (H2) proposes that the timing of online searches plays a role in predicting the association between online search behavior and the observed SuTP stock. To test these hypotheses, we use our unique panel data set and a fixed effects model, considering the advantages of fixed effects model to absorb the effect of features that vary at province-level and time-level and allow a better interpretation of the explanatory variables used in this analysis. Thus, the baseline model is as follows;
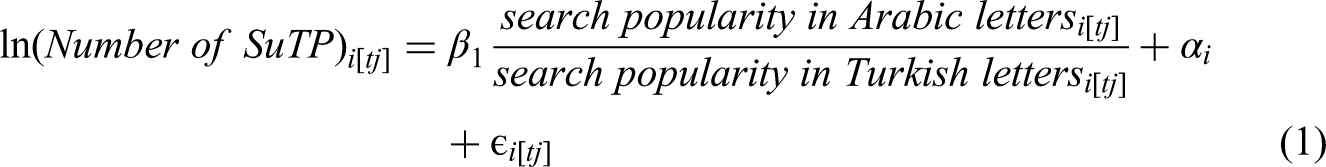
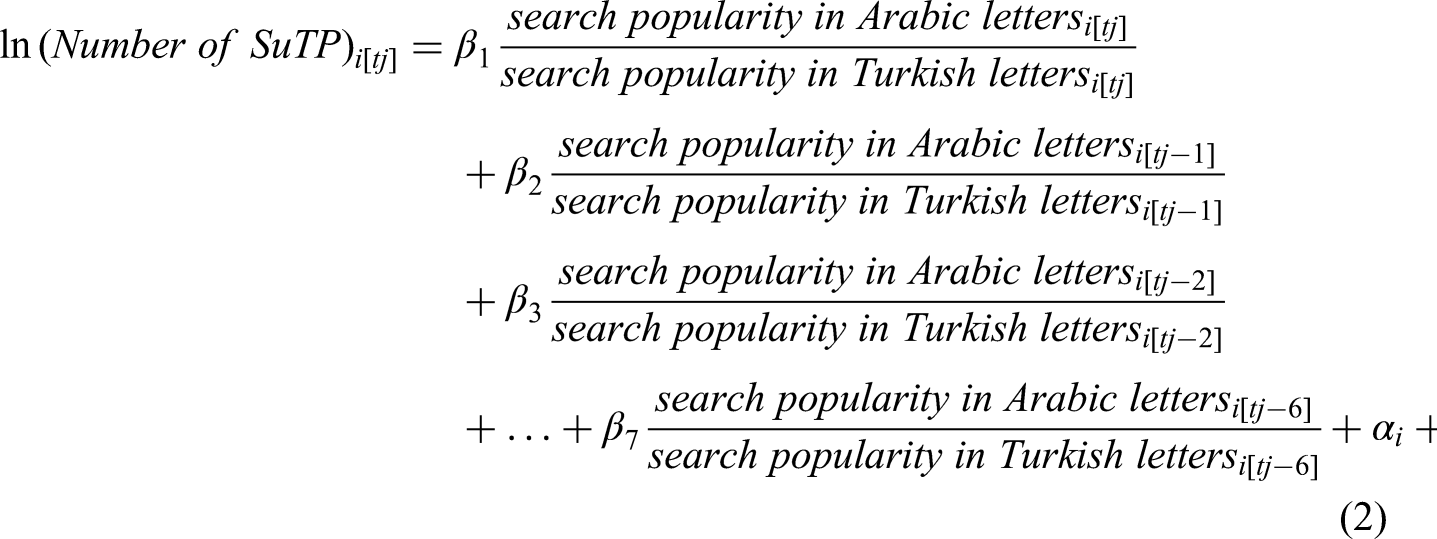
Next, to observe the role of the difference between the time of the Google search and the time SuTP stock appears on official data, the time-lags, we expand our model and add the lagged variables. While tj refers to the week for which the number of SuTP is matched with the same week of Google search query data, we denote the lagged variables as tj-1, tj-2, … tj-6. Each lag refers to a one-week interval, and we introduce the lagged variables to the model, from one-week up to six-week lags in our data. Following the addition of lagged variables, the model becomes as follows;
We provide a closer look at internet penetration rates for the case study to justify the merits of studying online information-seeking patterns. During the period of study in Turkey, the share of households with internet access increased from 76.3% in 2016 to 88.3% in 2019, and the share of individual internet usage increased from 61.2% in 2016 to 75.3% in 2019 (TurkStat 2023). The region of residence, gender, and age contribute to the digital divide. Istanbul, with the highest population and SuTP population, also has the highest shares of households with internet access (89.1% to 95.6%) and individual internet usage (71.8% to 86.6%) throughout the period 2016–2019. 10 On average, younger people and males have higher internet usage (TurkStat 2023).
Understanding the internet and smartphone usage of SuTP in Turkey is more difficult as there are no official statistics. Syrian refugees use the internet both during the journey to the destination and at the destination country. Smartphone and internet usage may make refugees vulnerable to risks from smugglers or states by rendering them easily trackable. However, evidence shows that Syrian refugees consider that the benefits of careful smartphone usage during the journey outweigh the risks (Gillespie, Osseiran and Cheesman 2018). In the case of SuTP in Turkey, one sees that smartphone ownership and internet usage are widespread. SuTP can acquire a phone number in Turkey using their IDs. While this may be an issue undocumented migrants want to avoid, we expect it to be negligible for the SuTP in this study, as the temporary protection grants them legal status.
Our knowledge of the smartphone ownership and internet usage of SuTP in Turkey comes from the surveys in the literature. Survey data shows that 33% of SuTP in Turkey never used the Internet in Syria, but only 10% are non-users in Turkey, and 75% are active Internet users 11 (Merisalo and Jauhiainen 2020). Smartphone ownership among SuTP in Turkey is estimated to be between 78% and 84% (Sunata 2017; Merisalo and Jauhiainen 2020). There is also evidence of a digital divide. SuTP residing in Western provinces and metropolitan areas generally have higher smartphone and internet usage (Narli 2018; Sunata 2017), and SuTP in camps, where freedom of movement is restricted, is specifically lower (Smets 2018). SuTP in camps are immobile but contribute to the SuTP stocks in the respective provinces. While we note that between 2016 and 2019, approximately 90% of the SuTP lived in urban areas, we acknowledge that the digital divide among the SuTP in Turkey may create selection bias.
Results
Statistical Analysis
In our analysis (Table 1), the dependent variable is the natural logarithm of the number of SuTP in each province. In the first column, the explanatory variable is the Arabic/Turkish SPR for searches made on the same week as the date of the SuTP registry (denoted as tj) along with province-level fixed effects. In column 2, one-week, one-month, and six-week lags for the Arabic/Turkish SPR in Turkey are added to the equation. In the third column, we show the results for the Model 2 above. In column 4, controls are included in the regression equation: province-level population and dummy variables for the overall absence of online search popularity for province i at time t. We use the model in column 4 in our prediction exercises below (4.2) as the paper model. The last column shows the results for a more traditional approach in the literature to estimate migrant stocks, using province-level population, GDP, 12 and fixed-effects. We use this model as the comparison model in prediction exercises (4.2).
Summary of Results.
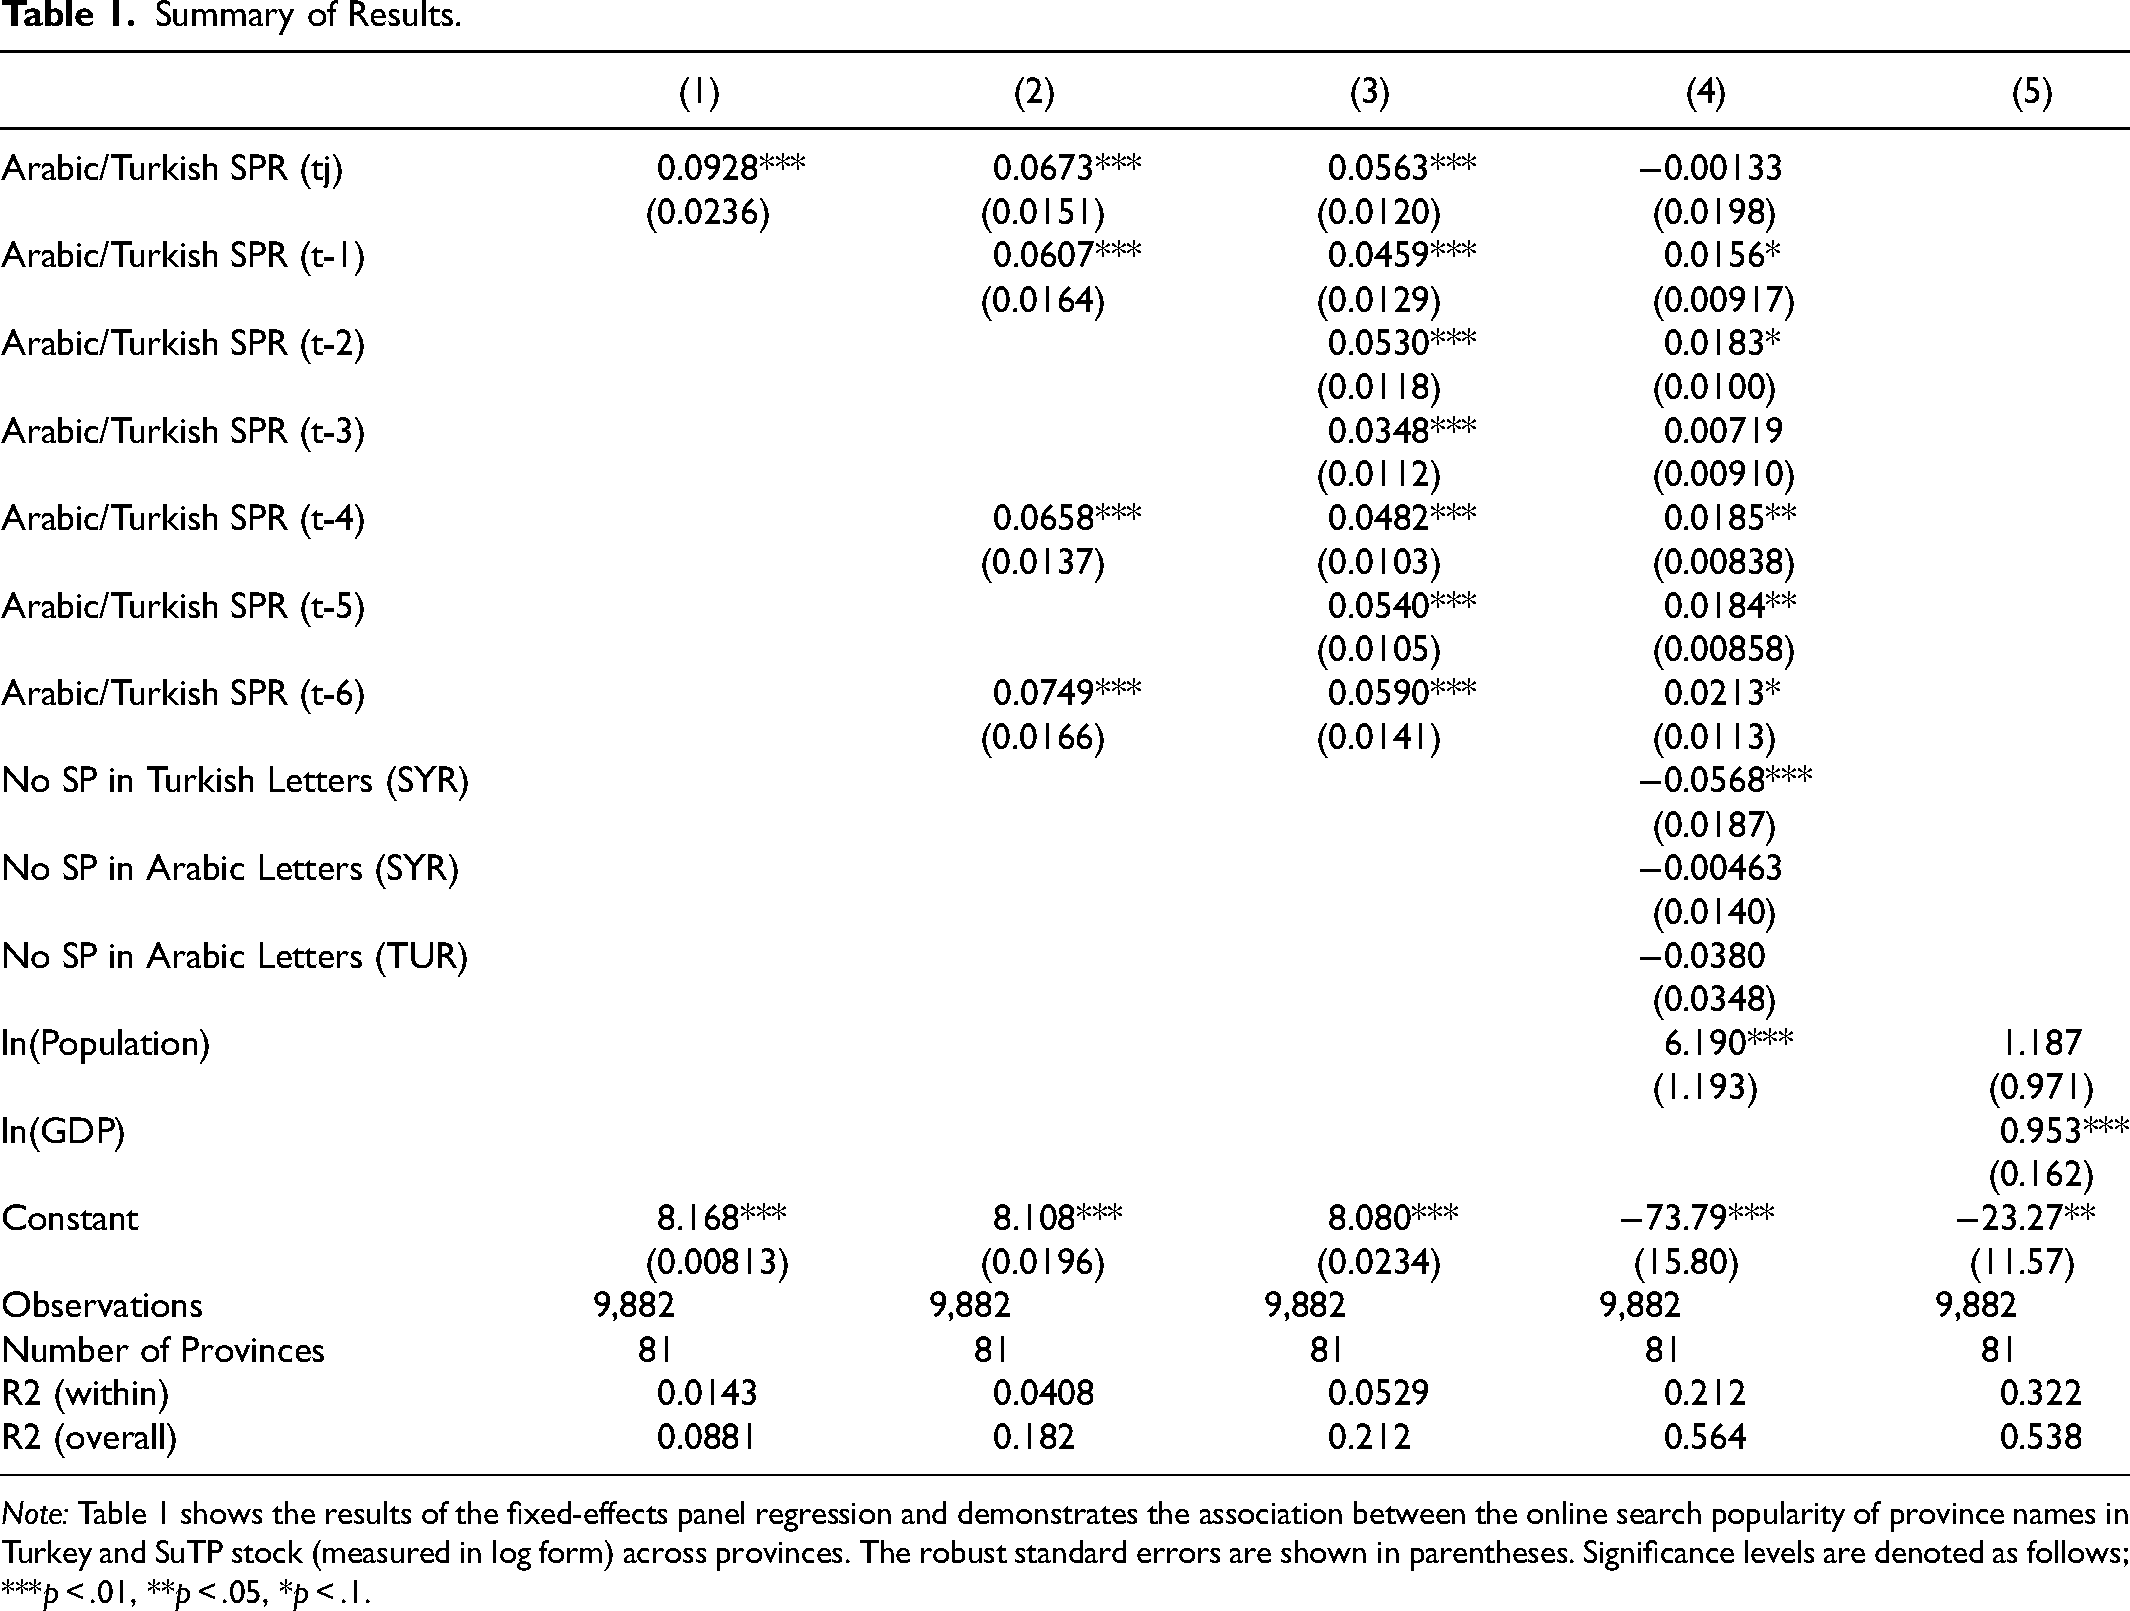
Note: Table 1 shows the results of the fixed-effects panel regression and demonstrates the association between the online search popularity of province names in Turkey and SuTP stock (measured in log form) across provinces. The robust standard errors are shown in parentheses. Significance levels are denoted as follows; ***p < .01, **p < .05, *p < .1.
The analysis shows no support for a correlation between simultaneous online SPR and SuTP registry once the control variables are included. However, the analysis supports our H1 and H2 and confirms that there is a positive and significant association between the number of SuTP in a province and the online SPR for the name of the same province, as well as the timing of the online SP matters. The results suggest that an increase by one in the one-week prior SPR is correlated with a 1.6% increase in SuTP. The association becomes stronger when the time gap increases, as one-month and six-week time lags are associated with a 1.9% and 2.1% increase in the number of SuTP, respectively. However, an increase of about 2% in the number of SuTP in a given province in correlation with an increase by one in SPR should be considered carefully. As shown in Table 3 in the Appendix, the overall range of the SPR variable is 0 to 7.08, while the overall mean is 0.35. An increase in SPR by one is an unlikely event, and it is more likely that the association between the SPR and the number of SuTP in a province occurs in much smaller amounts. Controls for the absence of Google searches (No SP) are only significant for the absence of SP in Turkish letters in Syria. The absence of Google searches in Turkish letters in Syria is correlated with a 5.7% decrease in the number of SuTP. The result is intuitive as online searches for the provinces of another country using a foreign alphabet and special characters would be a clear sign of interest.
We implemented a series of robustness checks for our results. First, we replaced the SPR variable with SP in Arabic letters and SP in Turkish letters as two separate variables to test our approach of using the search popularity ratio as the explanatory variable and to disentangle their relationship with the dependent variable of the number of SuTP. Similar to the results of our initial models with controls, the simultaneous online SP variable was neither for the SP in Turkish letters nor for the SP in Arabic letters significant. The correlation between SP in Arabic letters and the number of SuTP is observed to be positive and statistically significant for a time lag of one, two, and four weeks.
Next, we replicated the model using the same queries and time period for the online SP variable, changing the online search location from Turkey to Syria. As the online search popularity for Turkish province names in Syria includes considerable zero values, we used the SP in Arabic letters and SP in Turkish letters separately instead of calculating SPR variables. The correlation between the online searches in Syria for Turkish province names in Turkish letters is positive and significant with the SuTP stock of these provinces for all time-lags (Table 4 in the Appendix). This result corroborates the strong negative correlation between the dummy variable for the lack of online searches in Turkish letters in Syria 13 and SuTP stock in our main model. The correlation between the online searches in Syria for Turkish province names in Arabic letters is negatively correlated with the SuTP stock, significant only for a time lag of one week and six weeks. As the online search location is Syria, we should bear in mind that the online search may be conducted not by the Syrian citizens who are about to move to the said province in Turkey but by the relatives and acquaintances of SuTP in Turkey.
Last, we replaced the SP in Turkish letters with SP in English letters, i.e., we removed the Turkish special characters from the online search query and repeated the analysis. The results for both Turkey and Syria, as the location of online searches, are observed to be quite similar to our initial results. Considering that Google Trends data are produced on a different and representative sample of all searches at every request, controlling for no Turkish characters and obtaining similar results also serves as a control for the same data from a different sample. Using English characters, however, created a difference for the analysis in Syria, and the association with the number of SuTP became stronger.
The Predictive Power of the Google Trends Model
After demonstrating the association between the online search popularity and the stocks of SuTP across Turkish provinces in the statistical analysis above, we proceed with two prediction exercises to test the accuracy of our model and online search indicators. In the first exercise, we seek to understand whether and how including online search indicators improve the prediction of SuTP stocks. We first look into how the time lags of the online searches impact the predictions, which addresses our H2. We follow by comparing our models’ predictive performance with the predictive performance of a standard model without any online search indicators. In the second exercise, we compare the predictive performance of models with and without the online search indicators for random and non-random samples, where the non-random sample predicts the SuTP stocks for 2019, the final year in our dataset.
Exercise 1: k-Fold Cross-Validation
The k-fold cross-validation method enables the assessment of the predictive performance of a model by dividing the dataset into k random parts, training the model on the k-1/k part of the dataset, and testing it on the 1/k part of the dataset. This process is repeated k times, and the root mean square error (RMSE) and R2 values are reported for each repetition. We apply 5-fold cross-validation, in which the dataset is divided into five parts, and cross-validation is repeated five times for each model (%80 / %20). A comparison of RMSE values allows us to draw a comparative picture of the predictive performance of time lags for online search indicators and different models using/not using online search indicators.
Addressing the H2, we first assess the predictive power of different time lags in online searches with a cross-validation exercise. In Figure 2, the boxplot on the left-most side shows the dispersion of the RMSE from 5-fold cross-validation for a model that predicts the province-level SuTP stocks based on population, GDP, and time-invariant province fixed effects. Each subsequent boxplot shows the dispersion of the RMSE from 5-fold cross-validation for a model that adds an online search indicator to the comparison model, starting with the SPR of the same week up to the SPR from six weeks before. We observe that, on average, the inclusion of online searches from one to three weeks prior reduces the RMSE and thus improves the predictive power of the model, while the online searches at other times do not change the predictive power.
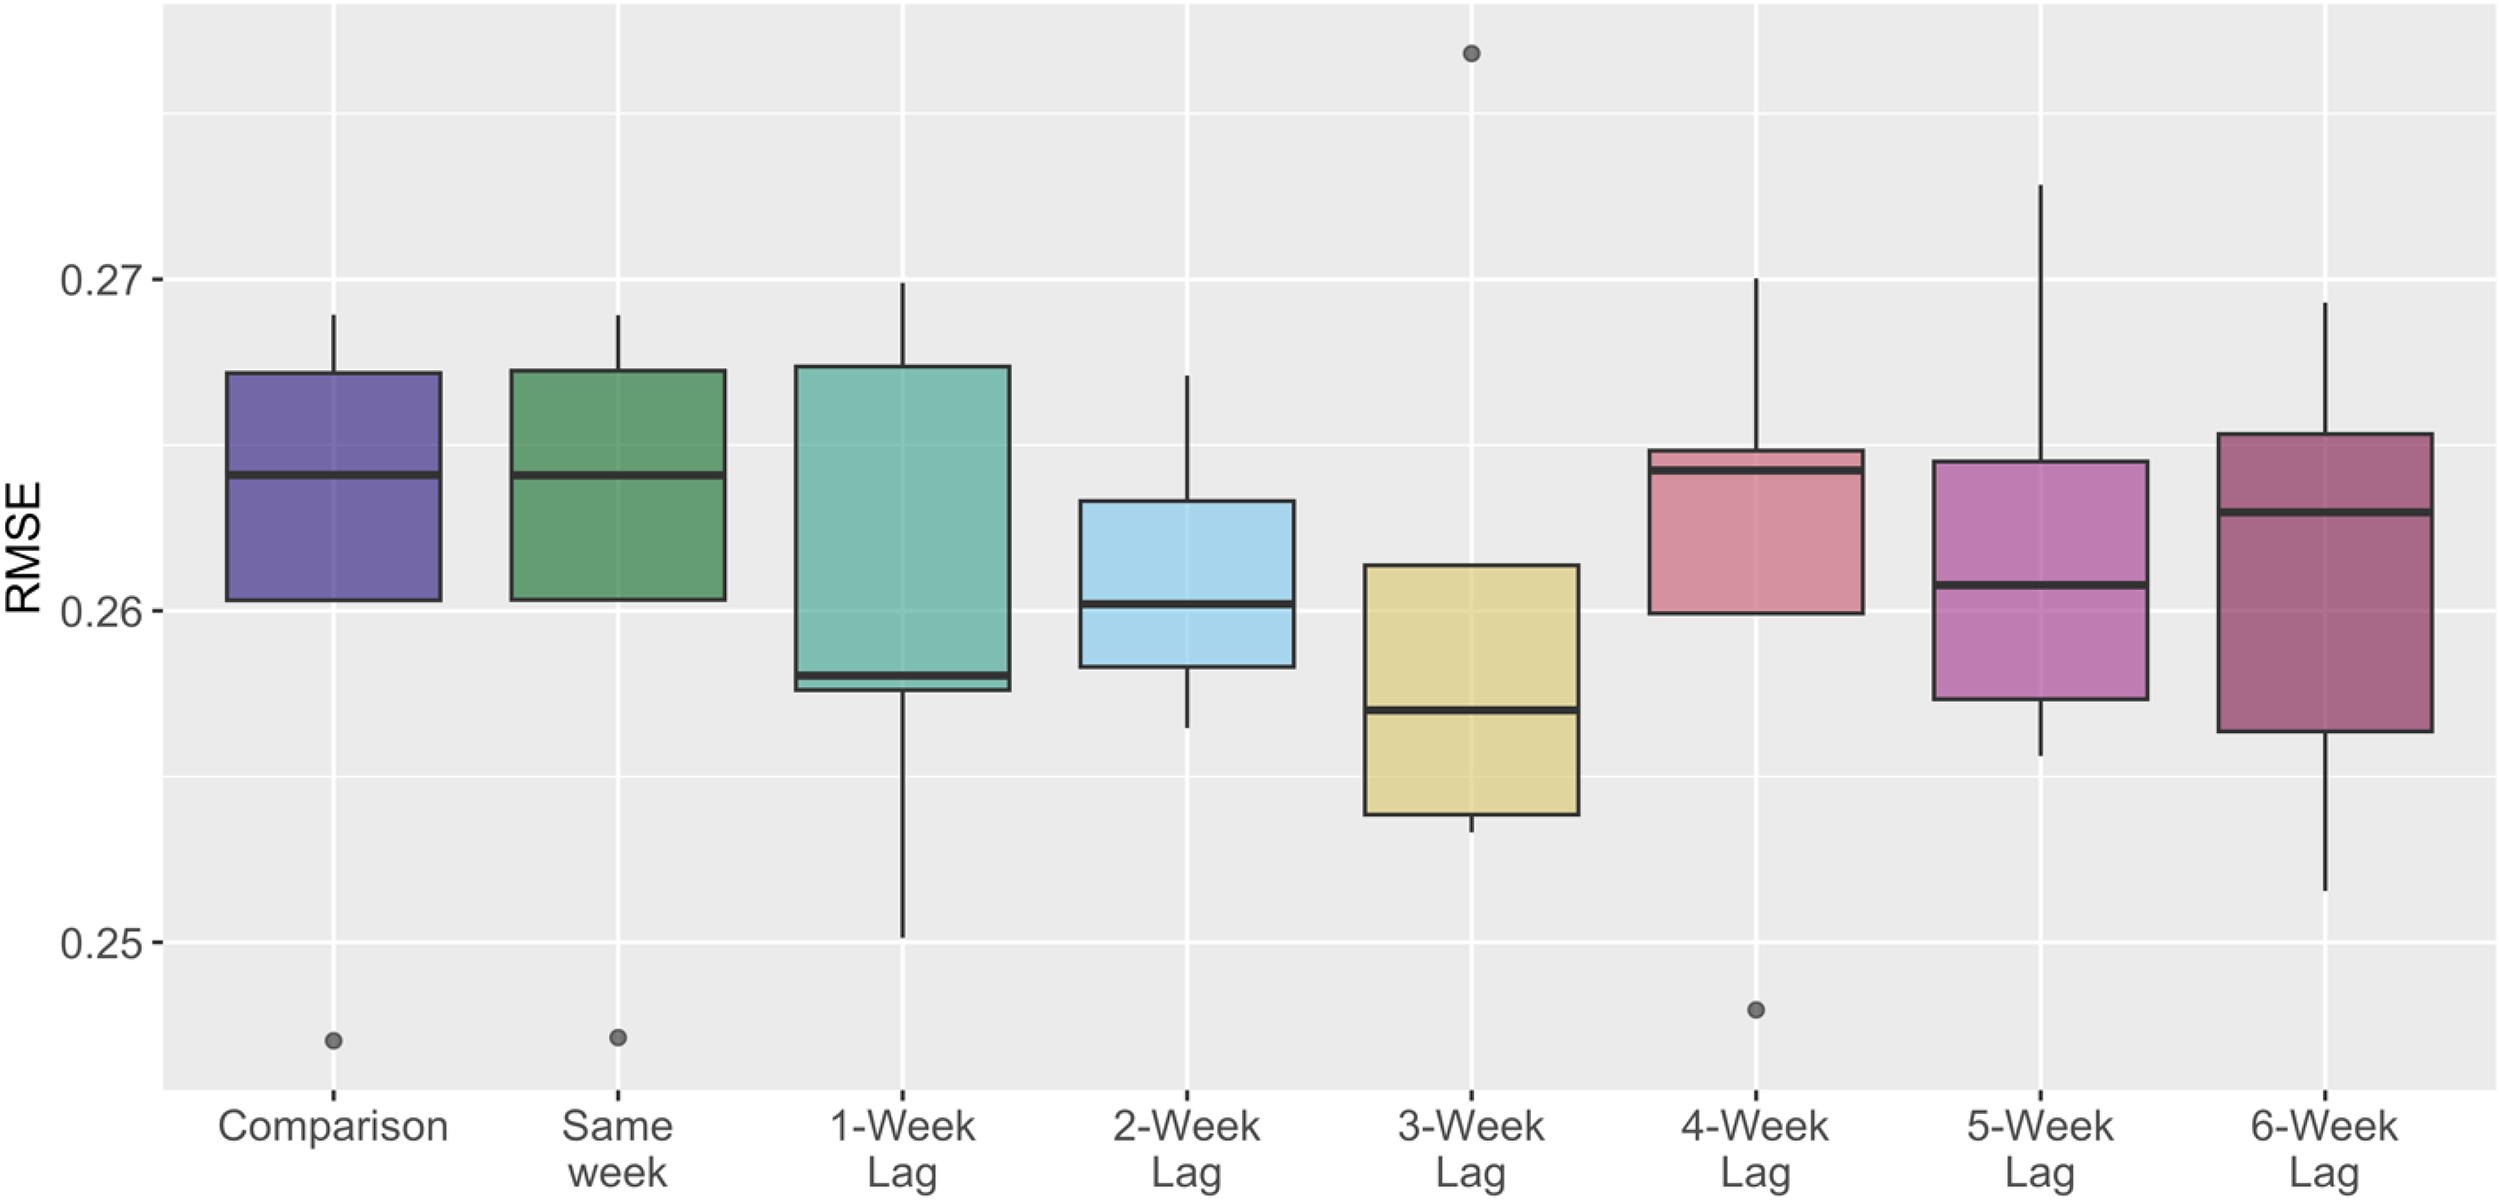
Predictive power of the time of online searches — RMSE comparison.
Next, we apply 5-fold cross-validation to four different statistical models to observe whether and how including online search (Google Trends-GT) indicators change the predictive power. The first model, named the comparison model, uses population and GDP as explanatory variables, as well as province-level fixed effects, and represents a more standard approach in the literature to predict migration. The GT-only model includes only the online search indicators (SPR and SP dummy variables) and province-level fixed effects, representing an approach for the most data-scarce situations. The paper model refers to the model shown in Table 1, column 4, which includes population and province-level fixed effects, and the online search indicators. The fourth model, shown as GT + comparison in Figure 3, is a merged model and uses all online search indicators, GDP, and population as explanatory variables, together with province-level fixed effects.
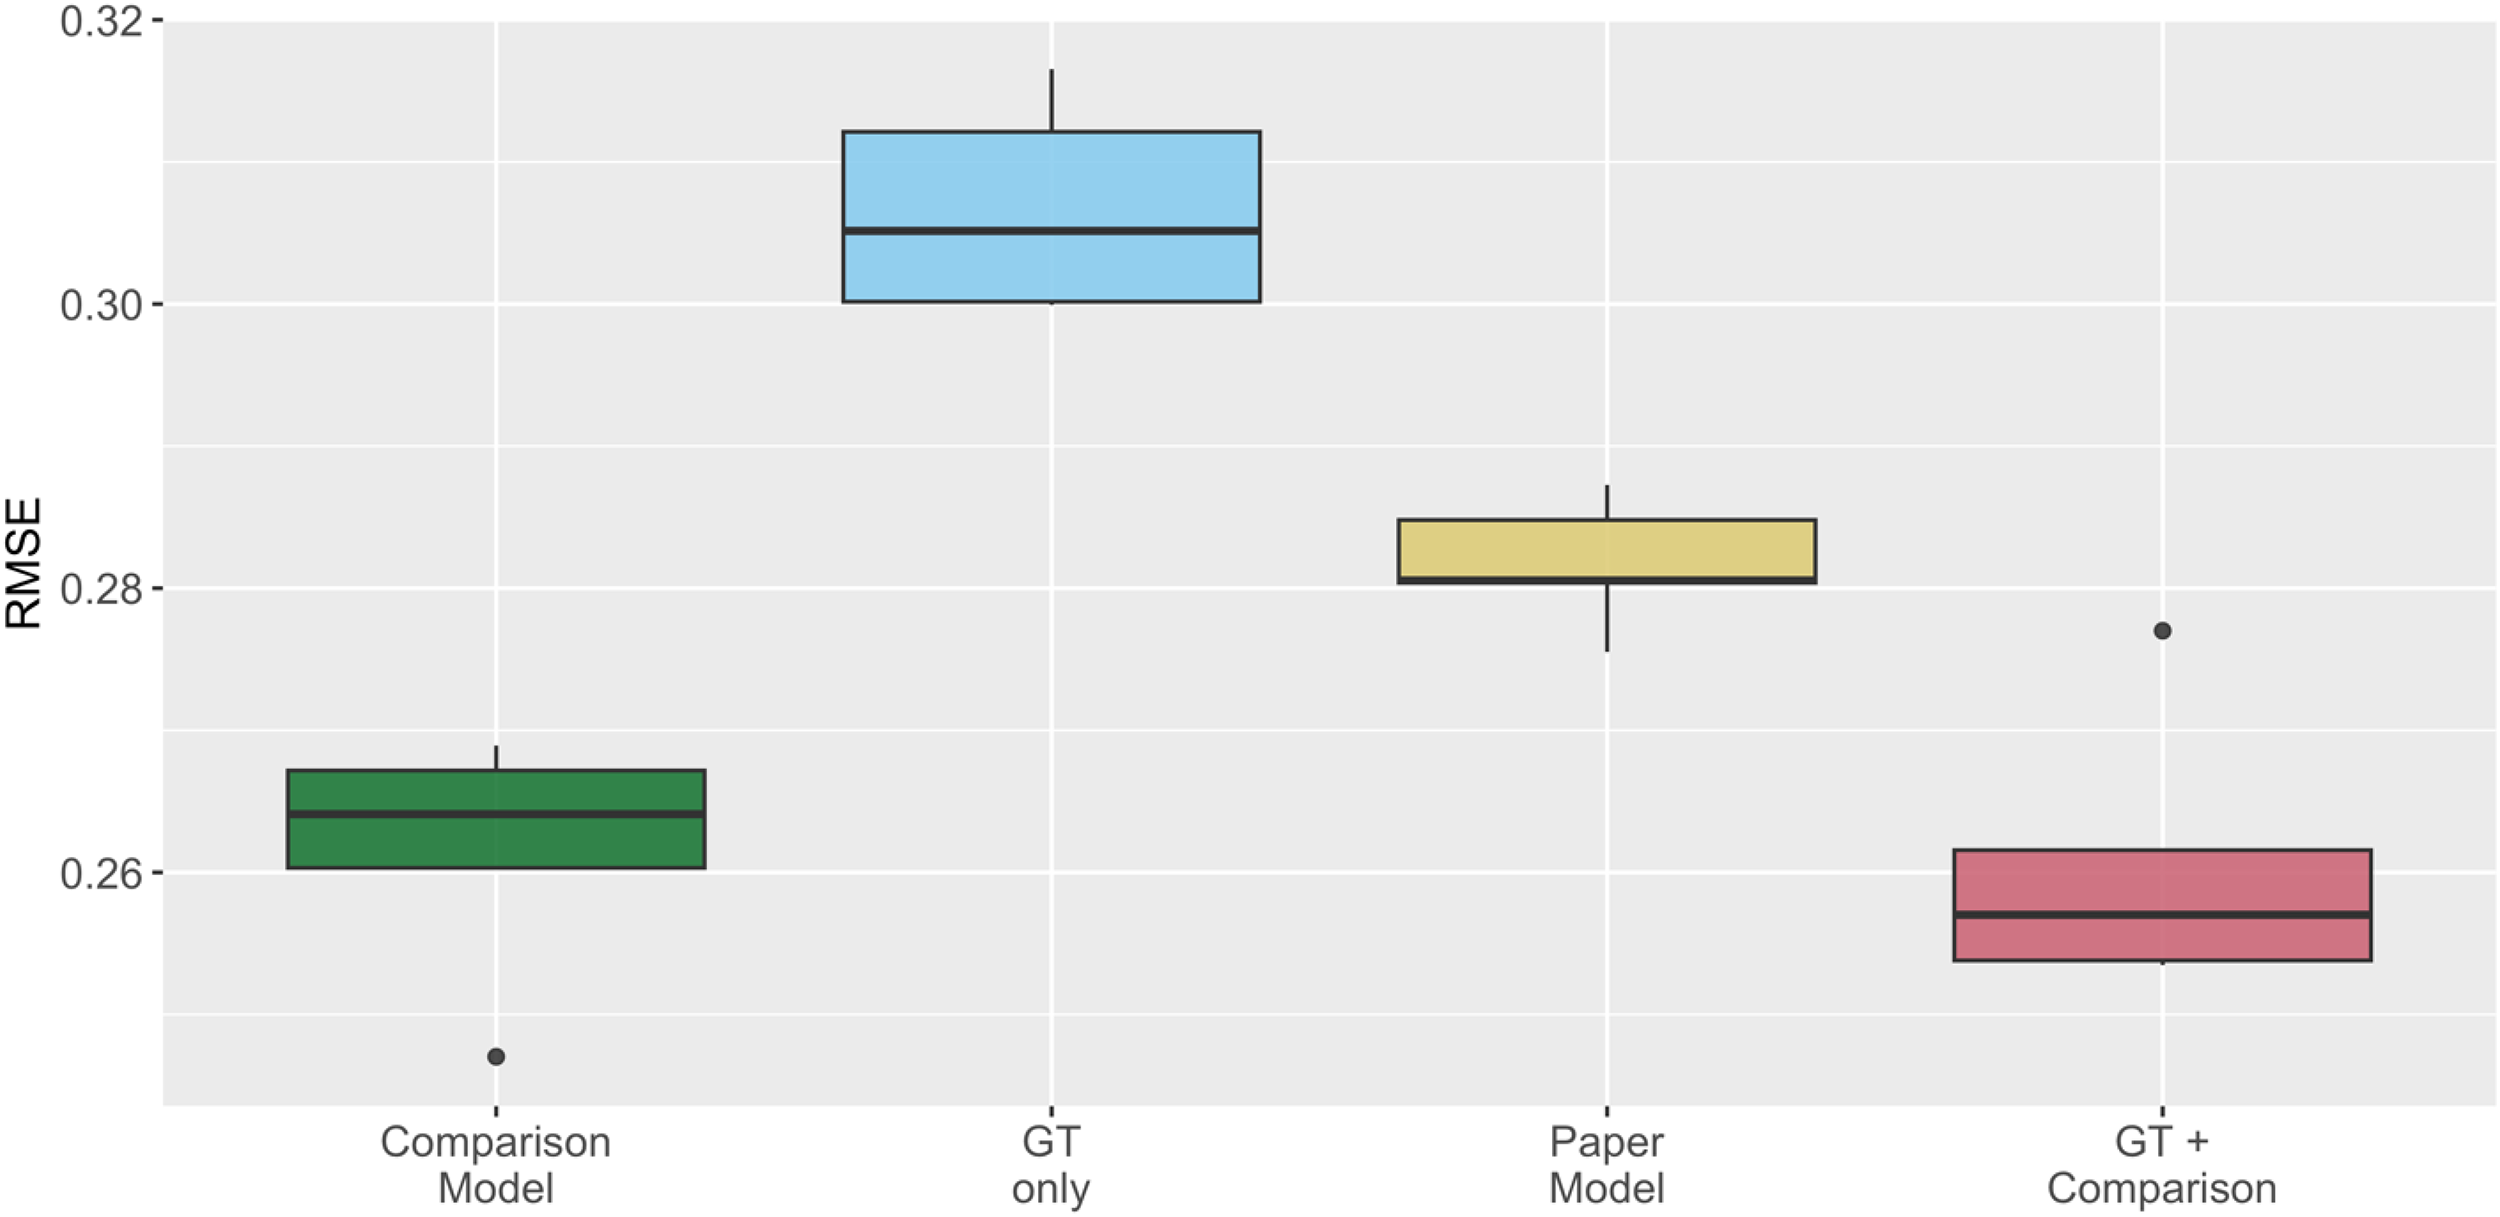
Predictive power of statistical models — RMSE comparison.
As Figure 3 demonstrates, the model that includes all variables, population, and GDP together with the GT indicators, on average, performs the best at predicting the SuTP stock across provinces. However, the model without GT indicators predicts the SuTP stock better than the paper and GT-only models. The RMSE value of the GT-only model, despite being the highest comparatively, still poses an opportunity for the most data-scarce cases.
Exercise 2: Predictions on Held-out Data
In the second prediction exercise, we divide our dataset into two parts, train the models on the larger (train) portion of the dataset and predict the values in the smaller (test) portion of the dataset. We randomly determine the held-out data and then hold out 2019 (non-random data) from the dataset and repeat the prediction process. For the first round of predictions, the randomly selected held-out data consists of 2965 observations, referring to 30% of the dataset. To predict all observations in 2019, we hold out 30.3% of the dataset (2997 observations).
Figure 4 depicts a comparison of the RMSE values of different models (Table 5 in the Appendix) and shows their predictive performance on random and non-random data. The RMSE values resulting from the prediction of randomly selected observations show better predictive performance for the comparison model and the model that adds GT indicators to the comparison model. These results are in parallel with the results of the cross-validation exercise above (section “Exercise 1: k-Fold Cross-Validation”).
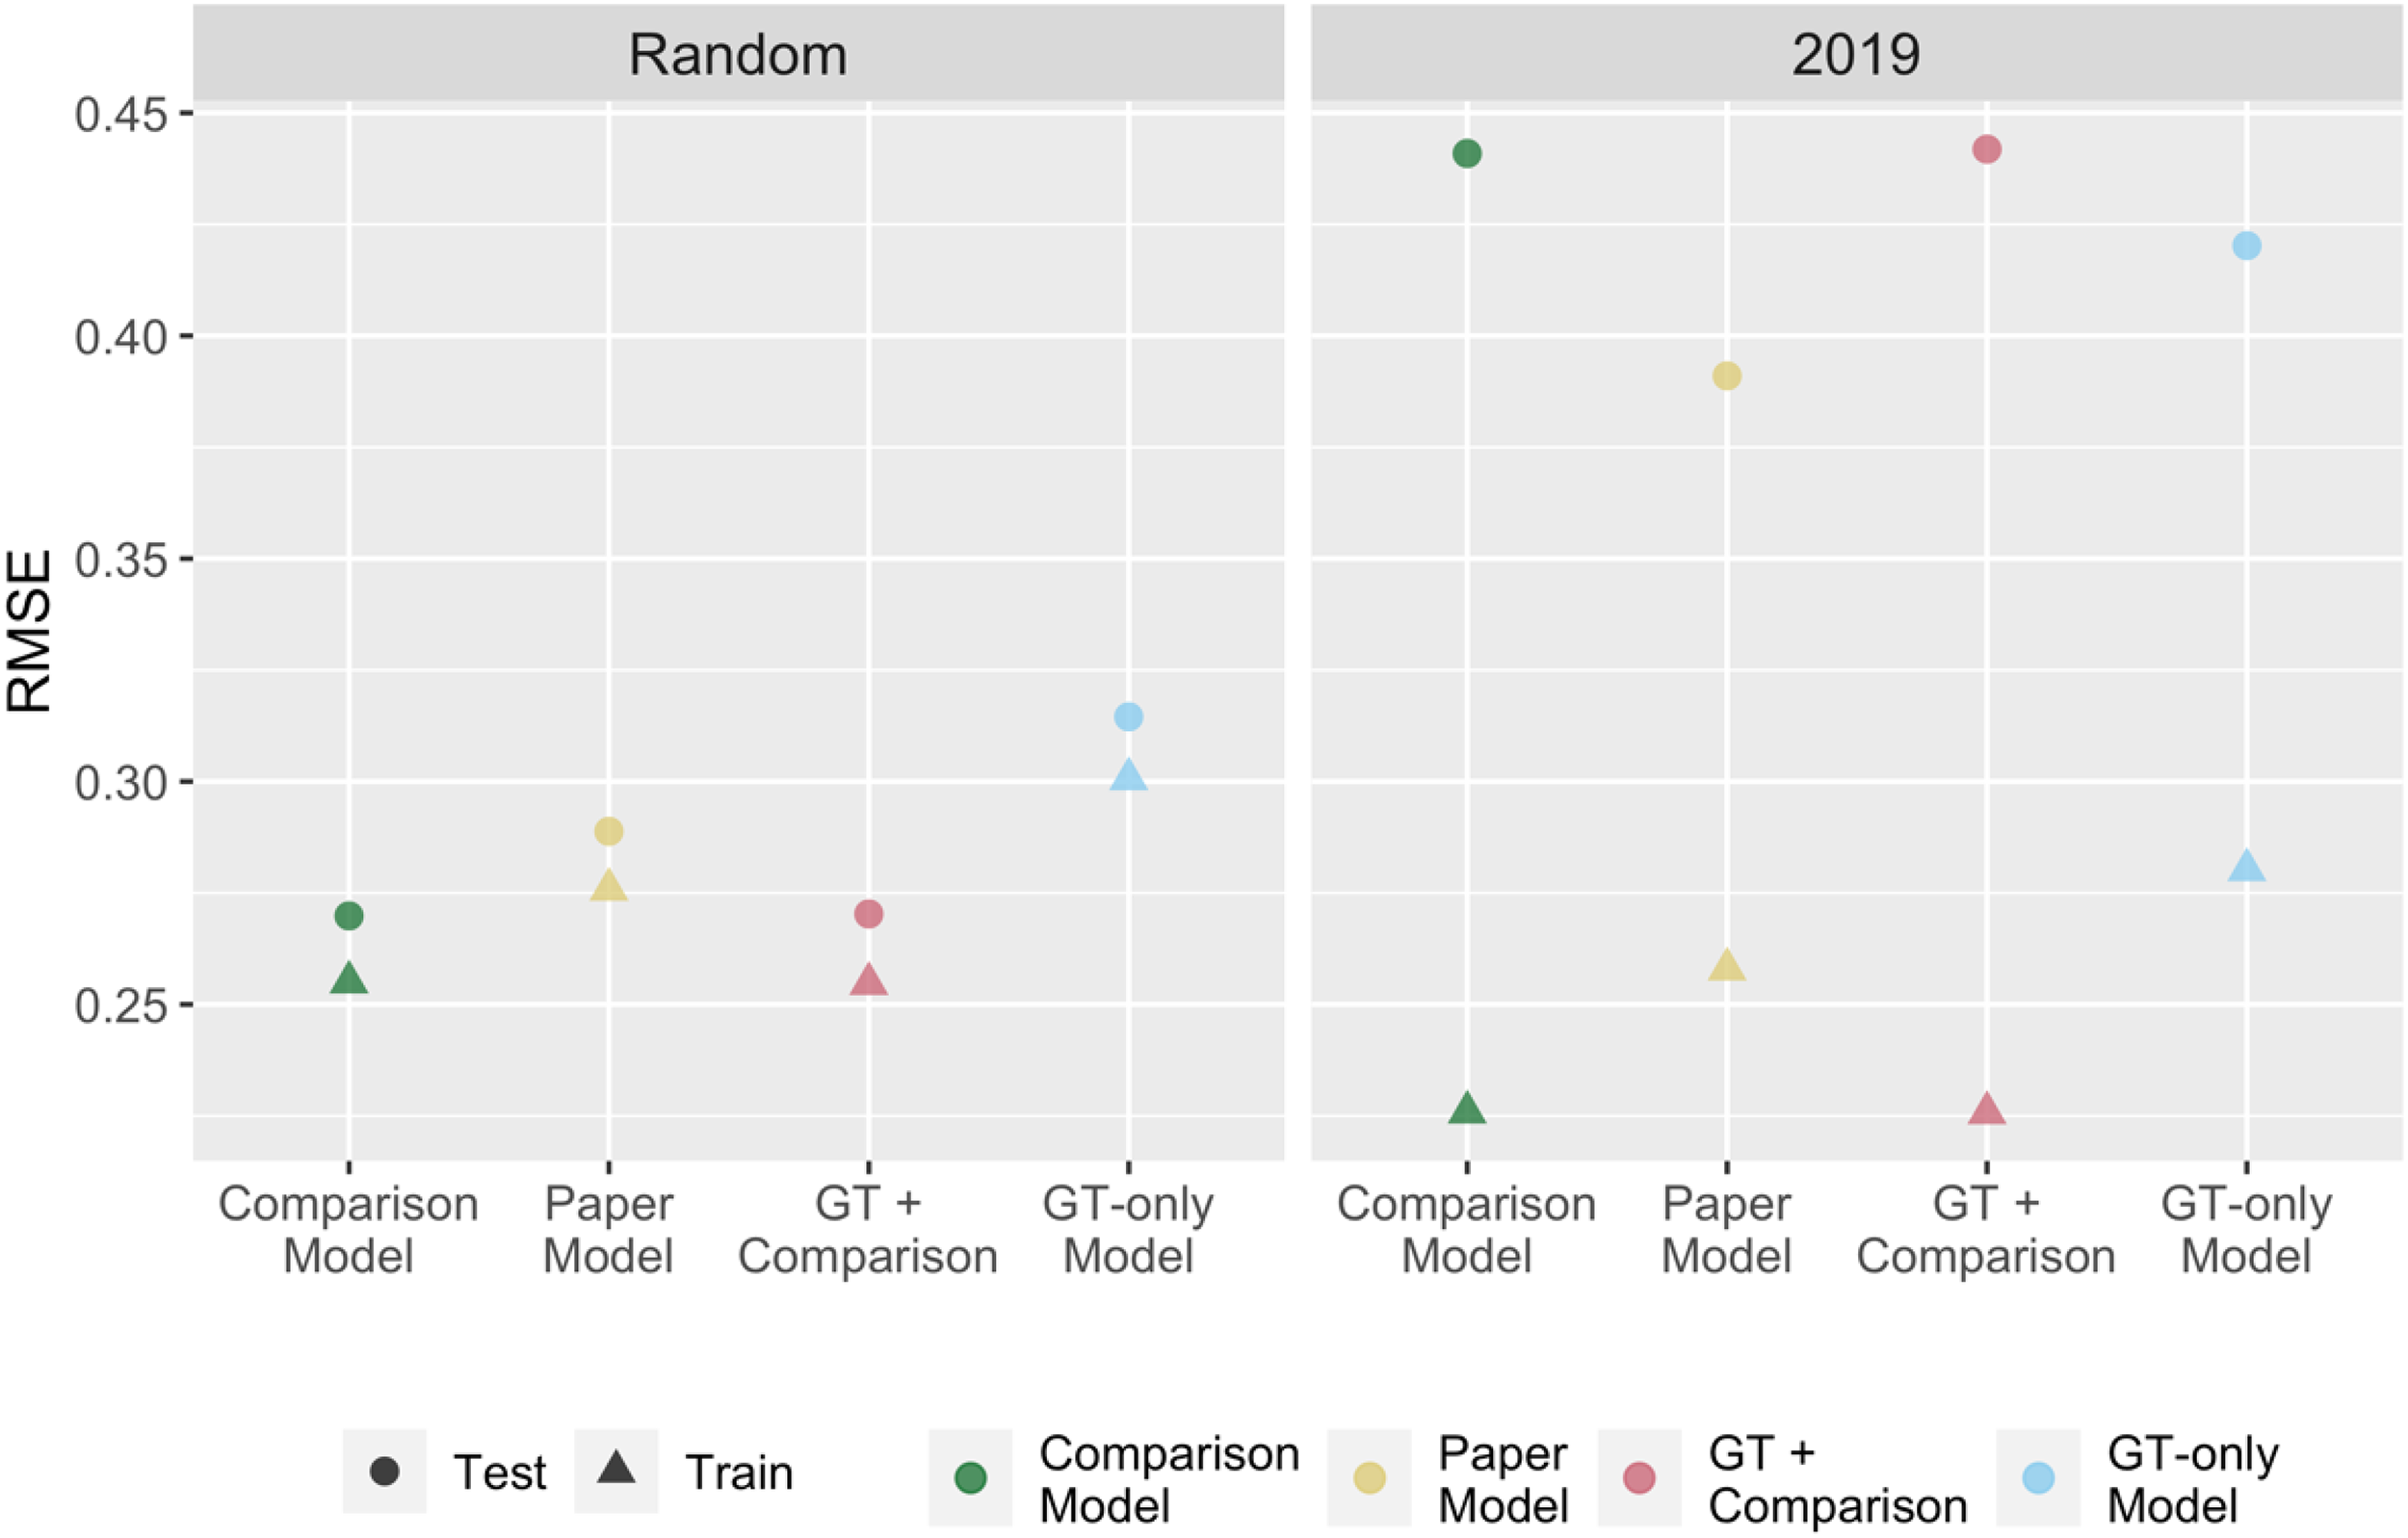
RMSE comparison of predictions on held-out data.
Prediction of SuTP stocks across provinces in the year 2019 (non-random sample), however, shows a contrasting picture. We observe the lowest RMSE values in test data with the paper model, which includes the GT indicators, population, and province-level fixed effects. The second-best test data RMSE value is observed for the model that relies only on GT indicators (SPR and SP dummy variables) and fixed effects. The two models that perform the best at predictions on randomly selected data have higher RMSE values in test data than the models that highlight the GT indicators more. Furthermore, these models show a higher difference between the RMSE values in train and test data, indicating more overfitting. It should be noted that the GDP and population variables are measured annually, while the dependent variable to be predicted (SuTP stock) is measured weekly. This may explain the relative underperformance of more traditional indicators, as they would estimate a too-stable pattern, an issue underlined also by Böhme, Gröger and Stöhr (2020).
To better understand the prediction results for 2019 by different models, we focus on ten provinces with the highest and ten provinces with the lowest number of SuTP and visualize the predicted and actual values of SuTP to compare their patterns. We present these plots in Figure 5, and Figure 10 in the Appendix, respectively, and interpret the results based on their RMSE. For both cases, the predicted values by the comparison model and the GT + comparison model mostly overlap and, therefore, are hard to distinguish on the graphs. In addition to the stable patterns of SuTP stocks predicted by these two models, they also overestimate the SuTP stock for all ten provinces with the highest number of SuTP.
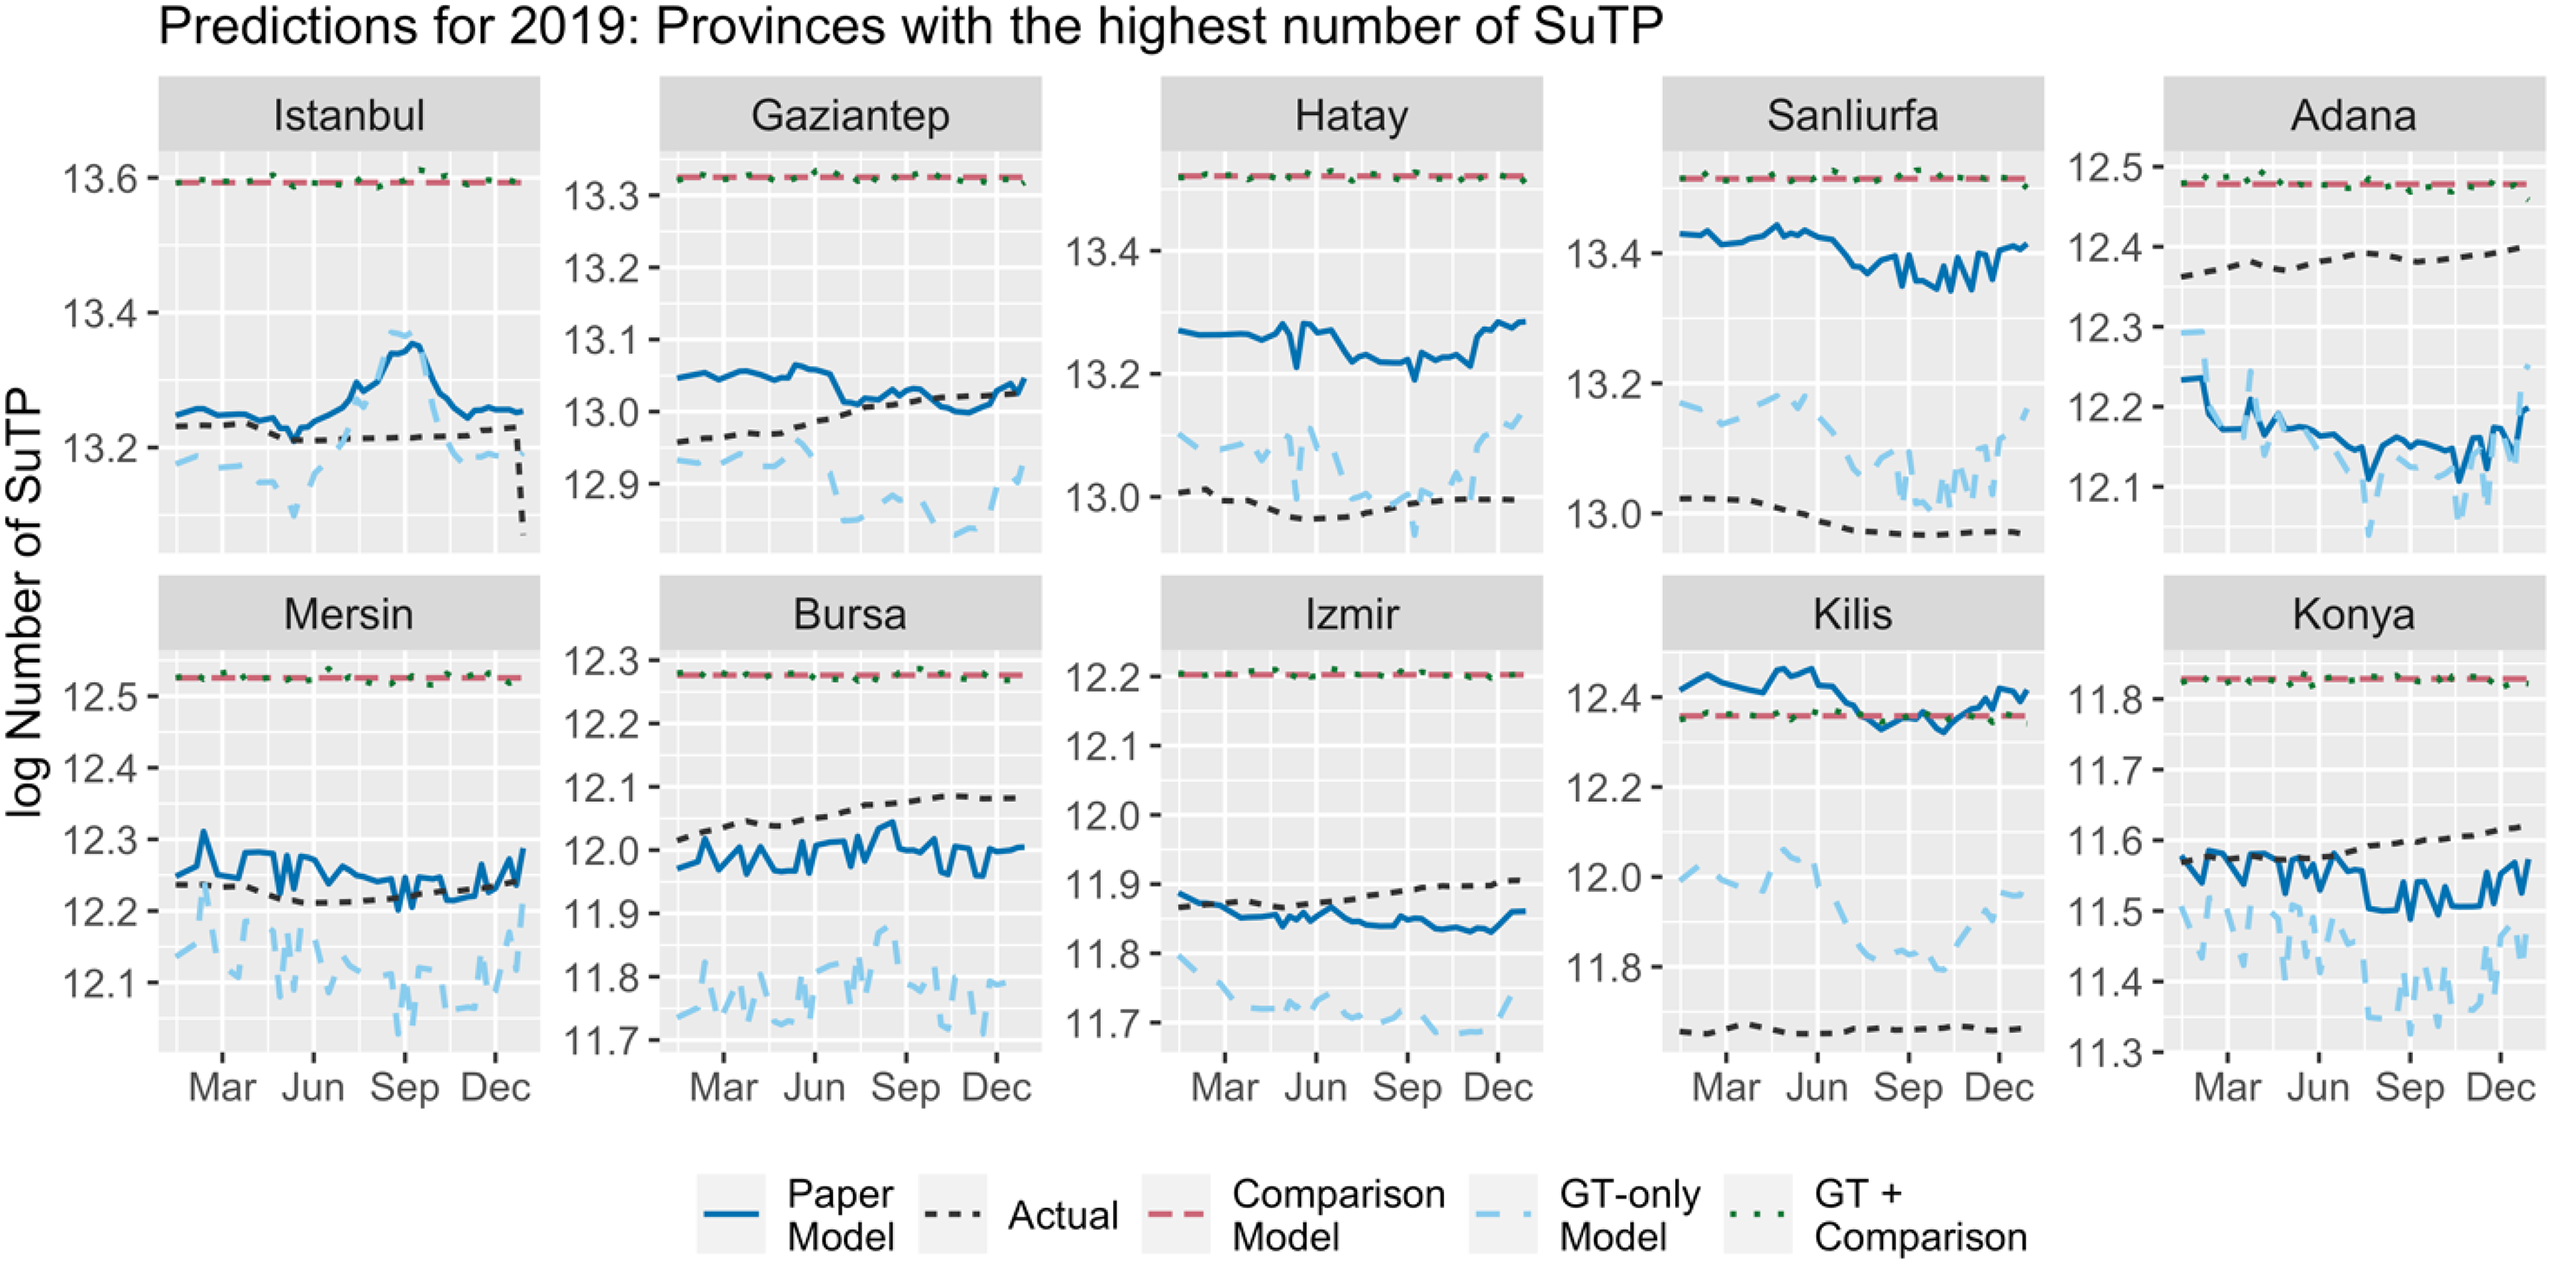
Predictions for the top ten SuTP-hosting provinces — 2019.
In the case of ten provinces with the highest number of SuTP, predictions based on the paper model are the closest to the actual numbers in six provinces. In three provinces, the GT-only model outperforms all others and produces the most accurate predictions. Only in the case of Adana, we see that both the paper model and the GT-only model underestimate the SuTP stock and the best-performing model for this province is the GT + comparison model, despite the overestimation. Of these ten provinces, four are located along the Syrian border (Gaziantep, Hatay, Sanliurfa, and Kilis), two are metropolitan areas relatively close to the border (Adana and Mersin), and four are metropolitan areas relatively far from the border (Istanbul, Bursa, Izmir, and Konya). For all the provinces relatively far from the Syrian border, the paper model produces the most accurate predictions, and all three provinces (Hatay, Sanliurfa, and Kilis), for which the GT-only model has the most accurate predictions, are located on the border. For all these ten provinces, the best predictions belong to the models that take into account the GT indicators.
In contrast to Figure 5, Figure 10 in the Appendix depicts the predicted values for the ten provinces with the lowest number of SuTP. We highlight two points regarding these prediction results. First, in five 14 of these ten provinces, the GT-only model produces the closest values to the actual numbers. Second, in the four provinces with the lowest number of SuTP, an increase predicted by the paper model and GT-only model corresponds to a decrease in the number of SuTP. In these cases, the models likely misinterpreted an increase in online searches as migration to the province when it was migration out of it. It should be noted that despite this misinterpretation of the pattern in these cases, both models predicted the SuTP stock better than the comparison model and the GT + comparison model.
Our findings show that including Google Trends predictors in the model increases the predictive power, even if by a small margin, as evidenced in the literature (Choi and Varian 2009). Socio-economic indicators alone (comparison model) could be enough for the estimation of randomly selected observations based on reference data from the past and the future and in frequent intervals. However, the paper model performs the best when making forecasts on a year at frequent time intervals (such as weekly or monthly) based on data from previous years. In fact, even the model using only Google Trends predictors and province fixed-effects (the GT-only model) outperforms the comparison model in this case. In line with the findings of Böhme, Gröger and Stöhr (2020), we interpret these results as the advantage of using the finer time detail provided by the Google Trends predictors, compared to the data on socio-economic indicators reported annually and thus forecast a too-stable pattern.
Discussion
In the forced displacement context, register data are limited and often come too late, while survey data collection is challenging due to sensitivity issues and difficulties in the field. Real-time data is much needed for researchers and policy-makers when encountering a sudden flow of refugees, allowing them to better estimate what to expect in the short-term future and plan accordingly. In this study, we shed light on the potential of online searches as a predictor for stocks in the context of forced displacement by examining the case of Syrians under temporary protection in Turkey. Relying on the literature that suggests refugees in general and SuTP in Turkey in specific seek information online using smartphones and the internet (Ulutürk, Uysal and Varol 2019), we show that there is a positive and statistically significant association between the Google Trends Index for province names in Turkey and the number of SuTP across provinces. The association is robust to all the checks and controls applied. Our results corroborate the pattern of a small but significant correlation between online searches and patterns of behavior (Choi and Varian 2009).
Our findings show that the statistical significance and predictive power of online searches change when time lags are introduced. This result is reasonable considering that searching for information may precede the move and the time needed for preparation before travel. It is also coherent with the necessary bureaucratic steps to be taken, i.e., to register in a new province. Exploring the predictive power of online searches in estimating SuTP stocks, we also find evidence that taking Google Trends variables into account provides better insight into the stock patterns for predictions at short time intervals such as weeks or months. Socioeconomic variables used to predict migrant/refugee stocks, such as population and GDP, are mostly reported annually, and data availability at regional and subregional levels may be problematic. Google Trends data are available at daily, weekly, and monthly intervals depending on the length of the selected time period, and therefore advantageous in forecasting/nowcasting SuTP stock at frequent time intervals. The benefit of using Google Trends in forecasting the pattern of SuTP stocks at more granular detail in time in contrast to the overly stable pattern predicted by the socioeconomic indicators based on a single reporting period corroborates with the findings of Böhme, Gröger and Stöhr (2020) for international migration flows.
Our study contributes to the study of forced displacement using digital trace data. Building on the growing literature on estimating forced migration flows using online trace data (Leasure et al. 2023; Anastasiadou, Volgin and Leasure 2024), we present an example of using online search data to predict refugee stocks in the host country. The case study in our research has certain characteristics that enabled us to use online search data as a predictor. Syrian citizens have arrived in Turkey with the help of the open-border policy and have relative freedom to move inside the country. Surveys suggest a relatively high level of smartphone and internet usage. About 78 to 84% of Syrians in Turkey own a smartphone, and only 10% never use the internet (Sunata 2017; Merisalo and Jauhiainen 2020). Furthermore, differentiation between the local and refugee populations is possible as Turkish and Arabic use different alphabets. While our approach in this study can be applied to other cases of forced displacement, conditions of relatively free movement at the place of study (for stocks) and smartphone/internet usage should be more or less similar. If these conditions are present, our approach could be used to predict refugee accumulation in regions or cities and in almost real-time as the displacement occurs. It may be applied to a single country or the Schengen area in the EU due to free mobility. Future work could also adapt this case study for further research on internally displaced migrants (IDPs) if a differentiation strategy could be established, such as dialects or minority languages.
Although the above-mentioned circumstances enabled the use of online search data as a predictor, we must also acknowledge the limitations. The internet penetration rates of host and refugee populations and the existing digital divides pose a limitation for Google Trends data, as they do for all studies using digital trace data, and may create a bias in forecasting stock patterns. However, despite the challenges of the data and potential bias, we reiterate the argument in the literature that using online search data offers a useful predictor when data collection is challenging and real-time forecasting is needed for policy decisions. In the context of forced displacement, where data are not easily accessible but very important for researchers, policy-makers, and international organizations online search data offer an alternative source.
When using online search data as a predictor, keyword selection and differentiation of the focus group from the general population are crucial for the research design. The differentiation of refugees from the rest of the online community is generally possible by language and context-related keywords, similar to the strategy of the studies on online search data and international migration. Yet, once the refugees arrive at the destination country, their intentions to move within the country may be harder to track if the destination name is not coupled with the search phrases used since the province names remain unchanged in different languages, save for a few metropolitan areas. The alphabetical difference, if present, is helpful to exploit and isolate the online searches of refugees from the host population, as shown in our study. It must also be acknowledged that while the alphabetical difference helps differentiate between locals and refugees, we cannot claim that the SuTP do all online searches. In our case study, our strategy may capture online searches by Arabic-speaking tourists and unregistered Arabic-speaking migrants along with the online searches of SuTP. While this may create a bias in our results, the positive and significant relationship between SuTP stocks and online searches signal that this bias could be negligible in our study. Future research using online search data in the forced displacement context would be advised to identify a case-specific method to differentiate host and refugee populations. Alphabetical difference, if present, offers an opportunity, yet depending on the keywords of analysis, language differences may suffice. It should be noted that the widespread use of the language of the refugees by other migrants or minorities in the host country may create bias. Such case studies would benefit from accounting for the difficulty of nationality assumption in their research design and aiming to reveal the change in the online search patterns before and after the start of the forced displacement.
Our strategy to use the search popularity ratio (search popularity score of queries made by refugees over that of the locals) offers an extra measure to ensure that the interest in the province is not due to any other incident that may have happened in the said place. This strategy to compare the online searches of locals and migrants, as well as absorb the seasonal interest that may create bias, may also offer insight into future studies on cultural integration of migrants among host populations, where the online language use is the unit of analysis.
This study contributes to the migration literature by analyzing the statistical significance and demonstrating the predictive power of online search popularity in the context of forced displacement and using the case study of the movement of displaced Syrians within Turkey. We further contribute to the growing literature on online search data by exploiting the alphabetical difference to distinguish local and refugee populations and using the search popularity ratio as an explanatory variable. Our study does not pursue a causal relationship between online searches and refugee stocks but shows an association and uses this association to analyze the predictive power of online search data in the context of forced displacement (Kleinberg et al. 2015). Our findings show that while online search data outperform more commonly used socio-economic variables in predictions at frequent time intervals, online search data are far from outperforming them in random predictions. Based on these results, we conclude that a merged approach would be more beneficial overall, but in cases when real-time and frequent predictions are needed or forced displacement data and/or socio-economic data are lacking at subregional levels, online search data could provide a reliable range. The policy implications of these findings are harder to pin down. Future research may look into developing a set of keywords and phrases that refugees use to search for information online. For better capture of online information-seeking activity, we advise researchers to take alternative spellings and misspellings into account, especially in cases of forced displacement, where people can be assumed to arrive in the country with less information than regular migrants and alphabetical differences may complicate transliteration. Validation of these sets of keywords/phrases would be difficult, but once achieved, coupling these sets of keywords with the names of provinces would provide better information to policy-makers, social workers, and NGOs working with refugees about their needs. Further research on this topic can help urban policy-makers prepare for incoming refugees and national and international policy-makers to plan social assistance programs better.
Supplemental Material
sj-pdf-1-mrx-10.1177_01979183241275452 - Supplemental material for Search for a New Home: Refugee Stock and Google Search
Supplemental material, sj-pdf-1-mrx-10.1177_01979183241275452 for Search for a New Home: Refugee Stock and Google Search by Ebru Sanliturk and Francesco C. Billari in International Migration Review
Footnotes
Declaration of Conflicting Interests
The authors declared no potential conflicts of interest with respect to the research, authorship, and/or publication of this article.
Funding
The authors received no financial support for the research, authorship, and/or publication of this article.
Supplemental Material
Supplemental material for this article is available online.
Notes
References
Supplementary Material
Please find the following supplemental material available below.
For Open Access articles published under a Creative Commons License, all supplemental material carries the same license as the article it is associated with.
For non-Open Access articles published, all supplemental material carries a non-exclusive license, and permission requests for re-use of supplemental material or any part of supplemental material shall be sent directly to the copyright owner as specified in the copyright notice associated with the article.