
Abstract
Digital trace data presents an opportunity for promptly monitoring shifts in migrant populations. This contribution aims to determine whether the number of European migrants in the United Kingdom (UK) declined between March 2019 and March 2020, using weekly estimates derived from the Facebook Advertising Platform. The collected data is disaggregated according to age, level of education, and country of origin. To examine the fluctuation in the number of migrants, a simple Bayesian trend model is employed, incorporating indicator variables for age, education, and country. The Facebook data indicates a downward trend in the number of European migrants residing in the UK. This result is further confirmed by the data from the Labour Force Survey. Notably, the outcomes reveal that in the run-up to Brexit, the most significant decline occurred among the age group of 20 to 29 years old – the largest migrant group – and the tertiary educated. This analyses could not be implemented with traditional data sources such as the Labour Force Survey, because this level of disaggregation is not provided. However, there are also important limitations associated with digital trace data, such as algorithm changes and representativeness. These limitations need to be addressed by employing sound statistical methodologies. Nevertheless, this research shows the potential of digital trace data in anticipating migration trends at a timely granularity and informing policymakers.
Introduction
One of the highly discussed benefits of digital trace data is its timeliness. This type of data is often described as always on, timely, or [having] velocity (De Mauro, Greco, and Grimaldi 2016; Salganik 2017). These are important characteristics that benefit the study of migration, which is a volatile process. Previous research has used digital trace data to investigate migration in the US, Latin America, and Europe (Zagheni, Weber, and Gummadi 2017; Alexander, Polimis, and Zagheni 2019, 2020; Gendronneau et al. 2019; Rampazzo et al. 2021), as well as the internal displacement of the population in Ukraine as a consequence of the Russian invasion (Leasure et al. 2023). In particular, Alexander, Polimis, and Zagheni (2019) collected Facebook advertising data to examine the impact of Hurricane Maria on out-migration from Puerto Rico.
In a similar vein, this research aims to determine whether Facebook Advertising Platform data alone can be used to analyse the weekly trends in the number of European migrants in the United Kingdom (UK) in the run-up to Brexit – United Kingdom's departure from the European Union – in 2019–20. To achieve this, a simple Bayesian trend model incorporating indicator variables for age, education, and country is employed. The analysis primarily focuses on the changes in trends and relative variations in the number of migrants rather than estimating the absolute volumes. For a detailed examination of combining digital trace data and survey data, refer to Rampazzo et al. (2021).
In this contribution, the broader objective is to analyse the impact of the uncertainty and threat associated with Brexit – United Kingdom's departure from the European Union – on the stocks of European migrants categorised by age, education, and country of origin at a critical period during the departure process. In general, Brexit has been an ongoing process that commenced in 2016 and concluded in 2023, resulting in a prolonged transition period that brought economic and political changes not only to the UK but also to the rest of the EU and the world. Since 2016, the Office for National Statistics (ONS) has reported a positive yet declining net migration of EU nationals to the UK (ONS 2017, 2022). In line with the motto of former British Prime Minister Theresa May, Brexit means Brexit, the primary focus of this article is therefore to examine whether Brexit will lead to a significant exodus, termed “Brexodus,” of continental Europeans from the UK.
To assess this, weekly time series data on EU migrants in the UK was collected from the Facebook Advertising Platform, starting in January 2018. However, in this study, only the period from March 2019 to March 2020 is analysed, focusing on weekly estimates of European migrants. There are three main reasons for choosing this specific time period. First, a global Facebook algorithm change in March 2019 impacted the accuracy of migrant estimates worldwide (Palotti et al. 2020). The effect of this algorithm change on Facebook data was described in Rampazzo et al. (2021), which noted a decrease in the estimates of the number of migrants living abroad.
The second reason is that this algorithm change coincided with the beginning of the UK's transition period for exiting the EU after the referendum. Consequently, it is prudent to concentrate the analysis on the time period following the algorithm change to mitigate potential causal inference effects. Lastly, data from after March 2020 is influenced by the COVID-19 pandemic and subsequent lockdown restrictions, making it all the more important to study the period from March 2019 to March 2020. This time frame allows insights into the decision-making process of EU migrants regarding whether to remain or leave the UK, given that by that time four years have passed since the Brexit Referendum in 2016. Additionally, disaggregating the data by age, education, and country can provide valuable information about variations in trends among these groups.
There is no ‘ground truth’ to validate the trends from the Facebook Advertising Platform data. Several British migration scholars have indicated uncertainties in the estimates provided by the Office for National Statistics (ONS) (Gordon 2021; Portes 2021; Sumption 2021). The available data sources suggest a 10% decline in migrants in the UK in 2020 (Sumption 2021). However, concerns persist regarding the reliability of these estimates, as the COVID-19 pandemic disrupted the collection of other migration data, both from the International Passenger Survey (IPS) and the database of the National Insurance Numbers (NINO). Furthermore, the Labour Force Survey (LFS), a household survey, is not considered a fully reliable source due to its inadequate representation of recently arrived migrants (Sumption 2021). The estimation of the number of migrants in the UK has a history of large uncertainty, evident from the reclassification of migration statistics as “experimental statistics” in August 2019 (ONS 2019b). Currently, there is no established benchmark for comparing migration statistics in the UK.
Background
The decision-making process for migration is intricate, encompassing multiple stages and dimensions. Understanding the drivers of migration is a challenging, and to date, there is no comprehensive theory that can fully explain it (Willekens 1983, 2019; Bijak and Czaika 2020). The decision to migrate is linked to economic, social, and political factors related to both the area of origin and destination; i.e., the push and pull factors that make one area more attractive than another (Lee 1966). There are certain contexts that facilitate migration (Massey et al. 1993, 1999) because their environment is perceived as suitable for new opportunities (Bijak and Czaika 2020). However, as suggested by Bijak and Czaika (2020), migration drivers are generally not static but change dynamically.
On 22nd February 2016, David Cameron, then British Prime Minister, announced the date of the Brexit Referendum when the UK citizens would be asked whether they wanted to continue to be part of the EU. As is widely known, the referendum on the UK's EU membership was held on 23rd June 2016, with 51.9% of the voters choosing to leave the EU. After the vote, UK politicians have continued to debate how exactly to leave the EU. Two general elections (June 2017 and December 2019) and three Brexit extensions (March 2019, April 2019, and October 2019) took place, leading to a total of three successive governments led by David Cameron, Theresa May, and Boris Johnson since the Brexit referendum. On 23rd January 2020, the Withdrawal Agreement became law, and the UK left the EU politically, but not economically, on 31st January 2020. This also marked the start of the transition period that ended on 31st December 2020. All the events mentioned are summarized in a House of Commons briefing by Walker (2020).
Until the Brexit Referendum, the UK was an attractive destination within the EU migration system, with high levels of net migration (also shown in Figure 1). Several Quarterly Reports from the Office for National Statistics (ONS 2017, 2019a, 2020) show that net migration from EU countries to the UK was positive until 2020, even though it has been falling since 2016. The ONS also suggests that there is a decreasing number of EU migrants moving to the UK for work-related reasons. Working and studying are the two most popular reasons for EU migrants to move to the UK (Kierans 2020). The recent estimates of National Insurance Numbers (NINo) indicate a declining trend in the number of new EU migrant social security registrations compared to previous years. In the year ending March 2020, EU nationals accounted for 57% of the registrations, whereas the figure was 65% in 2019 (DWP 2020). The ONS is not the only source that is suggesting a loss in attractiveness for EU migrants to the UK labour market: indeed, LinkedIn data also suggests that professional migration from EU countries has decreased by 30% since 2016, and that recruiters have started to consider mostly individuals already in the UK 1 .
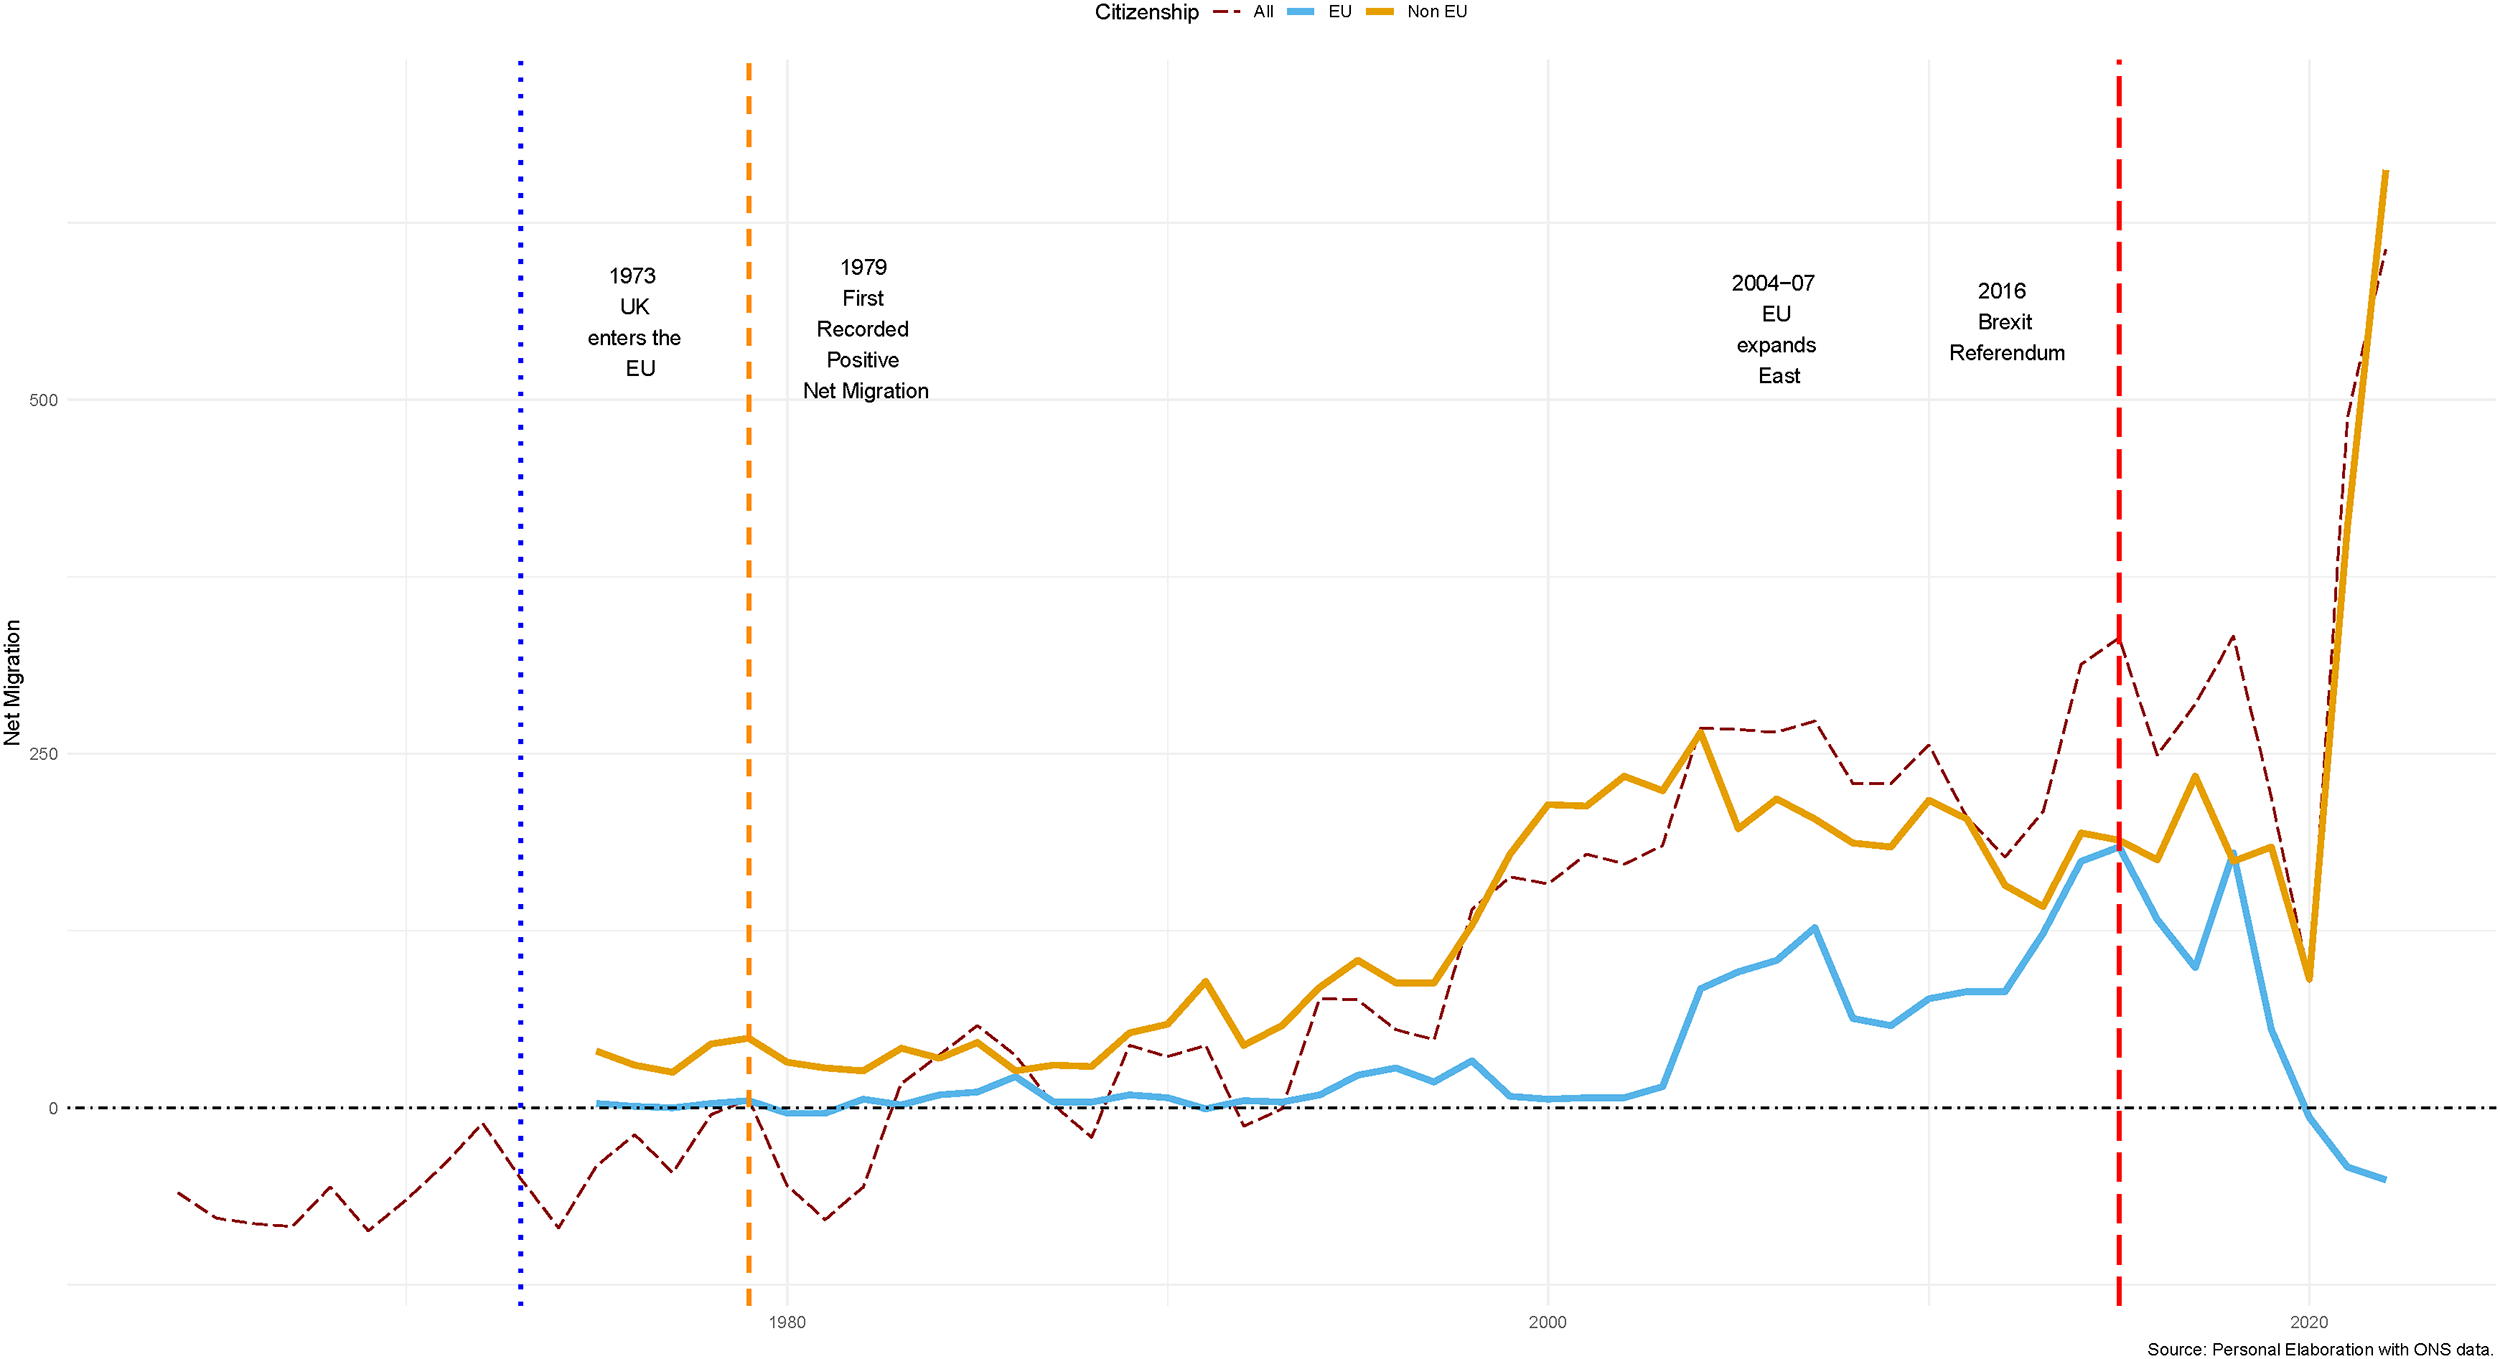
Net migration Estimates of Long-Term Migrants from 1964 to 2022, Based on Data from the Office for National Statistics (ONS). The Long-Term Migrants Are Categorised into Three Groups: All Migrants (Represented by the Dashed Dark Red Line), European Migrants (EU) (Represented by the Light Blue Line), and Non-European Migrants (Non-EU) (Represented by the Orange Line). The Estimates from 2018 Are Considered Experimental by the ONS.
According to Czaika, Bijak, and Prike (2021), four conceptual dimensions of migration can be defined as formation of aspirations, availability and use of information, time and decision horizon, and the locus of control. In the context of voluntary migration, rather than forced migration, everyone could be a potential migrant. However, the formation of migration aspirations is context-dependent and linked to individual factors. Potential migrants need to evaluate multiple pieces of information and consider both measurable risks and immeasurable uncertainties in their decision-making process (Knight 1921). The neoclassical economic theory of migration states that potential migrants engage in a process of searching for information about the destination country in order to make the best decision (Epstein 2008). In the last few decades, access to information has increased, thanks in part to the development of the internet, and it has been shown to be a source of information used by migrants (Pesando et al. 2021). Despite the possibility of gaining more information, there are always imbalances and uncertainties in risks and opportunities related to migration.
As concerns risks, Czaika (2015) suggests that the prospect theory, originally proposed by Kahneman and Tversky (1979), can be used to study the decision-making process of migrants. Migrants are considered to be risk-loving individuals (Sahota 1968). However, recent studies have shown that potential migrants assess risks and opportunities subjectively and context-dependent (Mironova, Mrie, and Whitt 2019; Czaika, Bijak, and Prike 2021). Indeed, migration is viewed as an investment project for the future, influenced by the “migration value” that takes into account the expected outcomes between the country of origin and the destination. There is a reference-dependent expectation between these two locations. In this sense, the decision might be affected by the historical timing at the time of the movement, as well as the temporal aspects related to the life course trajectories of individuals (see Griffiths, Rogers, and Anderson (2013) for a review). Historical events can either accelerate or impede migration routes, thereby influencing the decision-making process. This holds true even for migrants who are typically young individuals (Rogers and Castro 1981; Castro and Rogers 1984) and risk-takers (Gibson and McKenzie 2011; Williams and Baláž 2014). Migration is a decision that holds significance for many individuals, influenced by factors such as family and peer groups (Lee 1966), as well as personal aspirations and the desire for self-determination. However, aspirations alone must be supported by the means and opportunities to pursue migration (Carling and Schewel 2018).
Overall, the decision-making process for migration can rapidly change when influenced by risks and uncertainties that impact people's lives and quality of life. This is evident in various examples, such as the aftermath of Hurricane Katrina in Puerto Rico, which led to outmigration towards the US (Alexander, Polimis, and Zagheni 2019), the political and economic instability in Venezuela (Palotti et al. 2020), and the Russian invasion of Ukraine, resulting in a vast refugee influx to Europe (Minora et al. 2022). It is worth noting that digital traces data appears to be able to capture these changes in a more timely manner than traditional data sources, although at the same time being itself subject to biases and errors.
The entire Brexit process has been characterised by uncertainty; the political uncertainty has had major repercussions on the lives of British citizens both in the UK and the EU, as well as EU migrants in the UK. On 1st January 2021, the UK will introduced a points-based migration system 2 . This new system effectively ends the era of the free movement of EU citizens to the UK and vice versa. After the transition period, EU migrants who were not living in the UK before 2021 have to apply for a visa to study and work in the UK. The EU migrants already living in the UK qualified to apply for right of residence in the UK until 30th June 2021 under the EU Settlement Scheme (Home Office Government 2020). The points-based migration system imposes visa costs on the applying migrant as well as the migrant's employer in the UK, English language requirements, and a general salary threshold of £25,600 (Home Office Government 2020). The system is intended to favor migration from highly skilled migrants with higher levels of education. This change in policy might have also had an effect on the migration flows to and from the UK given that it drastically changes reduces the rights of EU migrants to live and work in the UK.
The Brexit Referendum and transition process act as a shock in the migration system (Bijak and Czaika 2020), and are likely to end up with a significant change in the migration system in place. Uncertainty becomes an obstacle for migrants, affecting their decision-making (Portes 2016). Factors like slower employment growth, lifted transitional controls, and the economic impact of Brexit contribute to a decline in EU net migration (Portes 2016; Portes and Forte 2017). Legal and psychological factors, along with uncertainty about future rights, also play a role. It is essential to consider both short-term perceptions and potential long-term changes in EU citizens’ rights. It must be noted, however, that some EU migrants clearly still see opportunities in moving to the UK: although migration from the EU to the UK has visibly decreased, it has not stopped entirely.
In this research, Facebook Advertising Platform data by age, level of education, and country of origin are used to investigate whether there is a decreasing trend in the number (stock) of EU migrant monthly active users (MAUs) in the UK, and to compare the trends for different groups. One alternative source of data – the labour force survey (LFS) – might not be entirely suitable for investigating this change, because it cannot be disaggregated to such high level of detail, and at high time frequencies. Furthermore, LFS data does not allow for the documentation of changes in the stock of migrants by country of origin, age, and education simultaneously. However, to understand the consequences of Brexit on migration changes to the UK, it is of paramount importance to disaggregate the migrant stock based on these key socio-demographic characteristics.
Hypothesis
Based on the existing literature, we propose four hypotheses. Firstly, we anticipate a decrease in European migration to the UK. This decline may occur for two reasons: European migrants may choose to leave the country, and fewer European migrants may decide to migrate to the UK. The high level of uncertainty during the entire Brexit transition period might have reduced the number of people willing to migrate to the UK, while also increasing the number of individuals who have chosen to leave the country.
Secondly, previous studies indicate that especially labour migrants are typically individuals in their 20s or early 30s. Considering this, we would expect the uncertainty surrounding Brexit to particularly impact these age groups, resulting in fewer young migrants choosing to either stay in or migrate to the UK. Thirdly, the Brexit policy, with its emphasis on attracting highly skilled migrants through the new points-based system, may potentially encourage low and middle-skilled migrants to arrive before the end of the transition period.
Fourthly, we should consider potential differences between countries. In the preceding decade, a significant proportion of migrants originated from Eastern European countries. The uncertainty surrounding Brexit may slow down this trend, leading to a decrease in migration from Eastern Europe.
The four hypotheses are as follows:
There will be a decrease in the stock of European migrants. The decrease in migration will be more pronounced among younger age groups. Differences in education levels will result in a greater impact on individuals with a low and middle level of education. Variations among countries will be observed, with the largest and most recent groups of migrants (such as Eastern Europeans) being more affected.
In summary, our hypotheses suggest a decrease in European migration to the UK due to the combined effects of uncertainty, age-related decision-making patterns, the points-based system, and potential country-specific factors.
Data
The data was downloaded from the Facebook Advertising Platform every week since January 2018. pySocialWatcher was used to query the Facebook Marketing Application Programming Interface (API) (Araujo et al. 2017). An API is a set of rules and protocols that allows different software applications to communicate and share data with each other (Cooksey 2014). The interest was in downloading the number of migrants disaggregated by age, education, and country of origin. The data is available in two formats: Daily Active Users (DAUs) and Monthly Active Users (MAUs). For our analysis, we used the MAU data (for further details on the data, refer to Rampazzo et al. (2021)). The analysis did not include the sex disaggregation as Rampazzo et al. (2021) underline that there does not seem to be strong divergence across sex by country. Therefore, further dividing the estimates by sex in this analysis might lead to a loss of power in the Facebook estimates that are already disaggregated by age, education, and country of origin. As a consequence, the data enables us to count, for each week, the number of migrants in the UK disaggregated by the following categories::
age groups: 15–19, 20–29, 30–39, 40–49, and 50+ years old; education levels: Secondary (No Degree, In High School, High School), Tertiary (In College, In Grad School, Graduated)
3
, and Unspecified; countries of origins: France, Germany, Ireland, Italy, Latvia, Portugal, Poland, Romania, and Spain. The choice of countries of origin is restricted to the top nine European countries of origin of migrants residing in the UK, according to the LFS, as well as the countries available in the Facebook Advertising Platform.
The data series collected from Facebook offer an opportunity for researchers as they bring timeliness and a potentially wider coverage of the migrant populations. Digital traces data, however, also present limitations as it is not representative of the entire population and is based on self-reported and algorithmically confounded variables (Cesare et al. 2018). The education variable is an example of a self-reported variable, in which the “Unspecified” category makes it difficult to fully interpret the distribution in terms of education of the migrant Facebook users.
In Figure 2, the data from the Facebook Advertising Platform is compared using a logarithmic transformation. The figure consists of nine panels, each representing a different country (i.e., France, Germany, Ireland, Italy, Latvia, Portugal, Poland, Romania, and Spain). Each panel contains two lines: the weekly estimates from the Facebook Advertising Platform data are shown in purple, and the data from the Labour Force Survey (LFS) is shown in yellow for comparison.
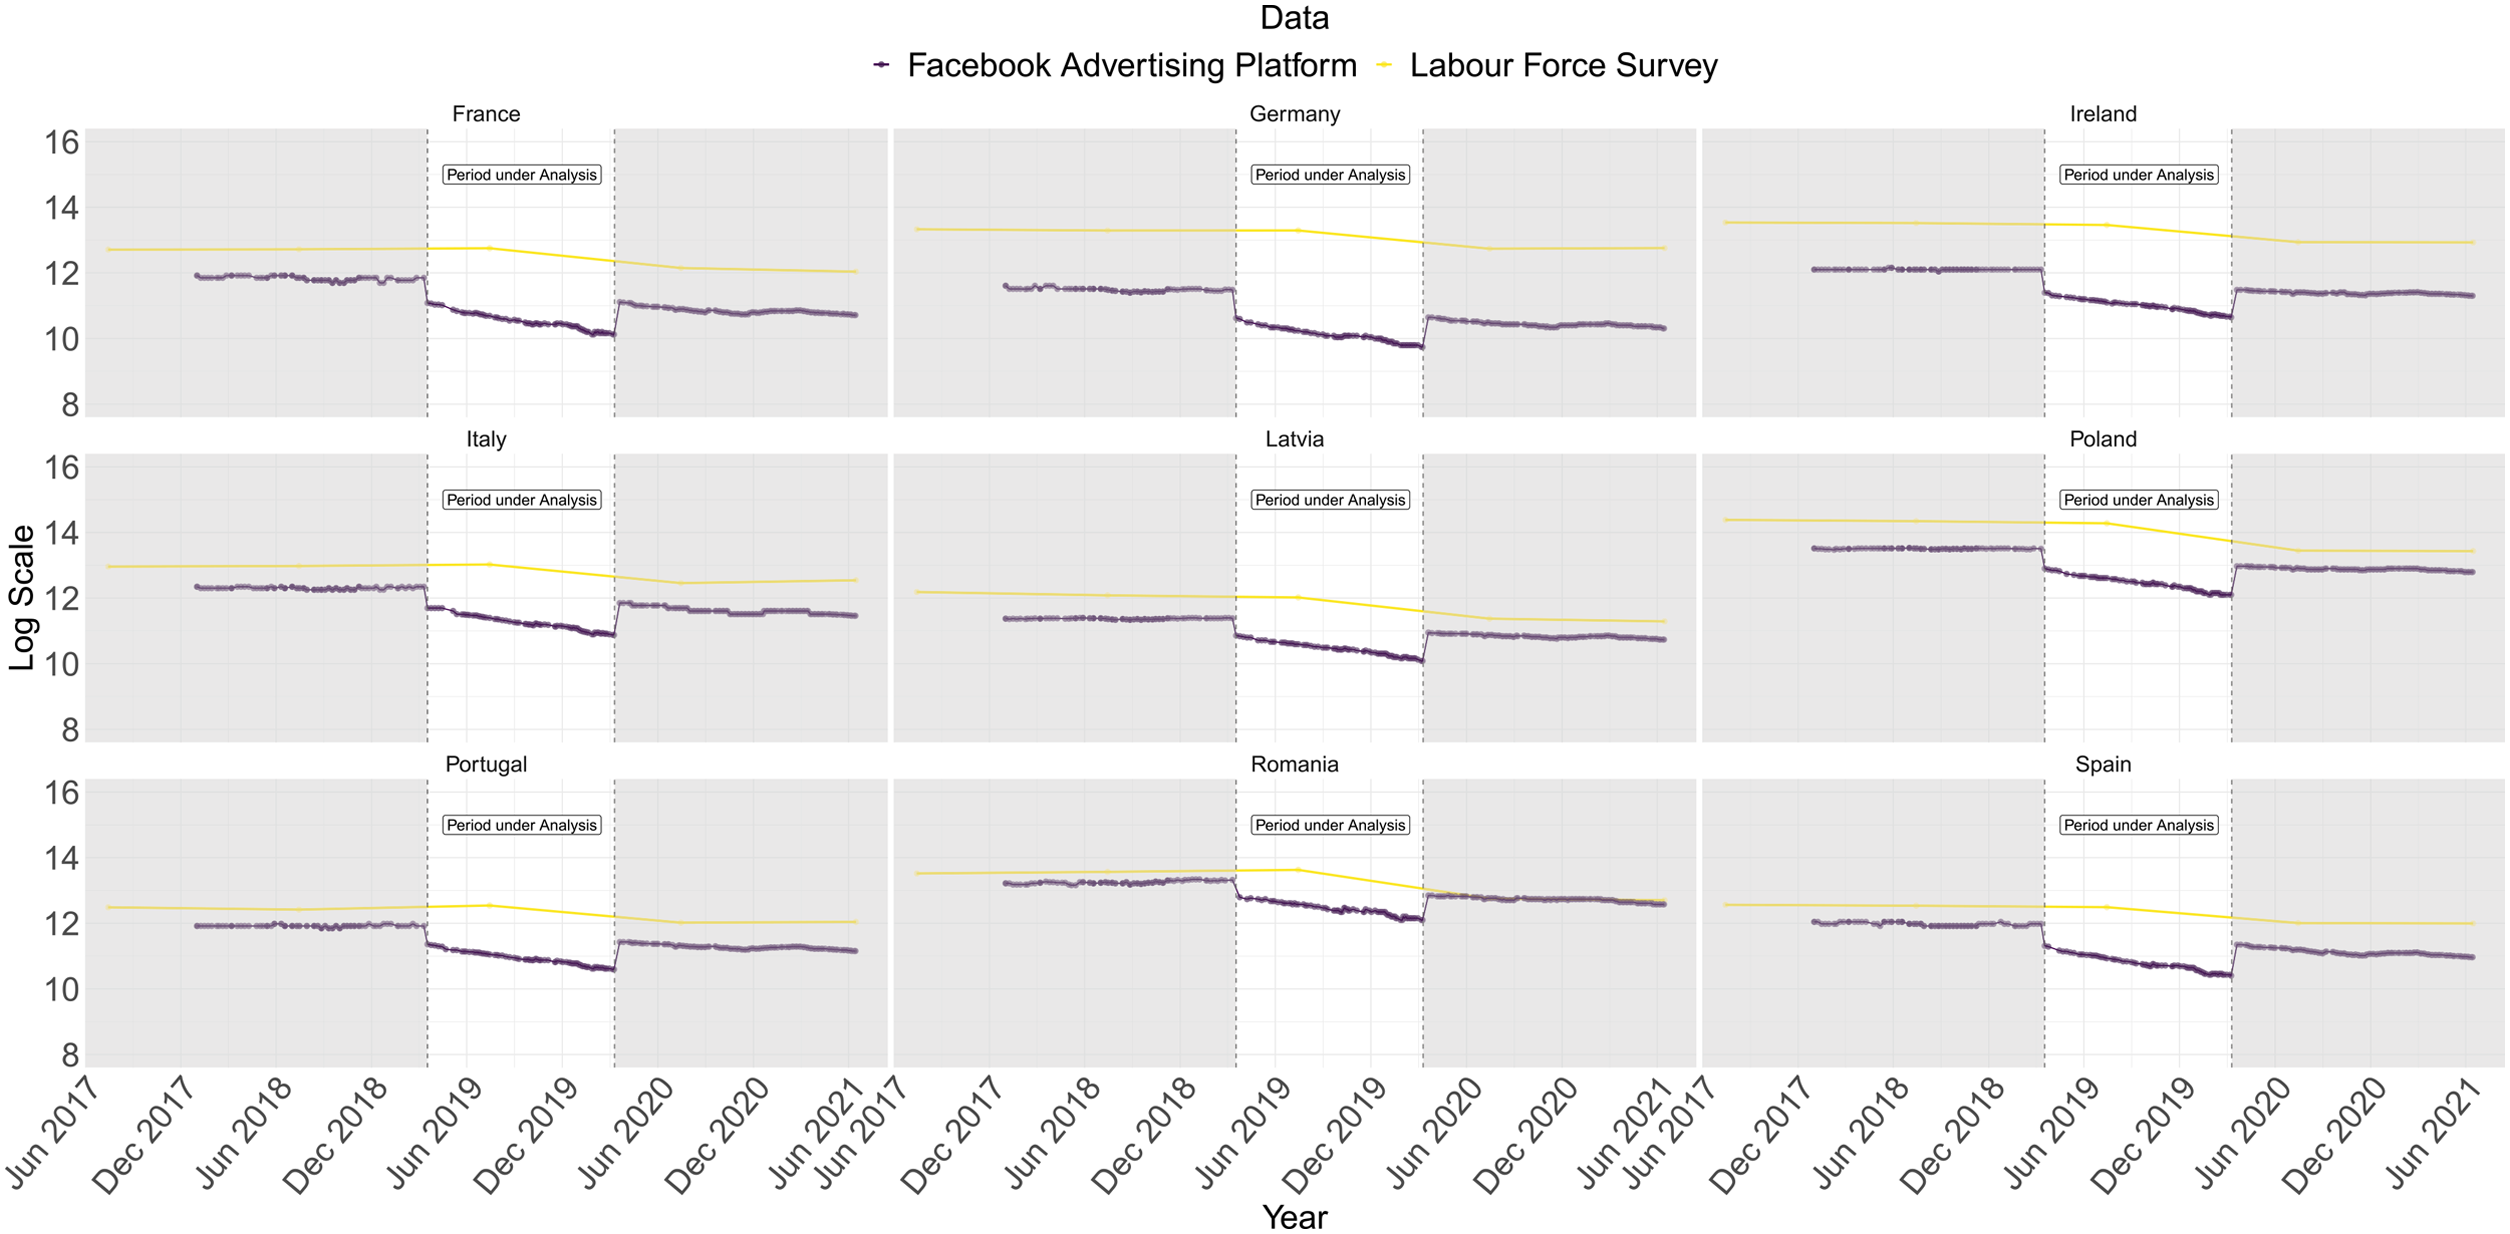
Depicts Weekly Data from the Facebook Advertising Platform (in Purple) Covering January 2018 to June 2021, Alongside Yearly Data from the Labour Force Survey (in Yellow). The Figure Consists of Nine Panels Comparing the Two Data Sources for Each Country, with Counts from Both Sources Being Log-Transformed. The Facebook Advertising Platform Includes Users Aged 15 and Above, While the Labour Force Survey Provides Estimates Across All Age Groups Generalised by the Sample of Respondents. The White Area Signifies the Specific Time Period under Analysis, While the Two Grey Areas Are Excluded from the Study. For Greater Clarity, These Areas Have Now Been Labelled.
It is evident that there were two break points, occurring in March 2019 and March 2020 respectively, where the estimates provided by the Facebook Advertising Platform were affected by algorithm changes. As the first algorithm change took place in March 2019, coinciding with the supposed Brexit timeline, and the second change occurred in mid-March during the COVID-19 pandemic, this article focuses solely on the data between these two time periods to study the change in trend (i.e., between the two grey areas).
Based on Figure 2, it appears that despite their limitations, digital traces data may be capable of capturing changes in migration stocks more promptly than data from official statistics, at least in the case of the UK. The time series data has been cleaned by removing recurring errors of 0 and 1000. These numbers were generated by the API as a mistake caused by too many inquiries, as an internal server error, and do not represent accurate figures. Furthermore, counts that deviated by more than one standard deviation from the weekly mean were excluded, with the mean calculated based on age, education, and country.
Both data sources exhibit declining trends over time. However, there is a noticeable disparity between the two sources, particularly for Western European countries like France and Germany, where the gap is larger. On the other hand, for Eastern European countries such as Poland and Romania, there is relatively little difference observed in terms of both volume and trend between the two data sources.
It is important to note that the LFS data is not available in a disaggregated format by age, gender, education, and country of birth. However, this visual comparison is important to show how the Facebook data closely anticipated the trend then captured by the LFS.
Methodology
To examine the changes in the number of EU migrants in the UK, a simple Bayesian trend model with indicator variables for age, education, and country of origin has been used. The trend equation is disaggregated by a, representing age; e, representing education; i, representing country; and t, representing week. The variable

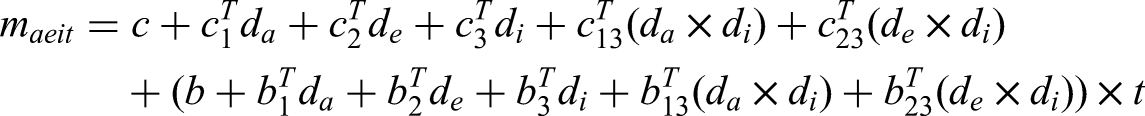

The trend mean function
In addition to the specification mentioned above, the model includes interactions between age and country, denoted by
After analysing the residuals, the following interactions were included in the model: Unspecified Education with country, Tertiary Education with country, and age groups 20–29, 30–39, and 40–49 with Romania and Poland. Additionally, the two models (with and without interactions) were compared using the Deviance Information Criterion, which is a generalization of the Akaike Information Criterion (AIC) commonly used for comparing hierarchical Bayesian models (Gelman et al. 2013). In the model without interactions, the mean deviance is 217,041 (penalized deviance 217,072, penalty 30.97), while in the model with interactions, the mean deviance is 205,705 (penalized deviance 205,756, penalty 51.19). Therefore, the interactions contribute, albeit slightly reducing the mean deviance (from 217,041 to 205,705), leading us to choose the model with interactions.
We assessed the robustness of our Bayesian model by also implementing it in a frequentist approach using a least squares linear regression (using the lm function in R). The results numerically align with those of the Bayesian model, which is not surprising, given the sample sizes involved. The model without interactions yields an R squared of 0.7, while the model with interactions—the one we use in the article—achieves an R squared of 0.9. As for our choice of the statistical paradigm, we preferred the Bayesian approach for its ability to coherently handle different sources of uncertainty, and its potential of seamless integration into broader Bayesian hierarchical models for estimating migration flows, such as the IMEM, which was also applied to Facebook data (Raymer et al. 2013; Rampazzo et al. 2021). Moreover, we selected a normal distribution because it asymptotically approximates both Poisson and negative binomial distributions, while allowing for greater flexibility. In this context, our interest lies in using a default two-parameter model, which already covers possible over-dispersion. We believe the approximation is sufficient, given the abundance of data points used to fit the model. To test that, we have also run Poisson (using the glm function) and Negative Binomial (using the MASS library) regression versions of the model. They yielded similar results to the normal distribution, providing another reason why a normal approximation is adequate while being more generalisable, for example to modelling rates and other non-count measures.
Analysis
Descriptive
Figure 3 and 4 present the raw estimates from the Facebook Advertising Platform data in the period under analysis. In Figure 3, the Facebook weekly time series data is disaggregated by age group and country. An exponential decline is evident, especially in the age groups 20–29 and 30–39, but less pronounced among the older age groups. In Figure 4, the weekly estimates are presented disaggregated by education level and country. The trends are negative across all the educational levels. Given the large estimated numbers in the unspecified education level, it is evident that Facebook does not provide educational information for a large group of users’ profiles.
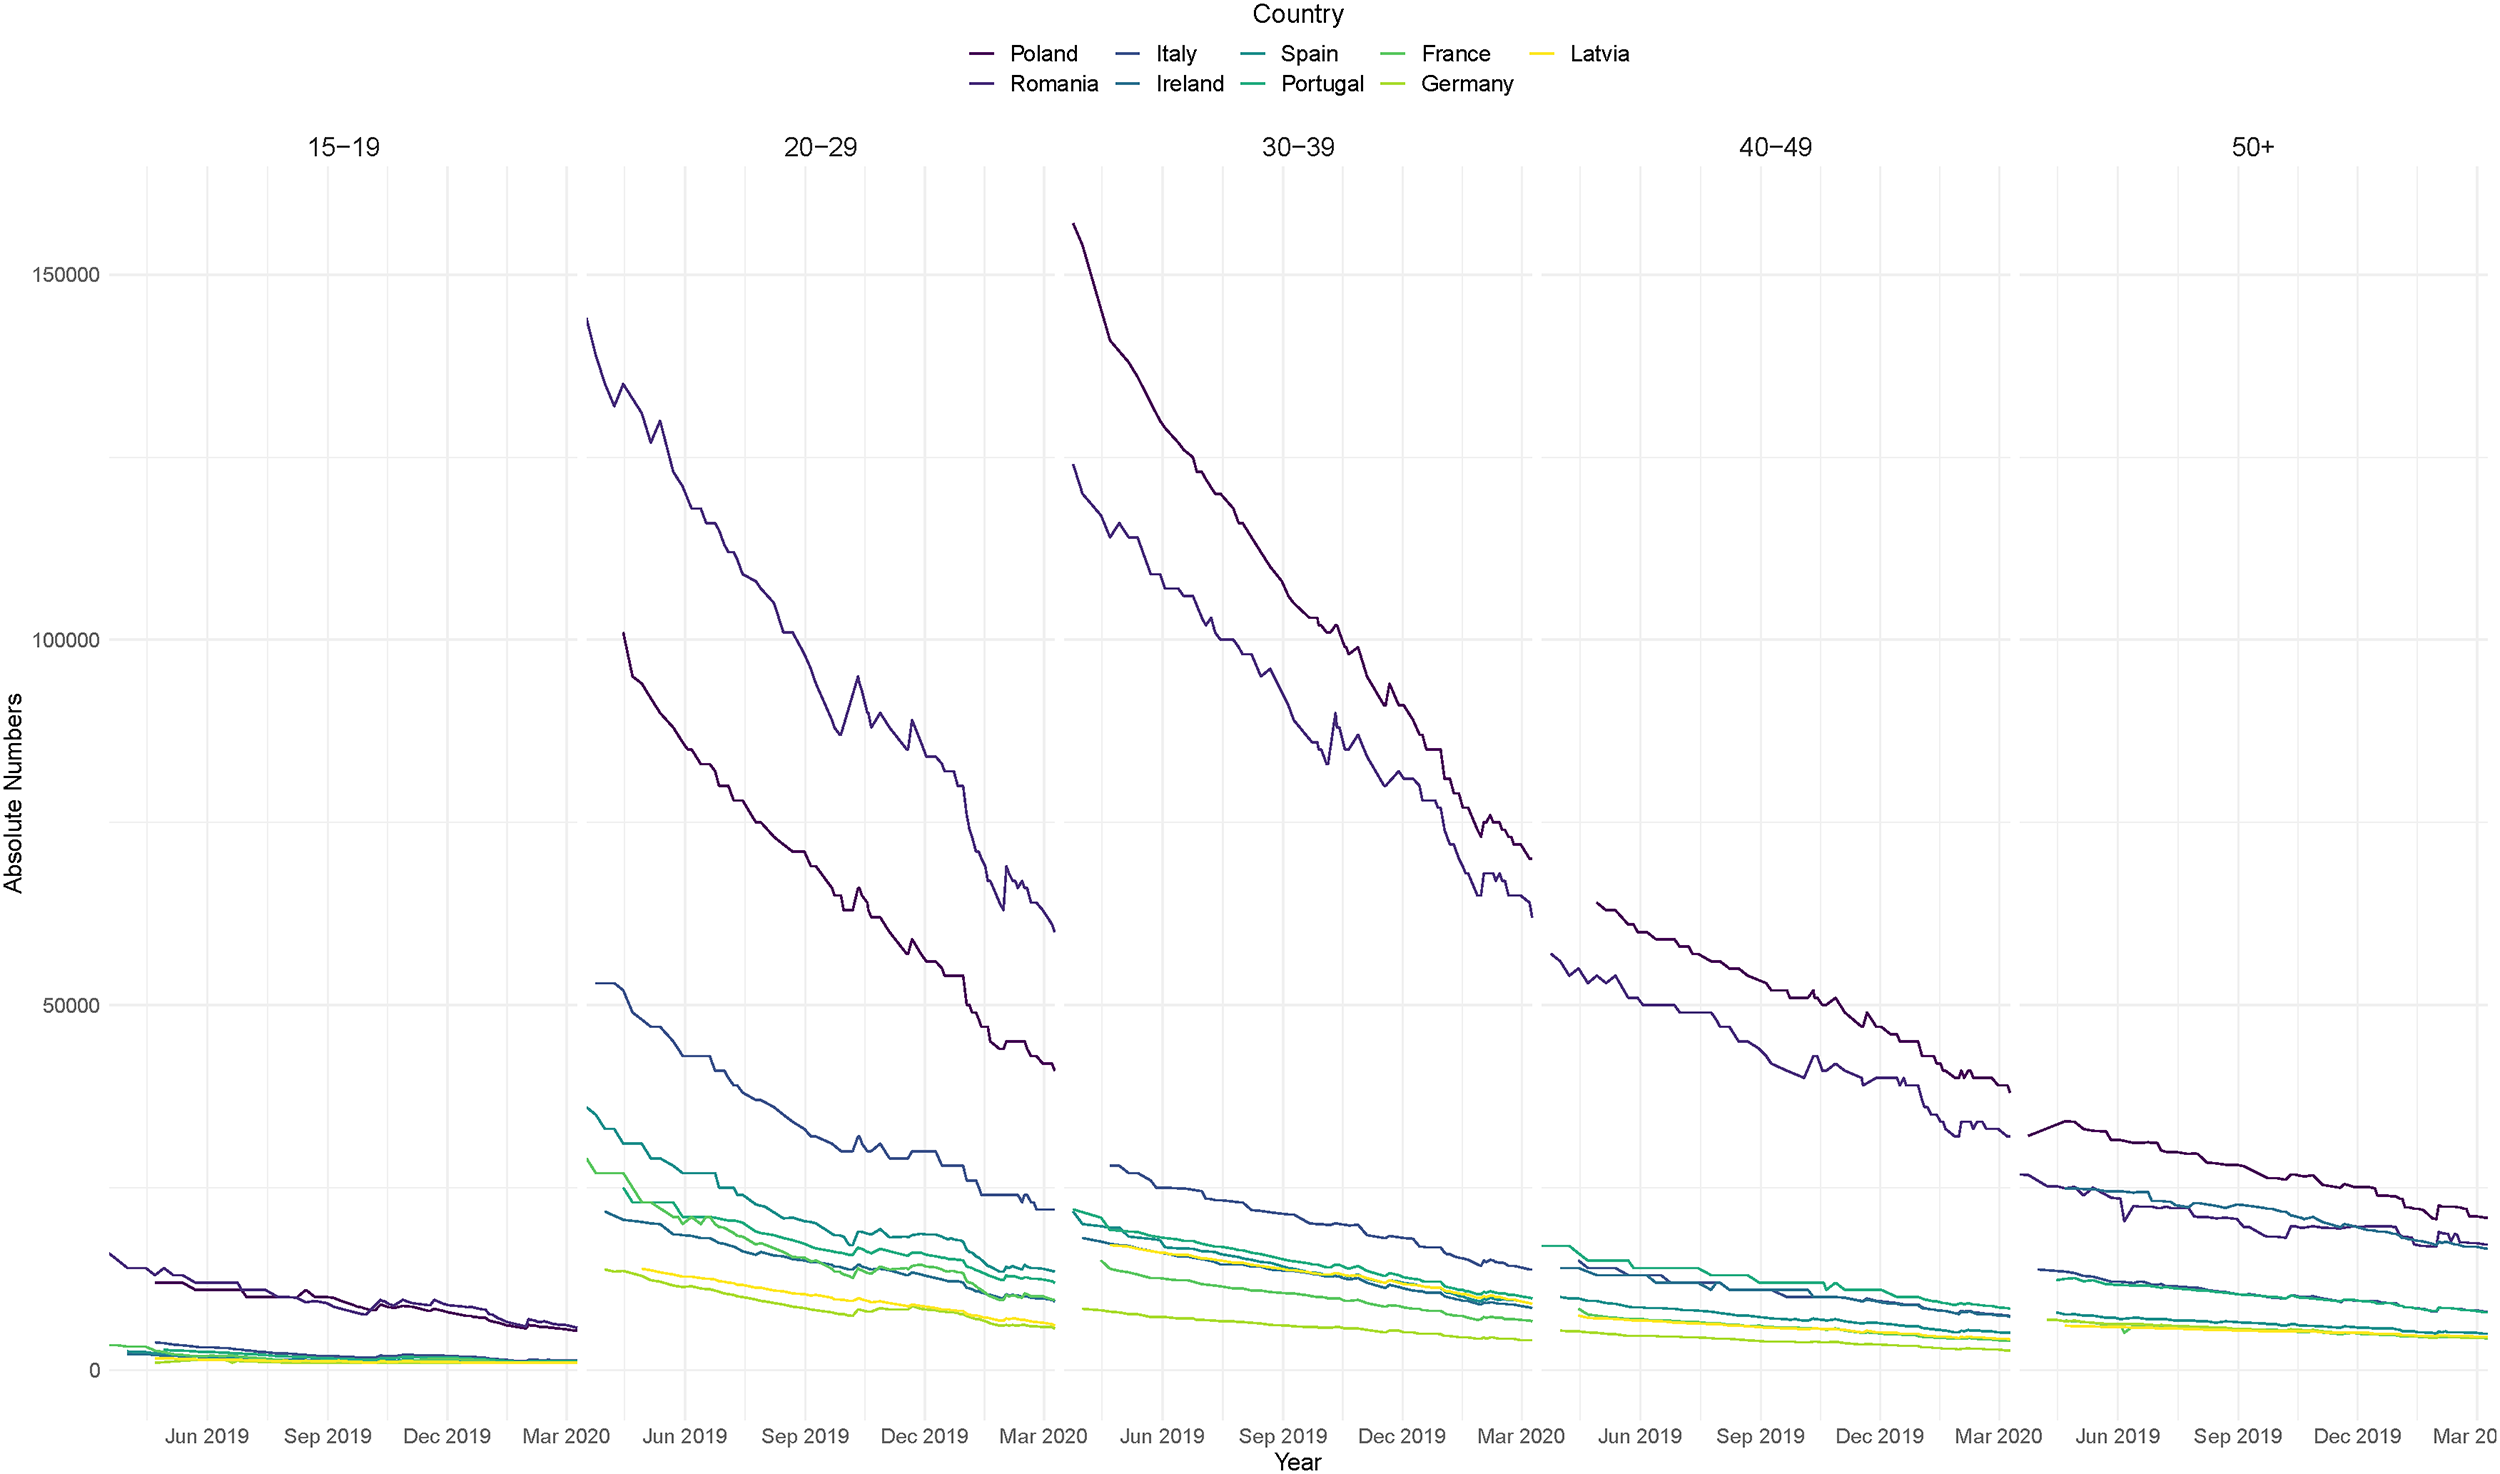
Country Time Series with Weekly Data from the Facebook Advertising Platform from January 2018 to July 2020 by Age Groups (15–19, 20–29, 30–39, 40–49, and 50+ Years Old) and Countries (France, Germany, Ireland, Italy, Latvia, Portugal, Poland, Romania, and Spain).
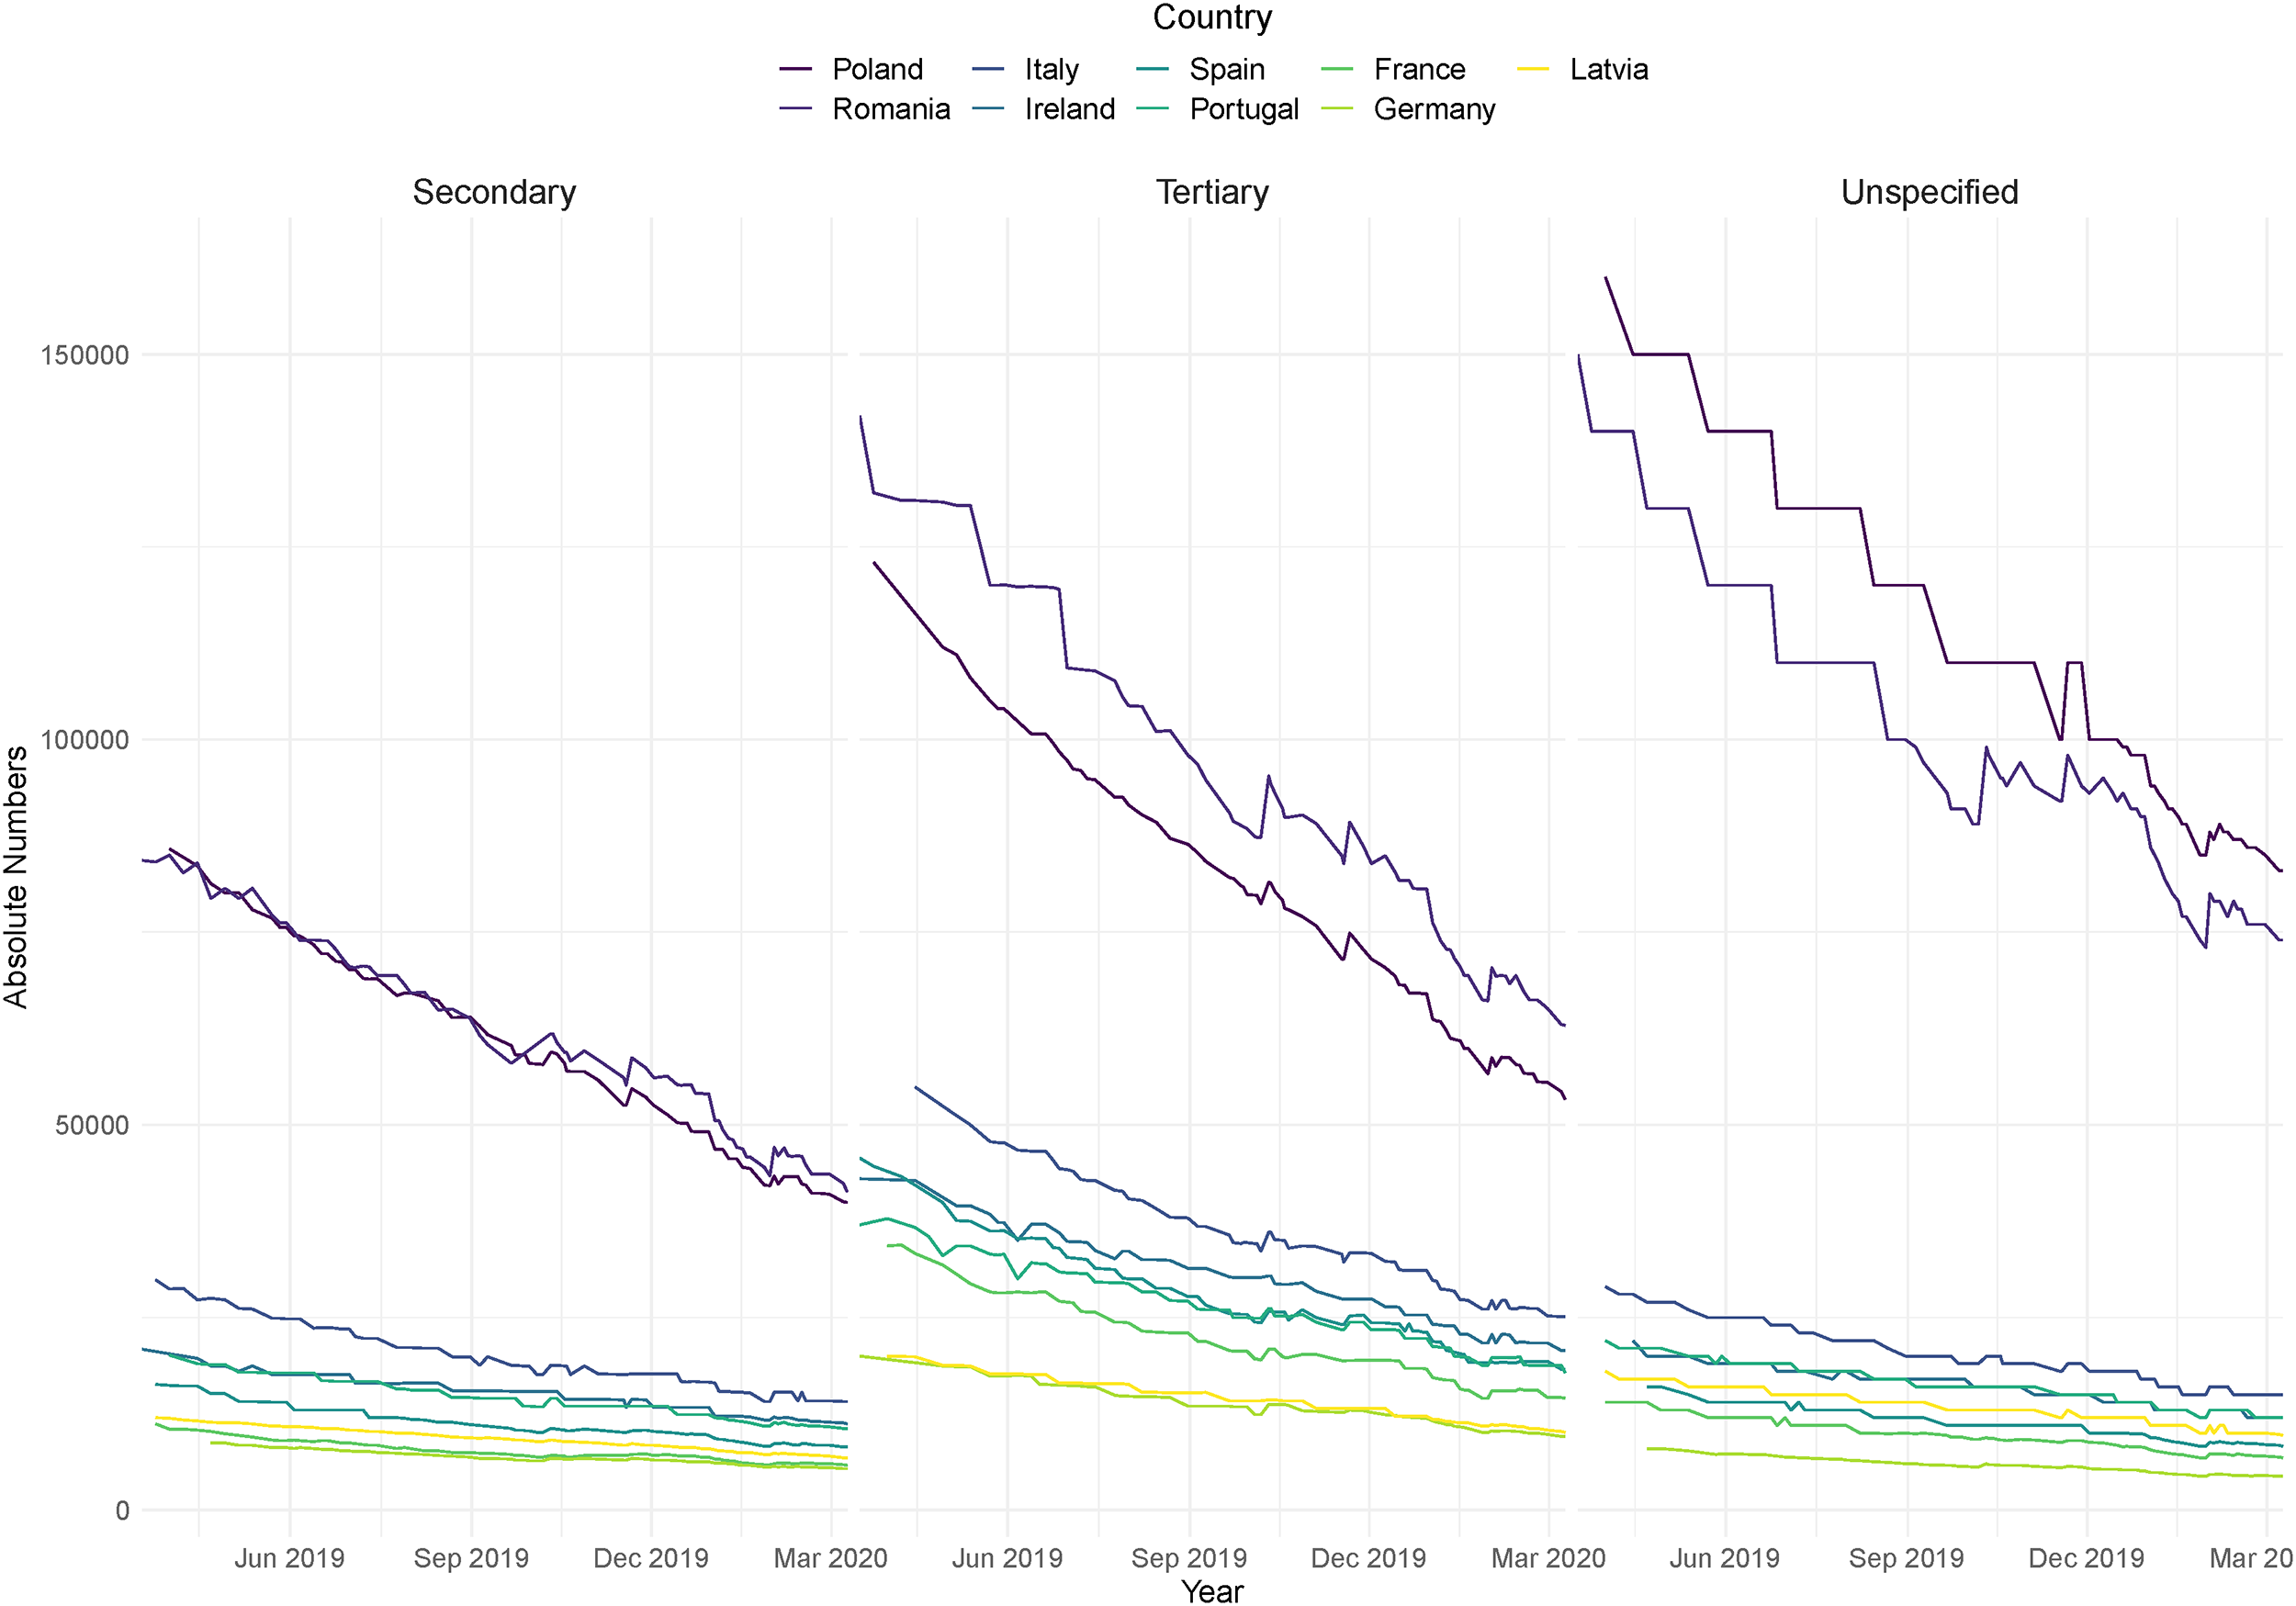
Country Time Series with Weekly Data from the Facebook Advertising Platform from January 2018 to July 2020 by Education Levels (Secondary, Tertiary, and Unspecified) and Countries (France, Germany, Ireland, Italy, Latvia, Portugal, Poland, Romania, and Spain).
Results from the Model
The model was estimated in R using JAGS (Plummer et al. 2016). The model contains 11,880 observations of the number of MAUs by country, age, and education. Numerically, the model is run with three Markov chains, 10,000 interactions, 1,001 burn-in, and 10-fold thinning (i.e., every 10th value of the chains is kept and all other values are discarded to avoid autocorrelation). All the chains and for all the parameters of the model converge. In the Supplementary Materials, Tables 1A and 2A report the values of each of the parameters,
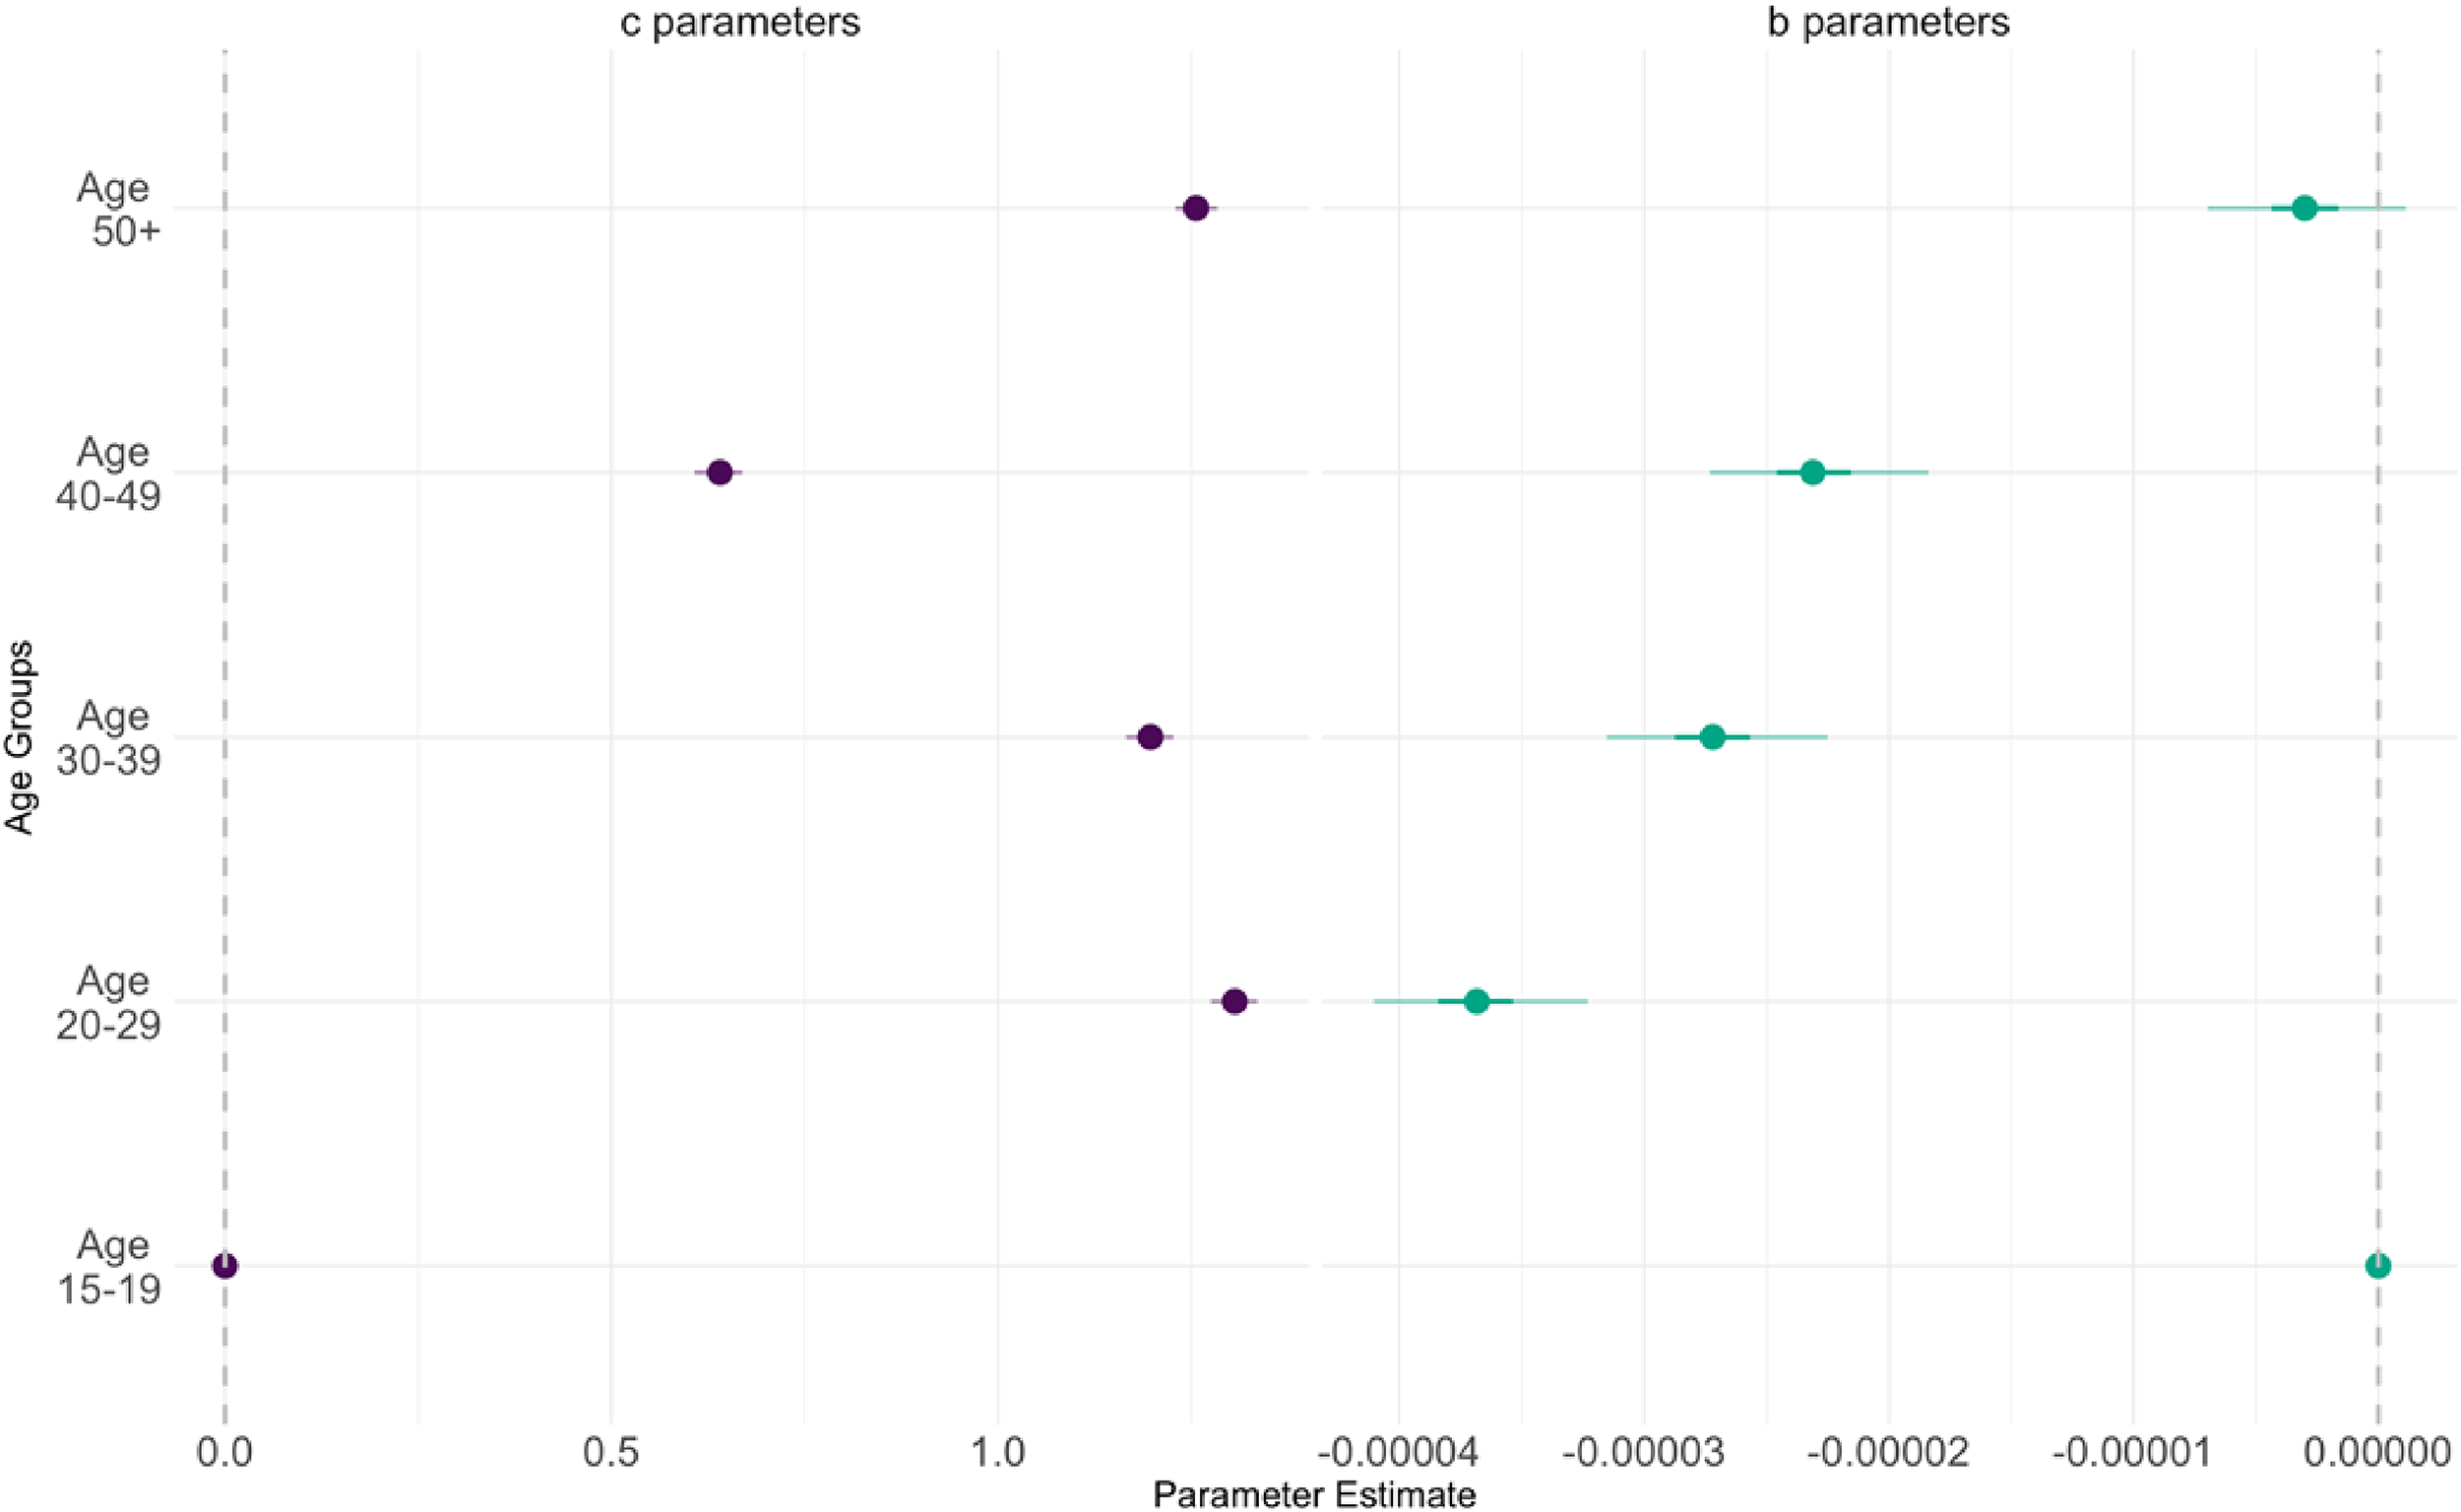
In Figure 5, the respective estimated distributions of the different age groups are shown in comparison to the reference category of 15–19 years old. Looking at the b effect, the size of the age group that is decreasing fastest in comparison to the reference group is the 20–29 age group, followed by the 30–39 age group. The two groups decreasing fastest are also the two groups with a higher initial level in comparison to the 15–19 age group. The 50+ age group has a similar slope to the 15–19 age group, but starting from a higher initial level.
Values of the Intercept (
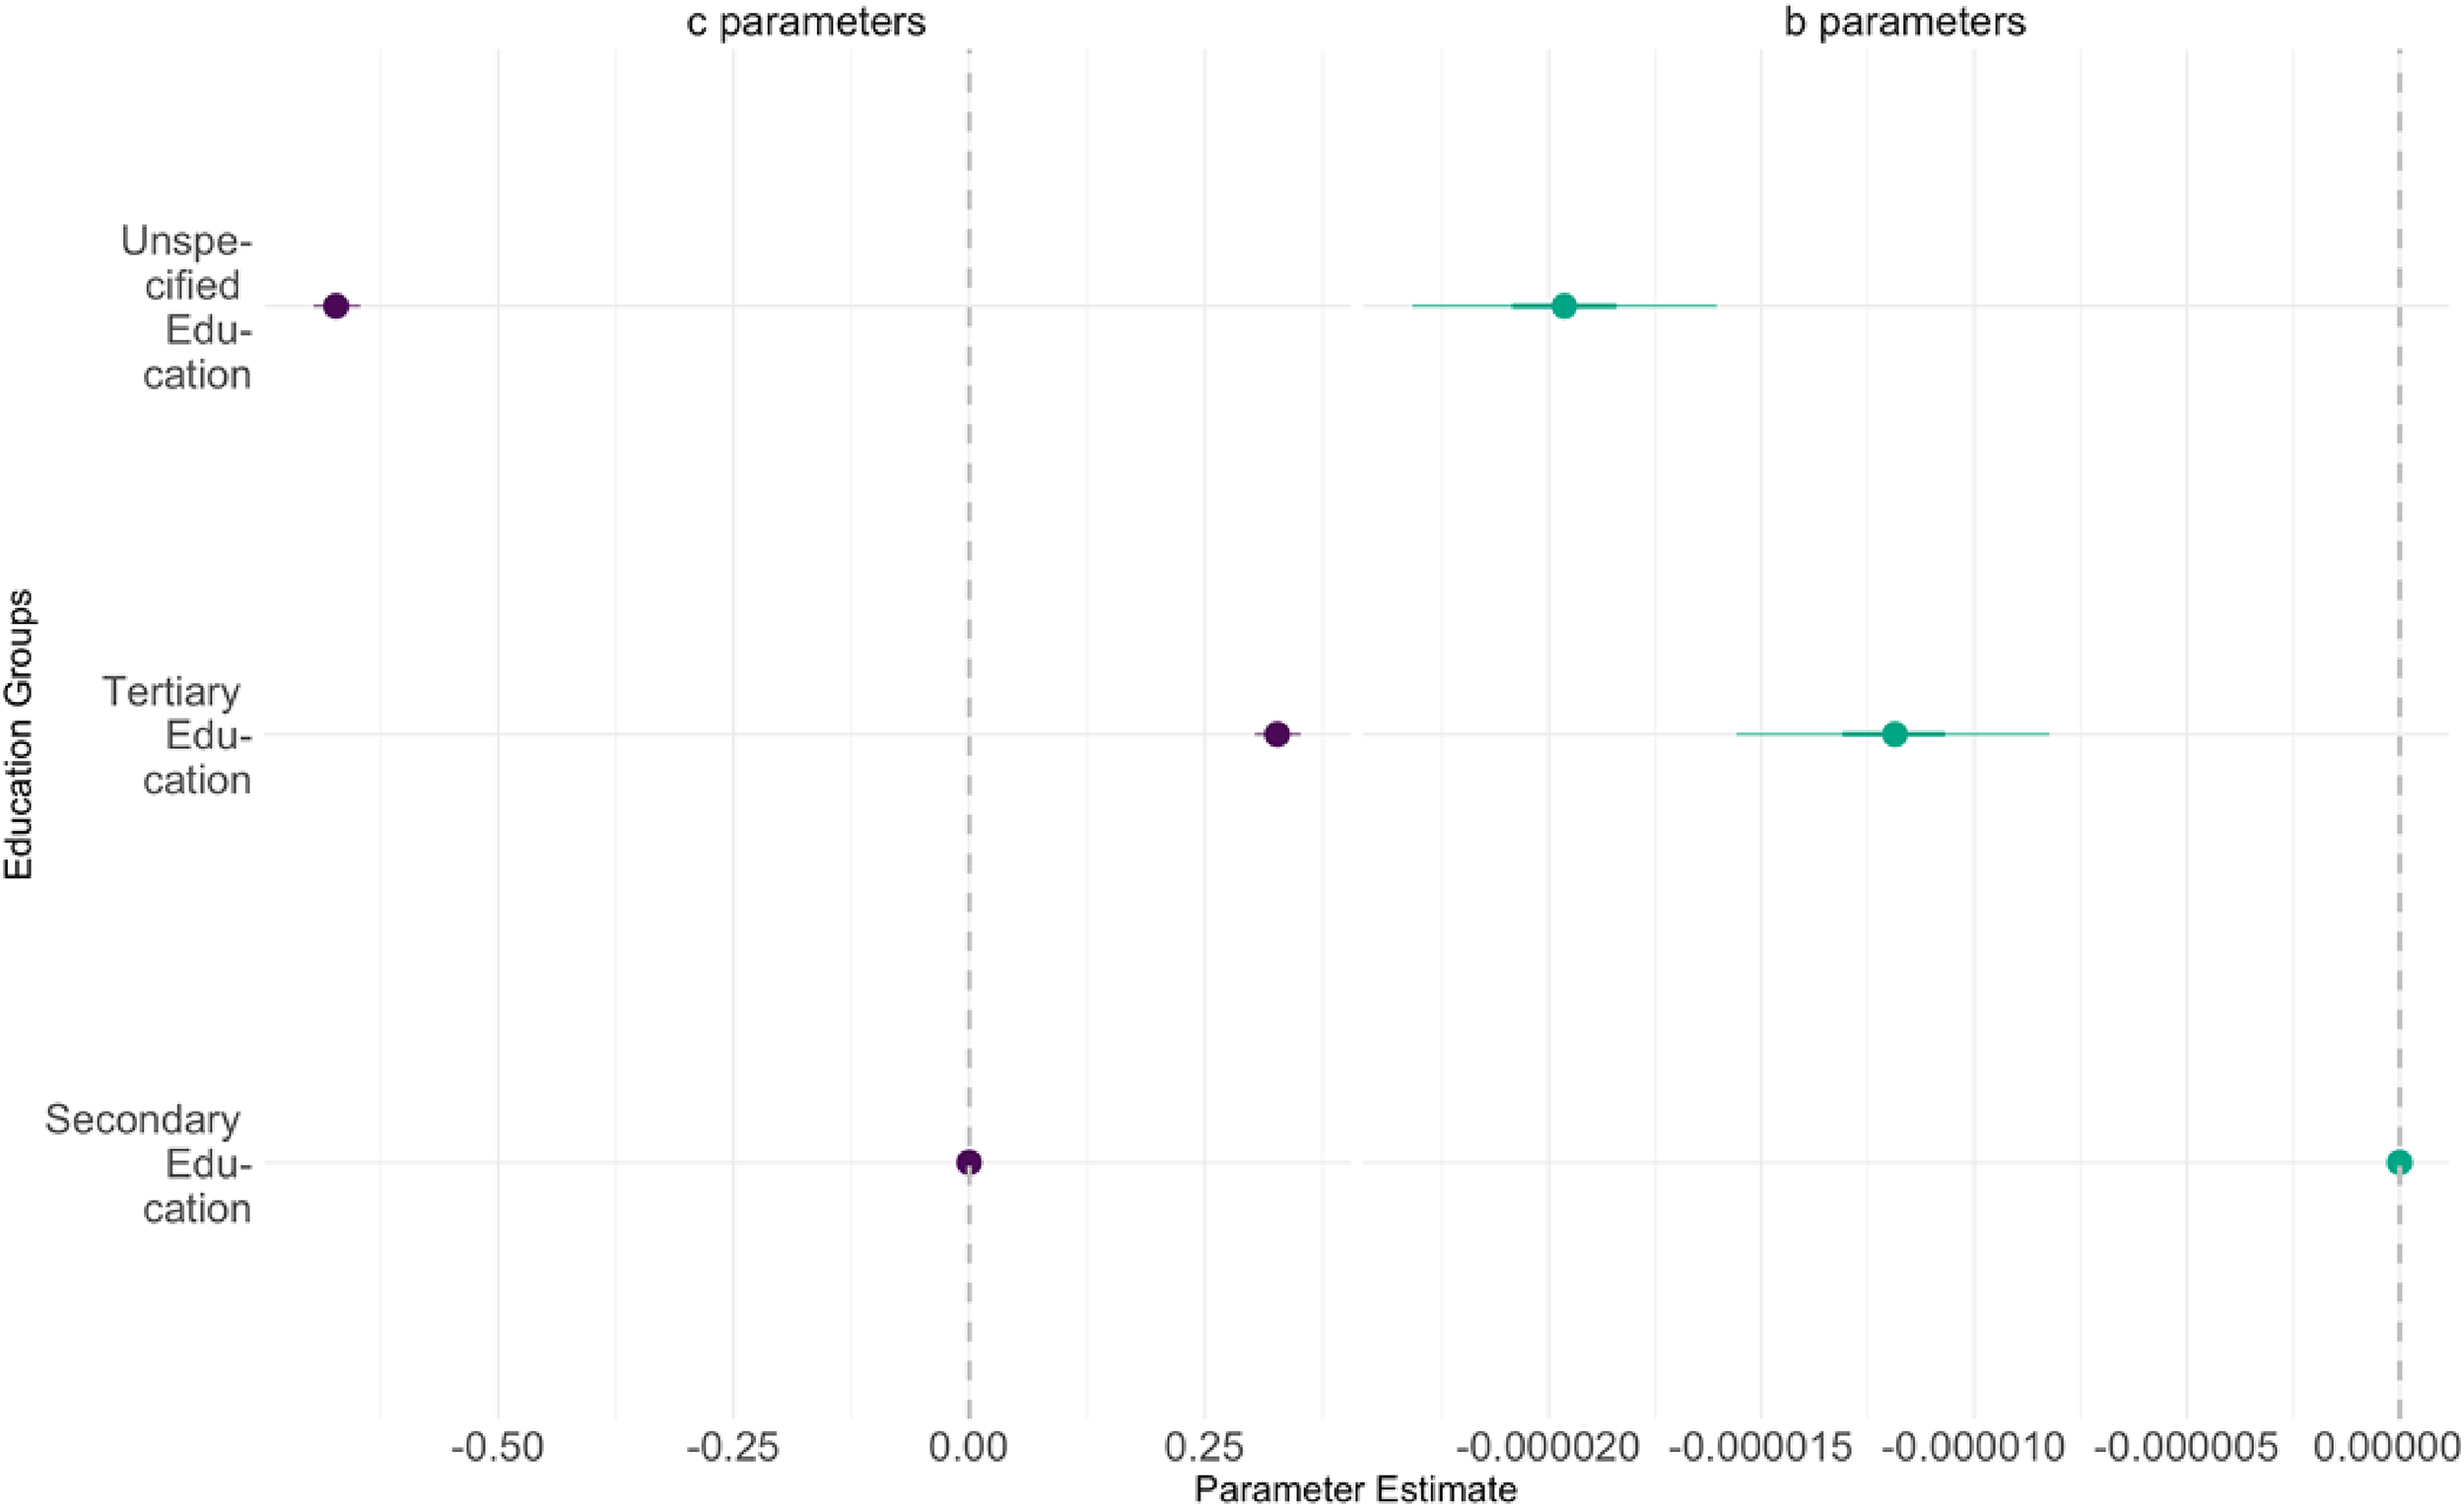
Figure 6 shows an interesting part of the analysis in terms of education. The trend is decreasing fastest for the unspecified category, followed by the tertiary education and then secondary education level. Figure 6 shows that the category with the highest number of migrants is Tertiary Education, followed by Secondary and Unspecified.
Values of the Intercept (
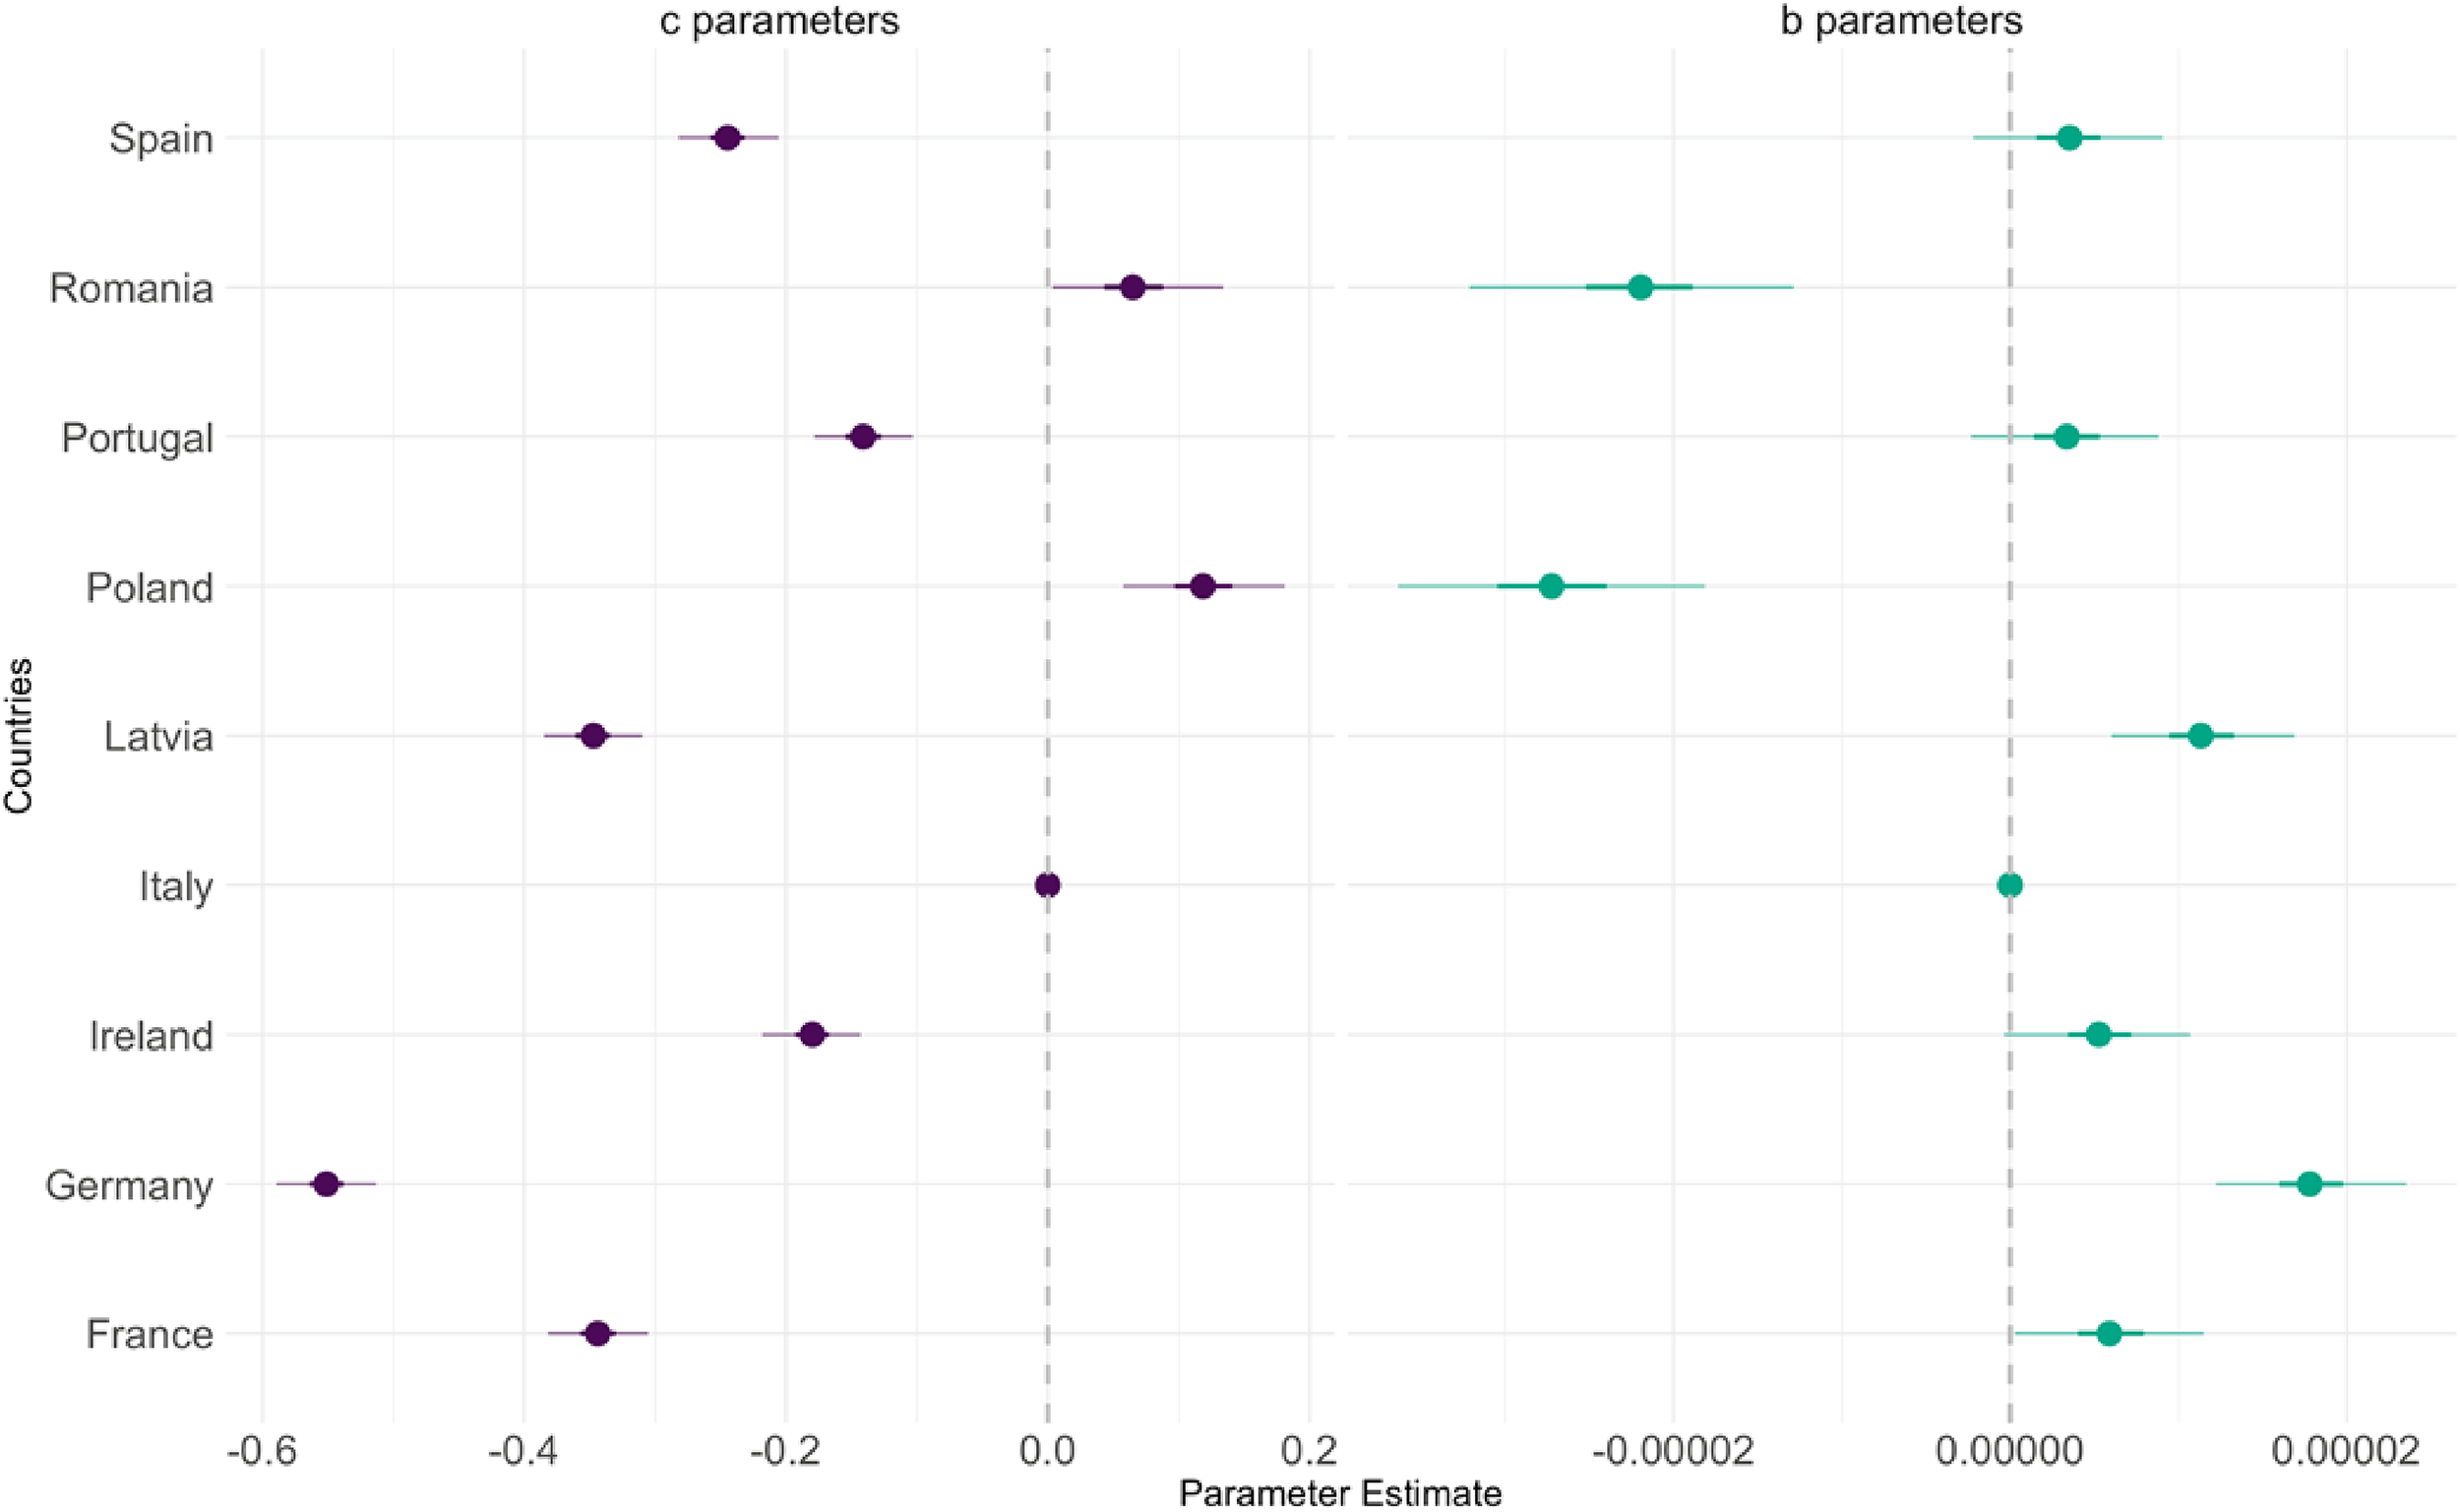
In Figure 7, the effects of various individual countries of origin are shown. The reference category is Italy, the third largest country of origin after Poland and Romania which have a faster decrease in comparison. The other European countries have positive outputs, which means that are not decreasing as fast as Italy. As introduced in the Methodology section, interactions for Poland and Romania are included in the model, the outputs of which are shown in Figure 8. The interaction parameters have positive outputs, meaning that for Poland and Romania the decline is not as fast as for the reference category and the overall effect of education, age, and country.
Values of the Intercept (
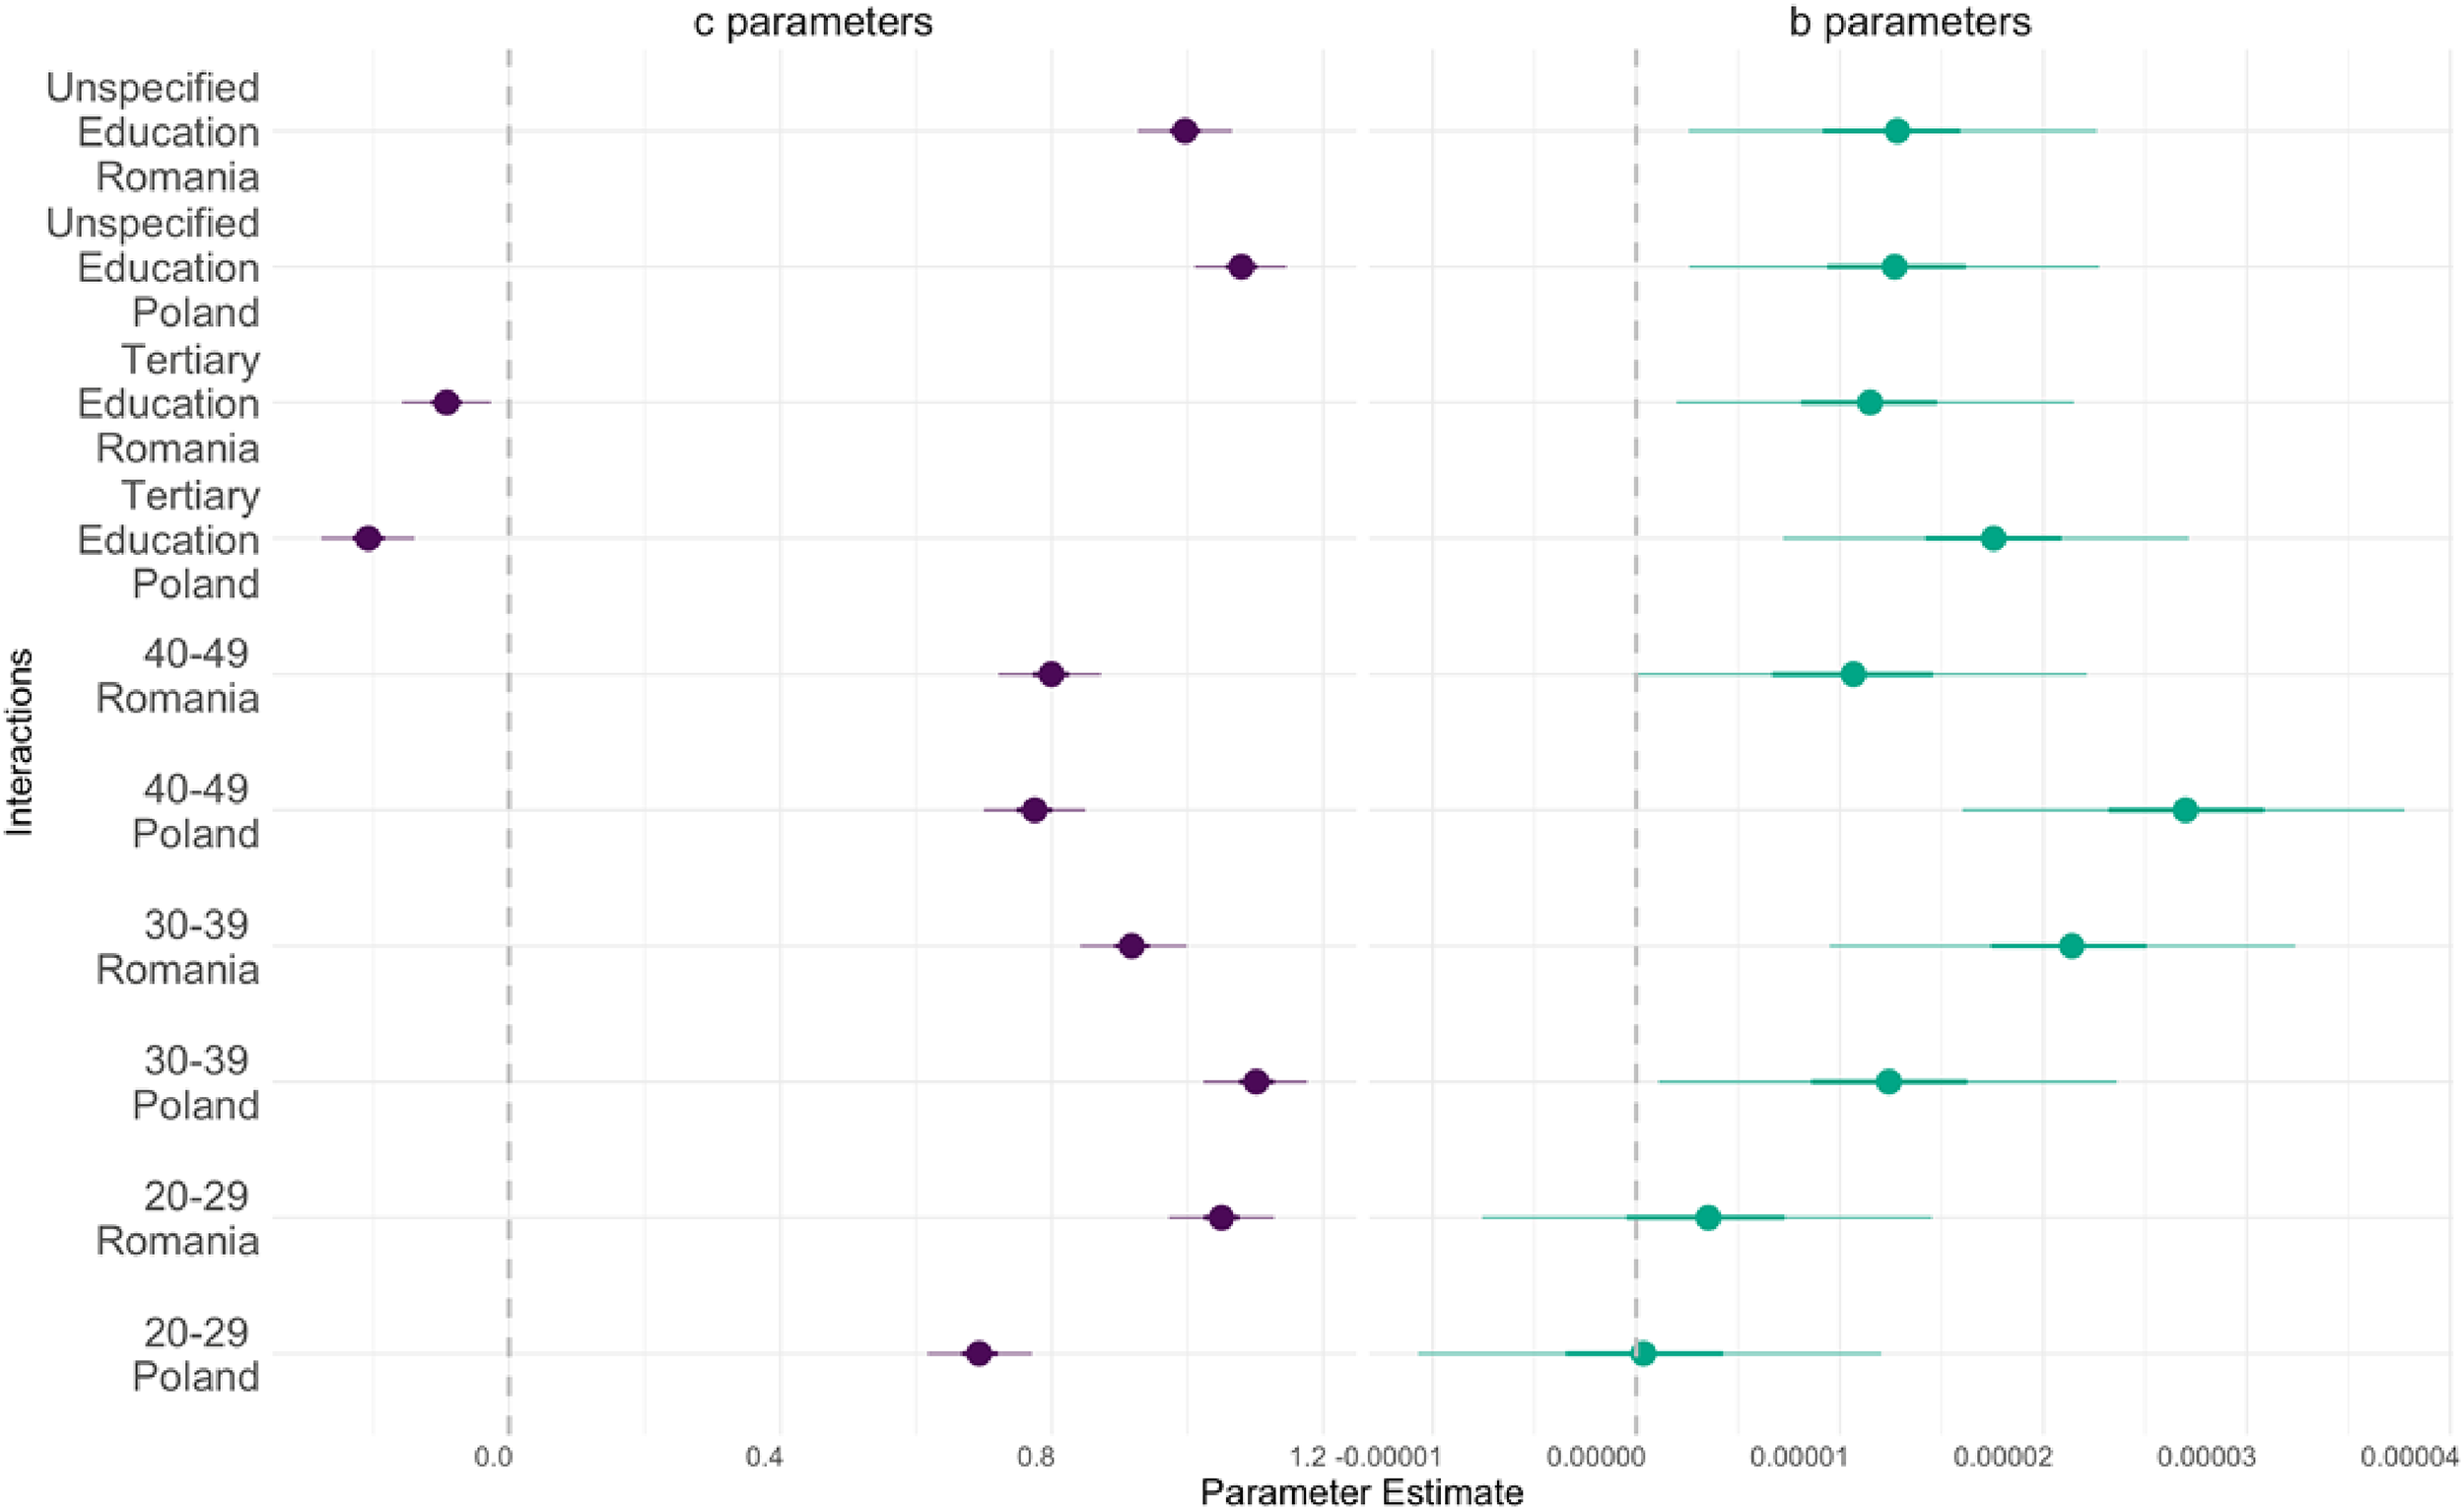
Values the Intercept (
Conclusions
The results support most of our hypotheses. Firstly, we hypothesised a decrease in the number of European migrants in the UK. The analysis of Facebook data has revealed that the stocks of EU migrants in the UK experienced a decline from March 2019 to March 2020 when compared to the selected reference categories. Second, we expected young migrants to exhibit a larger decrease. Indeed, the age groups showing the most significant decline were individuals aged 20–29 and 30–39, which also had the highest initial numbers of migrants. Furthermore, the study found that migrant stocks were decreasing across all education levels. Here, contrary to our expectations, migration decreased especially among the tertiary-educated, despite initially, we expected the secondary educated to be mostly impacted, as the new entry criteria favoured higher-educated migrants. However, we acknowledge that assessing the accuracy of the education variable provided by the Facebook Advertising Platform is challenging. Our results hence cast doubt on the efficacy of Brexit to attract highly-skilled and tertiary-educated migrants as the UK proved to be increasingly unattractive to these groups of migrants, at least during the period analysed. In terms of countries of origin, the numbers of migrants from the largest Eastern European countries, Poland and Romania, are declining at a faster rate compared to those from Italy and other European countries included in the analysis. Our hypothesis posited that the largest and most recent groups of migrants, notably those from Eastern Europe, would experience a greater impact, a notion that appears credible. The interaction effects observed for Poland and Romania offer some minor mitigation in the decline experienced by both the 30–39 and 40–49 age groups, as well as by individuals with tertiary education.
So, does Brexit mean Brexodus? The key finding of the study is that, among the nine European countries included in the analysis, the stock of migrants residing in the UK exhibited a decline between March 2019 and March 2020. The decline began after the Brexit date in March 2019 and the downward trend seems to persist beyond March 2020 as shown in Figure 2. As Portes and Forte (2017) theorised, and now analyses of the LFS data and National Insurance Numbers (Portes 2022; Di Iasio and Wahba 2023) confirmed, the UK is becoming less attractive to EU migrants, and this could be attributed to the ongoing uncertainty surrounding Brexit. The analysis of quarterly LFS data indicates a decline in migration to the UK following the Brexit referendum, even before any policy changes were implemented (Di Iasio and Wahba 2023). While the LFS data shows a decline in estimates, it is not as pronounced as the decrease observed in the digital trace data (in the period under analysis). Indeed, this is highlighted in Figure 1 as well, which portrays Net Migration from 1964 to 2022. This difference could be attributed to the inherently timely nature of digital trace data.
This contribution is exploratory in nature. The significance of this research lies in highlighting the trend of change rather than providing precise percentage changes or estimates over time. Crucially, the analysis demonstrates that digital trace data can be used to monitor changes in the population of migrants in a country over time. This aspect holds particular importance given the modifications made to the UK migration data collection systems during and after the COVID-19 pandemic. Moreover, this analysis could be complemented by incorporating other digital trace data sources to examine changes in migration intentions. For instance, Google Trends data could be used to analyse keyword searches related to migration (Böhme, Gröger, and Stöhr 2020; Adema, Guha, and Adema 2022). By combining multiple digital trace datasets, a more comprehensive understanding of the evolving migration landscape and individuals’ intentions to migrate could be gained.
Based on the presented trends, it appears that leading up to Brexit, the UK experienced a significant decrease in young and highly educated migrants from other European countries. Furthermore, the decline in the tertiary educated is occurring at a faster rate compared to the secondary educated. It is worth considering that while Facebook may not be the optimal social media platform for investigating migrants’ educational levels, platforms like LinkedIn could serve as more suitable data sources for studying migrants’ skills and further examining the role of digital trace data in assessing the impact of Brexit on the number of migrants in the UK. Nonetheless, it remains intriguing to continue monitoring changes in migrants across different educational categories over time, especially as the UK implemented a new point-based migration system on 1st January 2021.
While the COVID-19 pandemic has been proven to have had an impact on migration patterns (González-Leonardo et al. 2023), and it may require some time to fully comprehend the impact of the UK's migration policy change, early indications of diminished attraction to the UK for EU migrants are already evident. To further improve this analysis, it would be beneficial to examine a longer time series of data once the data from the two Facebook algorithm changes is rectified, assuming we gain a better understanding of the nature of these changes. This study demonstrated the utility of digital trace data in monitoring weekly fluctuations in the international migrant population within a country.
This article offers cautionary tales and lessons learned. Unfortunately, we were unable to use a full difference-in-difference approach because, at the onset of data collection, not all European countries were available in the Facebook migrant variable. Additionally, we did not anticipate two algorithm changes during the analysis period, compounded by the COVID-19 pandemic causing travel restrictions. When embarking on projects involving new digital traces data, it may therefore seem advisable to consider collecting as much data as possible. However, this approach would conflict with ethical practices and legislation which prioritise gathering only necessary data for research purposes.
Our analysis shows that digital trace data provides timely information and is able to provide information unavailable from official statistics sources – in our case the educational and age profile of migrants by country of origin. Yet, our analysis also shows that digital trace data is also prone to instability and can be unreliable for comparisons over time – in our case, two changes in algorithm prevent comparing data for a longer period of time. Therefore, our contribution also serves as an example where it is not possible to entirely replace traditional data sources with digital trace data. However, we can still derive valuable insights from digital trace data, such as the trend in the number of migrants in the UK in this case.
Supplemental Material
sj-docx-1-mrx-10.1177_01979183241247009 - Supplemental material for Assessing Timely Migration Trends Through Digital Traces: A Case Study of the UK Before Brexit
Supplemental material, sj-docx-1-mrx-10.1177_01979183241247009 for Assessing Timely Migration Trends Through Digital Traces: A Case Study of the UK Before Brexit by Francesco Rampazzo, Jakub Bijak, Agnese Vitali, Ingmar Weber and Emilio Zagheni in International Migration Review
Footnotes
Declaration of Conflicting Interests
The authors declared no potential conflicts of interest with respect to the research, authorship, and/or publication of this article.
Funding
Francesco Rampazzo conducted most of his research for this article while a Ph.D. student at the Department of Social Statistics and Demography at the University of Southampton with a scholarship from the Economic and Social Research Council (South Coast Doctoral Training Partnership, Project ES/P000673/1). He is now funded by a Leverhulme Trust Grant for the Leverhulme Centre for Demographic Science under Grant RC-2018-003, and by the Department of Sociology of the University of Oxford. We also thank the Economic and Social Research Council for funding Connecting Generations (grant ES/W002116/1).
Supplemental Material
Supplemental material for this article is available online.
Notes
References
Supplementary Material
Please find the following supplemental material available below.
For Open Access articles published under a Creative Commons License, all supplemental material carries the same license as the article it is associated with.
For non-Open Access articles published, all supplemental material carries a non-exclusive license, and permission requests for re-use of supplemental material or any part of supplemental material shall be sent directly to the copyright owner as specified in the copyright notice associated with the article.