
Abstract
Although up-to-date information on the nature and extent of migration within the European Union (EU) is important for policymaking, timely and reliable statistics on the number of EU citizens residing in or moving across other member states are difficult to obtain. In this paper, we develop a statistical model that integrates data on EU migrant stocks using traditional sources such as census, population registers and Labour Force Survey, with novel data sources, primarily from the Facebook Advertising Platform. Findings suggest that combining different data sources provides near real-time estimates that can serve as early warnings about shifts in EU mobility patterns. Estimated migrant stocks match relatively well to the observed data, despite some overestimation of smaller migrant populations and underestimation for larger migrant populations in Germany and the United Kingdom. In addition, the model estimates missing stocks for migrant corridors and years where no data are available, offering timely now-casted estimates.
Introduction
The freedom of movement within the European Union (EU) forms a central component of the European common market and has contributed greatly to increasing the number of European migrants both leaving and arriving in other EU member states. Intra-EU migration has had several wide-reaching impacts on the economy, society, and demographic compositions in member states (Dustmann, Glitz and Frattini 2008; Barrell, FitzGerald and Riley 2010; Sobis, Junjan and de Vries 2016). To monitor the migration patterns and trends effectively, countries are legally required to provide data on both the number of migration events (flows) and the size of migrant populations (stocks) each year (Regulation No. 862/2007 of the European Parliament and of the Council). However, European migration statistics have several shortcomings, such as varying levels of accuracy due to the use of a range of data collection mechanisms implemented in EU member states, biases due to underreporting of migrants (e.g., Raymer et al. 2013), and missingness. In this article, we develop a method to combine published migration statistics on migrant stocks with data from other traditional sources including censuses and Labour Force Surveys (LFS), as well as new forms of data, specifically the audience size data on migrant populations taken from the Facebook Advertising Platform. Using a hierarchical Bayesian model, we utilize the strengths of each data source to provide timely (i.e., compensating for a publication lag of official migration statistics) estimates with uncertainty (i.e., with predictive intervals, Bayesian counterparts of confidence intervals) of the size of migrant populations in every EU country.
Migration statistics to monitor the changing patterns and trends in the number of migrants within the EU are published regularly by Eurostat, the statistical office of the EU. These data are supplied to Eurostat from the statistical agencies of each member state. Typically, there is a publication lag of around one year (for stocks) to two years (for flows) of data on the size and composition of migrant populations in each country. The quality of data provided to Eurostat varies. For example, countries that do not have population registers may struggle to provide accurate estimates of the size of migrant populations in comparison to countries with robust registers (Kupiszewska and Nowok 2008; Raymer et al. 2013; Willekens 2019). Further, several countries do not regularly provide estimates on migrant populations, especially with detailed information on country of origin, due to a lack of relevant infrastructure in their statistical systems. Publication lags, varying levels of accuracy in available data and missingness problems combine to provide an incomplete picture on the distribution of European migrants within Europe. In turn, this impacts the creation of effective policies related to migrants. For example, during the recent COVID-19 pandemic, specially released data from Google on aggregated mobility based on users’ location histories were used to study European population mobility (e.g., Askitas, Tatsiramos and Verheyden 2021; Drake et al. 2020; Lai et al. 2021) rather than official statistics from Eurostat that were unavailable during the period of concern.
To provide a better understanding of migration patterns in Europe, several attempts have been made to develop statistical models for harmonizing and imputing missing data. The estimates from these models were to produce a more comprehensive picture on annual European migration flows than the official statistics published by Eurostat (Abel 2010; De Beer et al. 2010; Raymer, De Beer and Van der Erf 2011; 2013; Wiśniowski et al. 2013). There have been fewer attempts to develop comprehensive estimates on annual European migration stocks, the focus of this paper. For example, Bijak and Kupiszewska (2008) created a method to adjust and complete Eurostat origin-destination migrant stock data between 2002 and 2006 but did not seek to provide up to date estimates to compensate for the publication lag.
The emergence of the Internet and data generated that trace the mobility of users from a variety of private companies has allowed for the analysis of more current patterns of migration than previously possible. The range of data sources to monitor migration flows is particularly numerous, including geotagged information from IP addresses of Yahoo Email users (Zagheni and Weber 2012; State, Weber and Zagheni 2013), Google Location History (Ruktanonchai et al. 2018), geo-located data from CouchSurfing (Pultar and Raubal 2009), Flickr (De Choudhury et al. 2010), LinkedIn (State et al. 2014), and Twitter (Hawelka et al. 2014; Lenormand et al. 2014; Zagheni et al. 2014; Fiorio et al. 2017; 2020; Mazzoli et al. 2020). Additionally, several European Commission reports (Hughes et al. 2016; Spyratos et al. 2018; Gendronneau et al. 2019) have assessed the feasibility of incorporating big data sources (including social media) in estimating international migration.
New types of migration data have also been proposed for monitoring of the international migrant stocks, for example, by using data on audience sizes of foreign users in different countries derived from the Facebook Advertising Platform (hereinafter Facebook data) (Zagheni, Weber and Gummadi 2017; Spyratos et al. 2019; Rampazzo et al. 2021; Culora et al. 2021). Specifically, Rampazzo et al. (2021) developed a Bayesian hierarchical model that combined Facebook data with LFS, corrected for measurement errors and imputed missing data, to estimate stocks of migrants in the United Kingdom. Their approach was similar to the one undertaken by Raymer et al. (2013) and Gendronneau et al. (2019). Culora et al. (2021) used Gaussian processes to forecast stocks of migrants reported by Eurostat for European countries and in the American Community Survey (ACS) for the USA states without corrections for inadequacies in the traditional data sources. Further examples of the use of migrant stocks from new data sources have been developed for migration outside of the EU. Alexander, Polimis and Zagheni (2022) used Facebook data in combination with the ACS to develop a model to now-cast foreign-born migrant populations in the USA. Palotti et al. (2020) explored the use of Facebook data to estimate numbers of refugees and migrants from Venezuela at both national and subnational levels. Similarly, Rampazzo and Weber (2020) investigated the availability of Facebook data for monitoring migration within Africa.
The main contribution of this article is a methodological innovation in producing migrant stock estimates that are relevant to policymakers. While migration flows data are relevant to measure the impact of policies related to demographic change, migration patterns and trends, migrant stock data are more suitable for addressing policies related to the migrant populations and their characteristics. In this article, we extend and apply previous modeling efforts to combine both traditional and new migration data sources for the estimation of origin-destination (bilateral) foreign born migrant stocks among 28 EU countries (including the United Kingdom). In particular, we extend the works by Gendronneau et al. (2019) and propose a Bayesian hierarchical model as a general framework to estimate, with measures of uncertainty, timely, complete and harmonized foreign-born European populations in each country. We test the sensitivity of our estimates to the assumptions made in Gendronneau et al. (2019). We utilize a range of available data sources, including national censuses, population registers, LFS, and Facebook. The use of a Bayesian hierarchical model allows for the borrowing of information from each of the data sources across time and among countries. We also specify a range of biases and accuracies for each data source and at each time point by using informative prior distributions. These prior distributions enable the model to compensate for the various strengths and weaknesses of each data source and hence their influence on the final estimates. For instance, we assume that census data are typically the most accurate and with the smallest bias, Facebook-derived stock data are heavily biased, whereas LFS are subject to largest inaccuracy due to sampling errors. Our model adapts previous Bayesian hierarchical models developed for integrating migration flow data to migrant stock data for the first time. Incorporating data from a range of sources allows us to generate estimates with uncertainty for both current and future levels of migrant stocks in each EU country. The estimates from our model provide a complete picture of level and changes in adult annual origin-destination foreign-born migrant populations within the EU not previously available.
In the next section, we provide a detailed overview of the potential data sources for estimating foreign-born European migrant stocks in the EU. These assessments are used as the basis for the development of informative prior distributions for the measurement layer of our Bayesian hierarchical model. The full model, which utilizes these informative priors to harmonize data from various sources, is outlined in the third section. Next, we provide an overview of the results from the final model when applied to estimate the annual origin-destination migrant stocks in the EU between 2011 and 2019. In the penultimate section, we carry out validation exercises to assess how well our estimates reflected reality. In the final section, we discuss the results in a wider context in reference to the usefulness of our estimates, as well as future modeling and data developments for obtaining origin-destination migrant stock data for the EU.
Data Sources
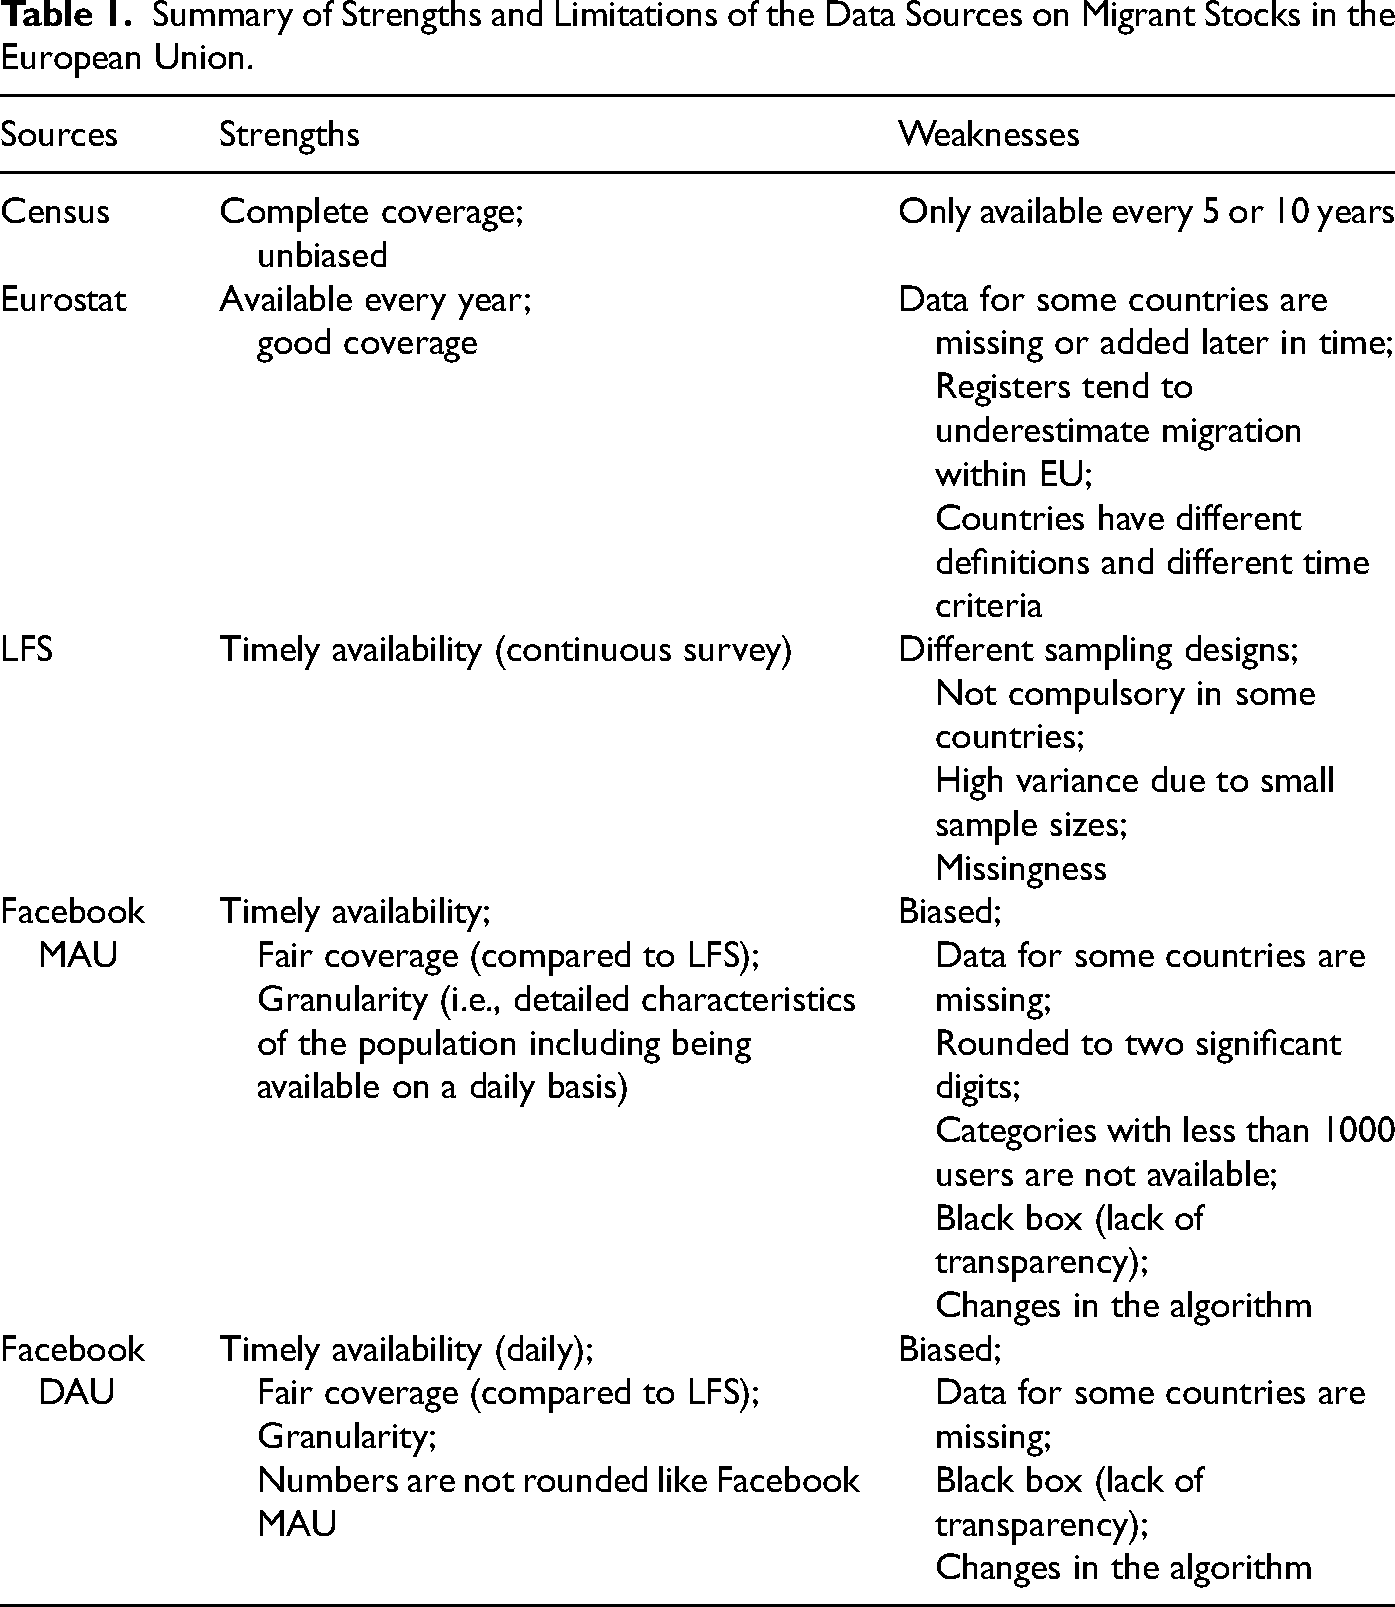
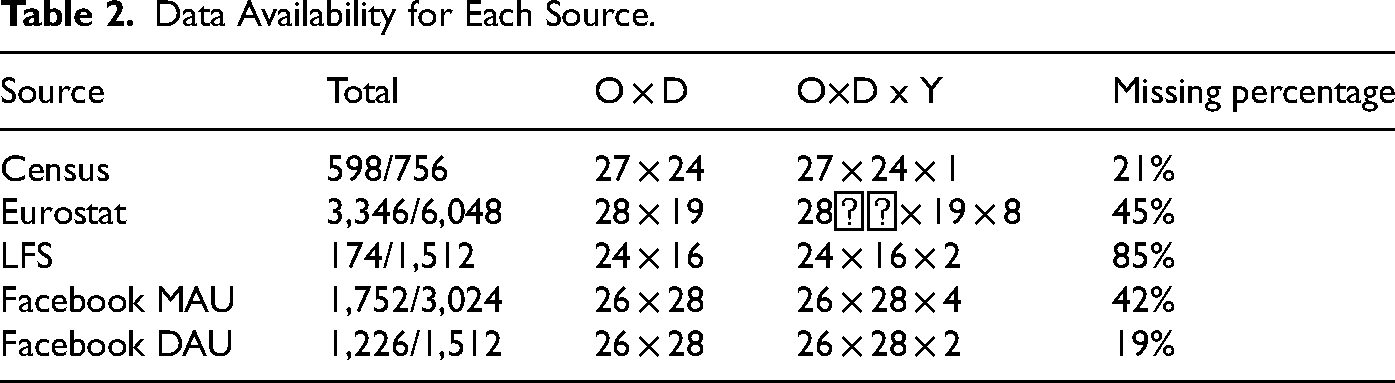
In this section, we outline different data sources that are available for the measurement of bilateral migrant stocks in Europe, based on the sizes of migrant populations cross-classified by their country of birth and country of residence. We divide the data sources into two groups: traditional data sources and novel data sources. For each data source we comment on their strengths and weakness that are summarized in Table 1. These data characteristics feed into our model specification (in the next section) to provide estimates of harmonized EU bilateral migrant stocks. Further, in Table 2, we provide an overview of the availability of data in each source, broken down by origin (country of birth), destination (country of residence), and years in Table 2. In Annex, we present in more detail, the availability of data for each country (Figure 10).
Summary of Strengths and Limitations of the Data Sources on Migrant Stocks in the European Union.
Data Availability for Each Source.
Traditional Data Sources
There are three main sources of traditional data on bilateral migrant population sizes in each EU country; national censuses, data provided to Eurostat by national statistical offices and the European LFS. We obtained harmonized population and housing census data from the Eurostat Census Hub (Eurostat 2018a). These are, at the time of writing, the most recent census data available from Eurostat. Migrant population data are obtained from the published statistics based on replies to census questions on country of birth in each EU country. As censuses are comprehensive data sources that collect information at detailed geographic levels, they are considered as the most reliable source of population counts (Eurostat 2011; Baffour, King and Valente 2013), providing a representative and unbiased quantification of migrant populations. However, they are costly, labor-intensive and usually carried out only every ten years, and consequently published migrant stocks data based on censuses become less accurate during the interval between censuses. In addition, when considering migration within the EU, countries employ different methods to collect census data, such as traditional, register-based and rolling censuses, and apply various reference dates when defining their resident populations (UNECE 2014).
Eurostat publishes annual migrant population counts by country of birth for each member state at the beginning of each year, from data provided by the national statistical offices. These bilateral data are not provided by every member state and when they are published, they typically have a time lag of up to two years. We use population counts on January 1 by country of birth (“mig_pop3ctb” dataset) for years between 2011 and 2018 (inclusive). Within the Eurostat migrant stock data, there is no consensus among countries on the measurement of how a person is defined to be part of a member state's residence population. While the Conference of European Statisticians has recommended using the place of usual residence to measure the population of a country (Lanzieri 2014), only 23 countries use usual resident population definition. Meanwhile, 11 countries use the registered population definition, and six countries use a legal population definition (Eurostat 2015; 2020). Additionally, there are further variations between countries on the time criteria used to consider persons as member of the population (Gendronneau et al. 2019: Tables 4 and 5).
Data extracted from the results of the European LFS in 2016 and 2017 allow for estimations of migrant population sizes based on weighted respondents’ answers, disaggregated by their member state of residence and country of birth. Migrant stock data from the LFS also have several caveats. First, they are based on a range of sampling frames that differ across countries. Second, the participation in the survey is compulsory only in 12 EU member states, which leads to nonresponse issues (Eurostat 2016). Third, due to privacy concerns, data cross-classified by country of birth with small counts of observations are removed from the LFS outputs. The thresholds of what constitutes a small count vary among countries, but typically, only respondents born in countries with large foreign populations are provided. 1 Consequently, estimates of migrant populations from countries with relatively small overseas populations and LFS samples, such as Bulgaria, Croatia, Latvia, Lithuania, and Malta (but not Luxembourg), are affected. Overall, LFS estimates of migrant populations in 85 percent of the migrant corridors (origin-destination combinations) are missing (see Table 2).
Novel Data Sources
In addition to traditional migrant population data sources, we also collected data on migrant population sizes in each EU country based on the number of Facebook Monthly Active Users (MAU) and Daily Active Users (DAU) data. Facebook user data are publicly available via Facebook Marketing Application Programming Interface (API), which was created to allow advertisers to obtain audience size information for their potential advertisement campaigns based on the specific characteristics of users that they wish to target (Facebook 2020). One target characteristic that has previously been fruitful for quantifying migrant populations is the “Lived In country X (formerly Expats—Country X)” field in the Facebook Marketing API; Palotti et al. (2020, 33) provide a more in-depth overview of the Facebook data collection in relation to migrant populations. For our study, we used the audience size of MAU data between 2016 2 and 2019 and DAU data for 2018 and 2019 based on the “Lived In country X (formerly Expats—Country X)” fields, for migration populations from each EU country in all other EU countries.
Facebook data are available on a continuous basis, allowing for the capture of changes in trends in migrant stocks almost immediately, unlike the traditional migrant data sources discussed previously. There are notable drawbacks to Facebook user data for representing the size of migrant population groups. First, as Facebook users are not representative of usual resident population, the audience size numbers do not provide an unbiased estimate of migrant stocks and require calibration. Second, the provision and format of the data shared via API can be changed overnight. For example, in March 2019, Facebook changed their algorithm to identify expats based on a number of criteria (such as login location, user-provided information, groups joined), creating a discontinuity in the MAU and DAU time series. Additionally, since February 26, 2018, the published MAU estimates are rounded to two significant digits for numbers above 1,000 (Spyratos et al. 2018). Thus, in our case, the MAU estimates for categories with fewer than 1,000 users were no longer provided. We mitigated this issue by issuing data requests to the API for combinations of groups of “Lived in” countries and subtracting desired results—for details see Gendronneau et al. (2019: Box 2). As DAU data were only truncated at 20, rather than 1,000, we were able to capture migrant populations of smaller sizes. Third, we interpret the “Lived in” status used by the Facebook Marketing API as a proxy to origin country (as have multiple previous authors who have also used Facebook data to monitor migrant population). However, it is unclear how well the approximation holds, and the precise mechanism used by Facebook to determine their audience sizes. According to Herdağdelen et al. (2016), the “Lived in” status is determined using the self-reported “current city” and “hometown” populated in the “places you have lived” of users’ Facebook profiles, which is then validated by using the network structure of Facebook friends of each user. Spyratos et al. (2018) also conducted an online survey and found that both “country of home town” and “country of previous residence” might determine the way Facebook algorithm assigns “Lived in” country to users. Other attributes, such as geo-tagged information, might also be utilized.
As audience data from Facebook cover users aged 13 or above, we restricted our data collection to migrant populations aged between 15 and 64. This was mainly to avoid potential biases of low representativeness of the very young (12–13) as well as older population (65+) in the Facebook data (Mellon and Prosser 2017; Spyratos et al. 2019). Further, the above-mentioned available data from past projects2 also referred to 15–64 age group. To make data from the traditional data sources comparable, we also applied the same age ranges when processing each data set.
Methodology
Modeling Framework
To estimate the number of EU migrants in each member state, timely, unbiased, and accurate data set is required. However, as discussed in the previous section, currently there is no single data source that satisfies all of these characteristics. In this section, we develop a bespoke statistical model to combine the data described in the previous section to provide a harmonized and complete estimate of annual bilateral migrant stocks in EU between 2011 and 2019. The model adapts the framework first developed by Raymer et al. (2013) and Wiśniowski et al. (2013) to estimate and predict the “true” unobserved stocks of migrants within EU. The framework is based on an integration of a measurement model to explicitly adjust observed data for measurement issues related to each data source with a migration model to predict missing migrant data. Our conceptual framework for a model for migrant stock data is shown in Figure 1. The model utilizes all the data sources outlined in the previous section with specific terms included to adjust each source for relative strengths and weaknesses. In particular, each data source is characterized by its bias and accuracy in the measurement model to correct the source-specific biases and varying accuracies. The migration forecasting model is based on a hierarchical time series model that generates forecasts of migrant stocks for each corridor in each year. The hierarchical structure permits borrowing of information across countries, with migrant corridors where there are more abundant and higher quality data aiding the estimation of migrant populations in countries with scarce or completely missing data.
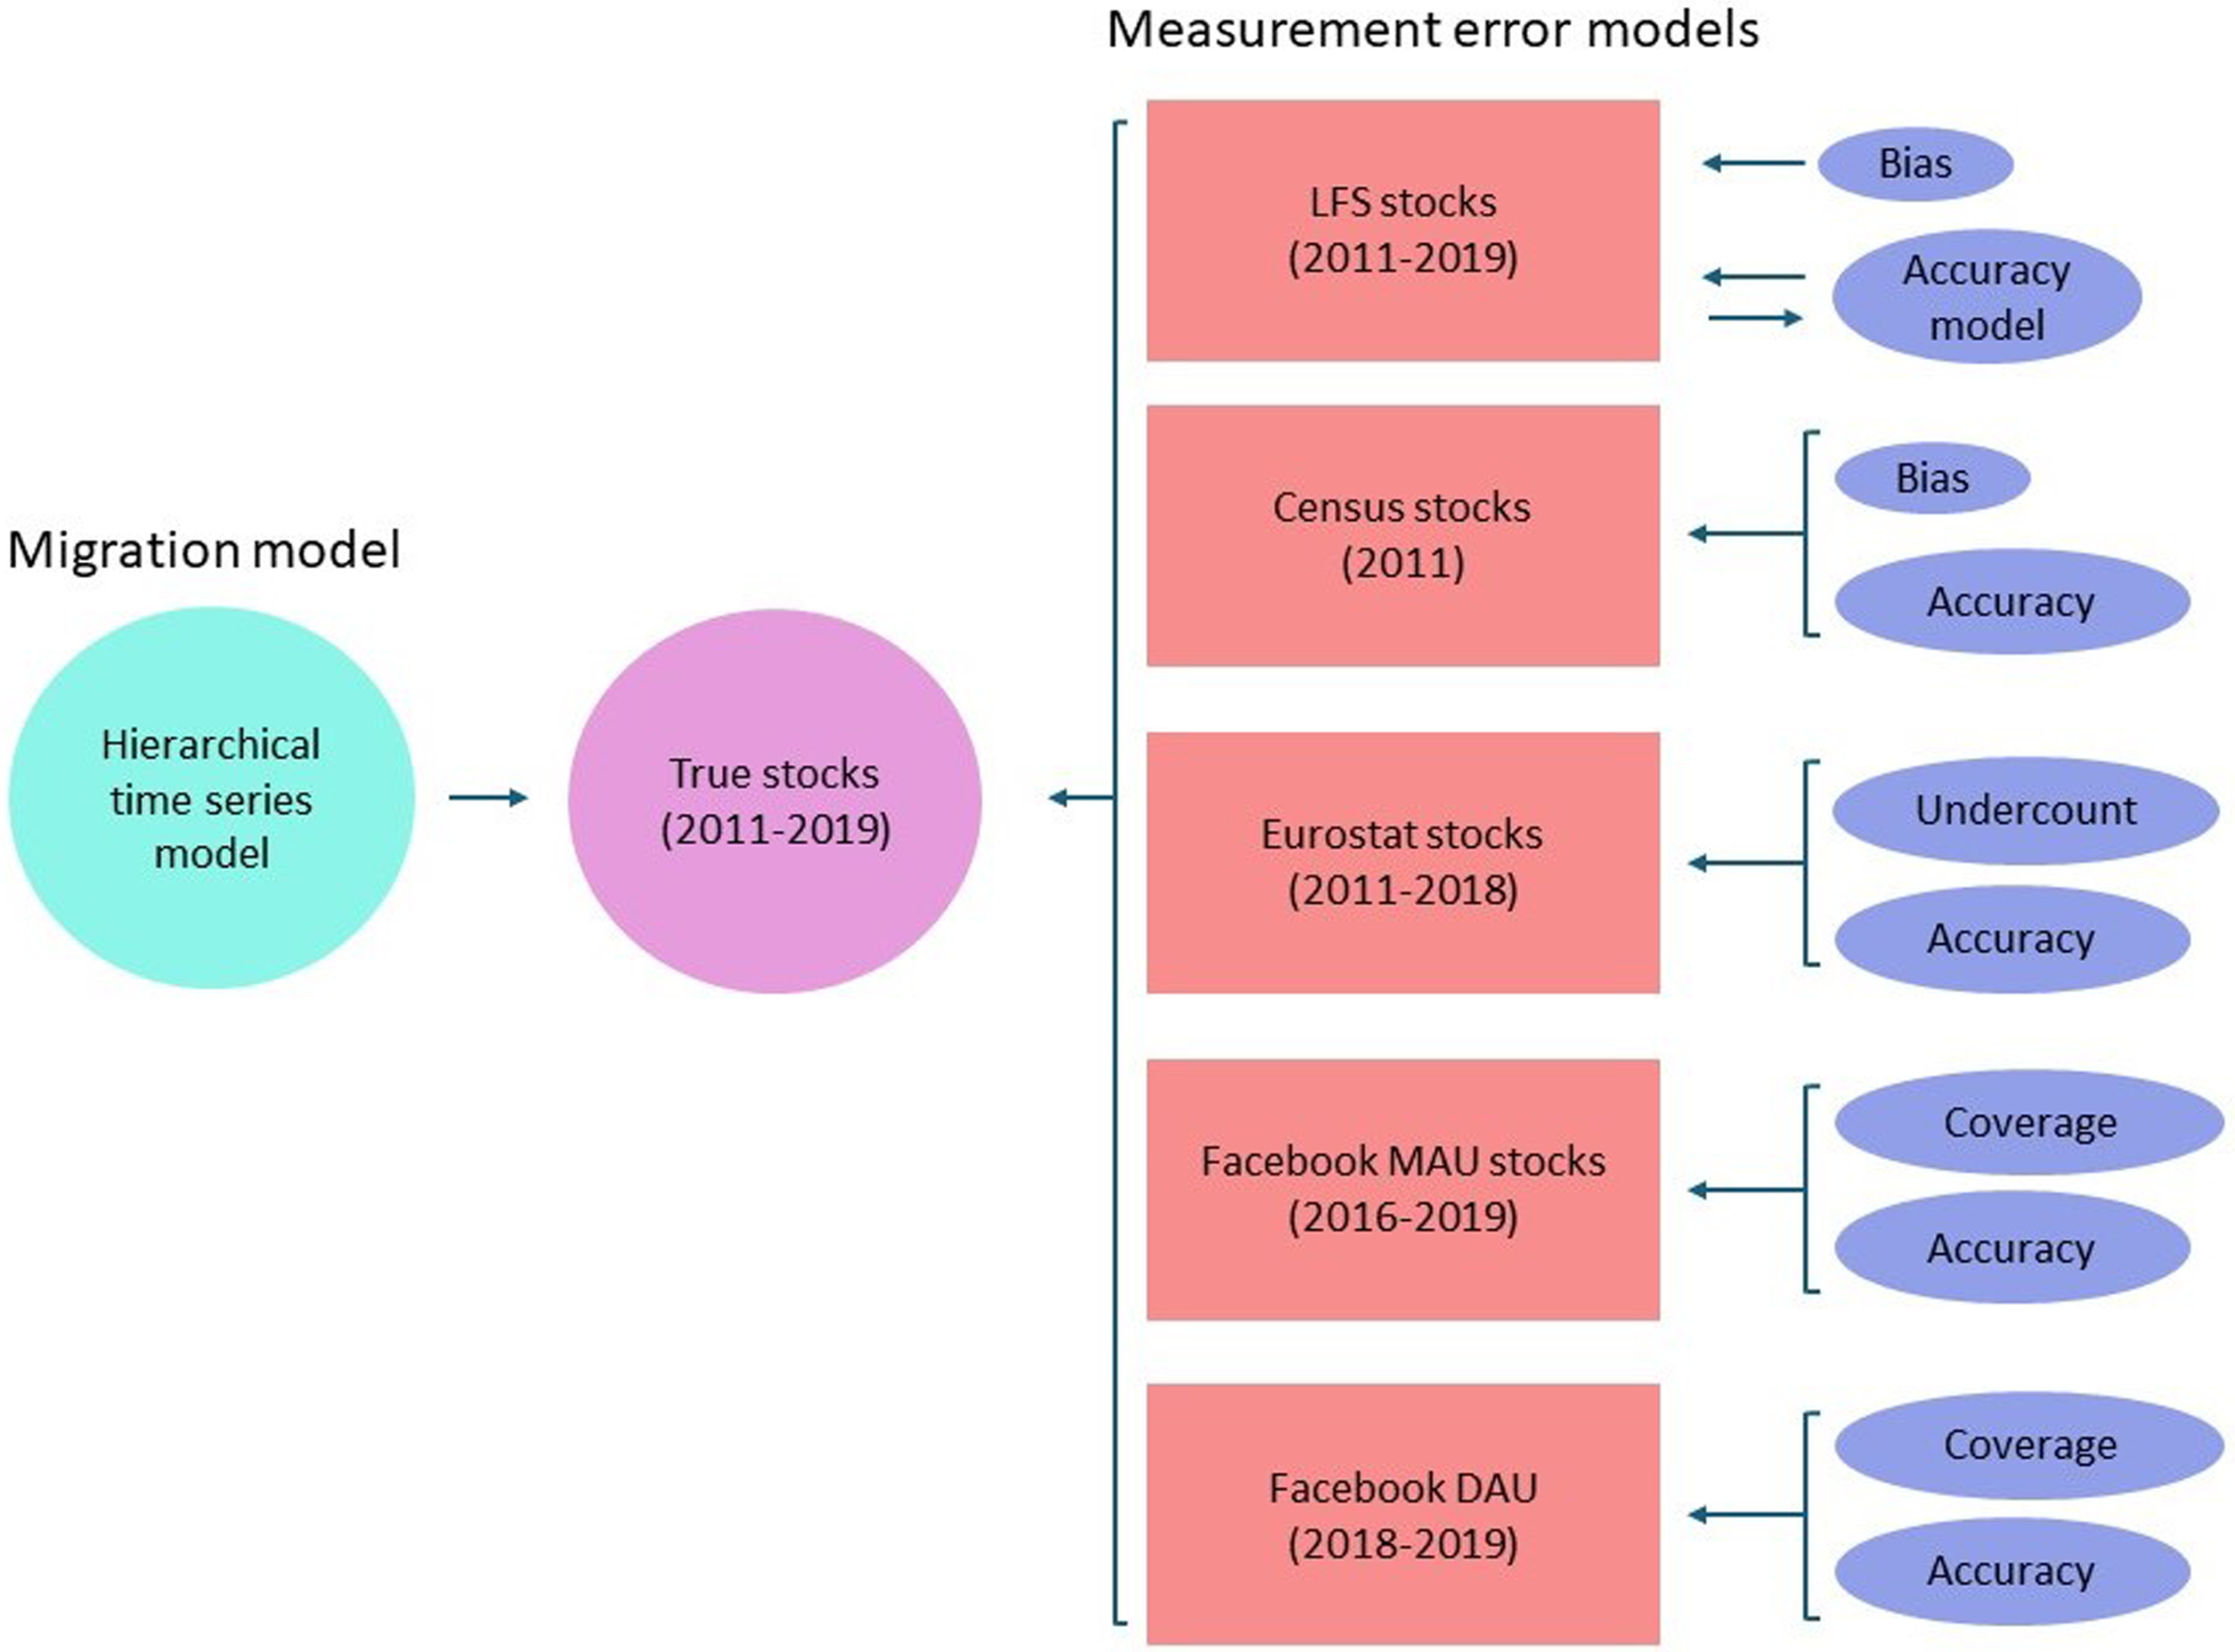
Conceptual framework of the model for combining census, Labour Force Survey, Eurostat and Facebook (Monthly and Daily Active Users) data.
The model parameters are estimated by using Bayesian inference that allows for model-based forecasts (e.g., Kaplan 2014; Bijak and Bryant 2016; Lynch and Bartlett 2019). Bayesian inference treats all unknowns in the model (i.e., model parameters, as well as estimates and forecasts of migrant stocks) as probability distributions. Prior distributions (or “priors”) represent knowledge or expert opinion about the unknown model parameters before seeing the data. In this work, we create informative prior distributions based on information about the quality of the data sources. Bayesian inference quantifies the uncertainty about these unknown parameters by updating these prior distributions with available data through a statistical model, to produce posterior distributions (or “posteriors”) of the parameters that can then be used to forecasts bilateral migrant stocks for all corridors and years.
Measurement Model
In our modeling framework, we assume that the reported level of stocks of within-EU migrants is measured with bias, that is, it is an unknown proportion of the true unobserved stocks. We develop a bias measure that is a composite of the deficiencies of each source based on (i) coverage of the population targeted to be measured by statistical offices; (ii) undercount of the within-EU migrants due to an underreporting upon arrival; or (iii) overcount of migrants due to, for instance, omission of the de-registration at a population register upon departure (Kupiszewska and Nowok 2008).
The accuracy of the data source represents a random variation in the reported population stocks. The size of this variation can vary according to a number of factors. Traditional migration data, such as those from censuses or administrative sources, tend to be more accurate as they aim to cover entire population. Data based on surveys suffer from sampling errors that depend on the sample size and design of the survey. For Facebook data, the random variation over time is much larger in data based on DAU than MAU. In our accuracy measure, we assume that Facebook data are less precise than the censuses and administrative data reported by Eurostat and that larger reported stocks have larger associated variability (or overdispersion). The only exception to this assumption is for data derived from the LFS, which tend to exhibit underdispersion, that is, a large observed count is typically characterized by lower uncertainty (cf. Eurostat 2018b: Table 4.1a). In detail, our measurement model for the stocks of EU migrants from origin i residing in destination j at time t and reported in data source k, denoted by 
Our prior assumptions for bias in the Facebook data are based on the ratios of all Facebook users to the total population (coverage or penetration) in a given country and year, similar to the approach of Gil-Clavel and Zagheni (2019) and Ribeiro, Benevenuto and Zagheni (2020). We combine countries according to the size of the ratios into four and five groups depending on the particular year. The ratios within a group are then summarized into a prior distribution based on the group's average ratio. For example, Austria, Germany, Latvia, and Poland had an average of 45 percent coverage in the Facebook population, the lowest coverage in 2017, which we used as the expectation of the Facebook data bias parameter for that group.
The prior distributions for bias parameters in the LFS data were set up to be weakly informative, and hence have a very minor inference in the modeling framework for the estimation of migrant populations. We present the full set of prior distributions for the bias in each data source in Figure 11 in the Annex; further details about each prior can be found in Gendronneau et al. (2019: Annex 1).
Priors for the variance parameters,
Migration Forecasting Model
We estimate within-EU bilateral migrant populations by using a hierarchical stationary times series model for the true migrant stocks 

Sensitivity Analysis
The validation of our main model (denoted further as S1) with external data is limited by our use of the best available bilateral migrant stock data to produce our estimates of the true stocks. However, we are able to assess the sensitivity of the model to our underlying assumptions by varying a range of assumptions and model inputs in eight different combinations. First, we assume larger spread of the Facebook bias parameter (Model S2). Second, we partially or fully exclude a data source. We start with randomly removing 5 percent, 10 percent, and 20 percent of observations in Eurostat data in each year (Models S3, S4, and S5). Next, “Eurostat excluded 2016” (Model S6) and “Eurostat excluded 2018” (Model S7) data were fully excluded; Model S8 uses only Eurostat data. Finally, in the last model (S9), we do not use Facebook MAU nor DAU. We present the results of the sensitivity analysis in the next section, after the results from the main model. We also carry out a validation exercise of the total EU migrant population, aggregated over our bilateral estimates, with equivalent available reported statistics.
To assess the robustness of the migration forecasting model, we considered two alternative specifications of the time series model. Both assumed a random walk for the true migrant stocks rather than autoregression, with one including a global drift. We present details in Annex B.
Results
The posterior distributions of the parameters and annual bilateral migrant stocks were computed with Markov Chain Monte Carlo algorithm implemented in JAGS via R software (Plummer 2003). We used samples of size 1,000 for each of three chains with 50,000 burn-in iterations and a thinning of 1,000 (i.e., each 1,000th iteration was taken, after the burn-in). The code for the model is available in the public GitHub repository (https://github.com/a-wis/integrating-migrant-stocks).
Migrant Stocks Estimates
Figure 2 provides both estimated medians (with 80% Predictive Interval, further denoted by PI) and reported overall working age (between 15 and 64) EU migrant stocks residing in another EU country. The model estimates a total median value of 12.5 million migrants in the EU (from other EU countries) in 2011, which rises to 15.7 million EU migrants in 2019. The estimated median values are consistently higher than reported stocks from any of the data sources in every year due to two reasons. First, none of the data sources of reported stocks provide migration population counts for all origin-destination pairs for their respective years. Consequently, the aggregated reported data do not fully capture all intra-EU migrant stocks in their totals. As our model combines all data sources and borrows information across observations, we are able to estimate a complete array of origin-destination migrant stocks in each year. Second, our model corrects the observed data for the undercounting or overcounting bias via the measurement model and our formulated prior distributions.
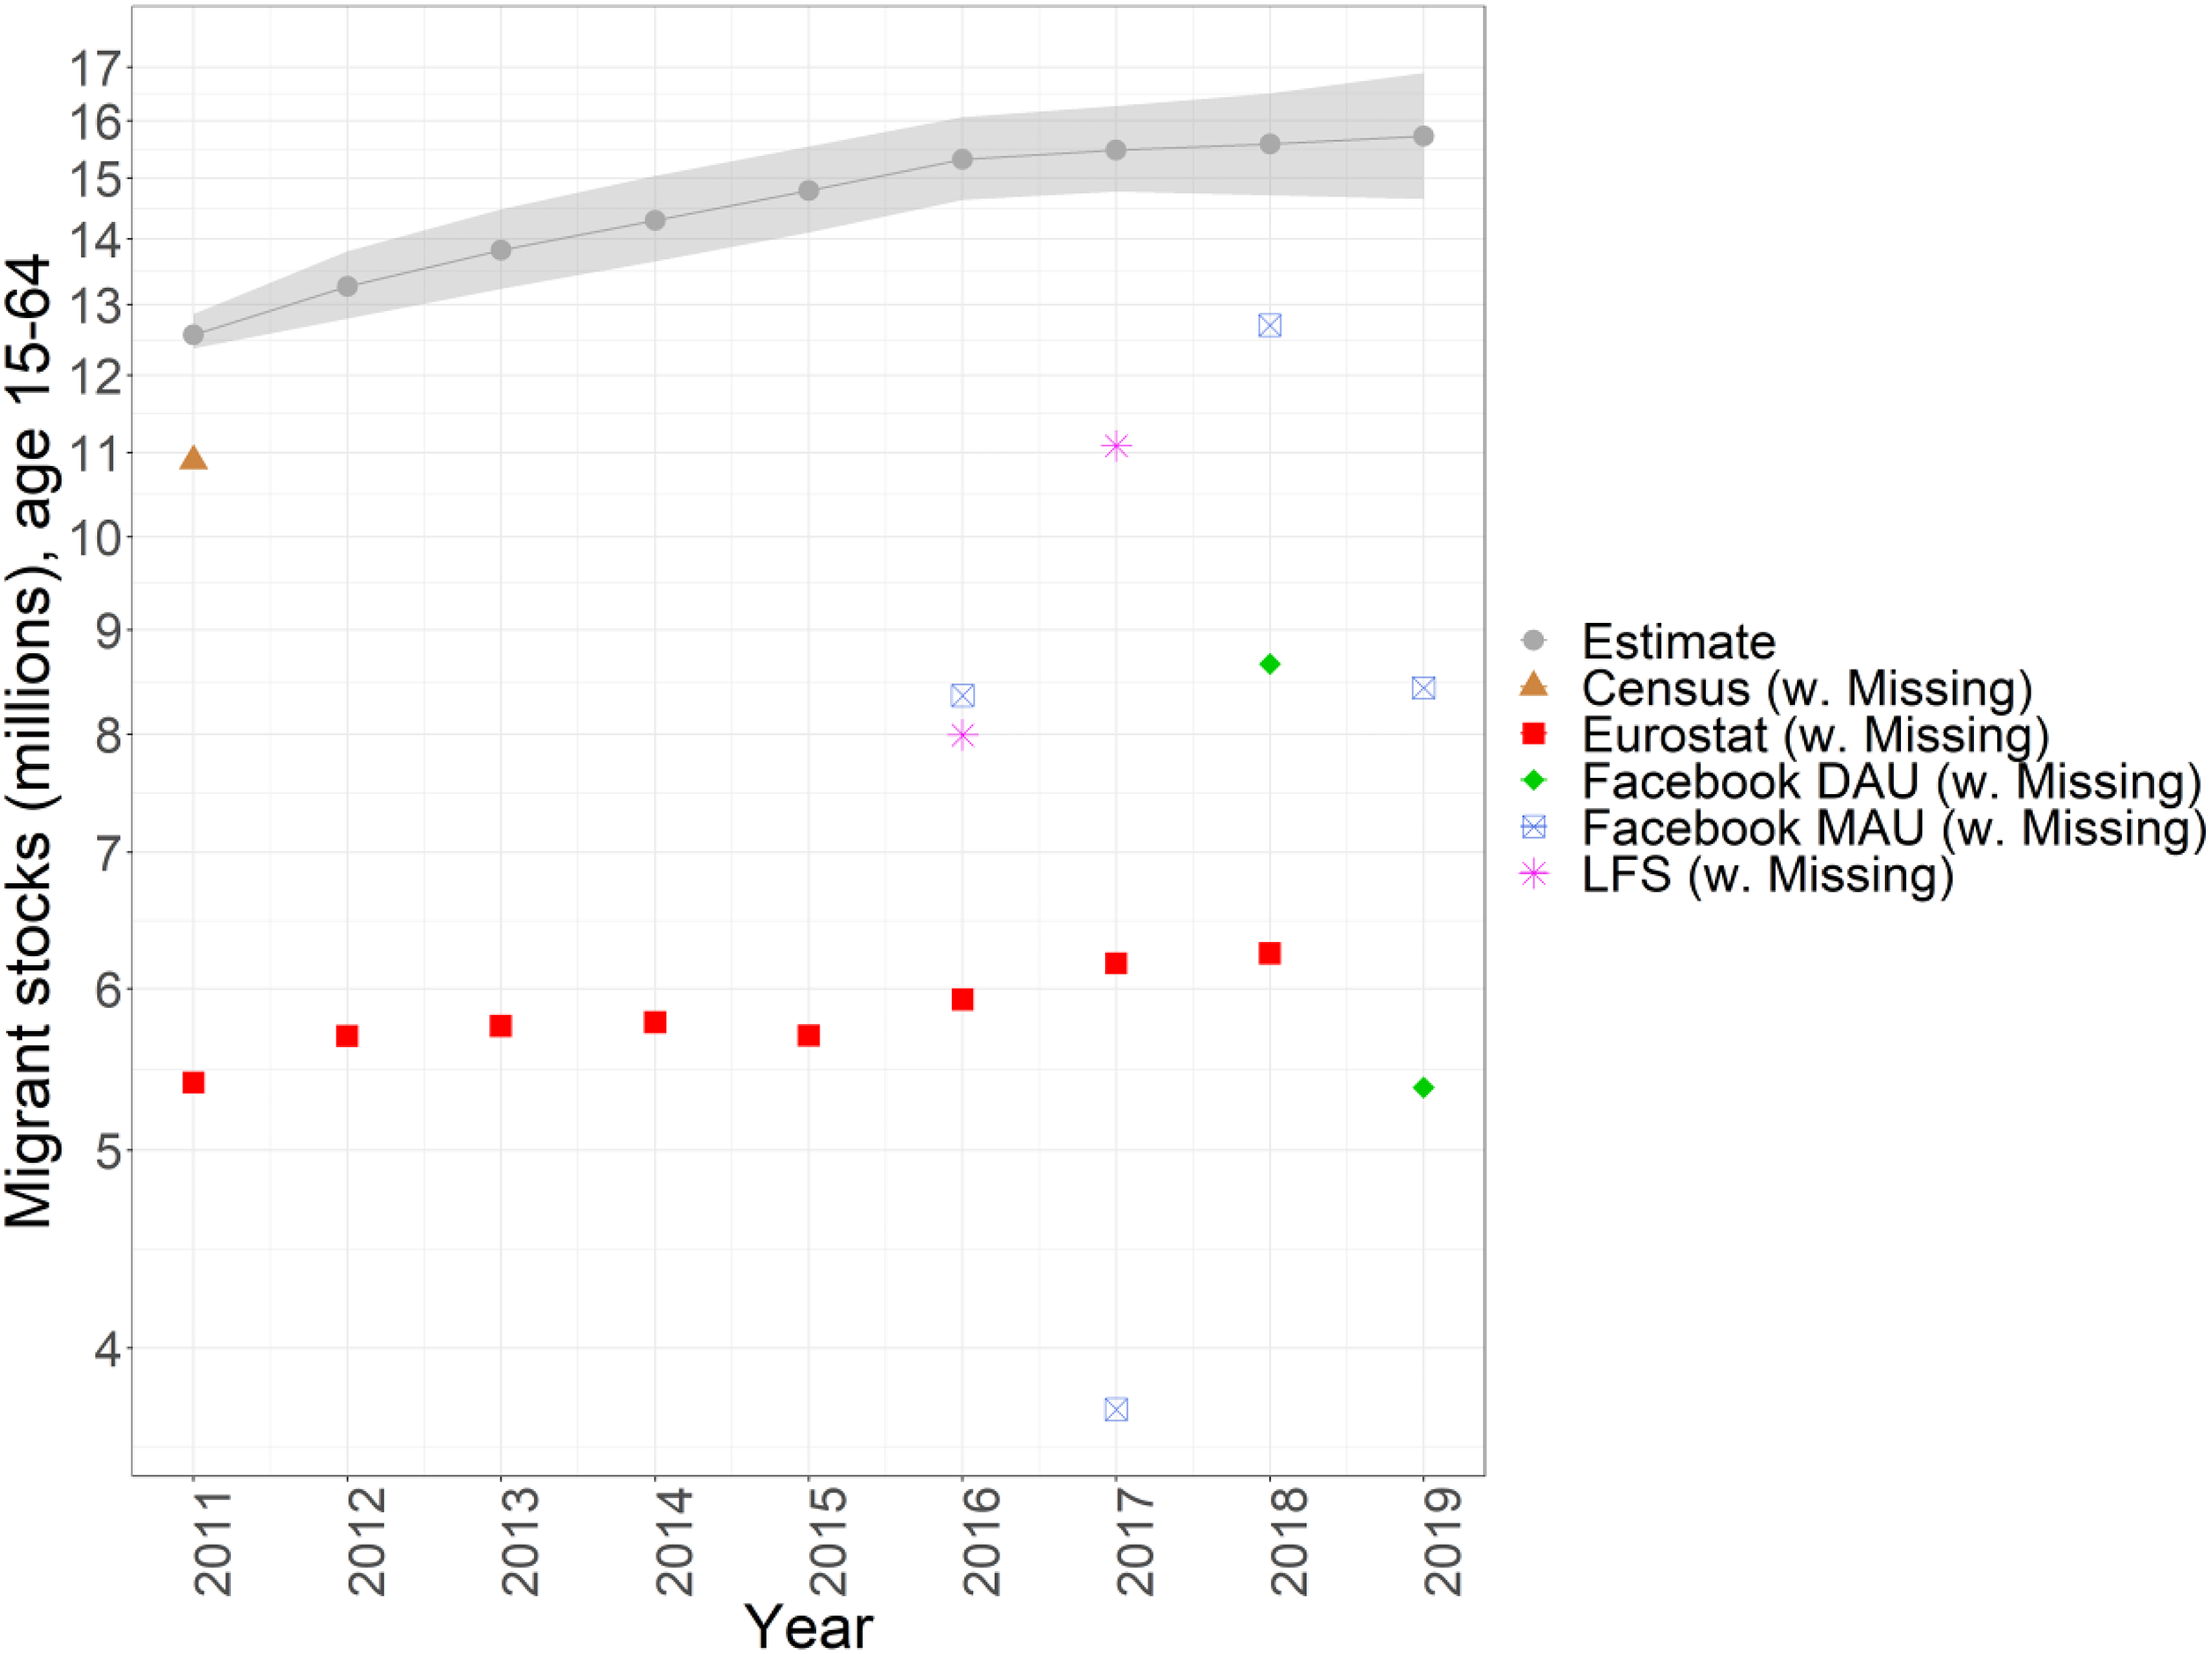
Model-based estimate of total EU migrant stocks (age 15–64).
In Figure 3, we present a chord diagram plot to show the spatial patterns of the distribution of EU migrant stocks residing in the EU countries that originate in other EU countries, in 2019. 5 Romania and Poland are the largest origin countries, from which 3.07 and 2.49 million people, respectively, live elsewhere in other EU countries. The largest Romanian migrant populations are in Italy, Spain, and the United Kingdom, whereas Polish migrant populations are greatest in volume in Germany and the United Kingdom. The largest migrant populations from other EU countries are observed in Germany (2.8 million), United Kingdom (2.6 million), Italy (1.85 million), and Spain (1.8 million). This is in line with the officially reported data for 2019, which were not used as input to our model (we used Eurostat data up until 2018). In Figure 4, we present the stocks of immigrants (persons originating in other EU countries) and emigrants (persons originating in a given country but residing in another EU country) over time for each country.
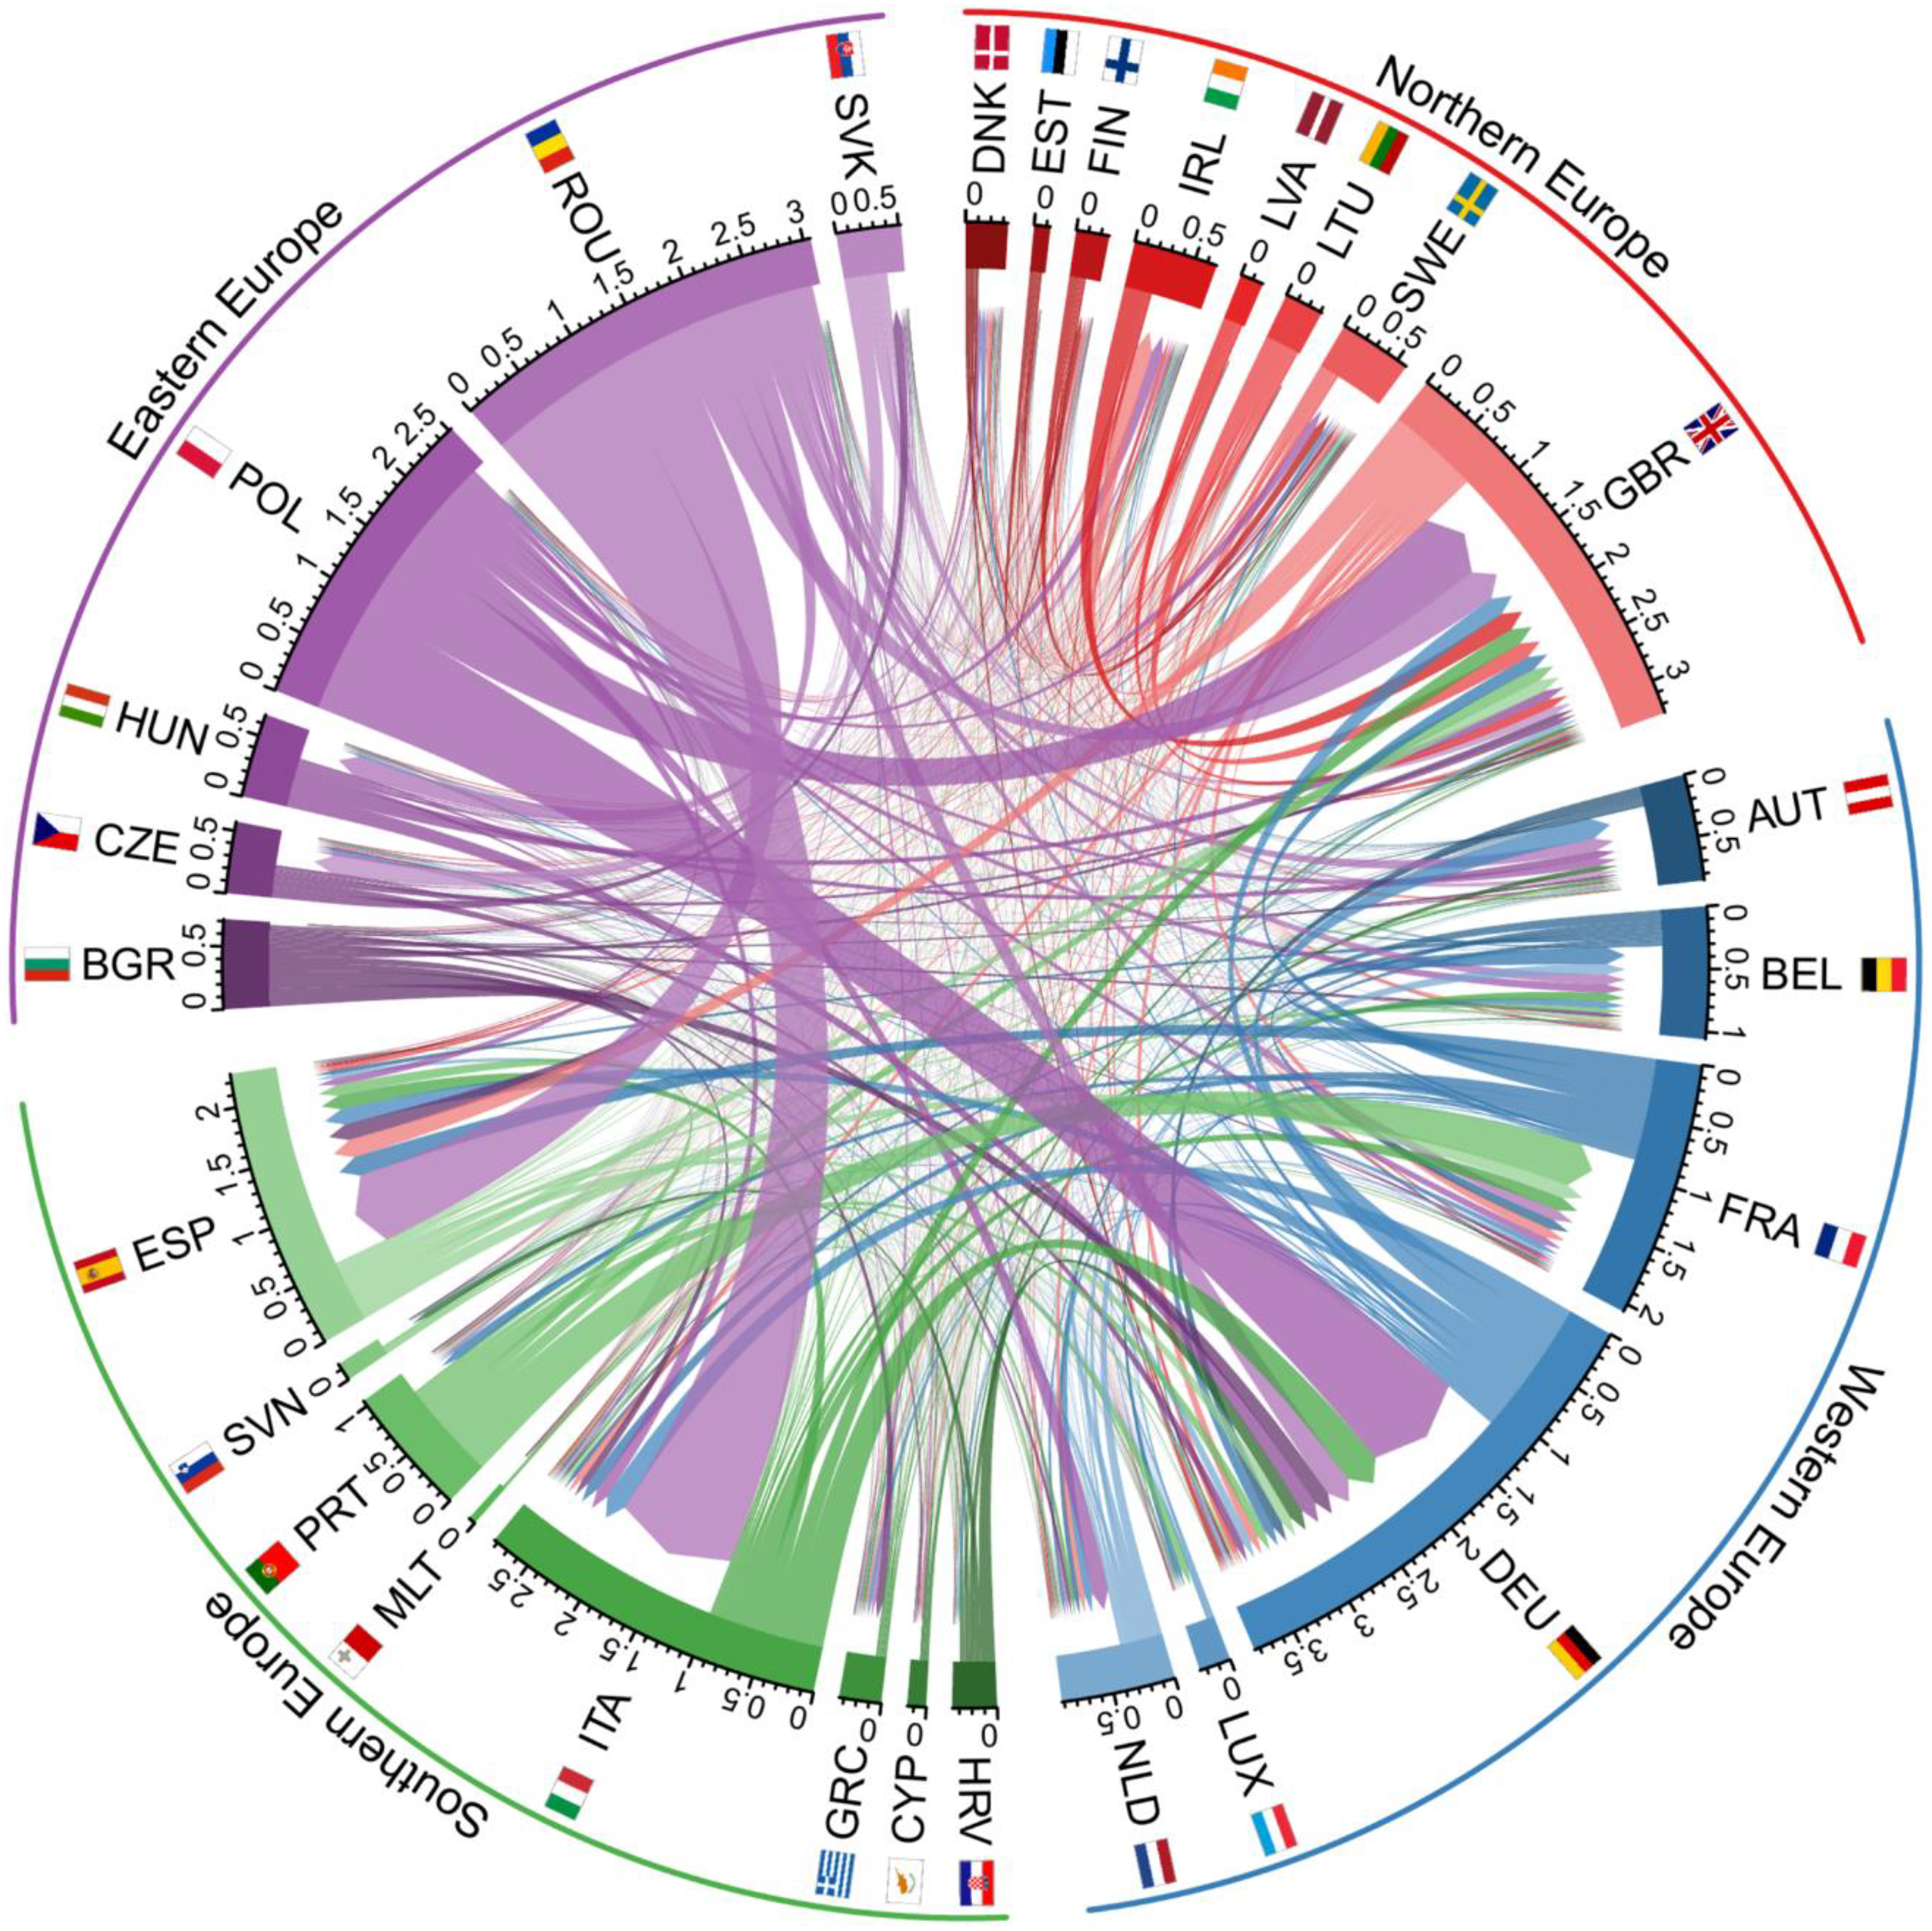
Chord diagram plot representing the estimated stocks of migrants (age 15–64) in the EU that originate in other EU countries in 2019. The width of the chord ends indicates the number of persons (in millions) in a given migrant population, where the arrow head indicates country of residence of the migrant population and the color and chord base represents the country of birth.
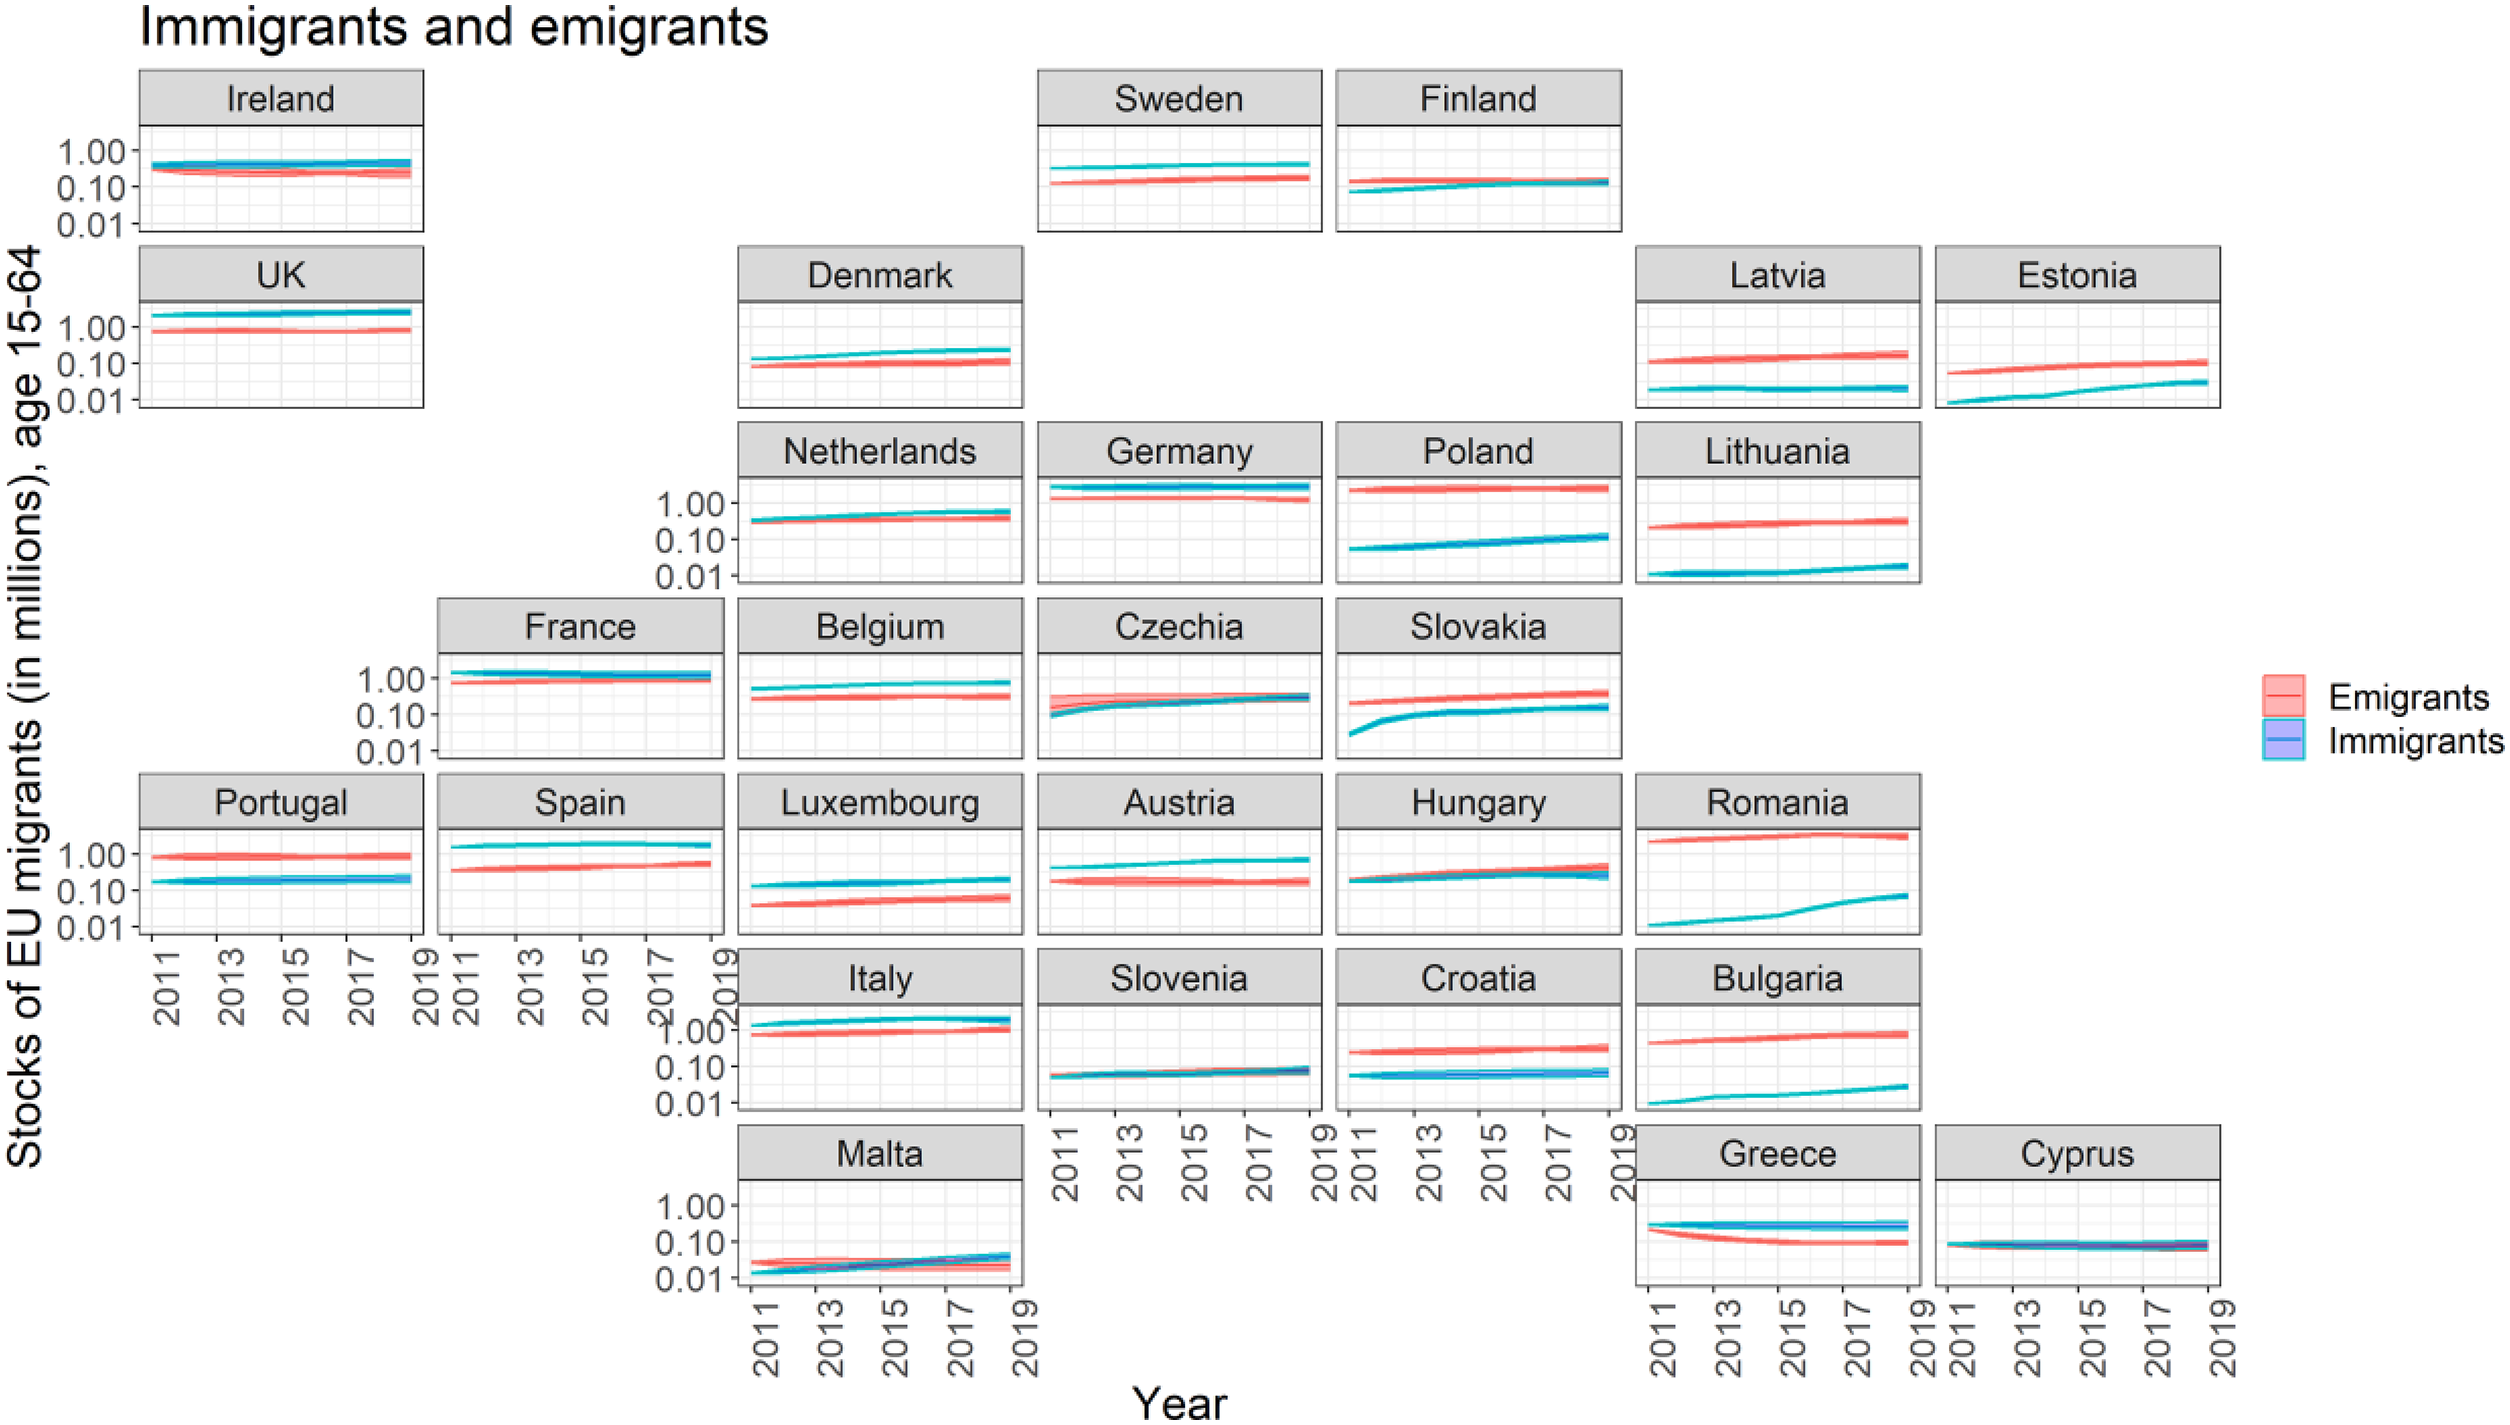
Estimated stocks of EU migrants, age 15–64, for 2011–2019.
Figure 5 provides a comparison between estimated (median and 80% PIs) and reported migrant stocks from Poland to the Netherlands (Panel a) and to the United Kingdom (Panel b) over time. The stocks of Polish migrants in the Netherlands are estimated based on the Eurostat, LFS, Facebook MAU, and Facebook DAU data. As illustrated in Figure 5a, the estimated migrant populations are close to the reported values in Eurostat (the Mean Absolute Percentage Error is 8%), and their respective 80 percent PIs are relatively narrow due to the abundance of data sources of good quality, with the exception of the LFS data where there is considerable undercount in comparison to our median estimates. Estimates of Polish migrants residing in the United Kingdom (Figure 5b) are based on Census, LFS, Facebook MAU, and Facebook DAU data. Estimates between 2012 and 2015 rely solely on the migration forecasting model because of missing data points for these years. The lack of annually collected consistent data in Eurostat and the larger migrant stock result in a larger 80 percent PI for the estimated stocks of migrants originating from Poland and residing in the United Kingdom. We provide similar figures showing migrant stocks from each EU country and residing in the Netherlands and in Poland in Annex (Figure 12 and Figure 13, respectively).
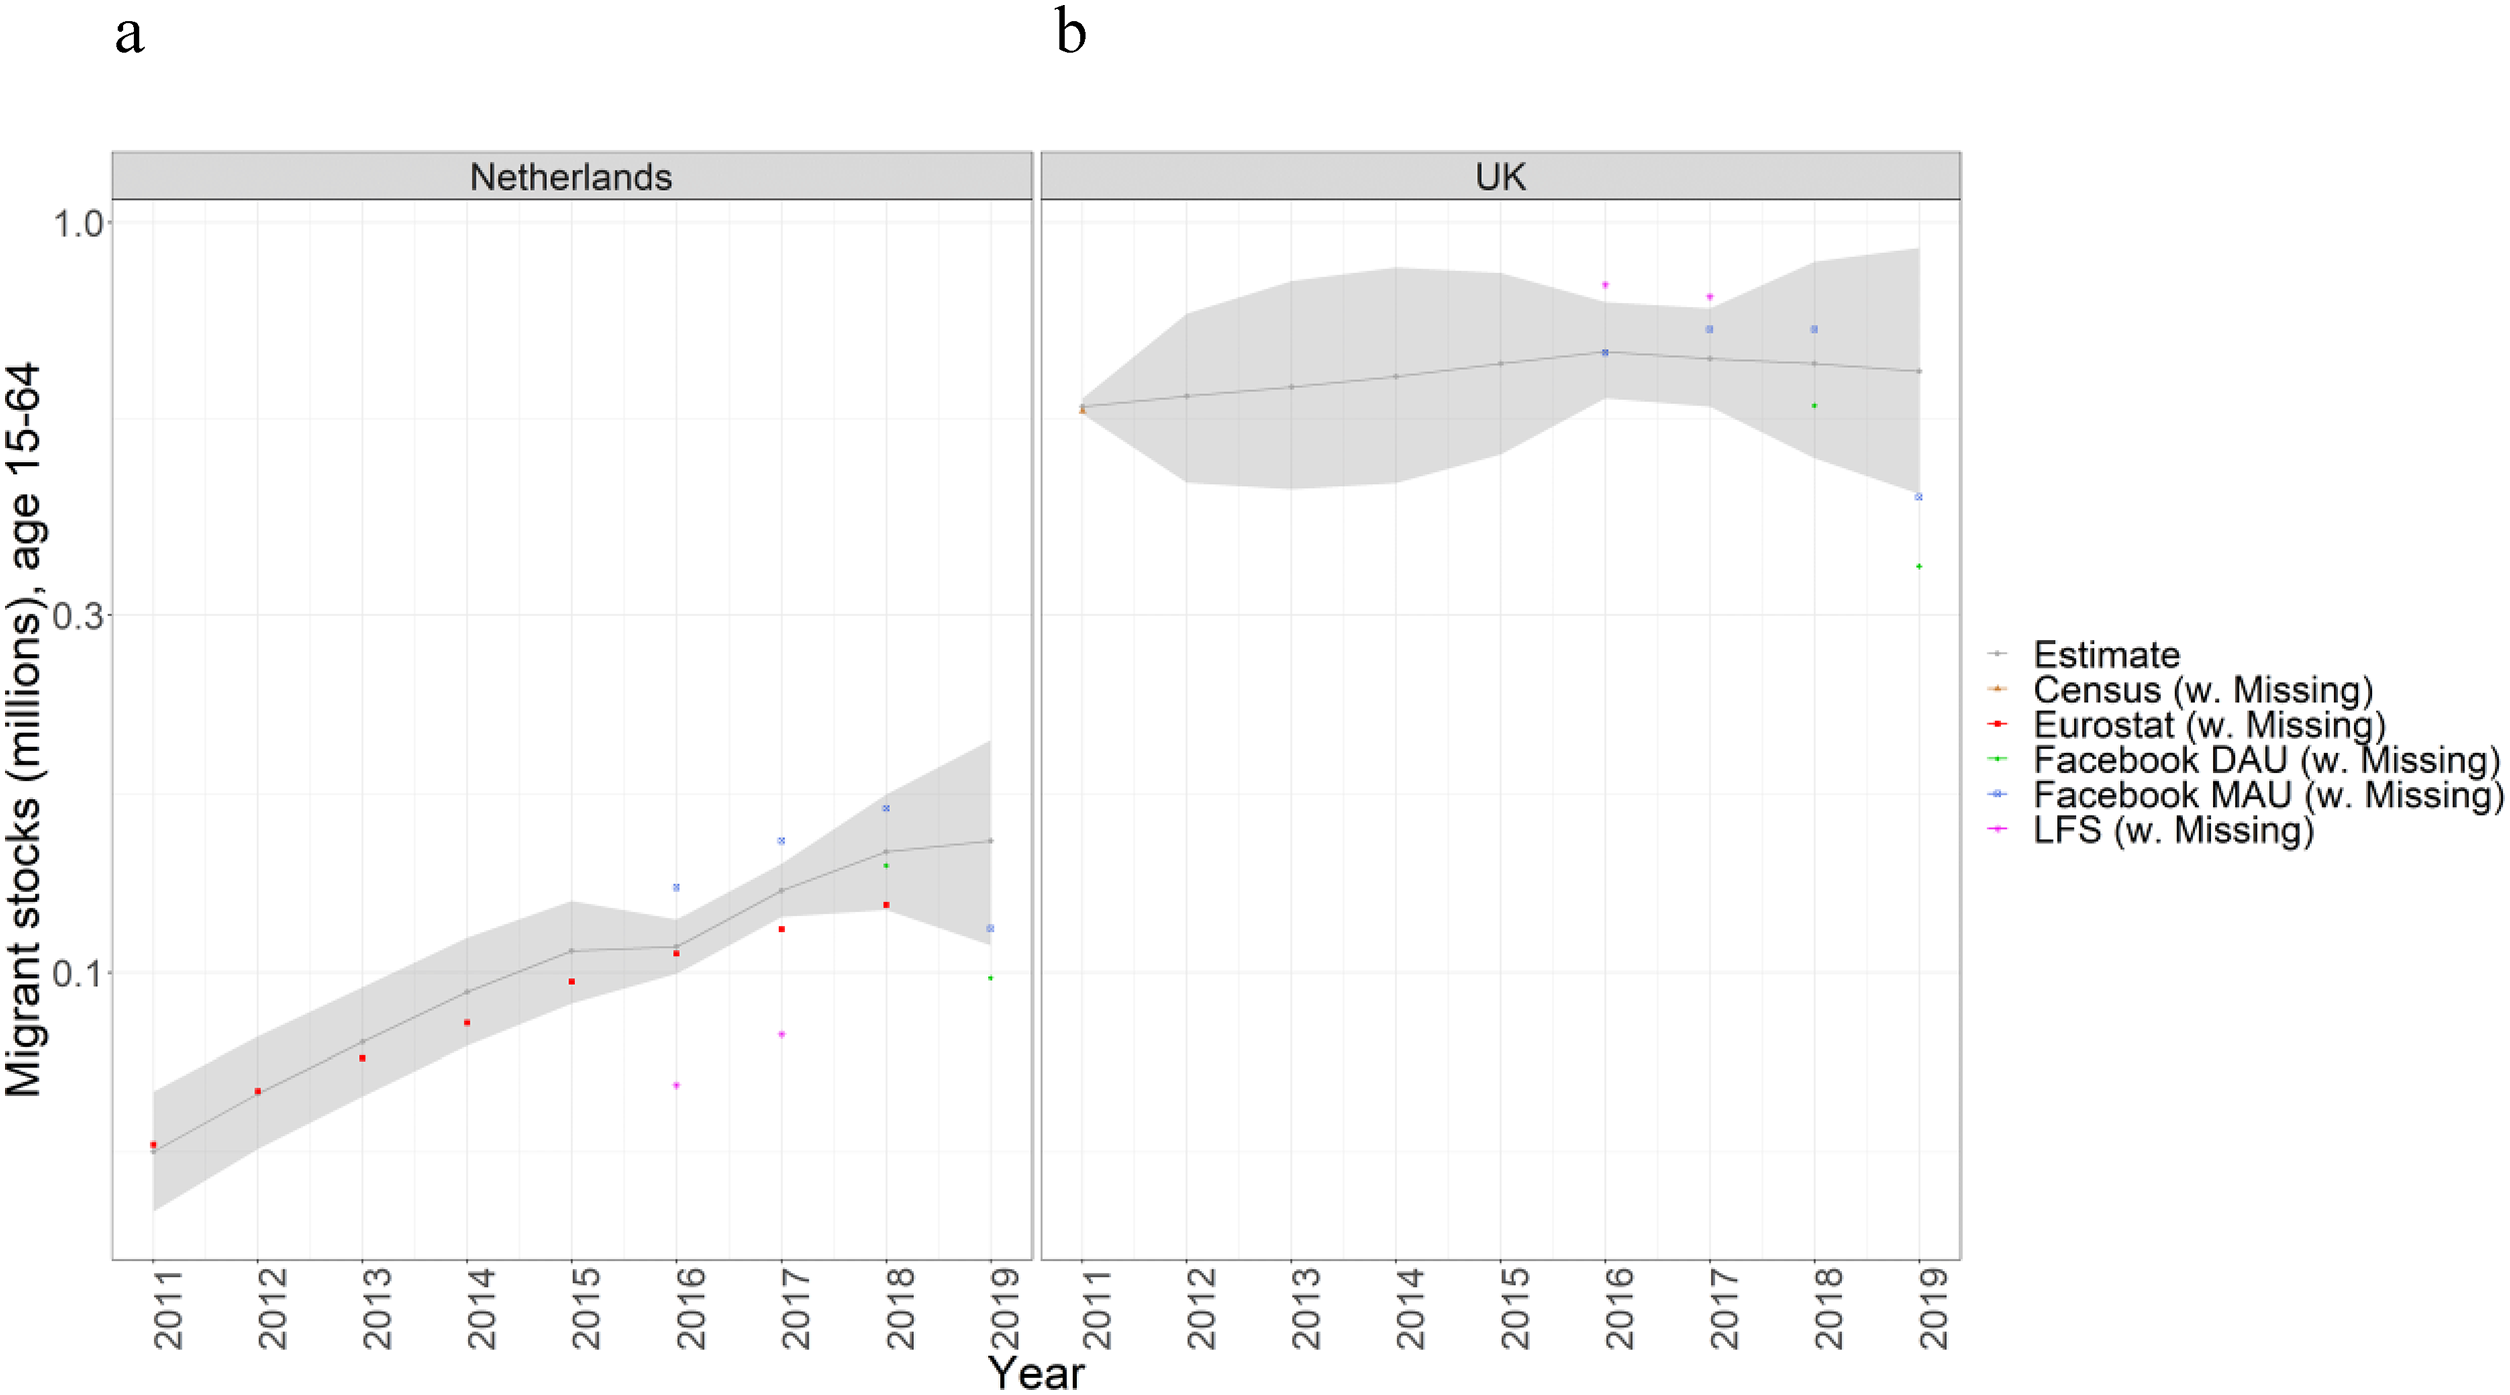
Migration stocks (in millions) from Poland to the Netherlands and United Kingdom, age 15–64.
Sensitivity Analysis
To assess the robustness of the model, we ran eight alternative models to study the sensitivity of the estimates to different modeling assumptions and data sources, as described in the previous section. We present the intra-EU migrant population totals estimated in these eight alternative models and their respective 50 percent PIs in Figure 6. We find models with lower Facebook coverage precision, and with partially removed Eurostat data provide the closest estimates to the main model, where their PIs overlap considerably. The PI of the estimates from the model that excluded Eurostat 2016 data also largely overlaps with the PI of the main model estimates. However, the median estimates in 2018 and 2019 are lower than the aforementioned models. The remaining three models estimate lower total intra-EU migrant stocks than the main model. Two of the sensitivity models are particularly notable. First, the model without Facebook data shows a slight downward trend after 2014 with the exception of a small increase in 2018. This demonstrates the usefulness of incorporating Facebook data in capturing the migrant stock trends in the recent years. Second, the model that employs only Eurostat data has the lowest estimated total intra EU migrant stocks and the largest uncertainty, as the Eurostat data are unavailable for 45 percent of the observations (see Table 2).
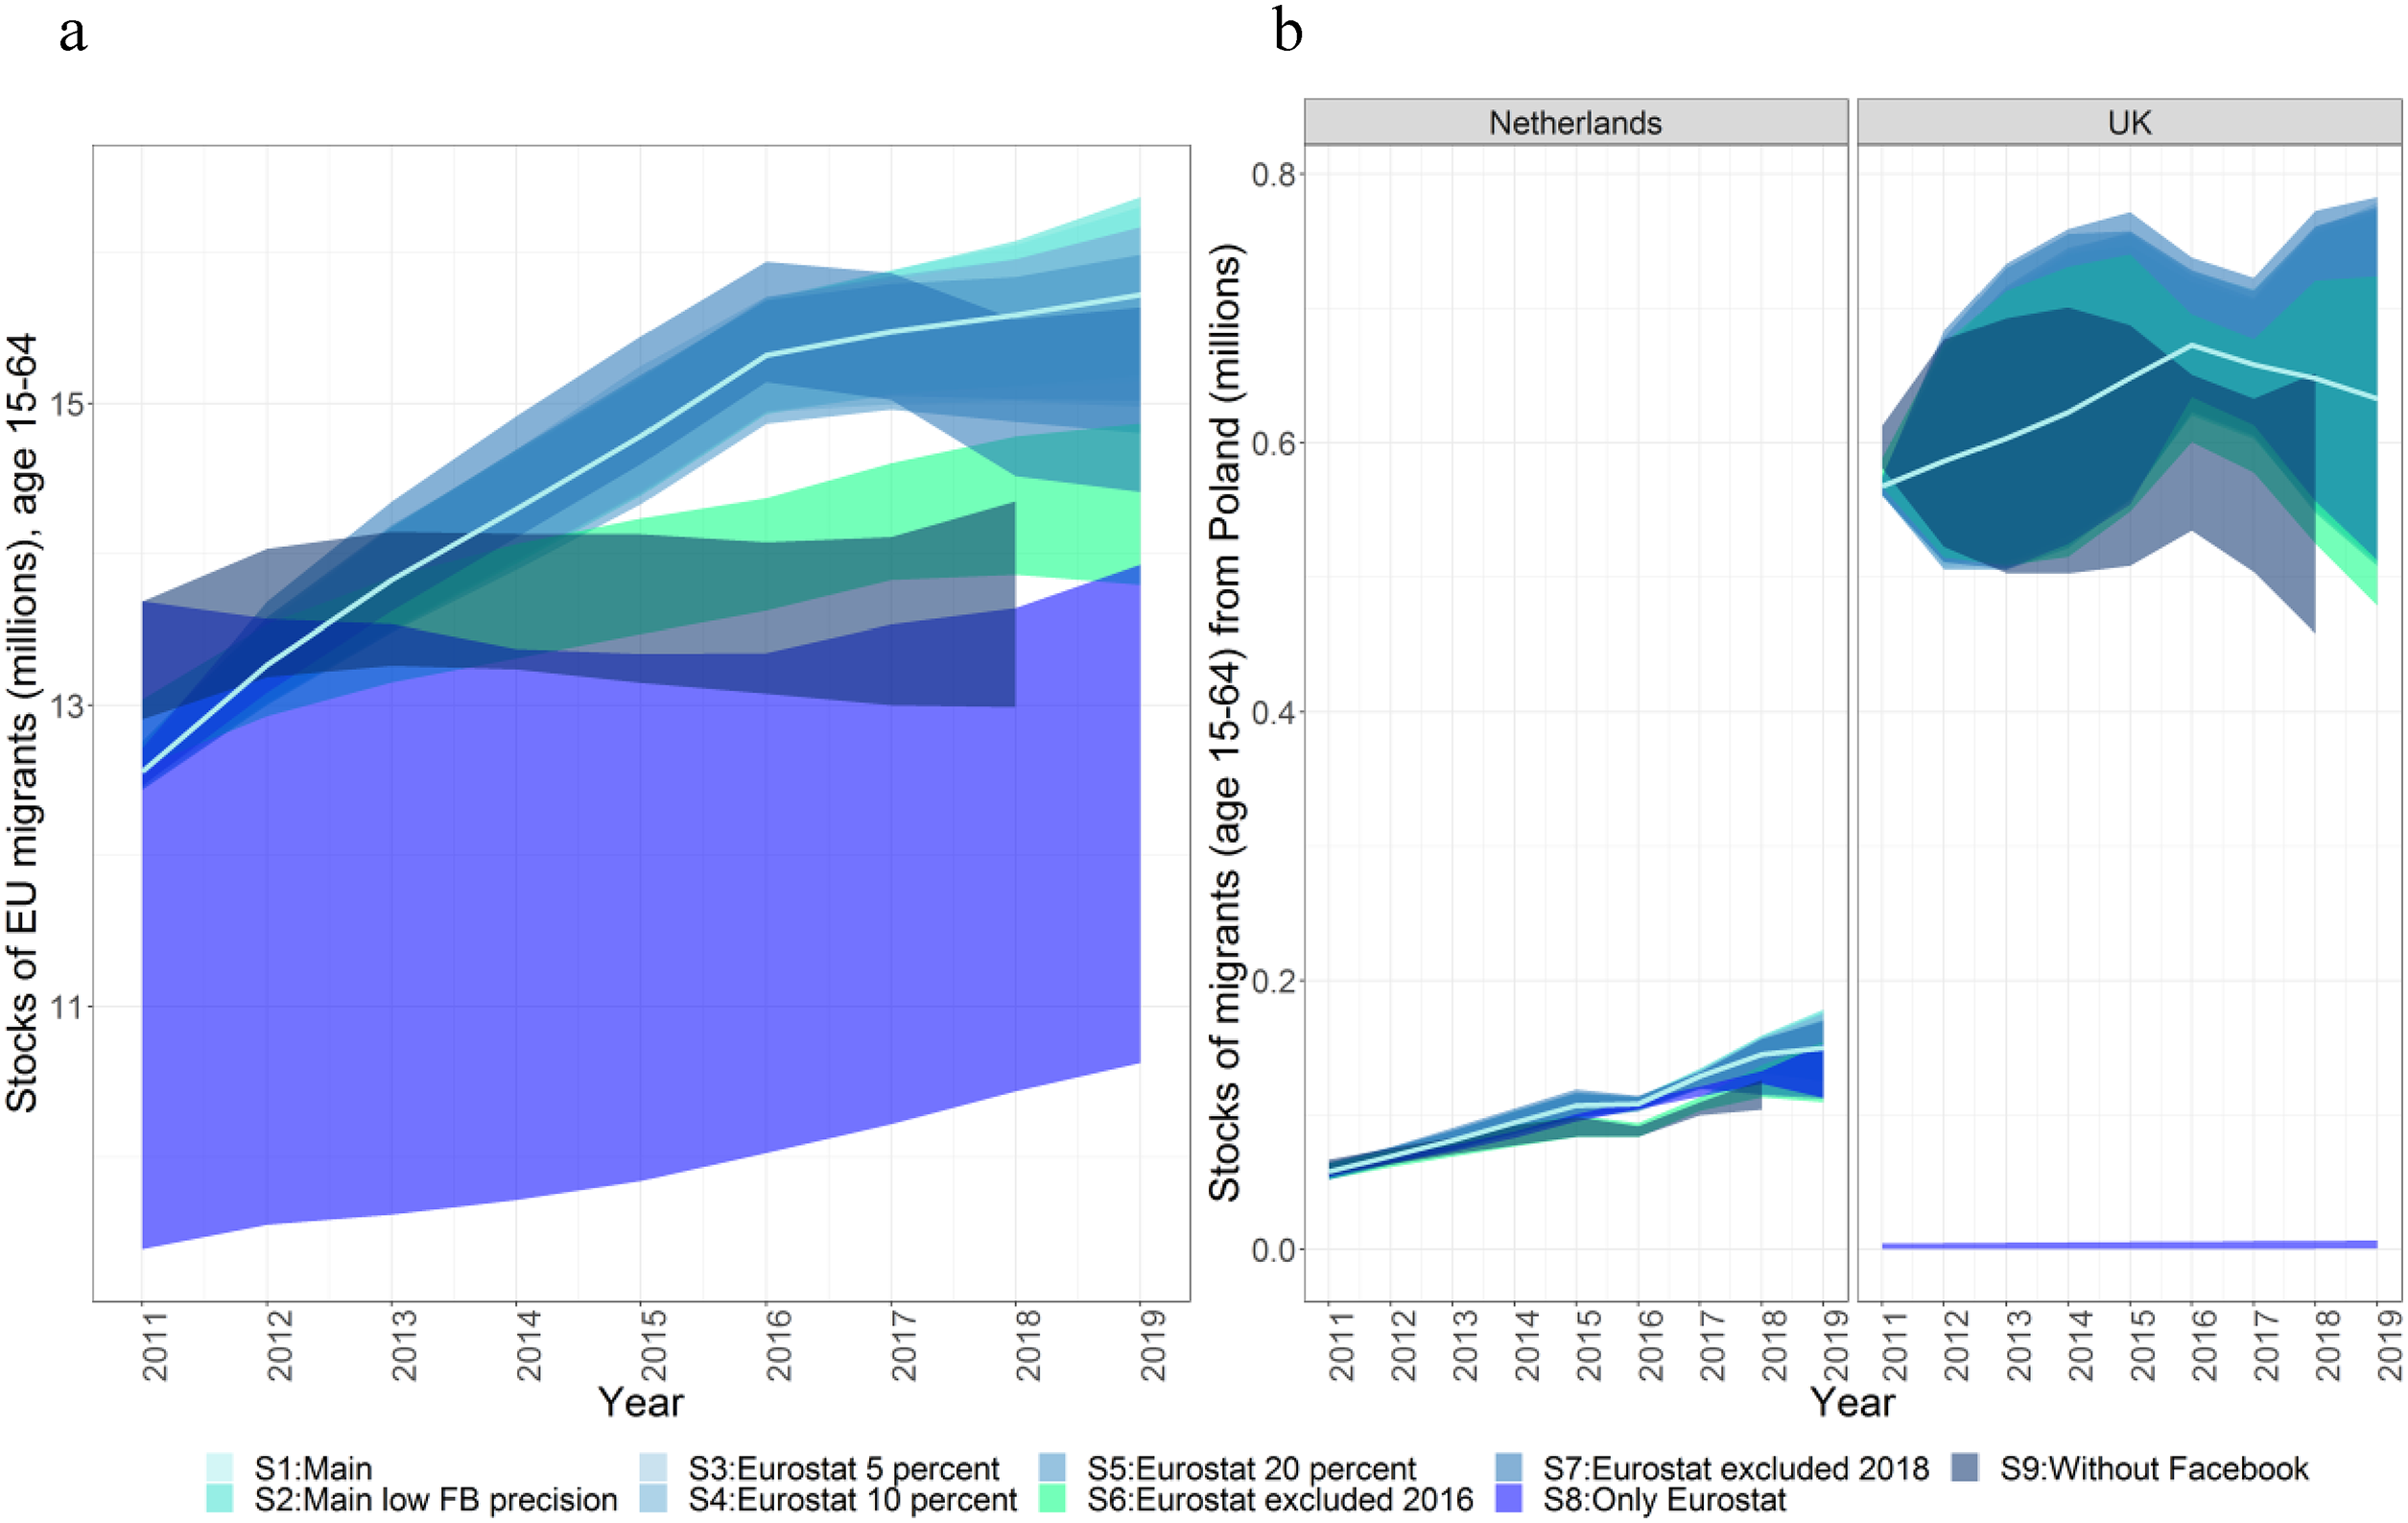
Sensitivity of the results to various modification of the input dataset. Estimated total EU migrant stocks, age 15–64, residing in the EU (a). Stocks of migrants originating in Poland and residing in the Netherlands and in the UK (b).
To better investigate the sensitivity of the models at the origin-destination level, Figure 7 presents Polish migrant population in the Netherlands (panel a on the left of Figure 7) and the United Kingdom (panel b on the right of Figure 7). The migrant stocks from Poland in the Netherlands, as estimated by different sensitivity models all follow a similar trend with relatively narrow 80 percent PIs. The Polish migrant population in the United Kingdom also follows a similar trend between the various sensitivity models, with the exception of the “Only Eurostat” model that estimates dramatically lower migrant stocks due to the lack of Eurostat data for this migrant corridor.
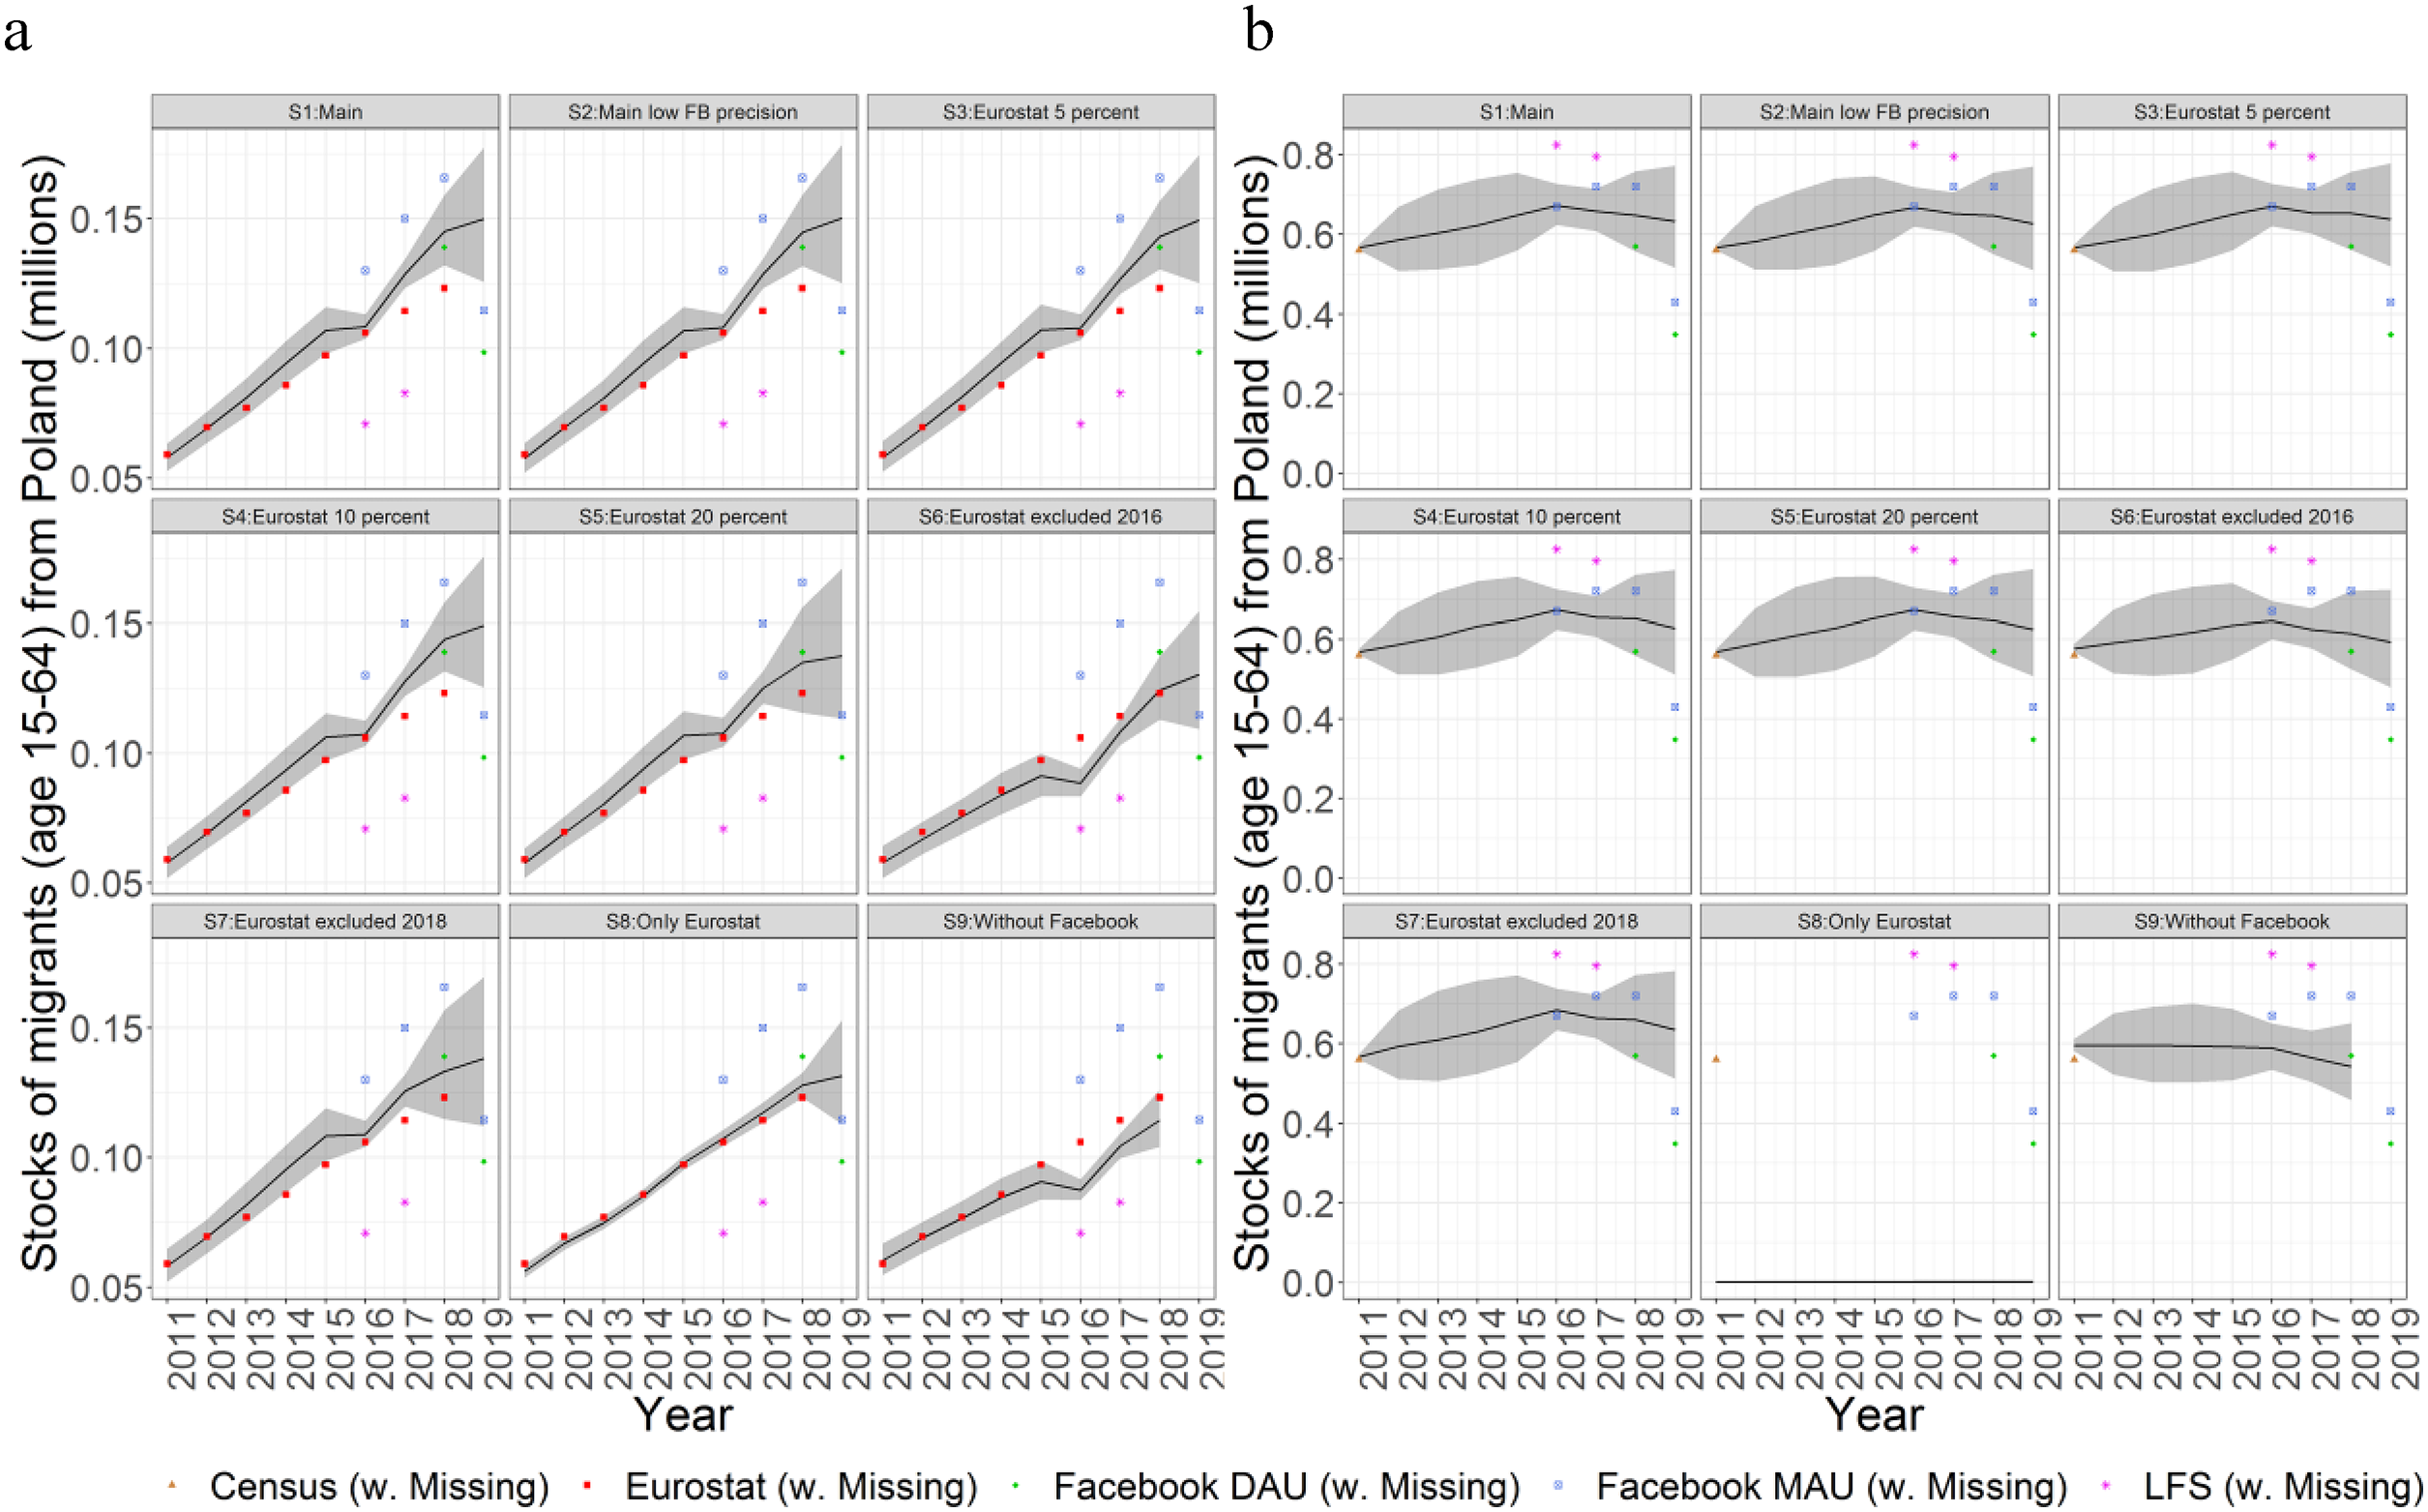
Sensitivity analysis of the results to various modifications of the input data. Stocks of migrants (age 15–64) originating in Poland and (a) Residing in the Netherlands; (b) Residing in the UK.
The two alternative naive specifications of the migration forecasting model (Annex B) do not produce reasonable estimates of migrant stocks (Figure 14 in Annex). From this analysis, we conclude that the hierarchical autoregressive specification adequately captures the temporal patterns and allows imputing such patterns for corridors where data are scarce or unavailable. Further testing of naive and other specifications requires data to be available for more corridors and, ideally, for more years.
Out-of-Sample Performance
To further assess the robustness of our model, we removed last two years of the Eurostat data (2017 and 2018) and then produced out-of-sample predictions of those data. We show the results in Figure 8. We observe that the models systematically overestimate the Eurostat data, especially for smaller stocks; for 2017, 34.4 percent of observations from Eurostat fell within 80 percent PI and for 2018 it 34.2 percent. This is likely a consequence of the slowdown in the increase of migrant stocks that is unable to be captured in the autoregressive model based on data until 2016.
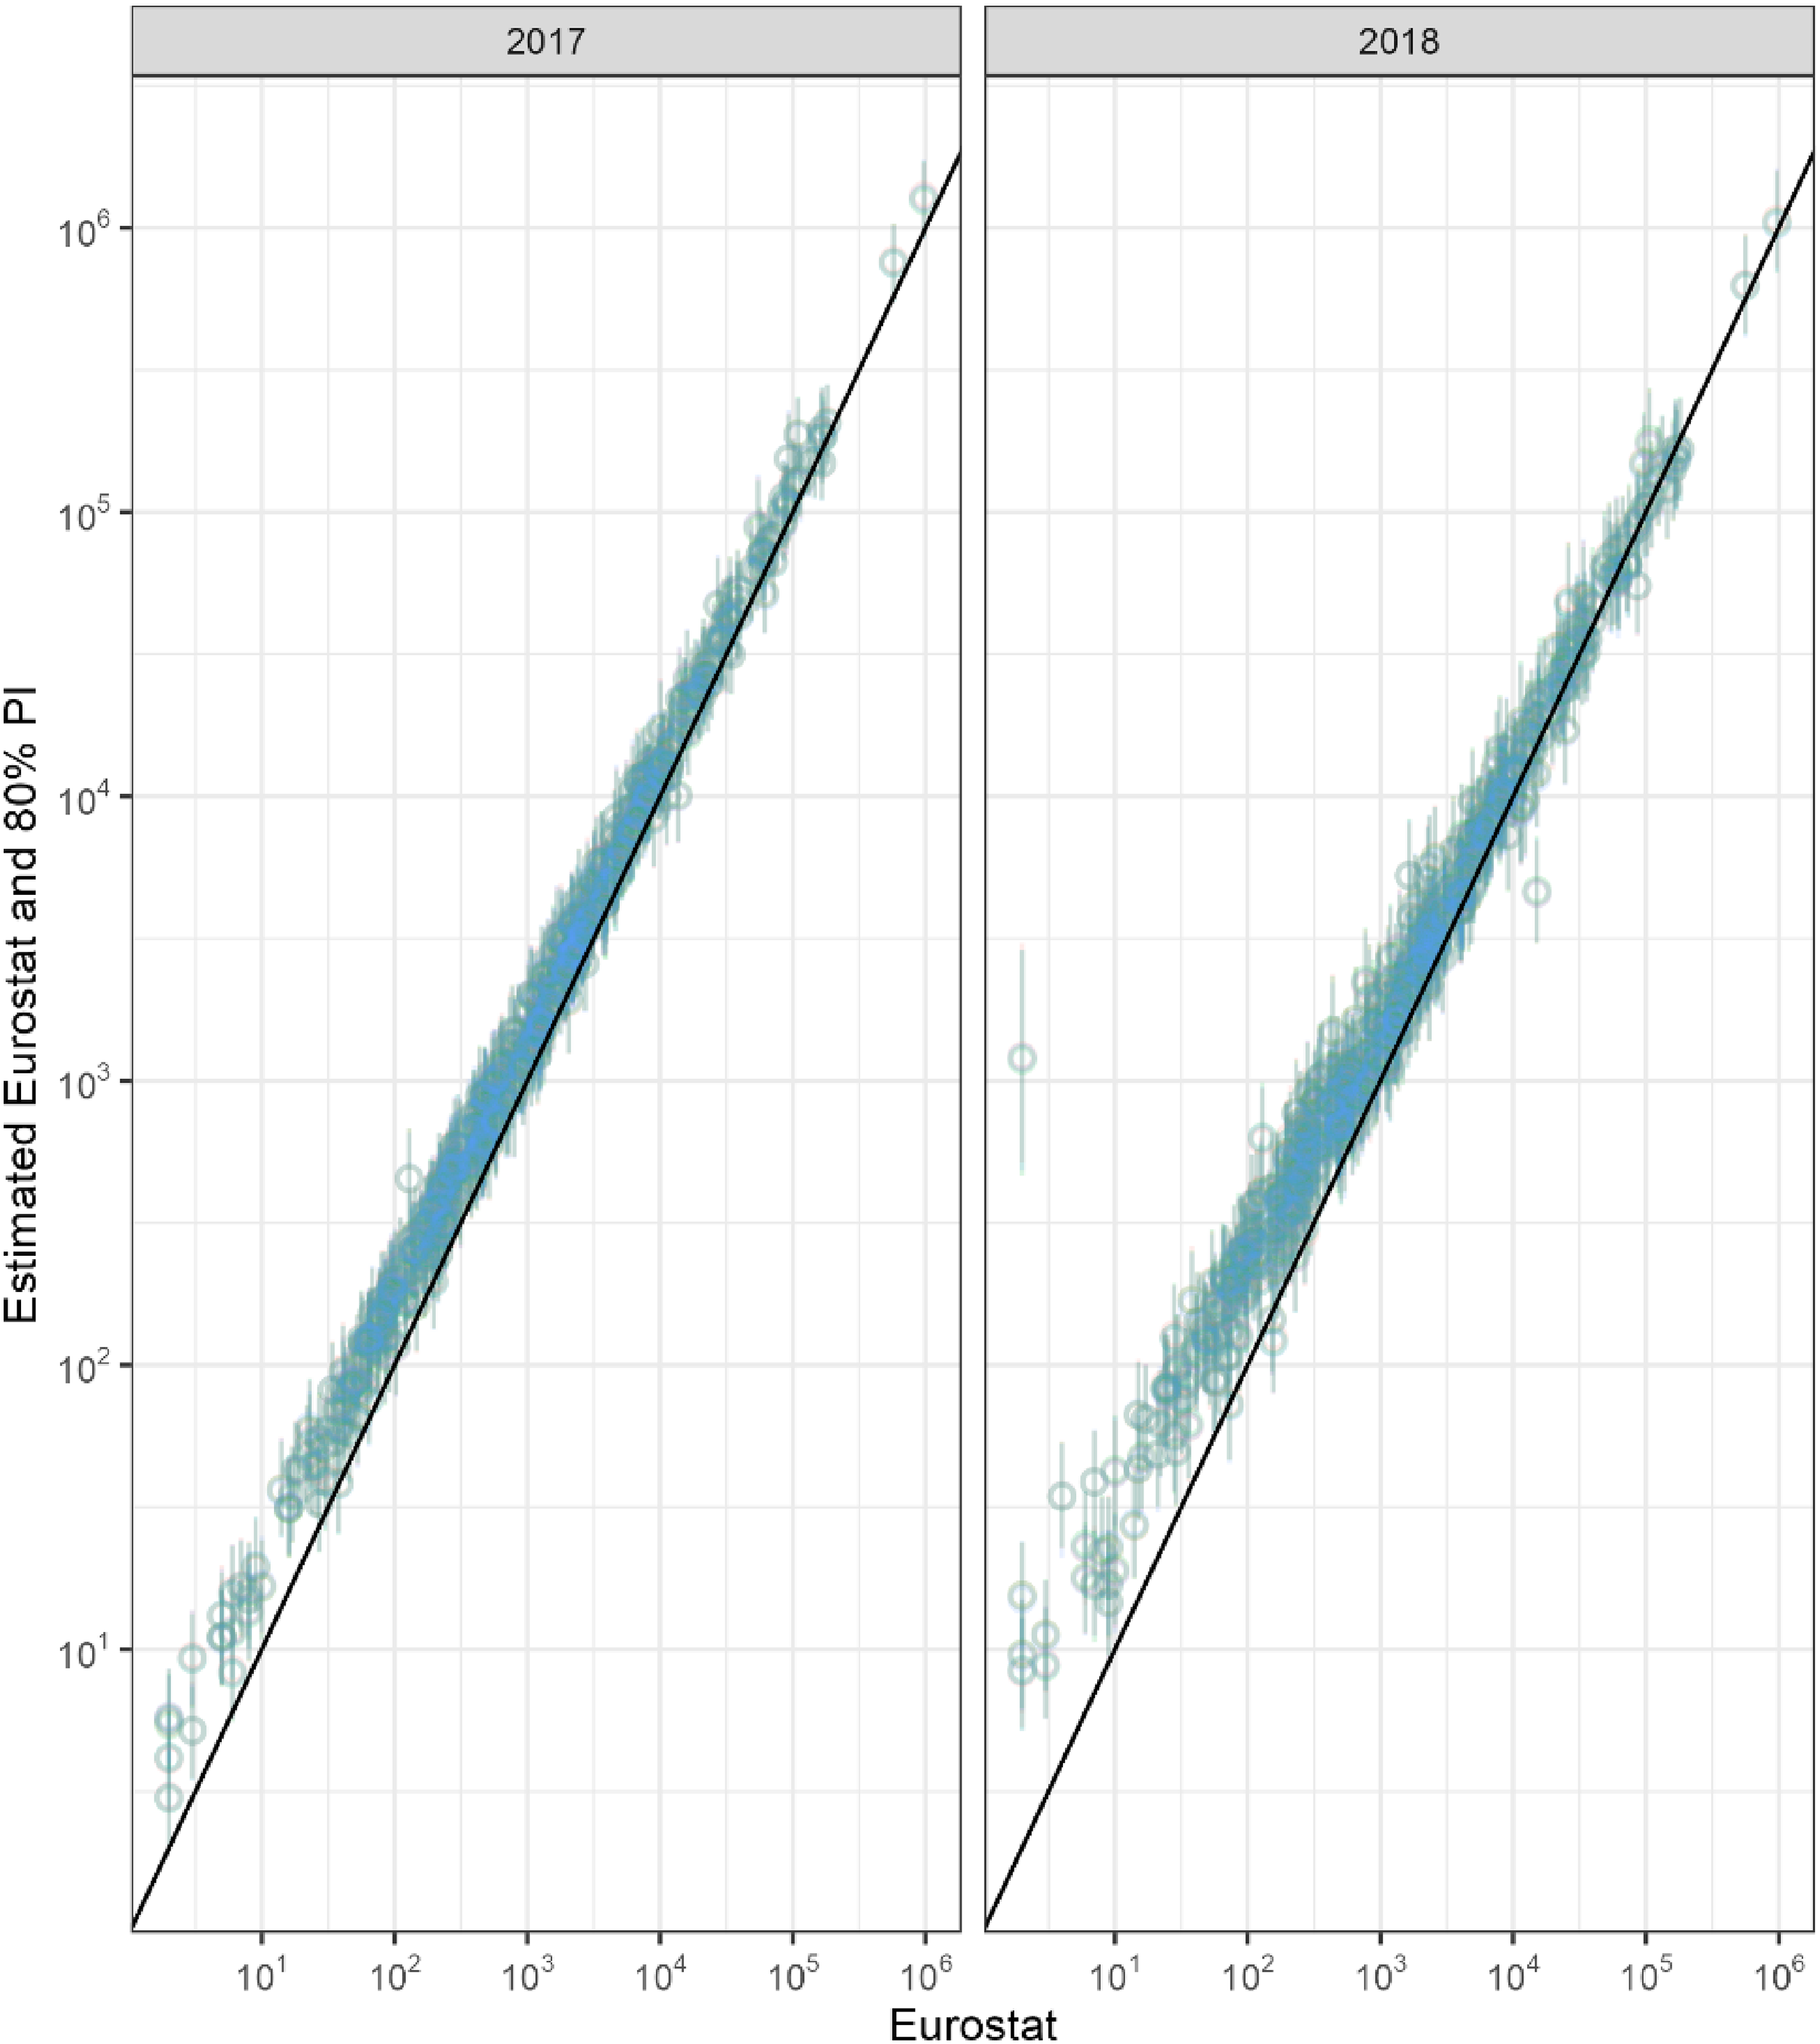
Out-of-sample predictions (Y axis) of the eurostat data (X axis) for 2017 and 2018 that were removed from the model.
Validation
To validate our estimates of annual migrant stocks, we compare them to the official statistics. Specifically, we use the aggregated Eurostat total immigration stocks that reflect the total number of EU migrants in each state without detailed breakdown by country of birth. These data are different from and more complete compared with the Eurostat origin-destination within-EU migrant stocks data that we used in the models. National statistical offices are better able to provide Eurostat with estimates of the total EU migrant populations living in their country, without disaggregation by detailed country of birth where data collection or processing frameworks to publish data on the specific EU country of birth might not be in place. Figure 9 presents a scatterplot of data on total EU migrant populations (15–64) living in another EU country as reported in Eurostat, against the corresponding estimated medians (dots) of the posterior distributions of EU migrant populations with their 80 percent PIs (gray lines) from our main model in every country of residence and year.
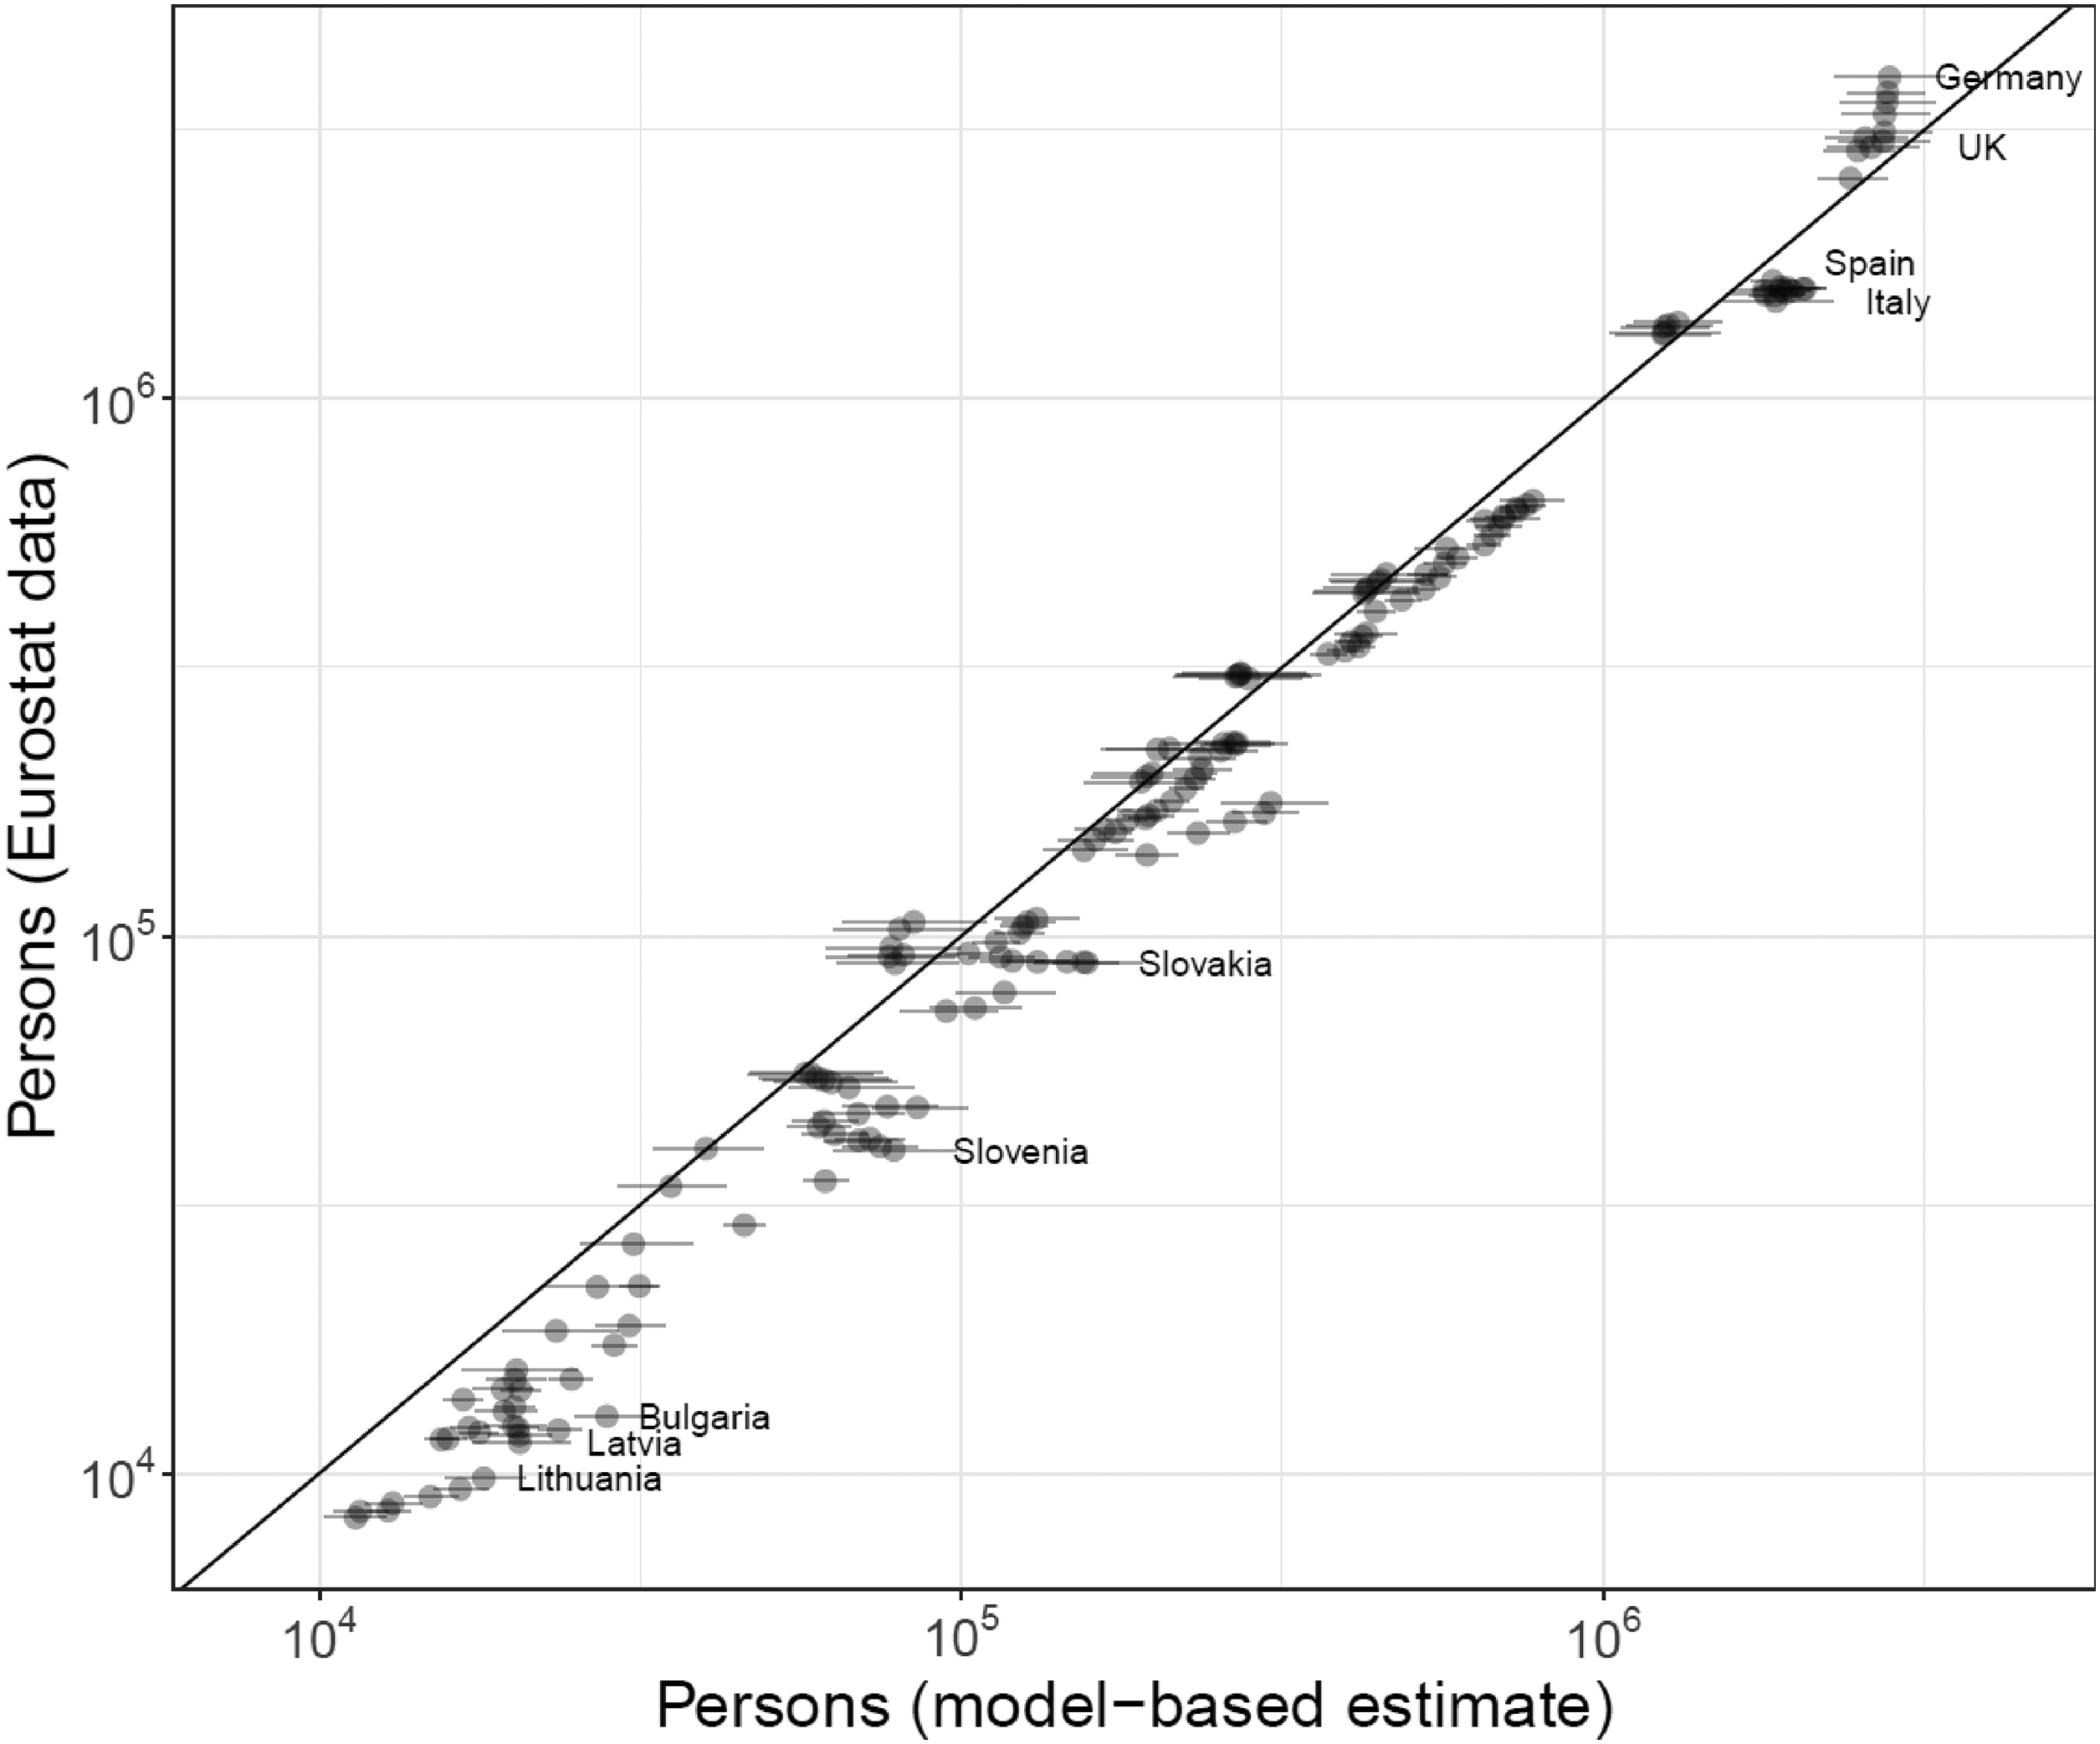
Validation plot comparing the model estimates (X axis) with total EU migrant stocks (age 15–64) reported by Eurostat (Y axis).
Estimates of migrant stocks that are relatively small (up to 1 million persons) in our model are slightly overestimated because our model adjusts for undercounting bias. The largest differences between the observed and estimated EU migrant stocks are noted for smaller countries, such as Latvia and Lithuania, and for countries deemed to have high bias in their migration flows statistics, such as Bulgaria (Dańko et al. 2024). Some discrepancies are also apparent for countries with larger migrant population totals. The EU migrant population totals for Spain and Italy are estimated at around 2 million persons from our model, higher than the reported stocks (around 1.5 million). Our model underestimates EU migrant population in Germany when compared to the corresponding Eurostat totals. This might be a result of the low coverage of Facebook in Germany, in comparison to other EU countries, a feature not fully captured by the bias parameter in our model, where we grouped several countries with low Facebook coverage together.
Discussion
In this article, we developed a modeling framework to combine both traditional and new migration data sources to estimate a complete and harmonized series of EU bilateral migrant populations. As shown in our validation exercise, the resulting estimated migrant stocks match relatively well to the observed data available in the Eurostat database, with some slight overestimation of smaller migrant populations and underestimation for larger migrant populations in Germany and the United Kingdom (though for the latter, the observed values are within the model's predictive intervals). Our model is also capable of estimating missing stocks for migrant corridors and years where no data are available and can provide timely now-casted estimates. The annual bilateral migrant population estimates come with uncertainty measures, where the levels of uncertainty are influenced by the amount and quality of data sources available in a particular migration corridor. In general, we observed the smallest uncertainty in the estimates during 2011, where census data are available.
Our use of data from Facebook provided similar evidence for the inclusion of novel data into studying migration trends and patterns as found in previous studies. For example, Spyratos et al. (2018; 2019) also found that the patterns captured by the Facebook data reflect the stocks of migrants in the EU, with some of the stocks being overestimated. In their analysis, they corrected for the Facebook usage in particular age-sex groups by using population data (Gil-Clavel and Zagheni 2019). Our model corrects for Facebook usage in the population using informative priors, while also integrating official migrant stocks data from administrative sources and censuses, deemed to be the most accurate source of such information. Our model is also similar to the one developed to monitor migrant populations in the United Kingdom (Rampazzo et al. 2021). However, unlike the model by Rampazzo et al. (2021), the prior distributions in our model are less restrictive. For example, we do not use fixed scaling factors because quantities such as Facebook penetration rate are, in principle, unknown, exhibiting variability over time and within countries. We therefore utilize available official data on population totals and total number of Facebook users in countries over years to, for the first time, construct informative prior distributions for the time-specific penetration rates for groups of countries. By assuming such probability distributions to inform these penetration rate parameters, we permit the model to learn from the data about possible ranges for those values and, thus, avoid a false sense of certainty in our estimates. Future work could explore a notion that, at least conceptually, the lower the Facebook penetration, the more biased the sample could be. That is, the smaller the sample the higher the relative oversampling of more mobile users. Potentially, one could construct priors that correct more when the Facebook penetration rate is lower. This approach could also be extended to other population structures, such as age and sex.
Our study to estimate annual EU bilateral migrant populations is not without limitations. First, Facebook data, while timely and available for many years, are not available uniformly for all countries and origin-corridors. This is because Facebook usage varies among countries, as well as subpopulations within countries (e.g., Blank and Lutz 2017). Historic data are also not available, and any new analysis requires collecting new data. This partially limited our work to the population aged 15–64 as the historic data that are publicly available related to this age group. However, this age group refers to the working-age population that typically represents the majority of migrant populations. In principle, Facebook data cover all population aged at least 13 but representativeness decreases with age (Mellon and Prosser 2017; Spyratos et al. 2019). Facebook's algorithm for counting its users and their location history is a “black box”, and prone to sudden and nontransparent changes in the algorithm calculating the number of migrants (e.g., Palotti et al. 2020) or limiting public access. Second, the model relies on input data with large proportions of missingness. Thus, we rely on the informative prior distributions that reflect our literature-based assessment of their quality in terms of potential bias and accuracy. These subjective opinions, as well as the potential for alternative model specifications, may lead to different predicted stocks of migrants. However, as illustrated in our sensitivity analysis, only extreme alternative model specifications led to dramatically different estimates. Third, the model shows a certain degree of sensitivity to the input data. For example, if data from Facebook are left out, the resulting estimates are heavily affected by the completely missing patterns in the other official sources. This limitation could potentially be mitigated to some extent by using a predictive model based on migration theories and external data, such as those used by Jennissen (2003), Abel (2010), and Raymer et al. (2013), at the cost of additional layers of modeling complexities. A model driven by migration theories, such as extended gravity-type models that utilize push and pull factors (Cohen et al. 2008; Van Hear, Bakewell and Long 2018), would also require timely data or scenarios for predictors to forecast migrant stocks.
There are a number of potential avenues of future research for the estimation of migrant populations in the EU. In our analysis, we used data that we downloaded from the Facebook Advertising Platform API at set of discrete time points during recent years. We collected data on a regular basis, for example, twice a month several times a year, then averaged them for each year (Gendronneau et al. 2019). A continuous systematic collection of data from Facebook stored in a publicly available repository would potentially allow further updates of the model or the application of the model to other regions (Culora et al. 2021). This would allow for a longer time series of data, providing more overlap with the reported data from traditional migration data sources, and hence leading to much greater precision in estimates from an integrated model. As Facebook data can be collected with a higher frequency, say, quarterly or monthly, it is also possible to extend the model to produce a continuous early-warning or monitoring system of migrant stocks. Further, Facebook data on migrant populations can be broken down by both age and sex (e.g., Spyratos et al. 2018), which can be utilized to provide estimates of migrant populations with these additional demographic details by, for example, extending modeling frameworks using smoothing approaches such as bilinear models, as proposed by Alexander, Polimis and Zagheni (2022) and Raymer and Wiśniowski (2018). Preliminary analysis in carrying out such an approach was heavily restricted by the censoring of relatively small counts of “expats” at 1,000 in the Facebook data (Gendronneau et al. 2019). This limitation could be overcome by using more sophisticated methods of calculating stocks from Facebook (Gendronneau et al. 2019, Box 2).
Social media data are a rich source of timely information on population movements. The Facebook Advertising Platform provides proxy information on bilateral migrant stocks in the EU that are of limited use for studying migrant population patterns when used in isolation due to the distinct nature of the user population. To overcome this limitation, we have developed a statistical model to integrate data derived from Facebook with the publicly available official data on migrant stocks within the EU. We correct for the biases specific to each source and their varying accuracy, to generate a complete set of annual bilateral migrant population estimates with uncertainty that provide useful and timely information on potential changes in the migration patterns.
Data Statement
Data collection was performed in strict compliance with the terms of services of the data sources from which data were obtained. The data from Facebook are openly available through Facebook's Marketing API (https://developers.facebook.com/docs/marketing-apis). However, due to legal requirements regarding the publication of the raw data collected from the Facebook Advertising Platform, the minimal data underlying the results of this study are available for academic purposes upon request. The LFS were obtained via a request to Eurostat (https://ec.europa.eu/eurostat/xtnetassist/requestlist.htm). Data on population and migrant stocks (variables migr_pop3ctb, demo_pjangroup, cens_11cob_n) were obtained from publicly open Eurostat database (https://ec.europa.eu/eurostat/data/database). All the measures derived from the Facebook data and the code to analyze the data sets and generate the figures are available from a GitHub repository (https://github.com/a-wis/integrating-migrant-stocks). The repository also includes an example code for collecting Facebook data. 6
Supplemental Material
sj-pdf-1-mrx-10.1177_01979183241249969 - Supplemental material for Integrating Traditional and Social Media Data to Predict Bilateral Migrant Stocks in the European Union
Supplemental material, sj-pdf-1-mrx-10.1177_01979183241249969 for Integrating Traditional and Social Media Data to Predict Bilateral Migrant Stocks in the European Union by Dilek Yildiz, Arkadiusz Wiśniowski, Guy J. Abel, Ingmar Weber, Emilio Zagheni, Cloé Gendronneau and Stijn Hoorens in International Migration Review
Footnotes
Acknowledgments
AW, DY, and GA gratefully acknowledge funding received from the European Union's Horizon 2020 research and innovation programme under grant agreement no. 870649, the project Future Migration Scenarios for Europe (FUME). All authors acknowledge funding received from the European Commission grant VT/2017/020 in the project Measuring Migration using Big Data.
Declaration of Conflicting Interests
The author(s) declared no potential conflicts of interest with respect to the research, authorship, and/or publication of this article.
Funding
The author(s) disclosed receipt of the following financial support for the research, authorship, and/or publication of this article: This work was supported by the H2020 Societal Challenges, (grant number 870649) and by the European Commission grant VT/2017/020.
Supplemental Material
Supplemental material for this article is available online.
Notes
References
Supplementary Material
Please find the following supplemental material available below.
For Open Access articles published under a Creative Commons License, all supplemental material carries the same license as the article it is associated with.
For non-Open Access articles published, all supplemental material carries a non-exclusive license, and permission requests for re-use of supplemental material or any part of supplemental material shall be sent directly to the copyright owner as specified in the copyright notice associated with the article.