
Abstract
Characterizing the expression of novel targets in normal and diseased tissues is a fundamental component of a target validation data package. Often these targets are presented to the pathology team for assessment with bulk or single-cell RNAseq data and limited to no spatial tissue expression data. In situ hybridization to detect mRNA (RNAscope) is a valuable tool to (1) identify cells that may express the target protein and to corroborate protein expression during immunohistochemical (IHC) assay development or (2) to use as surrogate for single-cell expression IHC when antibodies are not available. Chromogenic RNAscope in situ hybridization (CISH) can be performed on frozen or formalin-fixed, paraffin-embedded (FFPE) tissues. This CISH workflow starts with RNA qualification of the tissue (to assess RNA integrity) by measuring the expression of housekeeping genes. RNA-qualified tissues then undergo CISH for the target in question, and positive CISH signals are quantified in VisioPharm by a combination of color deconvolution, size gating, and dot density thresholding. This RNA workflow can complement IHC or standalone in target validation for spatial characterization of novel targets.
Introduction
Nonclinical validation of novel drug discovery targets is typically a compilation of data from normal and diseased tissues including bulk tissue and single-cell sequencing, in situ hybridization (ISH), immunohistochemistry (IHC), bulk tissue protein expression, and in vitro and in vivo assays that assess biologic activity and therapeutic effect.7,13,14,16,19 Expression and spatial localization of targets in normal and diseased tissues are key for understanding target distribution, abundance, prevalence, and identifying potential safety risks. Chromogenic or sometimes fluorescent ISH and IHC are standard methods that pathology teams use to characterize DNA or mRNA and protein expression, respectively.8,11,21,22 In situ hybridization is highly sensitive and specific, so incorporating chromogenic or fluorescent ISH into standard IHC assay development is a valuable tool for assay validation of novel targets and spatial characterization of target expression at the cellular level. Here we detail the incorporation of Advanced Cell Diagnostics, Bio-techne Brand (Newark, CA) chromogenic RNAscope in situ hybridization (CISH, commercialized as RNAscope) into a target validation workflow.
Single molecule mRNA detection by RNAscope uses a double Z-probe strategy. This technology has been thoroughly described elsewhere;1,2,15,24 briefly, each Z-probe is an oligonucleotide that contains three main elements: an annealing sequence of 18 to 25 bases that are complementary to the target RNA, a nonbinding spacer sequence, and a 14-base tail. The Z-probe pairs hybridize to a continuous 50 base target region. The two tails form a 28-base hybridization site for the preamplifier molecule, which has 20 binding sites for the amplifier molecules, which in turn has 20 binding sites for the label probe (Figure 1). 24 The double Z-probe design increases sensitivity, selectivity, and allows for detection of partially degraded RNA. 24 That said, successful RNA detection requires that RNA integrity is sufficient for probe binding. RNA-qualified tissues have been tested to confirm sufficient RNA integrity to permit signal detection. Therefore, preanalytical test tissue selection should include rigorous quality assessment of RNA integrity using widely expressed housekeeping genes, with additional care taken when quantitative techniques are to be applied.
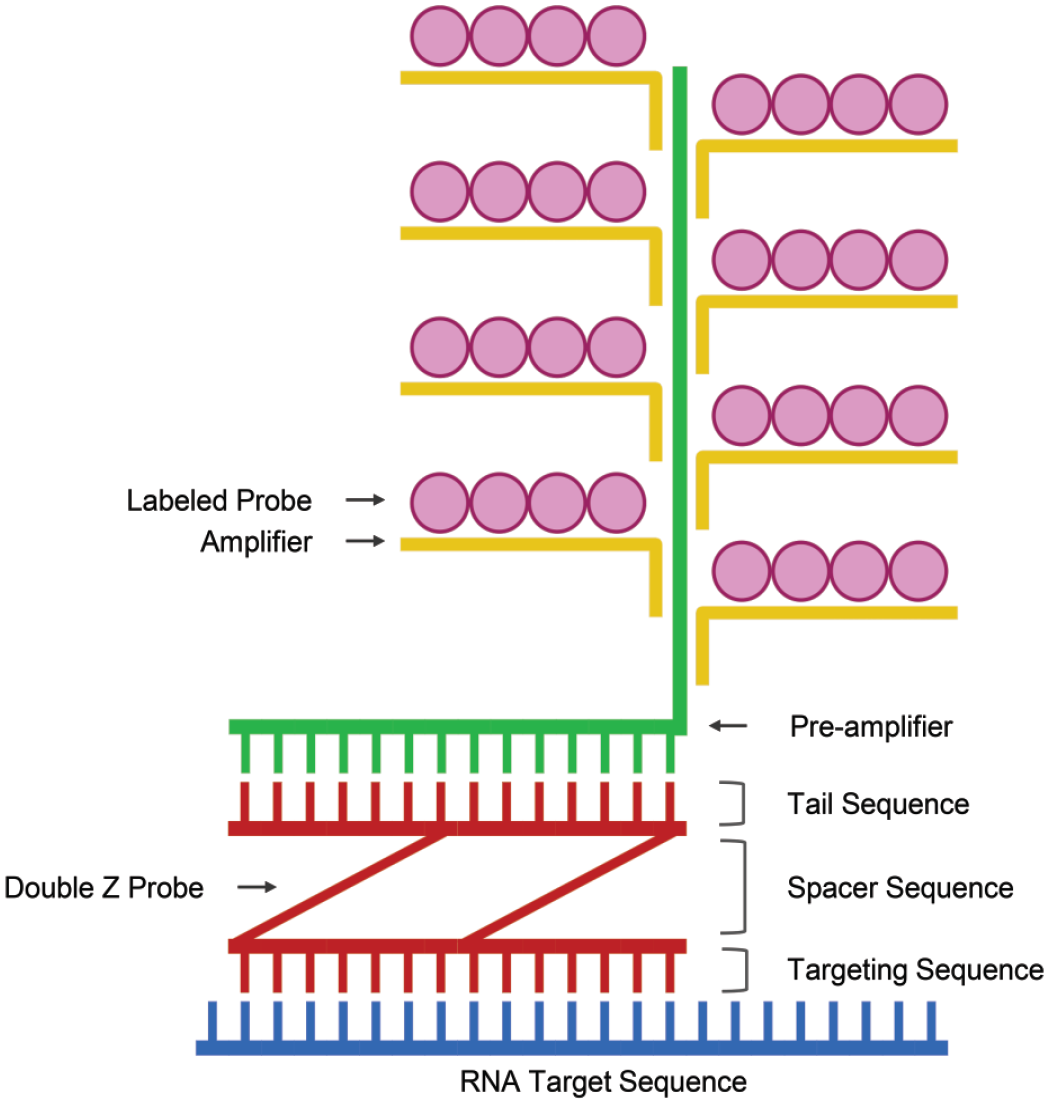
Double-Z target-specific probe hybridizes to the RNA target of interest. Preamplifiers with complementary bases hybridize to double-Z probe binding site, followed by multiple amplifiers. Labeled probes, either fluorescent or chromogen, bind to each amplifier at numerous binding sites to produce a signal. Created with BioRender.com.
This article briefly reviews the use of CISH in a standard biomedical product discovery and development workflow. The application of CISH is described as it applies to IHC validation and as a standalone (substitute for IHC) for target verification when no suitable antibodies are available for IHC. Approaches are given for qualitative and quantitative assessment of CISH signals in target tissues.
CISH Methods
Human formalin-fixed, paraffin-embedded (FFPE) tissue used in the following examples was procured from commercial vendors and information regarding fixation and processing were not available. For CISH studies, cell pellet arrays and tissue slides were sectioned at 5 µm and mounted on positively charged slides. Human cell lines endogenously expressing a target were harvested and fixed in 10% neutral buffered formalin (NBF) for 24 hours and processed into FFPE cell pellet blocks. Chromogenic RNAscope in situ hybridization was performed within a 2-week period of sectioning to avoid any message degradation while exposed to air and humidity. Advanced Cell Diagnostics (ACD) RNAscope VS Universal AP Reagent Kit (catalog 323250) in Alkaline Phosphatase (AP) red chromogen was used to perform CISH on the FFPE slides for this study. The RNAscope 2.5 VS probe for Homo sapiens peptidylprolyl isomerase B (cyclophilin B) (PPIB) (catalog 313909), was used as a positive control to evaluate RNA quality and dihydrodipicolinate reductase (dapB) (catalog 312039) was used as a negative control. In the examples below, target probes were generated for known tumor antigens 17 and procured through ACD’s list of catalog probes available on their website. The CISH staining was performed on the DISCOVERY ULTRA instrument from Roche Tissue Diagnostics (Oro Valley, AZ). The workflow requires the following reagents from Roche Tissue Diagnostics: mRNA RED Detection Kit (catalog 760-234), mRNA Sample Prep Kit (catalog 760-248), mRNA RED Probe Amplification Kit (760-236), and 250 Test Probe Dispenser User-Fillables 1-25 (catalog 960-761 – 960-785). The protocol followed ACD’s guidelines provided in their RNAscopeTM VS Universal AP Assay (Document Number 323250-USM-ULT). Dewax (provided in the mRNA Sample Prep Kit) is performed on the FFPE slides for 4 minutes. Then slides undergo target retrieval (provided in the mRNA Sample Prep Kit) at 97°C for 24 minutes while cell pellets are treated for 16 minutes and washed in Roche Tissue Diagnostics’ Reaction Buffer (950-300) before ACD Inhibitor Red (provided by Roche Tissue Diagnostics, 760-234) and mRNA Protease (ACD, 323250). Slides are then rinsed in SSC buffer (Roche Tissue Diagnostics, 950-110) before the appropriate mRNA probes are applied and incubated for 2 hours. After probe hybridization, slides go through the series of hybridization steps per ACD’s protocol with washes of reaction buffer between each amplification (AMP 1-7) step and AP Red Chromogen is applied to the slides using Roche Tissue Diagnostics’ DISCOVERY mRNA RED Detection Kit RUO (760-234). Counterstain is applied using ACD’s hematoxylin (760-234) and blueing reagent (760-23) before slides are mounted with EcoMount Mounting Medium (EM897L) from Biocare Medical (Pacheco, CA).
All IHC staining procedures were conducted on the Leica Bond RX autostainer (Leica Biosystems, Deer Park, IL) using the Bond Polymer Refine Detection Kit (catalog DS9800). Formalin-fixed, paraffin-embedded cell pellet arrays and tissue sections at 5 μm were deparaffinized and underwent heat-induced antigen retrieval for 20 minutes with the Leica Epitope Retrieval Solution 2 (AR9640, Leica Biosystems). The slides were then incubated with mouse anti-pan Cytokeratin (Abcam, ab215838, 0.5 ug/ml) for 15 minutes at room temperature.
Whole slide images (WSIs) of CISH and IHC were acquired using a Leica Biosystems’ Aperio AT2 slide scanner at 400× magnification.
Assessing RNA Integrity
RNAscope double Z-probe technology allows for the detection of partially degraded RNA. However, RNA integrity must be confirmed on the FFPE tissues prior to screening for the target of interest. The RNAscope manufacturer, ACD recommends, using one of the following widely expressed housekeeping genes as positive probes to assess RNA integrity: ubiquitin C (UBC); peptidylprolyl isomerase B, also known as cyclophilin B (PPIB); or polymerase (RNA) II (DNA-directed) polypeptide A (POLR2A). Positive probes are chosen based on known prevalence of that housekeeping gene in the tissue of interest. Ubiquitin C is used for genes with high (>20 copies/cell) or moderate (10-30 copies/cell) expression. Peptidylprolyl isomerase B is used for genes with moderate expression levels POLRA is used for genes with low expression (3-15 copies/cell). 6 Negative control probes are designed for Dihydrodipicolinate B. subtilis reductase (dapB), a bacterial gene that should not be present in human samples. 6 The dapB-negative control probe assesses background staining and would have a score of 0 for no staining or have less than 1 dot per 10 cells, which is acceptable per ACD’s guidelines in RNAscopeTM VS Universal AP Assay User Manual (Document Number 323250-USM-ULT). Samples with a score higher than 0 for dapB are excluded from the analysis.
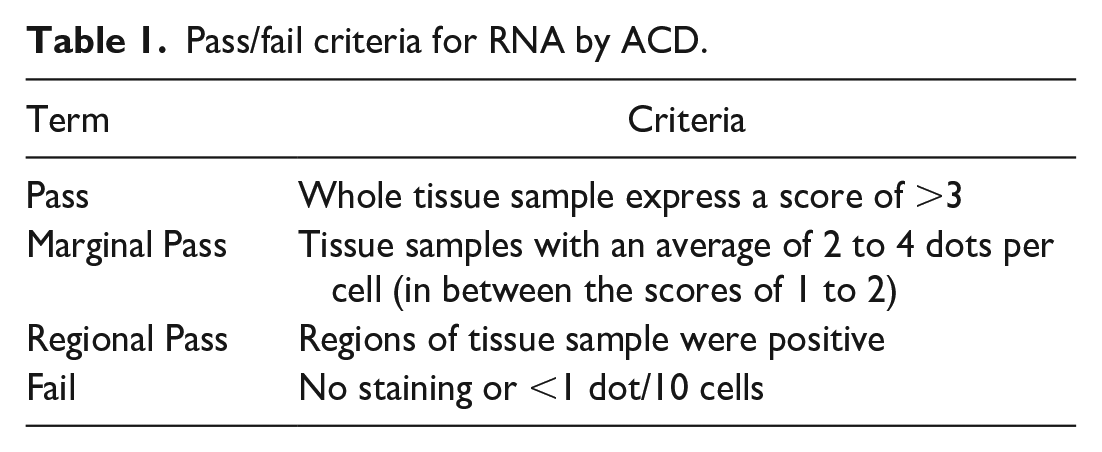
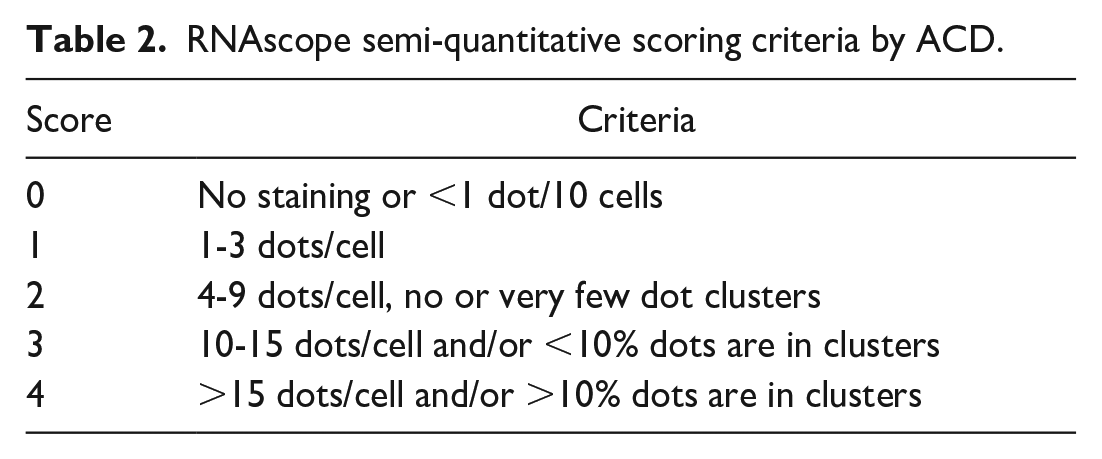
Tissue examples in this manuscript were screened for RNA integrity with PPIB. Chromogenic RNAscope in situ hybridization is performed for the housekeeping gene, and the tissue is manually scored as pass, marginal pass, regional pass, or fail based on the presence and density of the CISH dots within the test tissue. Standards for these categories have been published by ACD 24 and are shown in Table 1. Samples that pass have expression with ≥4 dots/cell in all cells. Marginal pass is ≤2 to 4 dots per cell on average. A regional pass is tissue with areas of positivity and other areas that fail or only marginal pass. A tissue that fails RNA quality testing has <1 dot/10 cells (Figure 2). Advanced Cell Diagnostics criteria for semiquantitative scoring of dot density/cell are shown in Table 2. In the quantitative image analysis workflow, the PPIB signal is used as a mask to ensure that only tissue with adequate RNA quality is included in the analysis. This is important because including tissue that does not have adequate RNA integrity will lead to false negative results and can contribute to a misinterpretation skewed toward underestimating the prevalence of a target.
Pass/fail criteria for RNA by ACD.
RNAscope semi-quantitative scoring criteria by ACD.
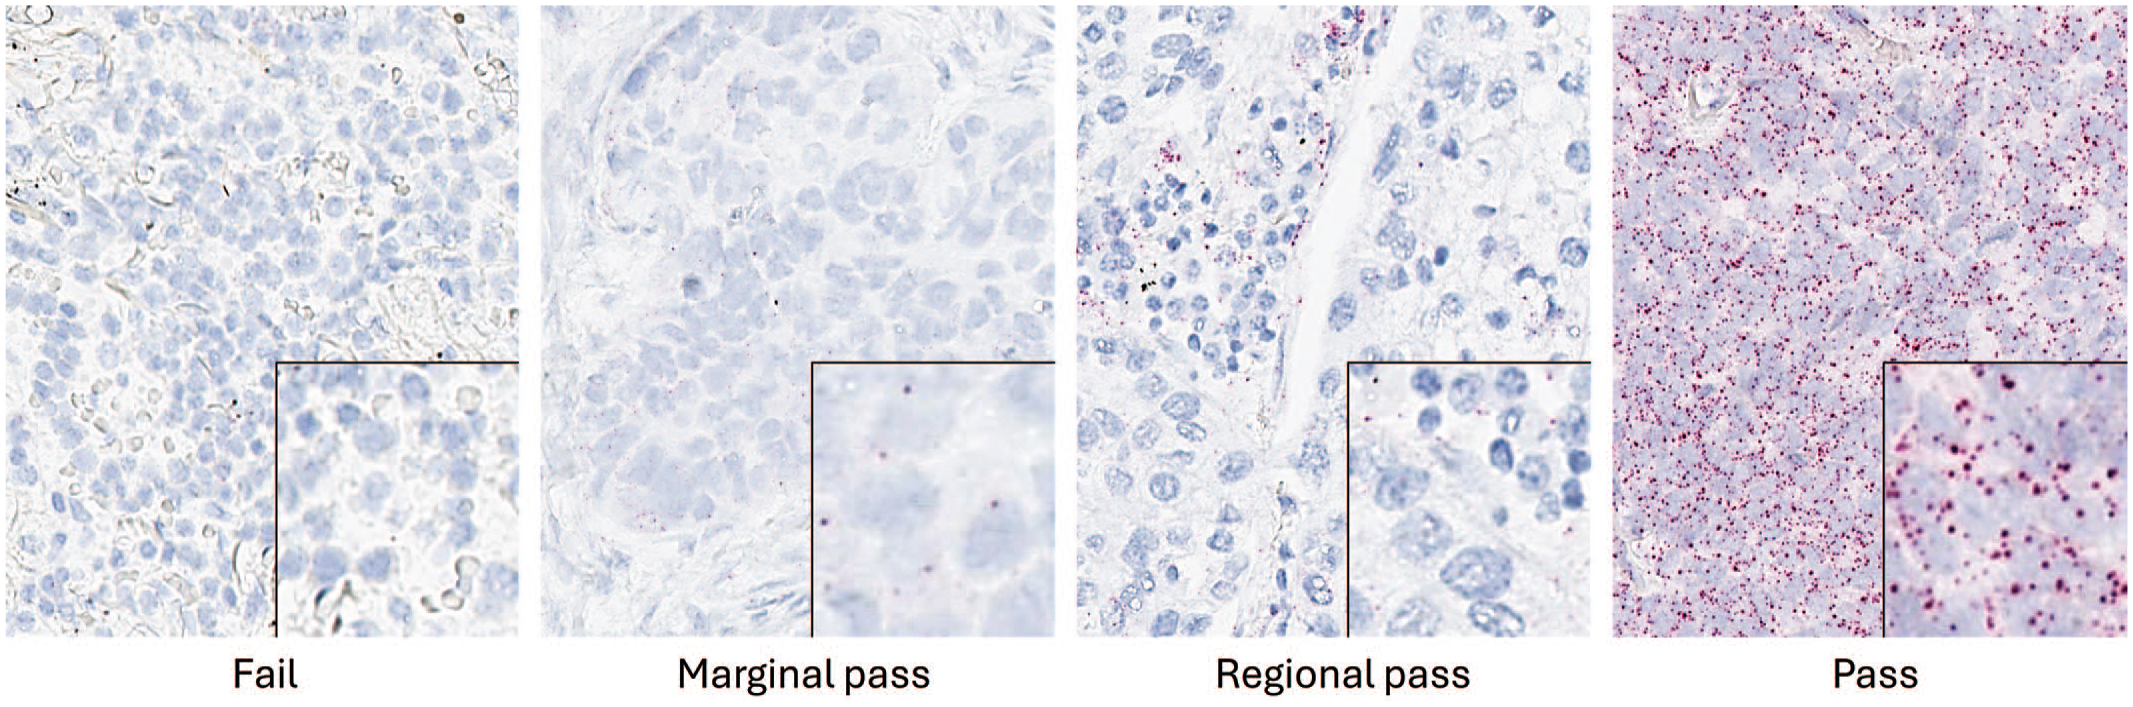
Housekeeping genes, in this case PPIB, are used to assess RNA quality. Examples of pass/fail samples based on criteria listed in Table 1. CISH signal is indicated by red dots in the cytoplasm and/or nucleus. Hematoxylin counterstain.
Incorporation of CISH in Target Validation Workflow
Expression of the target of interest in normal and diseased tissues is an integral component of target validation. Tissue expression, spatial localization, and prevalence of the target are key data points that influence early decision-making, disease indication selection, and identification of potential safety risks. Immunohistochemistry is the assay most commonly used by pathology laboratories asked to provide data on target protein expression. However, developing an IHC assay for a novel target can be challenging when little is known about the target and sequencing data (bulk and/or single cell) is all that is available. Incorporation of CISH into the target validation workflow provides a way to identify mRNA for proteins of interest at a single-cell level and confirm specificity of antibody labeling in tissue (Figure 3). Chromogenic RNAscope in situ hybridization can also be used as a surrogate (standalone expression method) when IHC antibodies are not available for a particular species or protein of interest.
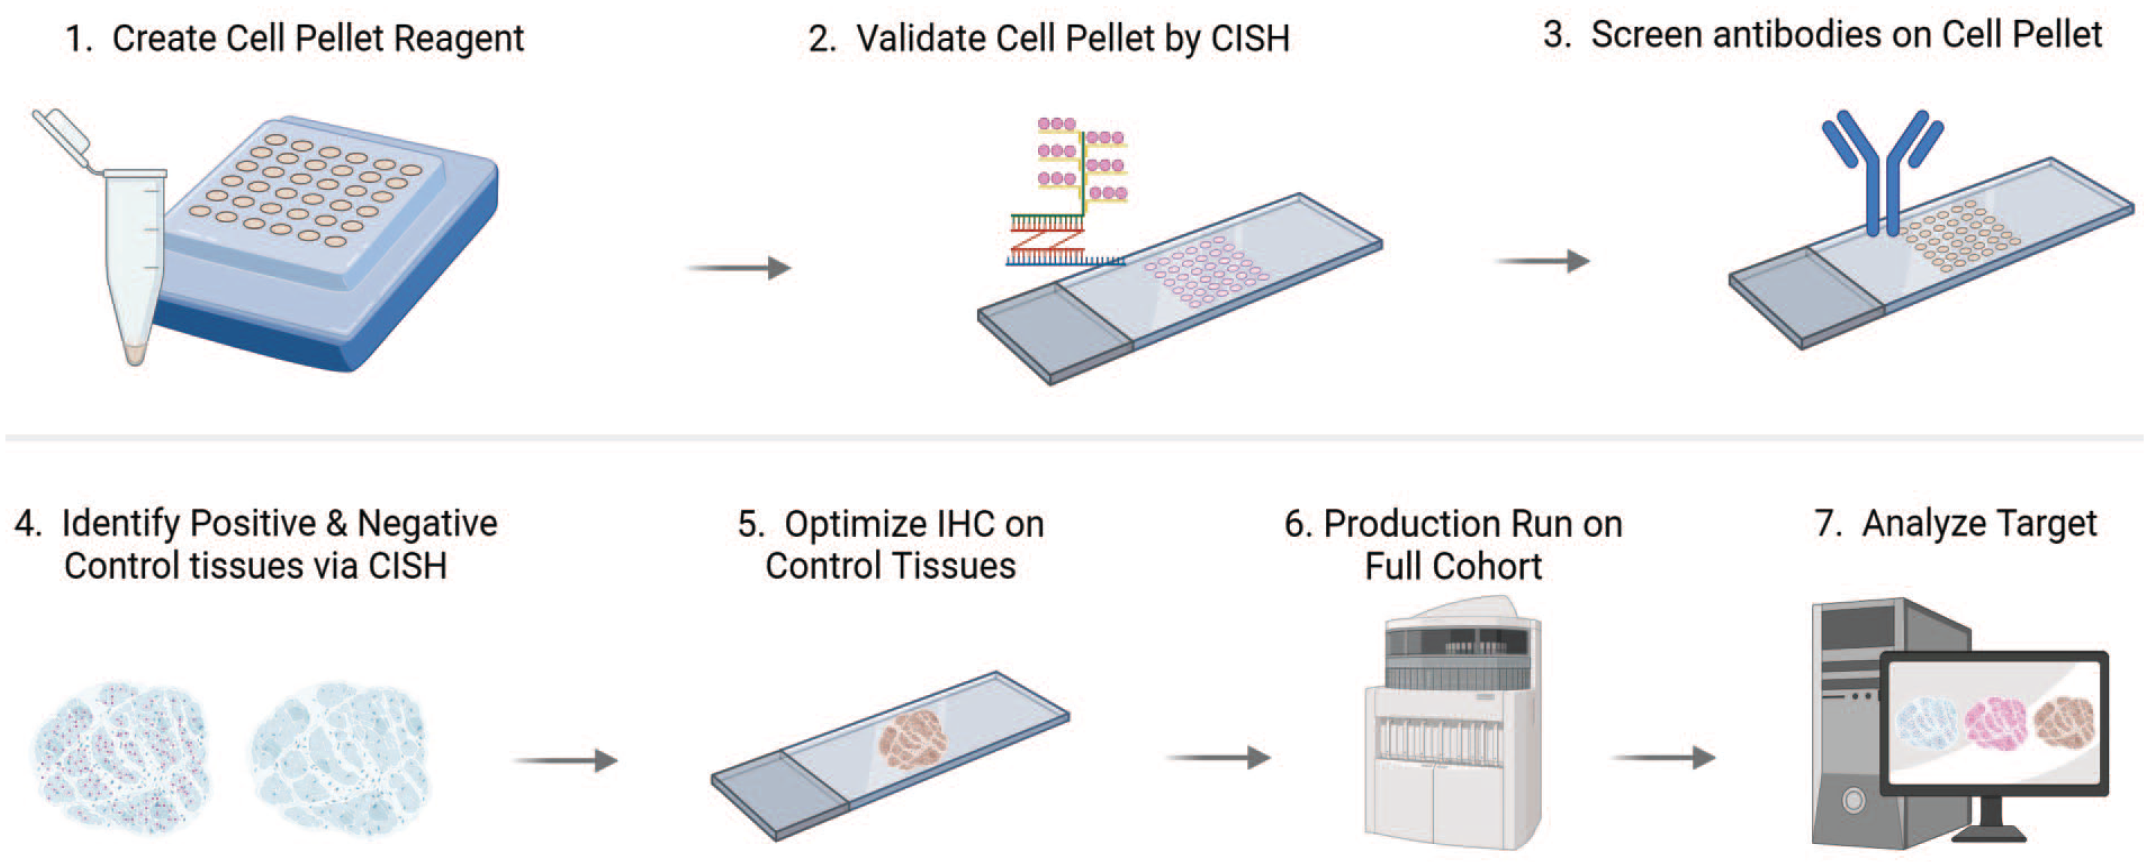
CISH incorporation into IHC validation workflow. An array of cell pellets representing a range of target expression are arranged in an FFPE block. Target expression is confirmed and validated by CISH then IHC antibodies are tested. Once a working antibody is identified, the CISH followed by IHC is repeated in control tissue samples to optimize the IHC assay. After optimization, the IHC is run on the cohort of interest and the results are analyzed.
The first steps for both CISH and IHC assay development employ the use of multiple cell pellets to define a means for quantifying target expression (Figure 4). In our lab’s standard practice, cell pellet arrays are created where each pellet contains cells with a different but known copy number to develop a standard curve that permits gene quantification; such curves are capable of probing over-expression, endogenous expression, medium expression, low expression, reduced (knocked-down or knocked-out) expression, and endogenously negative states. Chromogenic RNAscope in situ hybridization is performed on the cell pellets to confirm that the mRNA expression is as designed. Each CISH dot represents one bound mRNA molecule so the CISH signal can be compared to the known copy numbers in the cell lines. If the CISH signal aligns with sequencing data, IHC antibodies are then tested on the cell pellets to identify the best antibody to move forward into tissue staining.
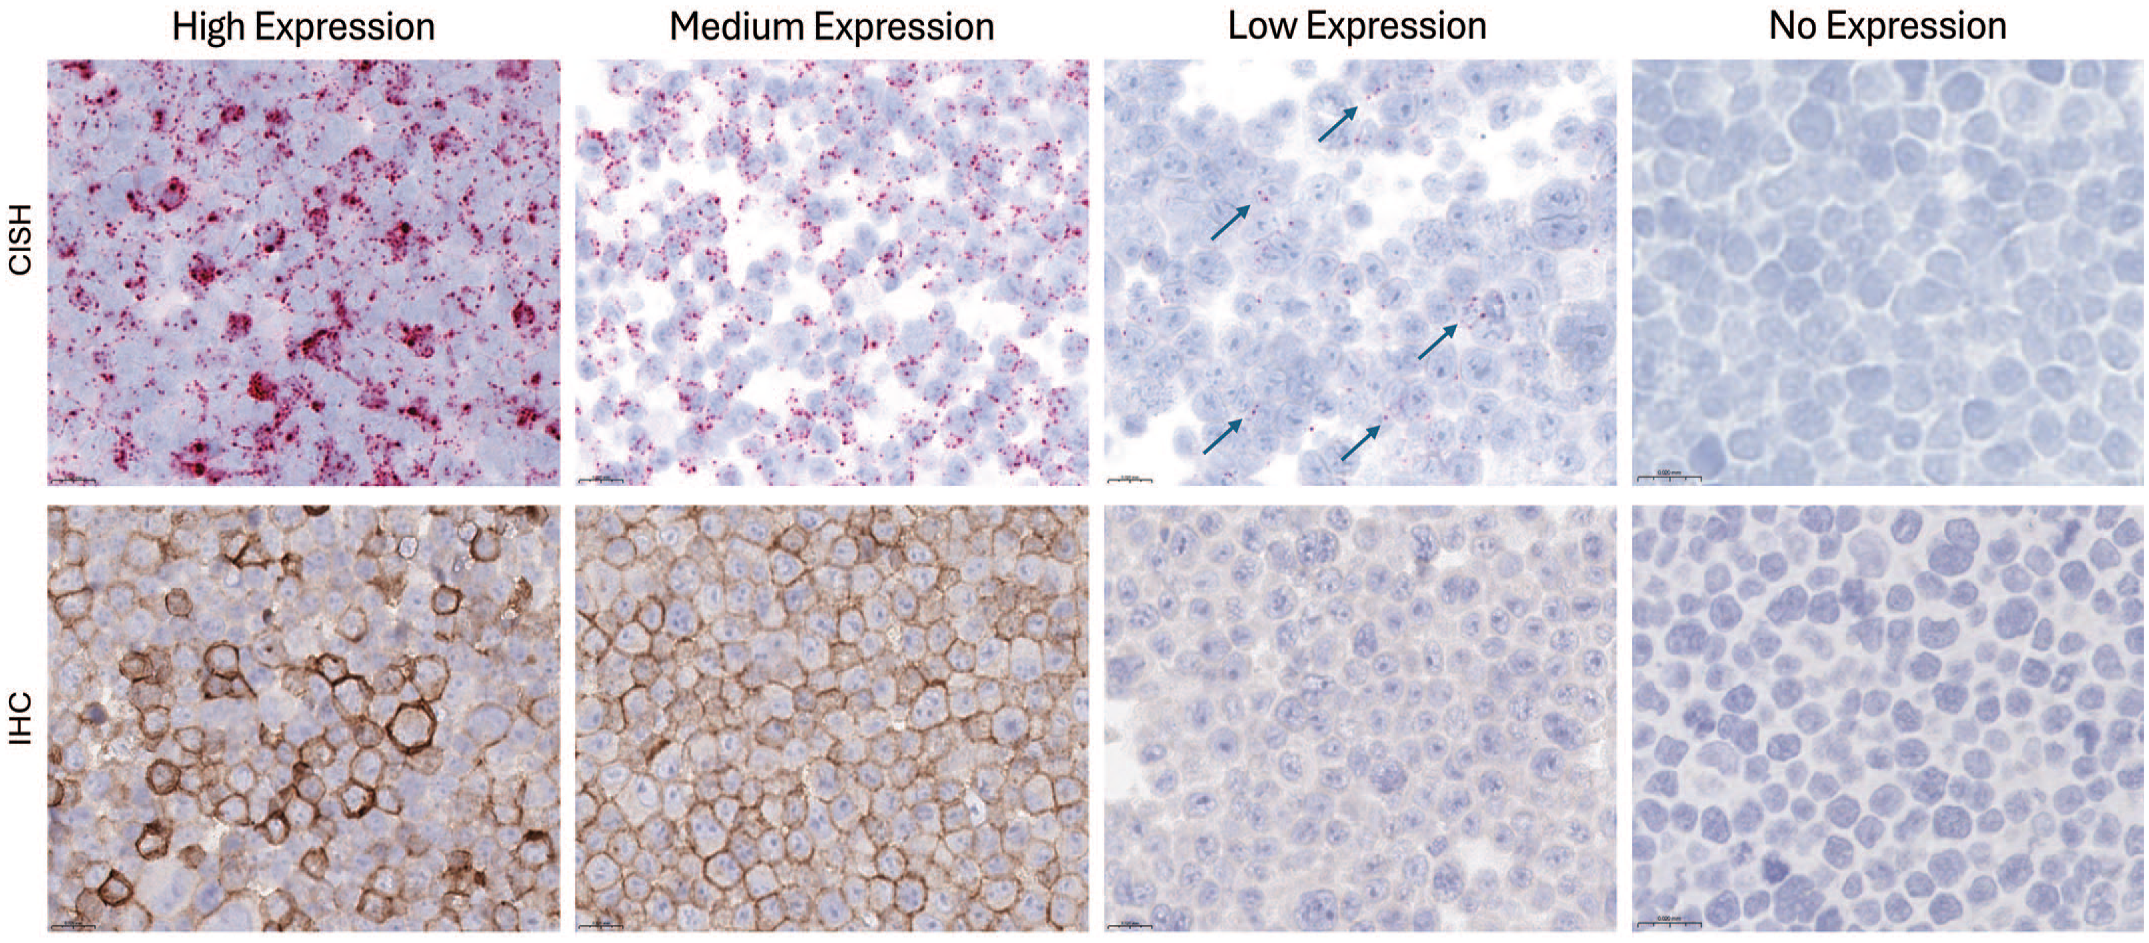
CISH and IHC correlation on cell pellet array. Arrows point to the rare CISH dots in the low expression example with a very weak blush IHC signal. In this example, CISH demonstrates that the weak blush IHC signal is a true positive. CISH signal is indicated by red dots in the cytoplasm and/or nucleus. IHC signal is indicated by the DAB chromogen. Hematoxylin counterstain.
RNA-qualified CISH screening of normal tissue may be limited to a tissue of interest or, in the case of a large molecule program, may be performed on a U.S. Food and Drug Administration (FDA) 23 standard normal human tissue microarray, which contains 33 tissue types with three cores from three different individuals for each tissue type. Chromogenic RNAscope in situ hybridization for the novel target is performed, and expression is evaluated manually. Optimization of the IHC method follows, using the CISH signal to define specific and nonspecific antibody binding and to refine the IHC assay (Figures 5 and 6). Once the assay is optimized on normal tissue, the evaluation of tissues for the particular disease indication follows. Chromogenic RNAscope in situ hybridization is performed on a small number of diseased tissues, typically 3 to 5 unique samples, followed by IHC on the same samples. This step ensures that the IHC assay is performing as expected in the diseased tissue. If the IHC assay is successfully developed, protein expression is quantified either manually or computationally with automated image analysis software on the disease indication cohort. If there is no working antibody and mRNA expression is used as a surrogate, CISH can be performed on a cohort of RNA-qualified tissue in the disease indication. Manual assessment of the distribution of the CISH signal on a WSI is a labor-intensive and time-consuming process. Maintaining consistency and eliminating bias is difficult when manually scoring large cohorts, especially when CISH signals are low and/or heterogenous. Automated quantitative image analysis is a valuable tool when CISH quantitation is required in normal tissue or disease indications.
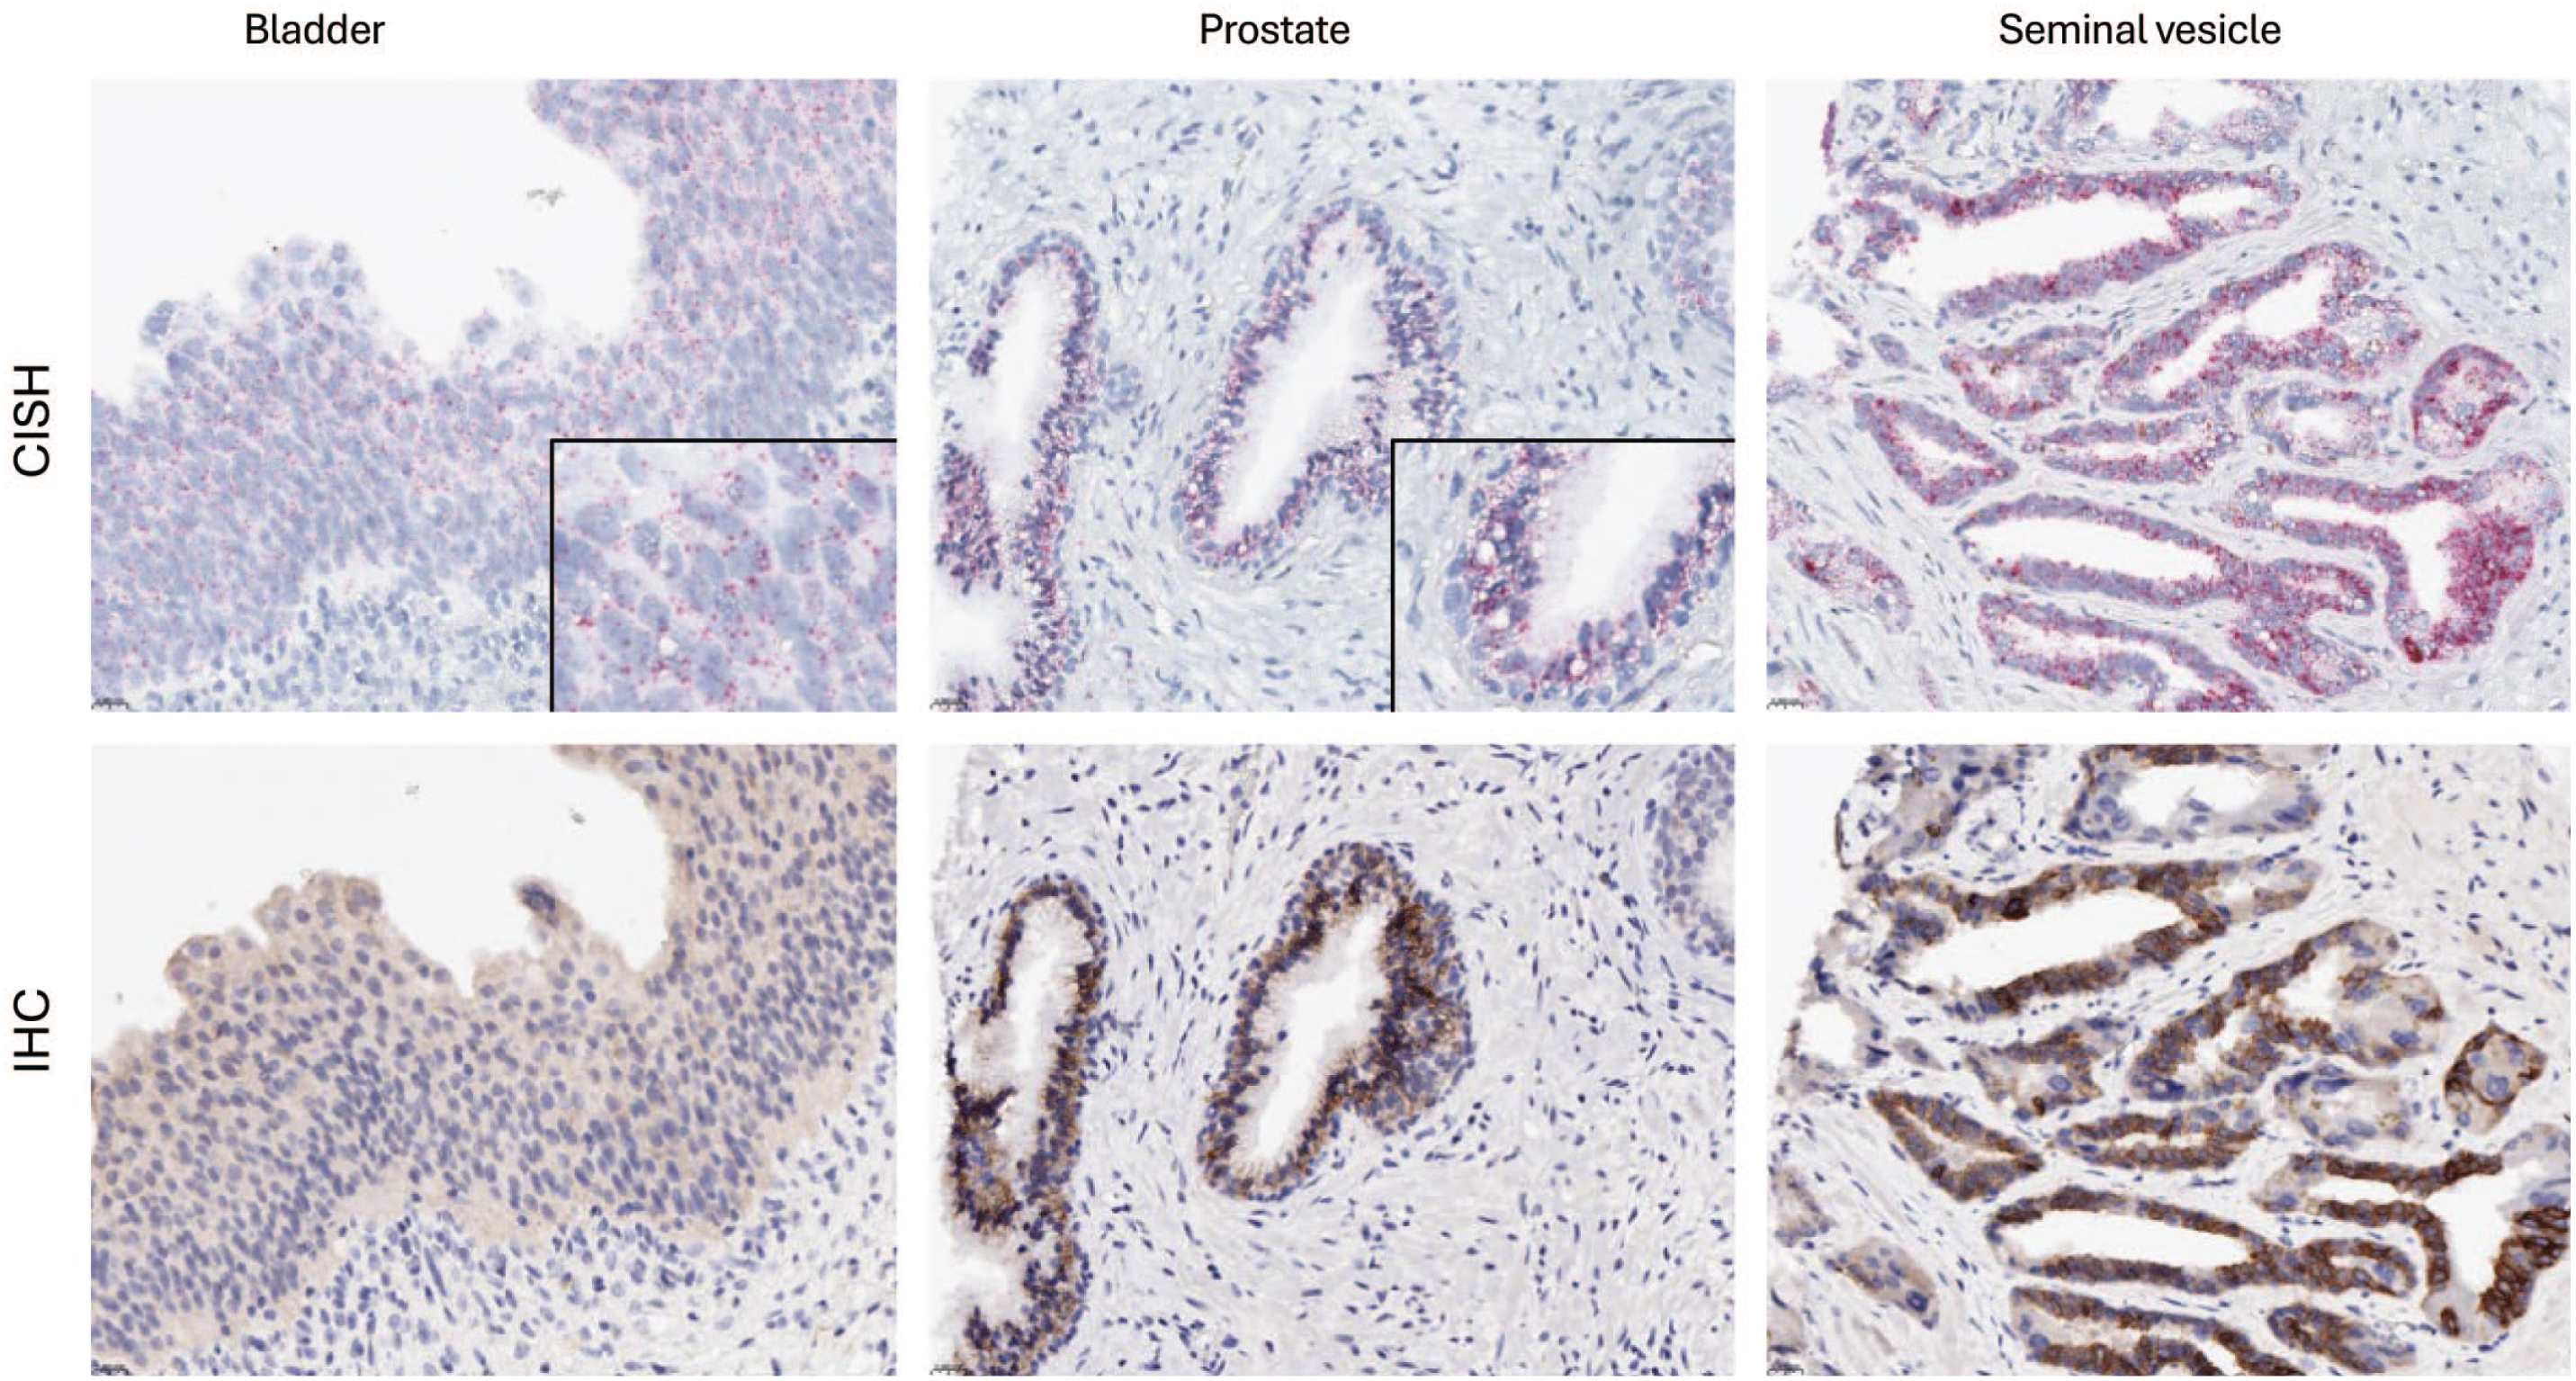
CISH and IHC correlation in tissue. Insets are higher magnification. CISH signal is indicated by red dots in the cytoplasm and/or nucleus. IHC signal is indicated by the DAB chromogen. Hematoxylin counterstain.
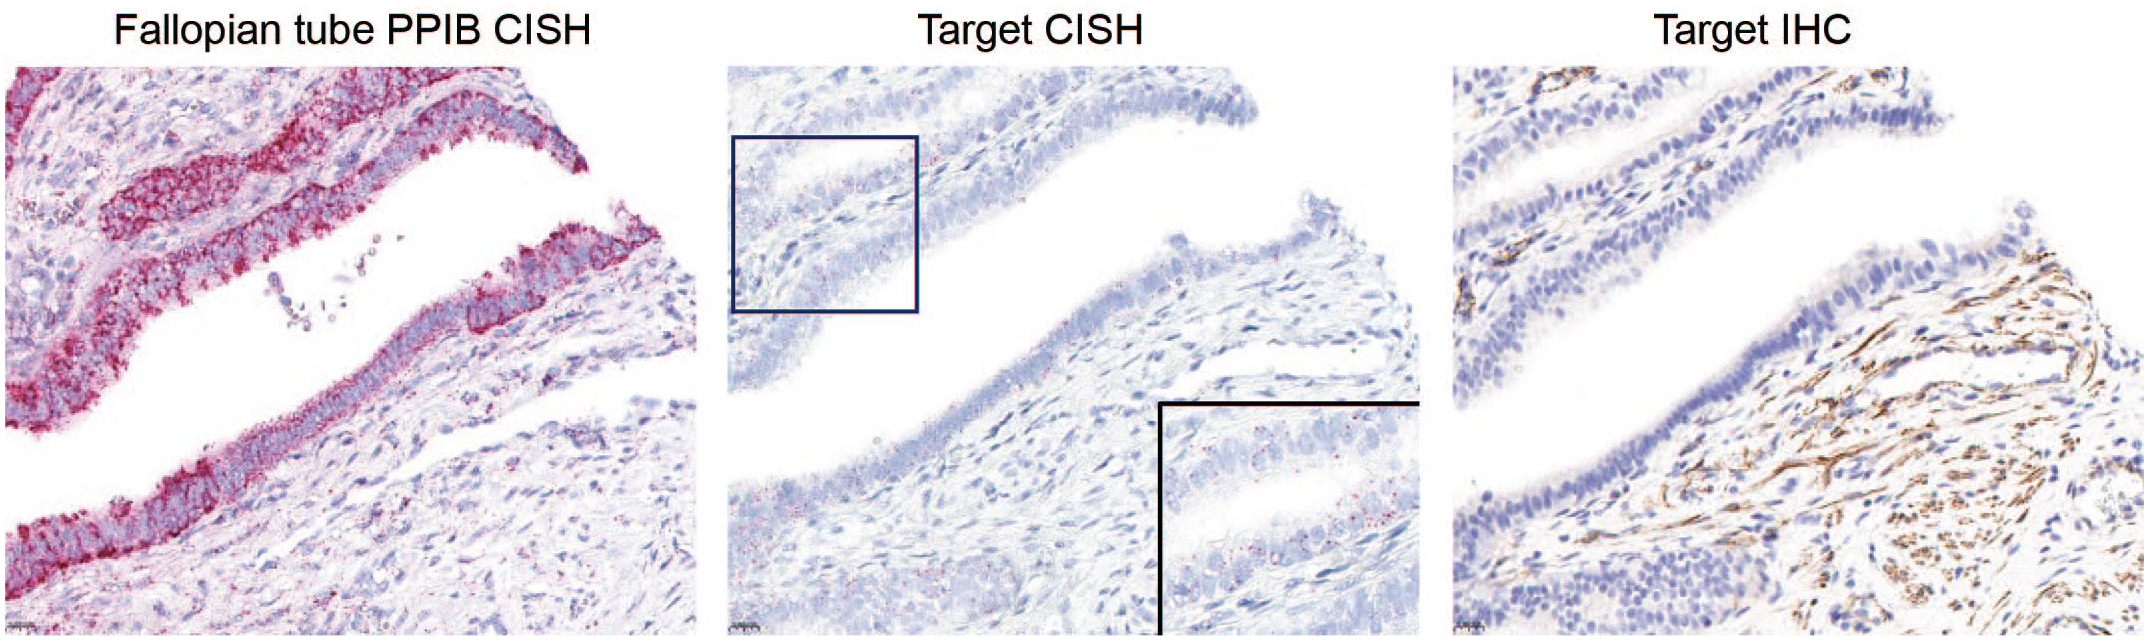
Identification of nonspecific IHC labeling of stroma using target specific CISH in PPIB qualified tissue. Strong PIBB signal in the epithelium and stroma of the fallopian tube indicates adequate mRNA quality. Target CISH signal is observed in the fallopian tube epithelium and not stroma. There is non-specific IHC stromal signal and the epithelium is negative. This indicates that the IHC assay is not performing as expected and the antibody has failed validation. CISH signal is indicated by red dots in the cytoplasm and/or nucleus. IHC signal is indicated by the DAB chromogen. Hematoxylin counterstain.
CISH Quantitation
Quantitative analysis of CISH with proprietary and open-source software has been described previously.10,12,18,25 The following example employs a series of algorithms using the built-in applications and features of VisioPharm image analysis software (version 2023.10). The analysis strategy can be developed and deployed by an image analysis scientist with a complete working knowledge of VisioPharm or a comparable image analysis software. This workflow introduces the step of registration to show co-localization of the CISH target probe with the CISH probe for the housekeeping gene to exclude regions with inadequate RNA preservation (Figure 7). Eliminating regions that fail RNA qualification from the image analysis prevents inclusion of regions that would be otherwise be classified falsely as negative. Another novel component of this custom workflow is the generation of heat maps of the CISH signal for the target gene, which provide a snapshot of the spatial distribution of the signal and the signal intensity.
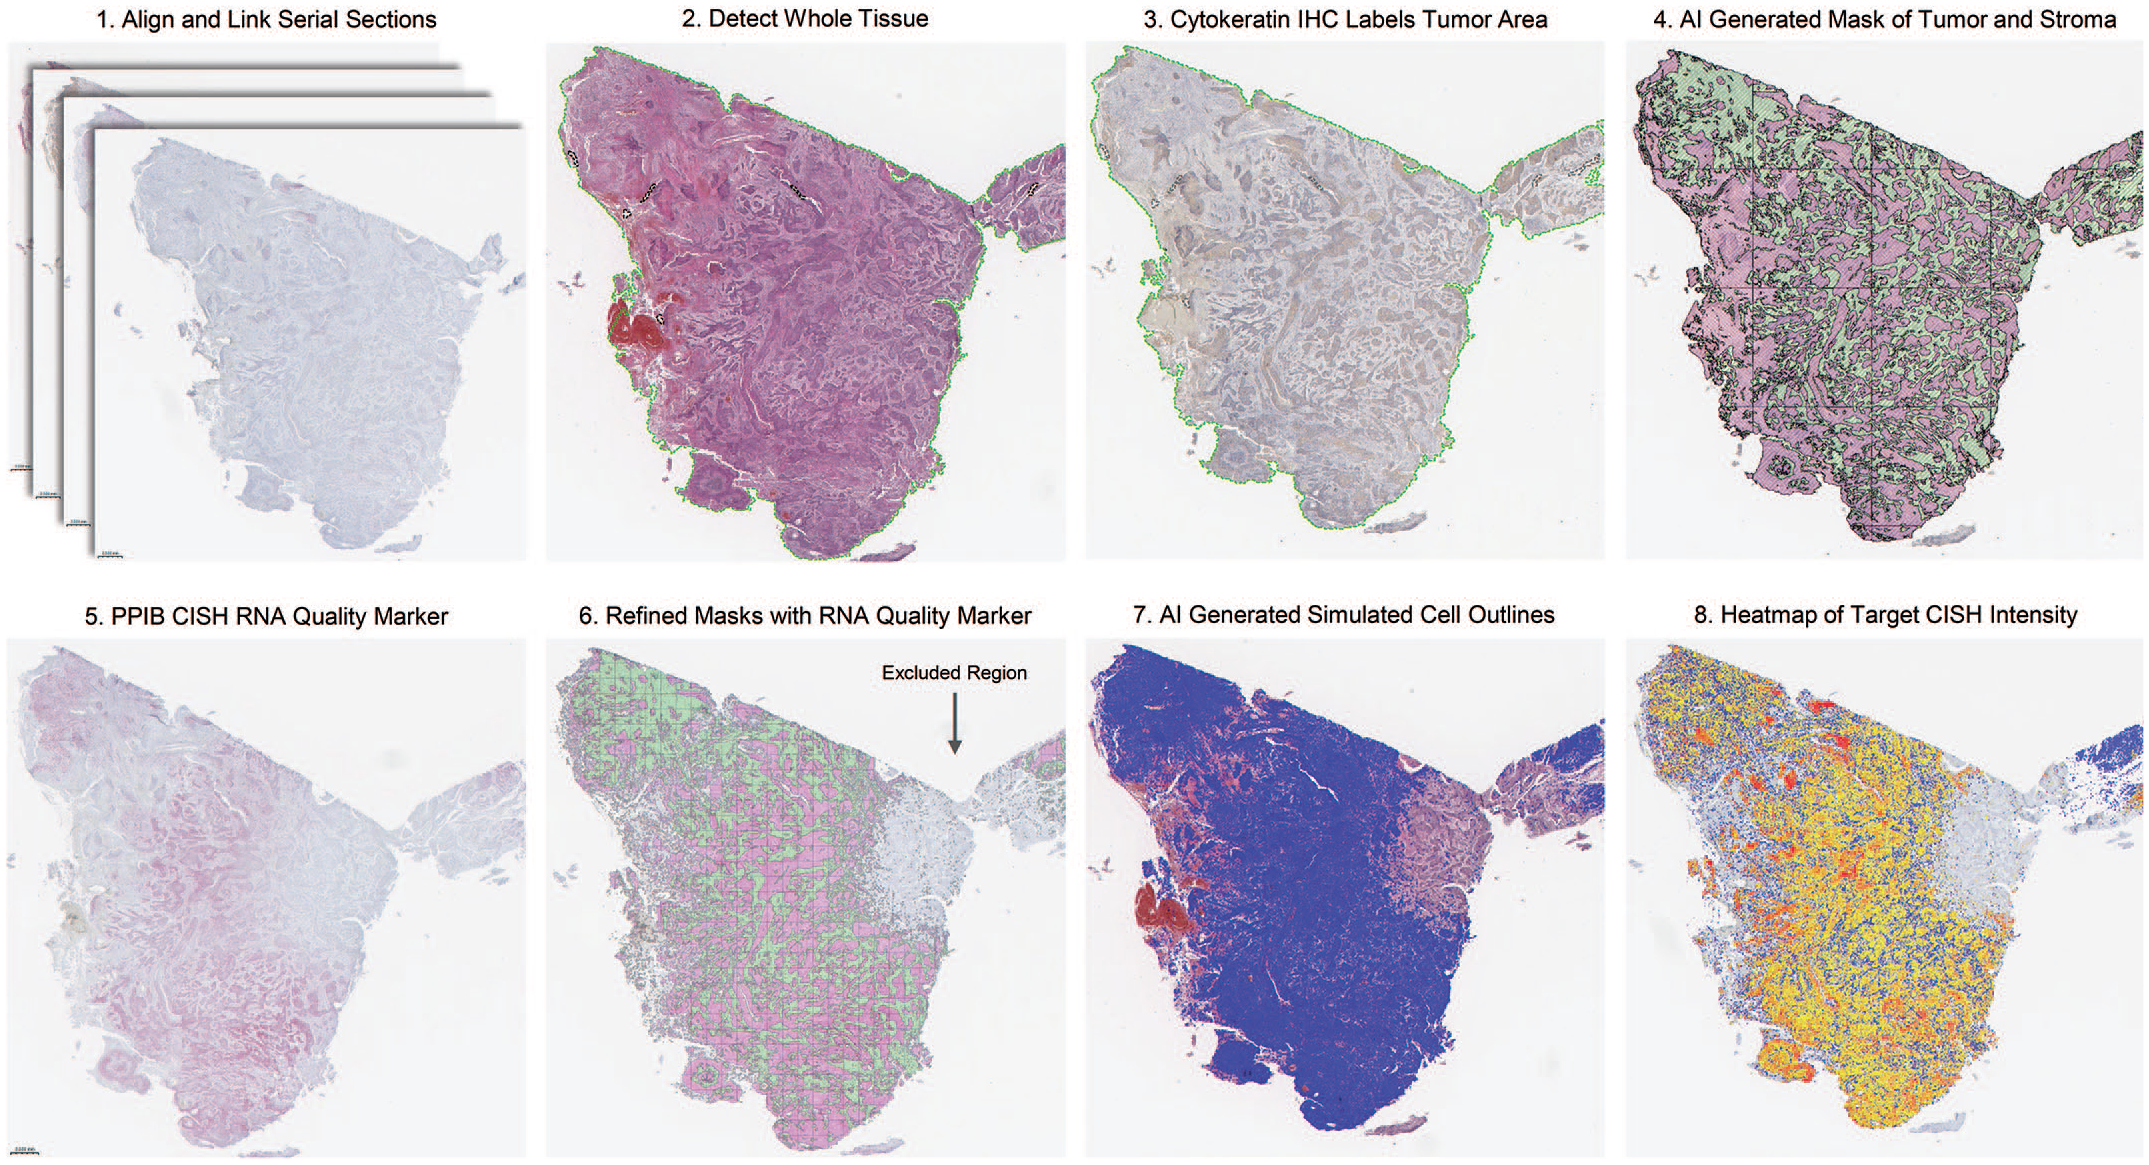
Schematic of image analysis workflow. 1. Serial sections are aligned and linked; 2. The entire tissue section is detected (green outline); 3. Cytokeratin IHC is used to segment tumor from stromal regions; 4. AI-generated mask of tumor (pink) and stroma (green); 5. PPIB CISH is used to determine RNA quality; 6. Analyzable tumor (pink) and stroma (green) are refined based off of RNA quality and regions with no PPIB signal are excluded; 7. AI-generated cell outlines (blue); 8. Heatmap of Target CISH by dot density (red-high, orange-medium, yellow-low, blue-negative).
For this example, 4 serial sections were cut from a cohort of 8 commercially procured FFPE samples of human head and neck squamous cell carcinoma (HNSCC). The CISH target probe was designed for a known tumor-associated antigen (TAA). 17 The slides underwent staining with hematoxylin and eosin (H&E) to assess general tissue architecture, PPIB CISH for RNA qualification, TAA CISH (to examine expression of the target gene), and cytokeratin IHC (to demonstrate co-localization of the CISH probes over the neoplastic epithelial tissue). While each of these steps is automated, visual assessment of the analyzed regions and minor manual adjustments are sometimes required.
To enable a meaningful image analysis, the images for these 4 methods require image registration. 3 The 4 matching sections to be registered were manually selected and linked using the TissueAlign module in VisioPharm. The module performs an automatic alignment across all 4 images that is then refined by the user by placing digital pins into matching regions across the images. The resulting registration centered around distinguishing features of the pinned regions allows for signal detection in one section to be cross-referenced to another section, which enables the automated annotation of tumor, stroma and PPIB (RNA)-qualified regions.
Following slide registration, the machine-learning application is trained to identify the entire tissue. Tissue artifacts such as folds, unfocused areas, and nonspecific staining debris are manually excluded by the user. Once the whole tissue is identified, the regions to be analyzed must be segmented, in this case into two discrete regions of interest (ROI): tumor and stroma. A threshold-based algorithm using the cytokeratin IHC is used for automated segmentation of the tumor versus stroma ROIs. In the absence of a specific marker to delineate ROIs, manual annotation can be performed by using an electronic pen to manually outline ROIs. After the first-tier ROI segmentation, the analyzable tissue area is further refined using a threshold-based algorithm to exclude PPIB (RNA)-negative regions. Areas with poor PPIB signal are excluded in both the stroma and tumor ROIs. Within the PPIB-segmented ROIs, a pretrained deep learning algorithm for nuclear detection based on the hematoxylin channel of the H&E images generates simulated cell outlines within both tumor and stroma areas with acceptable levels of RNA preservation (PPIB signal). (Detailed information on working with deep learning algorithms can be found here: https://visiopharm.com/app-center/app/nuclei-detection-ai-brightfield/). Simulated cell outlines enable the assessment of heterogeneity in expression at the cellular level (Figure 8).
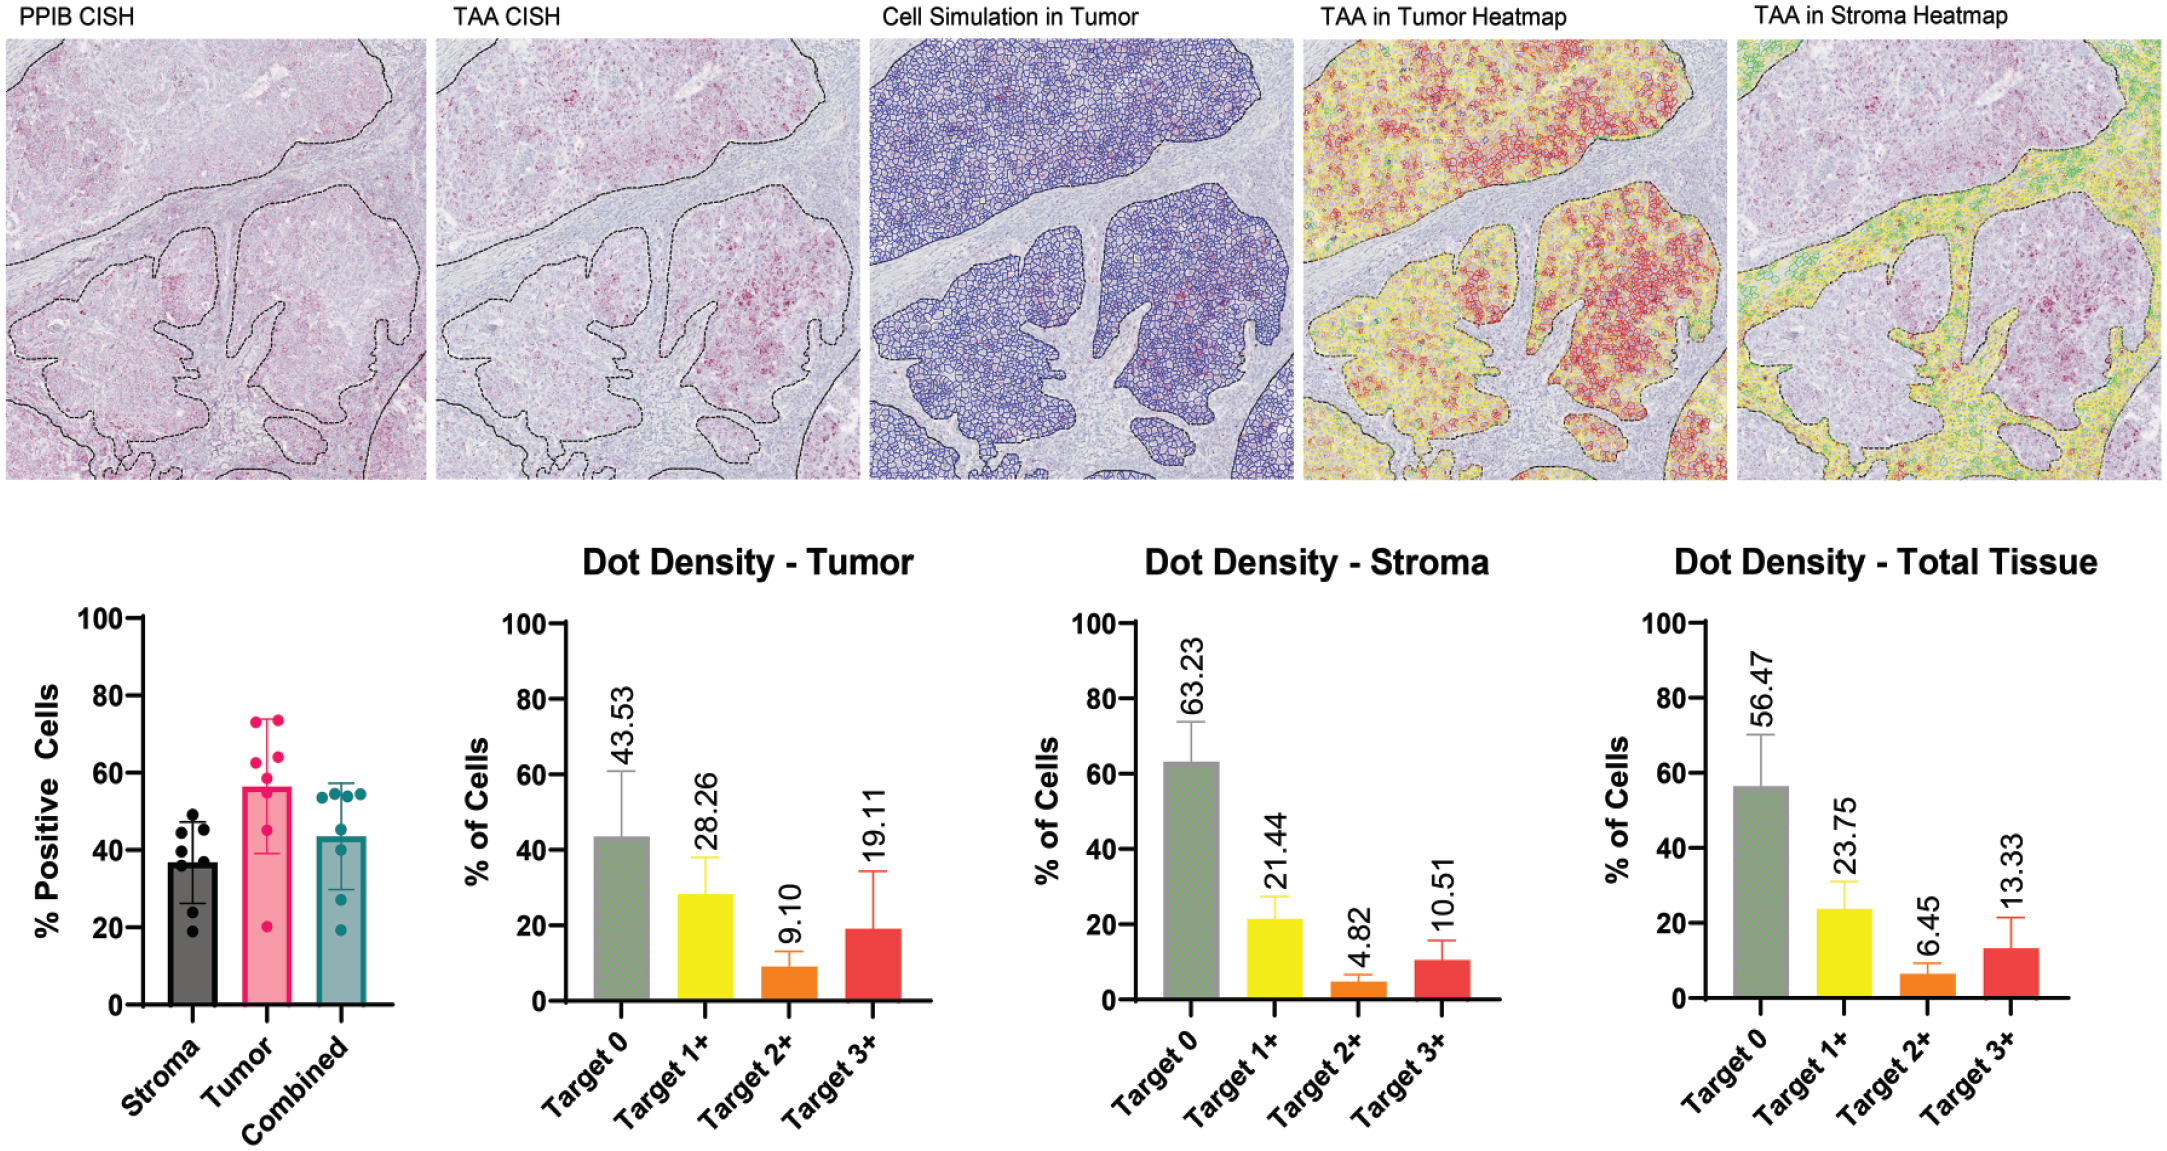
Utilization of CISH signal quantitation at the cellular level. Images in the top row are higher magnification of images in Figure 7 and include analyzable areas based on PPIB signal. In this visualization, the tumor region was detected using the cytokeratin mask and a machine learning algorithm. Cell simulation was applied and the tumor heatmap was generated based on TAA dot density at the cell level (red-high, orange-medium, yellow-low, and green-negative). The inverse process is performed to determine dot density in the stroma. Graphs on the bottom row display the types of data that can be generated with this quantitative image analysis. Dot density in the total tissue is a summation of the tumor and stromal scores.
Finally, to create a visualization tool to offer rapid assessment of signal intensity and spatial distribution, a heat map of the CISH signal in the tissue was developed. In this workflow, CISH dots were detected within simulated cell outlines by thresholding on the green chromaticity color feature. The green chromaticity feature leverages the proportionality of green signal within the red CISH signal and the blue hematoxylin counterstain. VisioPharm provides several color features that can be used to visualize the CISH signal, green chromaticity is one option and may need to be adjusted based on lab-specific applications. Chromogenic RNAscope in situ hybridization dot density on simulated cell outlines was approximated using threshold settings to distinguish CISH negative, low-, medium-, and high-positive cells. This type of visualization is particularly useful for quickly assessing signals without the need to zoom to 400× magnification to identify individual CISH foci (Figures 7 and 8).
A small cohort of 8 HNSCC samples was used to demonstrate the utility of the RNAscope-based target validation workflow. The following questions were proposed: What is the overall prevalence of the TAA in tumor cells? What is the TAA prevalence in tumor verses stroma? What is the heterogeneity of TAA expression at the cellular level in the tumor and in the stroma? The prevalence of the target was defined as the percentage of positive tumor cells regardless of staining intensity. In this sample cohort, the TAA expression ranged from 20% to 75% in the tumor cells and 20% to 55% in the stroma compartment (Figure 8). Tumor-associated antigen expression in the tumor compared to stroma was similar in this example. Expression of TAA in the tumor, stroma, or normal tissue may be a key piece of data that is considered in target selection. This workstream provides the ability to segment the tissue into compartments and resolve the spatial distribution. In addition, the level of expression and variability of that expression at the single-cell level may be important for predicting target engagement or potential efficacy. These sample cases show how creating the simulated cell outlines and thresholding on dot density at the cellular level can provide quantitative data on the heterogeneity of expression in the tumor cells (Figure 8).
Discussion
Here, we describe a method to incorporate CISH into the IHC assay validation workflow. Using CISH in the assay validation process allows scientists to confirm antibody specificity, easily identify nonspecific labeling, and quickly eliminate antibodies that are not performing well in the IHC assay. In situations with novel targets where little is known about expression at the cellular level, CISH is an invaluable tool to confirm “true positive” or “true negative” results during IHC assay validation and in assessment of normal tissue expression. There are also instances where no antibodies work in IHC assays. In such cases, CISH can be a surrogate (standalone) tool to characterize and assess the expression of molecular targets in tissue. Manual scoring and spatial characterization of CISH dots in full tissue sections are cumbersome, time-consuming, and can be prone to bias in low expression and/or highly heterogeneous targets.4,5,9 Here we show a quantitative image analysis method to measure the CISH signal using VisioPharm software that enables single-cell signal detection to inform target prevalence and heterogeneity. We also introduce an image heat map tool that provides quickly assimilated spatial information on target expression. This tool particularly provides valuable insight to expression patterns within tissues and allows pathologists to quickly identify areas of target expression that may spark closer review of specific tissue regions.
Characterization of target expression at the tissue level is a key component to a target validation data package in a drug discovery pipeline. Initial characterization of target expression is commonly done by mining publicly available sequencing data sets and published IHC reports. Bulk and single-cell sequencing data provide significant value for identifying targets. However, spatial expression data are typically not available, heterogeneity of target expression is difficult to assess, and in the case of bulk sequencing (using homogenized tissue) the sample for analysis is often contaminated by normal tissue. Assays such as IHC and CISH provide protein and mRNA target expression data in the context of the tissue section, thereby providing important prevalence, localization, and target heterogeneity information.
Target in expression in normal and diseased tissue is typically assessed early in discovery and development projects, and in some instances such assessments are necessary for decision-making in advancing the target. 20 As the project progresses toward clinical testing, particularly in oncology pipelines, indication selection relies heavily on tissue expression data for molecular targets of interest. From a safety assessment perspective, thorough characterization of normal tissue expression of the molecular (usually protein) targets provides awareness of potential risks and helps guide decisions for early de-risking studies. Therefore, developing robust and reproducible assays to assess accurately define target expression are essential.
Some of the factors limiting the adoption of CISH into standard workflows include expense of probes and reagents, lack of instrumentation to deploy at scale, and lack of experience with the technique and with customizing the analytical software. Even if CISH is not a component of standard assay validation, there may still be opportunities where CISH is the tool that is needed. In cases where CISH is or can be incorporated in the workflow, the benefits of confidence in an IHC assay, efficiency to developing the IHC assay and the option of CISH when IHC is not successful will be a valuable component to the laboratory toolbox.
Footnotes
Declaration of Conflicting Interests
The author(s) declared no potential conflicts of interest with respect to the research, authorship, and/or publication of this article.
Funding
The author(s) received no financial support for the research, authorship, and/or publication of this article.