
Abstract
In nonclinical toxicology studies, lab animals are fasted typically overnight, to reduce variability in some clinical pathology parameters. However, fasting adds undue stress, and this is particularly concerning in rodents given their fast metabolic rates. Furthermore, as rodents are nocturnal animals, an overnight fasting may cause a protracted negative metabolic state even when the fasting has technically ended, given their minimal activity and food consumption during the day. Therefore, to evaluate the impacts of different fasting durations (±DietGel supplementation) on rats’ welfare, we assessed the traditional and ancillary clinical pathology parameters in Sprague-Dawley rats, along with body weight, organ weight, and histopathology. Although most endpoints were comparable between the different fasting durations (±DietGel supplementation), the long fasting times (≥8 hr) without DietGel supplementation caused significant decreases in body weight, liver weight, liver glycogen content, serum glucose, triglyceride, and creatinine concentrations—all findings suggestive of a negative energy balance that could impact animal welfare and consequently, data quality; while the short fasting time (4 hr) and DietGel supplementation were associated with higher triglycerides variability. Hence, we propose that short fasting time should be adequate for most toxicology studies in rats, and long fasting times should only be accommodated with scientific justification.
Introduction
In toxicology studies, overnight fasting is a common procedure in lab animals for clinical pathology (CP) screening. Rodents (ie, rats and mice) are one of the most common animal species used in toxicology studies. Rats are nocturnal animals 5 that are active and mostly consume food during the dark phase of the diurnal cycle. Therefore, fasting rats during the time they have the best chance of feeding (ie, overnight fasting) may leave them in a prolonged negative metabolic state even when the fasting has technically ended due to their reduced activity and food consumption during the daytime or light phase of the diurnal cycle. Moreover, studies have shown that the basal metabolic rates in rodents are approximately 6 to 10 times faster than in humans.2,12,25 As such, the combination of these factors (ie, inadvertent extended fast and high metabolic rates), along with other stress factors associated with toxicology studies such as stress from the administration of and exposure to potentially toxic doses of the test articles and additional study-related procedures, may lead to unintended consequences that may negatively impact the welfare of the rats and the quality of the data generated from these animals. In a fasting study that was recently conducted in cynomolgus monkeys—another commonly used animal in toxicology studies—we showed that long fasting times (up to 20 hr) resulted in glucocorticoid-induced stress, dehydration, and significant decreases in blood glucose, all indicative of changes that impact animal health and well-being. 1
Hence, to monitor the effect of fasting on the welfare of rats, we have conducted a study to evaluate different fasting durations in Sprague-Dawley rats with or without DietGel supplement. The results showed that most CP parameters were largely comparable between the different fasting times regardless of supplementation status. However, in the long fasting times, there were biologically significant decreases in body weight, liver weight, liver glycogen, serum glucose, and triglyceride concentrations, along with minimal to mild decreases in serum creatinine and cholesterol concentrations—all reflecting changes that could negatively impact animal welfare. Moreover, the DietGel supplementation largely prevented these changes in the long fasting times.
We hope the results from this study will not only help scientists in the drug development field, but also those generally involved in animal studies, to make informed decisions on selecting the appropriate fasting duration for rats’ studies with the intent of improving animal welfare while preserving data quality.
Materials and Methods
Ethical Statement
All methods and procedures described below were performed as required by the Animal Welfare Act, and in Accordance with the Guide for the Care and Use of Laboratory Animals, and the Office of Laboratory Animal Welfare. The animal use protocol was approved by the Institutional Animal Care and Use Committee (IACUC) of Genentech (South San Francisco, CA).
Animal Selection and Management
Forty-two female (F) and forty-two male (M) Sprague-Dawley (CD (SD):(CRL) rats were ordered by weight from Charles River Hollister (Hollister, CA). Females were 12 weeks old with body weights ranging from 226.9 to 259.7 g. Males were 8 weeks old with body weights ranging from 263.3 to 309.9 g. Animals were acclimated at Genentech for approximately 8 or 9 days prior to the initiation of the study. Animals were group-housed by sex up to 3 per cage and were provided with cage-enrichment devices. Animals were assigned to groups at the start of the study using a block-stratified randomization procedure based on body weight. Prior to fasting, the animals were fed Laboratory Autoclavable Rodent Diet 5010 (Lab Diet) and water via an automatic watering system ad libitum for the duration of the study. Animals given HydroGel (HG) or DietGel 76A (DG) supplements were individually housed in Tecniplast metabolism cages fitted with refrigerated racks (West Chester, PA).
Animal rooms were maintained at a temperature range of 20°C to 22°C and relative humidity between 20% and 80%. The light/dark cycle in the room was 14 hours of light, starting at 5:30 am, followed by 10 hours of darkness. The light/dark cycle was interrupted only for animals fasted for 12 hours. The ventilation system ensured a minimum of 15 air changes per hour.
Study Design and CP Sample Collection
On the day of fasting and blood collection, food was provided to the rats ad libitum after which food was removed, and this marked the beginning of fasting. Blood samples were collected via the jugular vein approximately 4, 8, 10, 12, and 16 hours after the start of fasting. Animals were separated into groups and fasted as shown in Table 1.
Study design and clinical pathology sample collection.
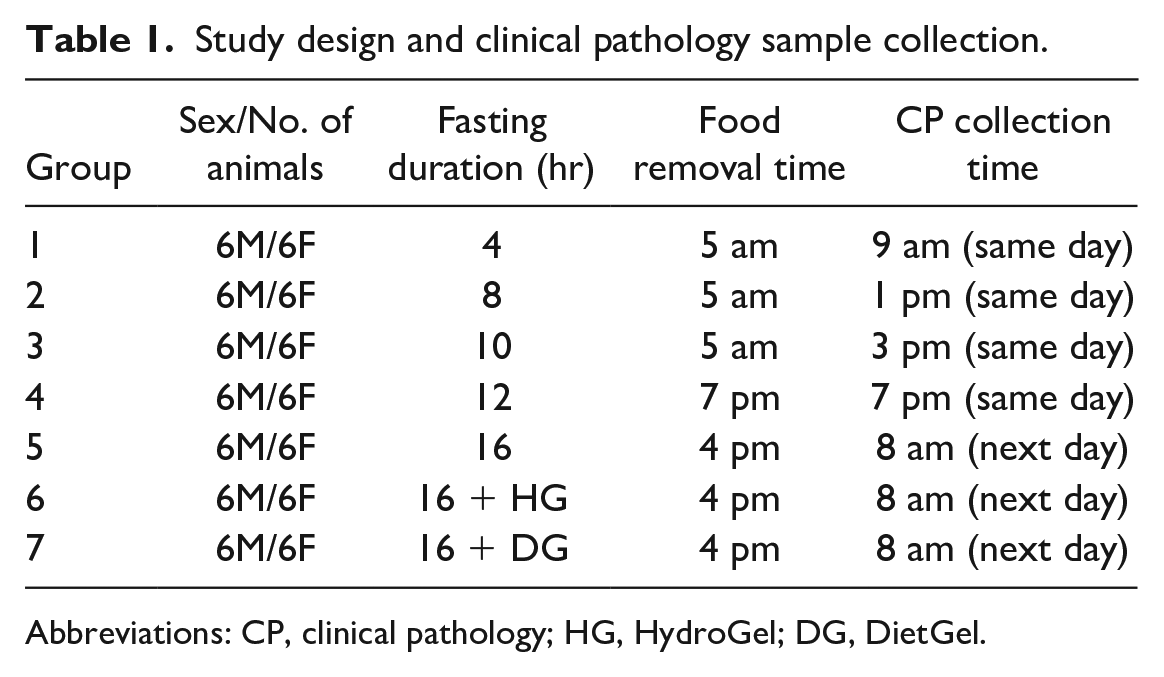
Abbreviations: CP, clinical pathology; HG, HydroGel; DG, DietGel.
Body Weights
Body weights were recorded for all animals at the respective end of fasting for each group, that is, at 4, 8, 10, 12, and 16 hours of fasting.
Necropsy, Histopathology, and Hepatocytes Measurement
Necropsy was performed only on the male rats from all groups except Group 6 (16 hr Fast + HG). Rats were anesthetized with isoflurane in an appropriately sized induction chamber. Once visually anesthetized, rats were removed from the chamber, then administered a mixture of ketamine/xylazine. Depth of anesthesia was confirmed by the absence of reflex/toe pinch. Once depth of anesthesia was confirmed, the abdomen was surgically opened to expose the abdominal aorta. Blood was collected using a butterfly small-vein infusion set with a 21-gauge needle. After blood collection, the diaphragm was incised, and thoracotomy was performed. Adrenal gland, brain, heart, liver, lung, kidney, and thymus samples were collected and weighed; paired organs were weighed together. Lungs were then inflated with 10% neutral-buffered formalin. All other tissues were either snap frozen in liquid nitrogen and then stored in a freezer set to maintain −60°C to −80°C until analyzed or fixed in 10% neutral-buffered formalin and embedded in paraffin wax, sectioned at 5 mm, stained with hematoxylin and eosin (H&E), and examined microscopically by a board-certified veterinary anatomic pathologist. To confirm the microscopic findings in the liver, slides were digitized for quantification and statistical analysis purpose using whole-slide bright-field scanners (Leica Aperio S360 scanner at 40× magnification). Liver sections were identified using an in-house developed Mask-RCNN model. 16 Hepatocyte nuclei were identified using Hover-Net. 14 Hepatic nuclei within a 2.26-µm radius were identified as binucleated cells and merged. Hepatocyte size was determined by the expanded area radiating from the nuclei. Both binucleated and nonbinucleated nuclei underwent radial expansion until they touched the expansion radius of neighboring nuclei, with a restriction set to limit the expansion to no more than a 13.6-µm radius. Following the radial expansion process, red blood cells and tissue-free glass regions were removed through image analysis to avoid counting invalid areas. This refined approach facilitated a more accurate calculation of hepatocyte sizes, avoiding distortions in measurement due to undesirable inclusions. Average hepatocyte size from all liver sections for each animal was computed. Python (version 3.6.12) facilitated image analysis, using PyTorch (version 1.6.0) for the implementation of deep learning algorithms. All image analyses and nuclei detection endeavors were conducted at a 40× magnification.
Hematology, Serum Chemistry and Insulin Analyses
Blood samples were collected from fasted animals via the jugular vein under isoflurane anesthesia.
For hematology, approximately 200 µL of whole blood was collected into tubes containing dipotassium ethylenediaminetetraacetic acid (K2EDTA) as an anticoagulant, and the tubes were gently inverted six to eight times. Samples were analyzed by the Clinical Pathology Lab at Genentech, Inc. with a Sysmex XT-2000iV analyzer (Kobe, Japan).
For clinical chemistry and insulin, approximately 800 µL of whole blood was collected into serum separator tubes (without anticoagulant), allowed to clot at room temperature for at least 30 minutes, and centrifuged (10 minutes at 5000 r/min, 4°C-8°C) within 1 hour of collection. Serum was harvested into two aliquots and transferred into flat bottom, polypropylene, screw-capped tubes. Tube 1 was designated for 300 µL of serum for clinical chemistry. Samples were analyzed by the Clinical Pathology Lab at Genentech, Inc. with a Beckman Coulter Au480 analyzer (Brea, CA). Tube 2 was designated for 100 µL of serum for insulin analysis. Serum samples were held on dry ice and then stored in a freezer, set to maintain −60°C to −80°C until analyzed.
Insulin was measured using a chemiluminescence immunoassay on a Beckman Coulter Access II Instrument that uses a Beckman Coulter Access Ultrasensitive Insulin Reagent.
Corticosterone and Glucagon Analyses
Blood samples were collected at necropsy from fasted animals via abdominal cut down under isoflurane anesthesia along with a mixture of ketamine and xylazine.
A whole blood sample of approximately 600 µL was collected into serum separator tubes (without anticoagulant), allowed to clot at room temperature for at least 30 minutes, and centrifuged (10 minutes at 5000 r/min, room temperature) within 1 hour of collection. Serum was harvested into two aliquots and transferred into flat bottom, polypropylene, screw-capped tubes. Tube 1 was designated for 100 µL of serum for glucagon analysis and Tube 2 was designated for 200 µL of serum for corticosterone analysis. Serum samples were held on dry ice and then stored in a freezer, set to maintain −60°C to −80°C until analyzed. Corticosterone and glucagon concentrations were measured as previously described. 1
Glutathione (GSH), Oxidized Glutathione (GSSG), and Cysteine (Cys) Analyses
Blood samples were collected from fasted animals via the jugular vein under isoflurane anesthesia. Liver samples were collected, weighed, and snap frozen in liquid nitrogen and then stored in a freezer set to maintain −60°C to −80°C until analyzed.
For GSH, GSSG, and Cys, approximately 200 µL of whole blood was collected into tubes containing tri-potassium EDTA (4.5 µL) as an anticoagulant and 310 mM N-ethylmaleimide as a derivatization reagent. Sample tubes were placed in a warm water bath for 1 to 3 minutes and vortexed prior to the addition of whole blood. Whole blood samples were gently inverted three to four times for a minimum of 1 minute, stored on dry ice, and stored in a freezer set to maintain at −60°C to −80°C. Whole blood was stored in flat-bottom, polypropylene, screw-capped tubes. Sample tubes were weighed before and after the addition of blood to account for collected blood volume and dilution. Liver tissues were homogenized in 50 mM Tris-BSAN buffer with a dilution of 1:10 (%w/v) tissue: buffer (50 mM Tris-BSAN buffer composition: 1.212 g Tris, 0.248 g boric acid, 42 mg of serine, 0.8 mg of acivicin and 20 mL of 310 mM NEM in 200 mL water 1M HCl to adjusted to pH to 8 using 1M HCl). All chemicals and reagents were either procured from Sigma Aldrich (St. Louis, MO, USA) or Toronto Research Chemicals (Toronto, ON, Canada). Glutathione, GSSG, and Cys were quantified with a derivatization-based liquid chromatography tandem mass spectrometry (LC-MS/MS) assay as described in detail previously. 1
Standard stocks solutions of GSH (1 mg/mL), GSSG (1 mg/mL), and cysteine (1 mg/mL) were prepared in 1.15% potassium chloride solution. Stable isotope internal standard (IS) solutions (1 mg/mL) included 13C4,15N2-GSSG, D2-Cysteine, 13C2-15N1-GSH prepared in 0.5 N perchloric acid. Surrogate matrix, 1.15% potassium chloride solution for whole blood and 1.15% potassium chloride solution with Tris-BSAN buffer (1:10 %v/v) for liver tissue samples, calibration curve ranges for GSH and GSSG were 0.02 to 400 µg/mL and 0.006 to 100 µg/mL for Cysteine. Calibration standards, quality controls, and unknown samples (25 µL) were subjected to sample preparation by addition of 10 µL of IS mix (50 µg/ml GSH, GSSG, and 5 µg/mL for cysteine) and 4.9 µL of EDTA (75 mg/mL) and NEM (310 mM). All samples were mixed for 10 minute and centrifuged at 4000 r/min for 1 minute followed by addition of 100 µL of 5-sulfosalicylic acid (20% w/v). Samples were then vortex mixed and centrifuged at 4000 r/min at 4°C for 10 minutes. About 80 µL of supernatant was transferred into a new sample plate, and 2 µL of the supernatant was injected for LC-MS/MS analysis as described previously. 1 Glutathione and Cys were quantified as NEM products derivatives (GSH-NEM & Cys-NEM) as described previously. 1
Data Analyses
All data were analyzed using mean values and standard deviation, within the same sex at different fasting periods, while comparing to baseline value at 4-hour time point. Using a statistical test, an unpaired two-tailed t-test was conducted to identify any differences that were considered statistically significant. In addition to the statistical analysis, all data were examined by a subject-matter expert to determine if they were biologically significant. All data analyses were performed in the GraphPad Prism (version 10.0.2) software.
Results
General Overview
The rats were fasted for 4, 8, 10, 12, and 16 hours with blood samples collected at these time points for the traditional and ancillary CP analyses. For this study, we describe short fasting time as 4 hours and long fasting times as ≥8 hours. An additional DietGel supplementation group was also included at the 16-hour time point (16-hr fast DG group). The supplementation group was included to investigate whether the provision of DG would alter CP parameters especially for studies where a body-weight effect (ie, body weight loss) has been identified. Moreover, rats undergoing fasting would typically not drink water even when provided ad libitum.4,7,21,24,29,39,45 Therefore, for fair comparison of the DG group with the nonsupplemented 16-hour fasting group, we included a HydroGel (HG) supplementation 16-hour fasting group (16-hr fast HG group), as 99% of HG is made up of water. 9
Long Fasting Times Caused Decreases in Body Weights
The body weights for all animals were recorded at the respective end of fasting for each group, that is, at 4, 8, 10, 12, and 16 hours of fasting with or without supplements. In males, regardless of the supplementation status, there were significant decreases in body weights at ≥12 hours of fasting with the largest decreases observed in the 16-hour fast HG group (7.5% decrease). In contrast, male animals in the 4- to 10-hour fasting groups had a net body weight gain relative to their prefasting body weights (0.6%-2.2% increase) (Table 2 and Figure 1). In females, significant decreases in body weights were observed at the ≥ 8-hour fasting time points in the nonsupplemented groups (3.1%-4.7% decrease), with only minimal decreases at the 4-hour time point (Table 2 and Figure 1). Like the males, the largest decrease in body weights in the female rats was observed in the 16-hour fast HG group (down by 7.8%). However, there was no body weight loss in the 16-hour fast DG group (Table 2 and Figure 1). Therefore, these results suggest that long fasting times (≥8 hr in females and ≥12 hr in males) led to body weight loss that was prevented by DG supplementation in the female rats.
Body weight of Sprague-Dawley rats fasted for different time periods with or without supplementations.
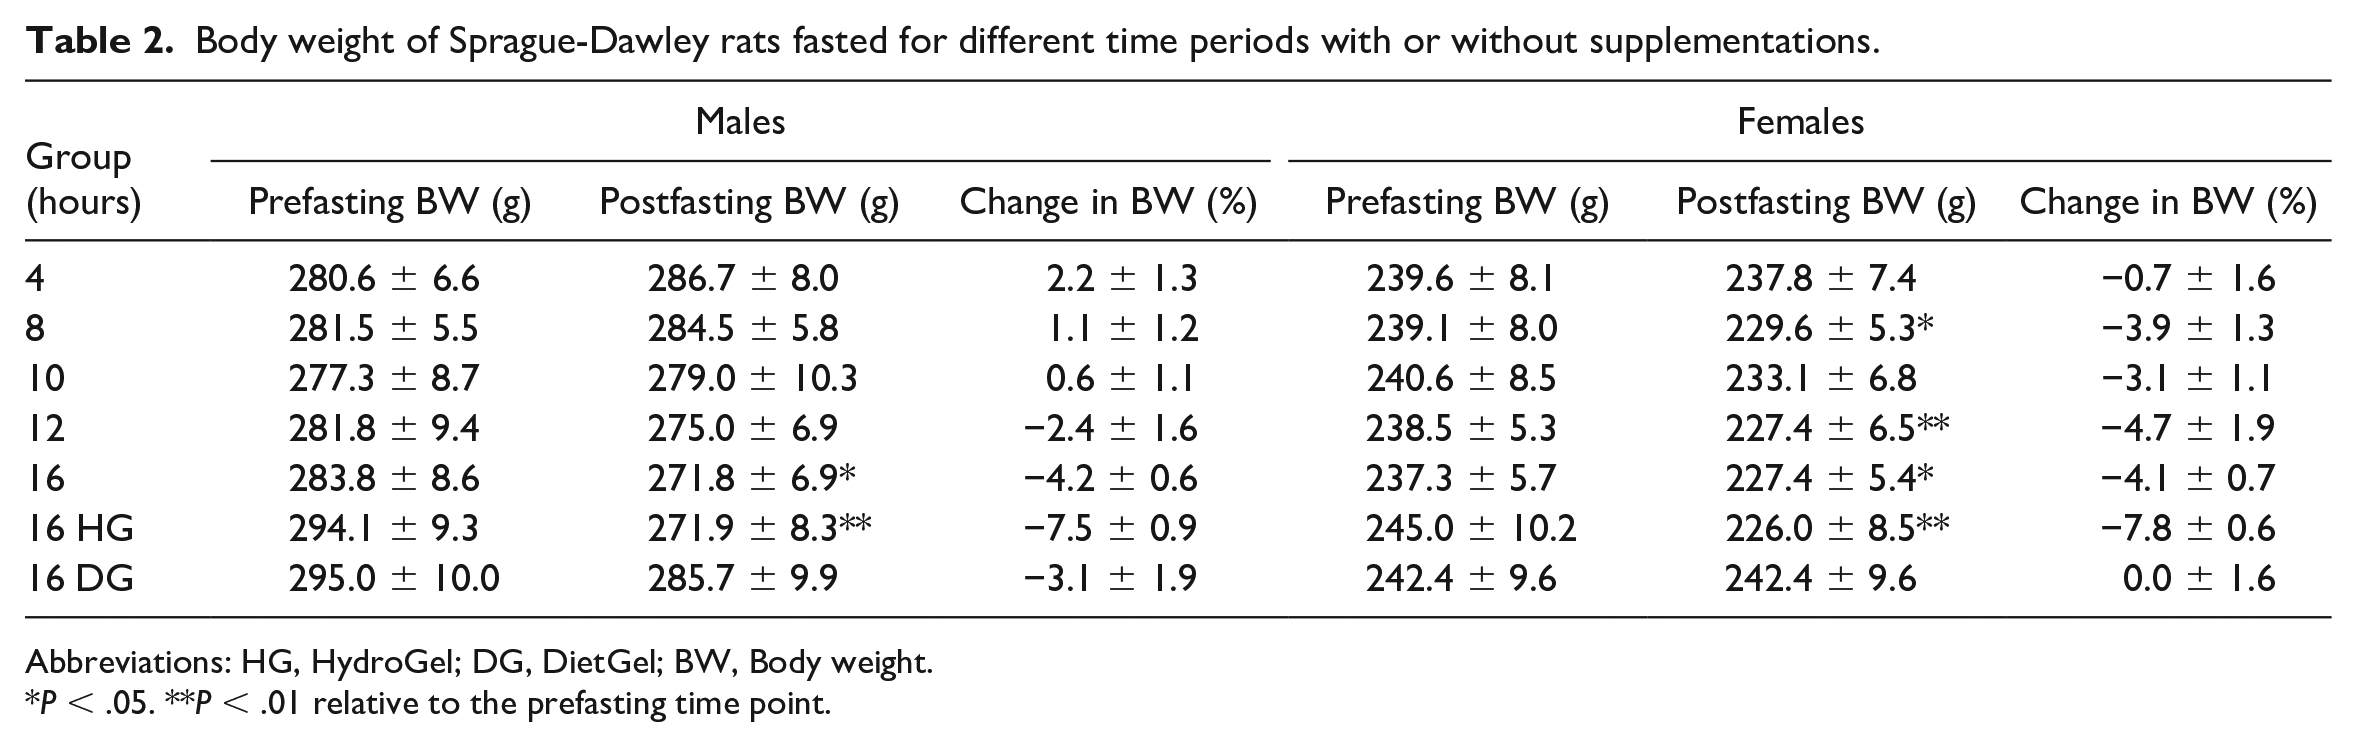
Abbreviations: HG, HydroGel; DG, DietGel; BW, Body weight.
P < .05. **P < .01 relative to the prefasting time point.
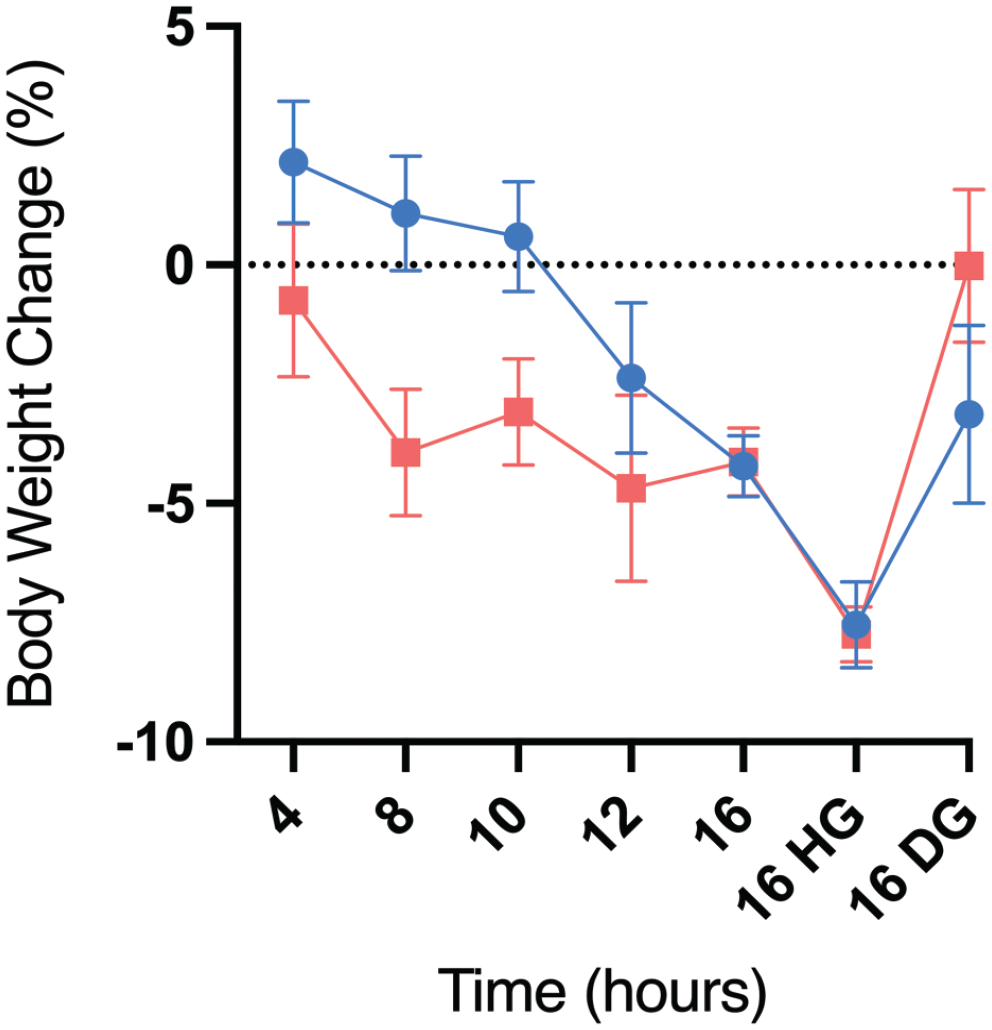
Body weight change (%) over different fasting times in male (blue) and female (red) Sprague-Dawley rats with or without supplementation. HG indicates HydroGel; DG, DietGel.
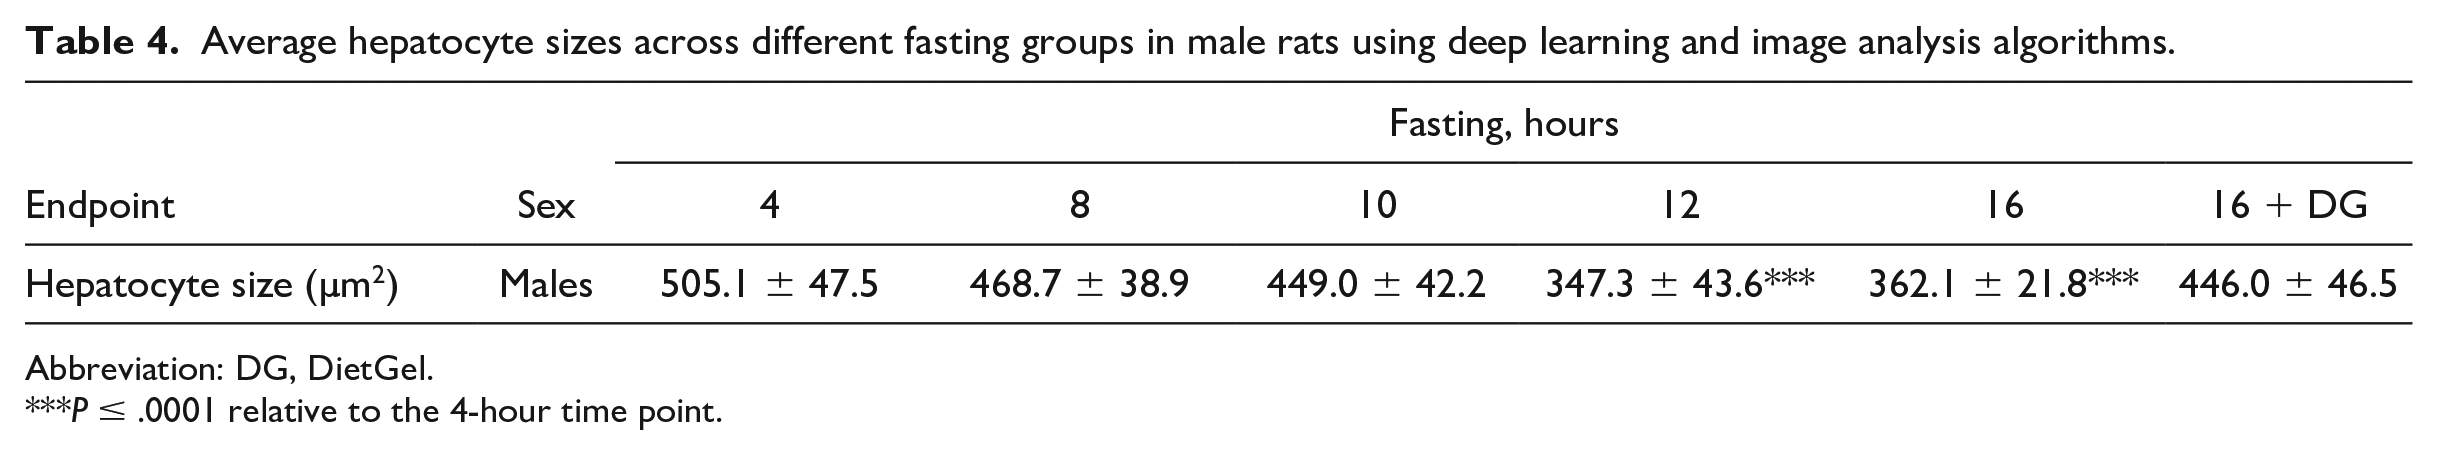
Long Fasting Times Caused Reduction in Liver Weights and Hepatocyte Size
As previously mentioned, organ weights were only assessed in males and the only organ weight change that was considered biologically relevant was the liver weight (Table 3). Regardless of the supplementation status, a decrease in liver weight and liver/body weight ratio was observed at the ≥8-hour time points. This decrease in liver weight correlated with the digital and histopathologic observations of decreased hepatocyte size (Figure 2A and B; Table 4). The decreased hepatocyte size was indicative of decreased hepatocellular glycogen contents due to the significant reduction of cytoplasmic rarefaction within the hepatocytes over time as shown in Figure 2A. Other organs with minimal increase in weight with no histopathologic correlates included the kidneys (≥8-hr time points), heart (nonsupplementation 16-hr time point), and the brain (≥12-hour time points). Given the lack of histopathologic correlation, these increases were considered relative because of the decreased body weight in these groups.
Organ weight and organ/body weight ratio (%) from male rats fasted for different time periods with or without supplementation.
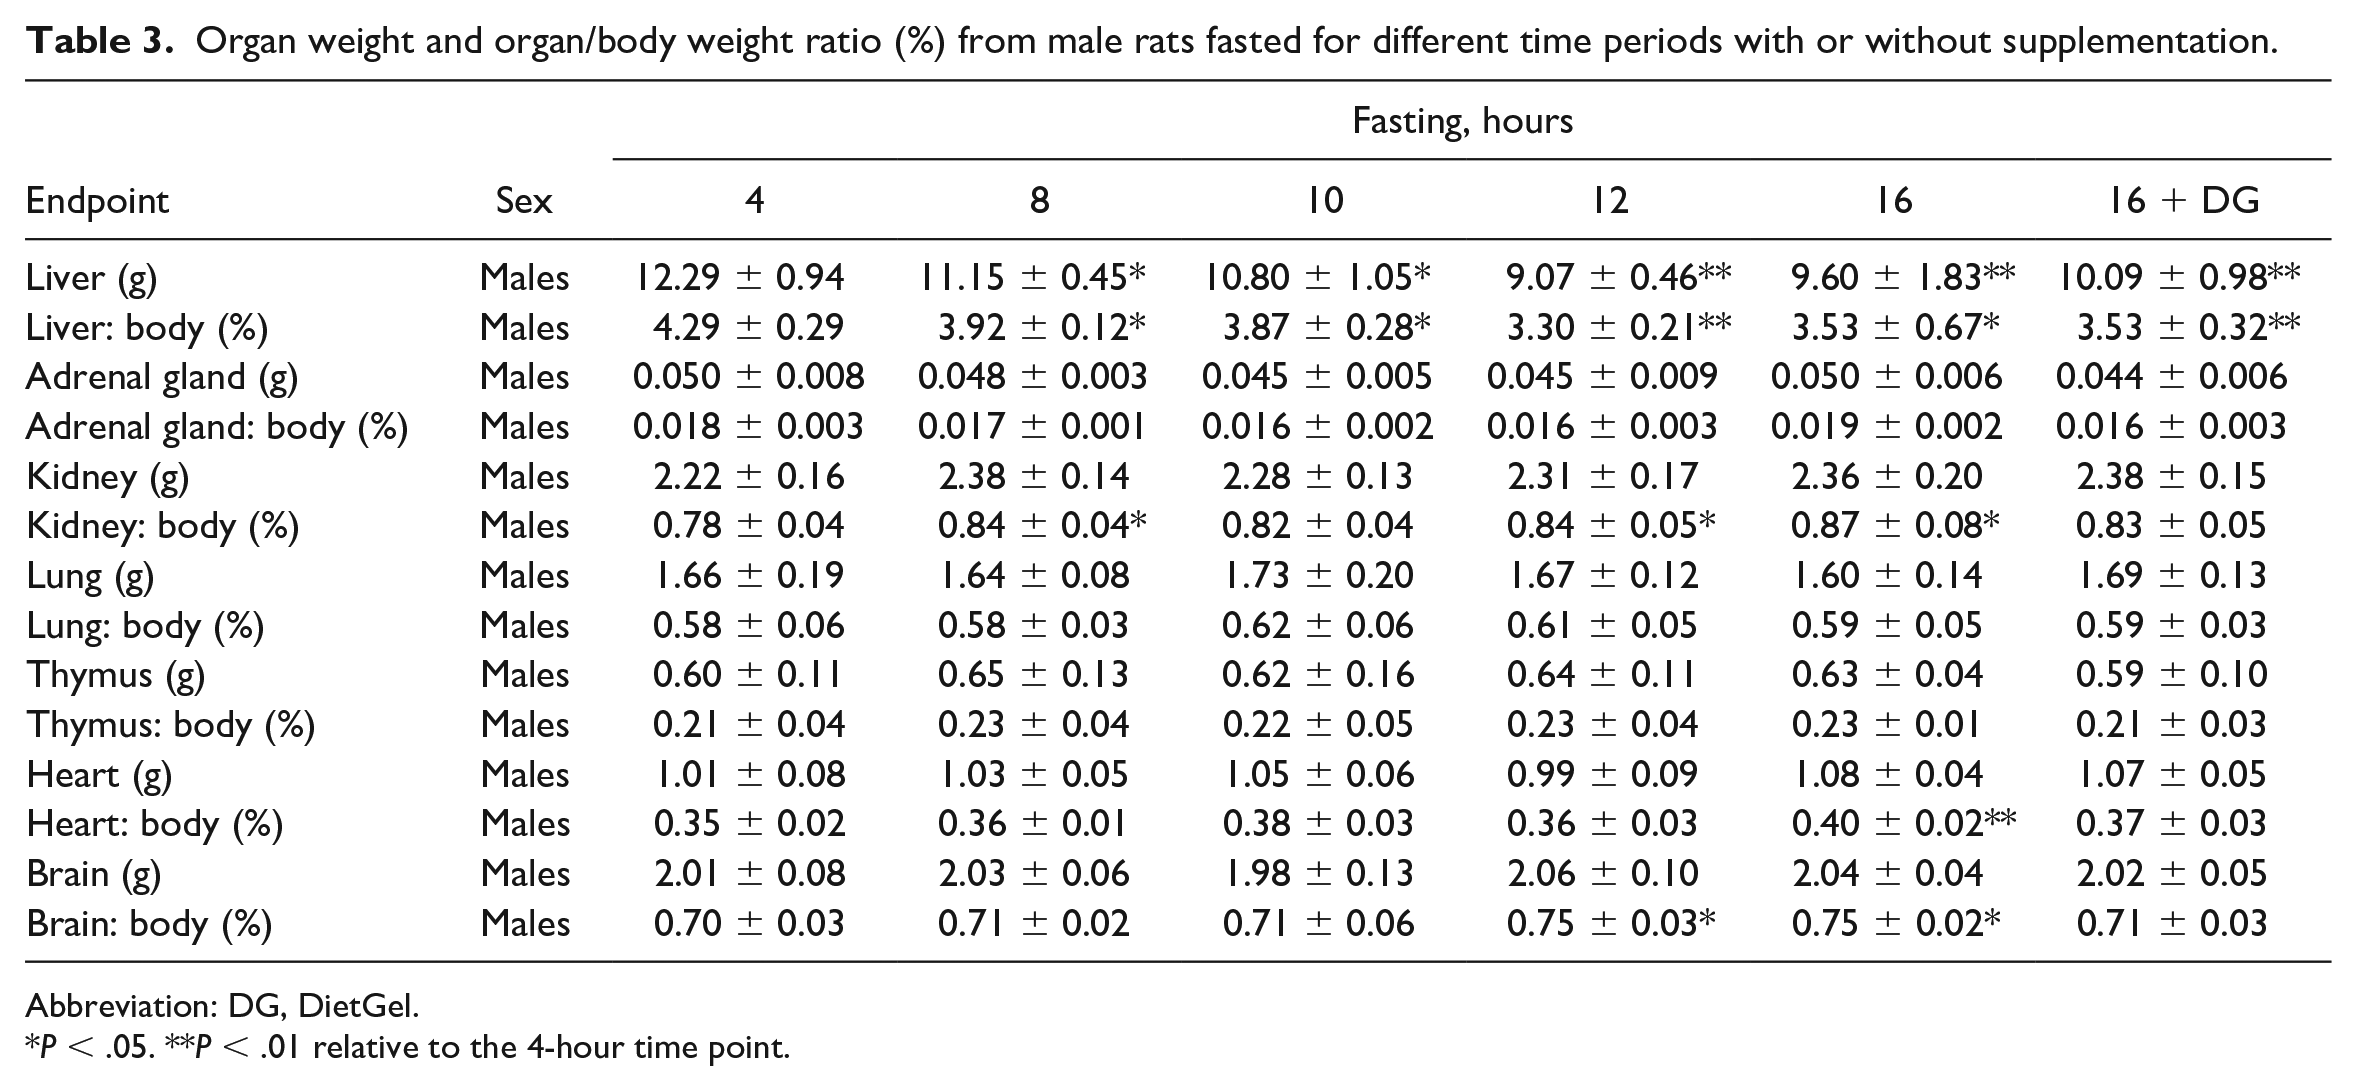
Abbreviation: DG, DietGel.
P < .05. **P < .01 relative to the 4-hour time point.
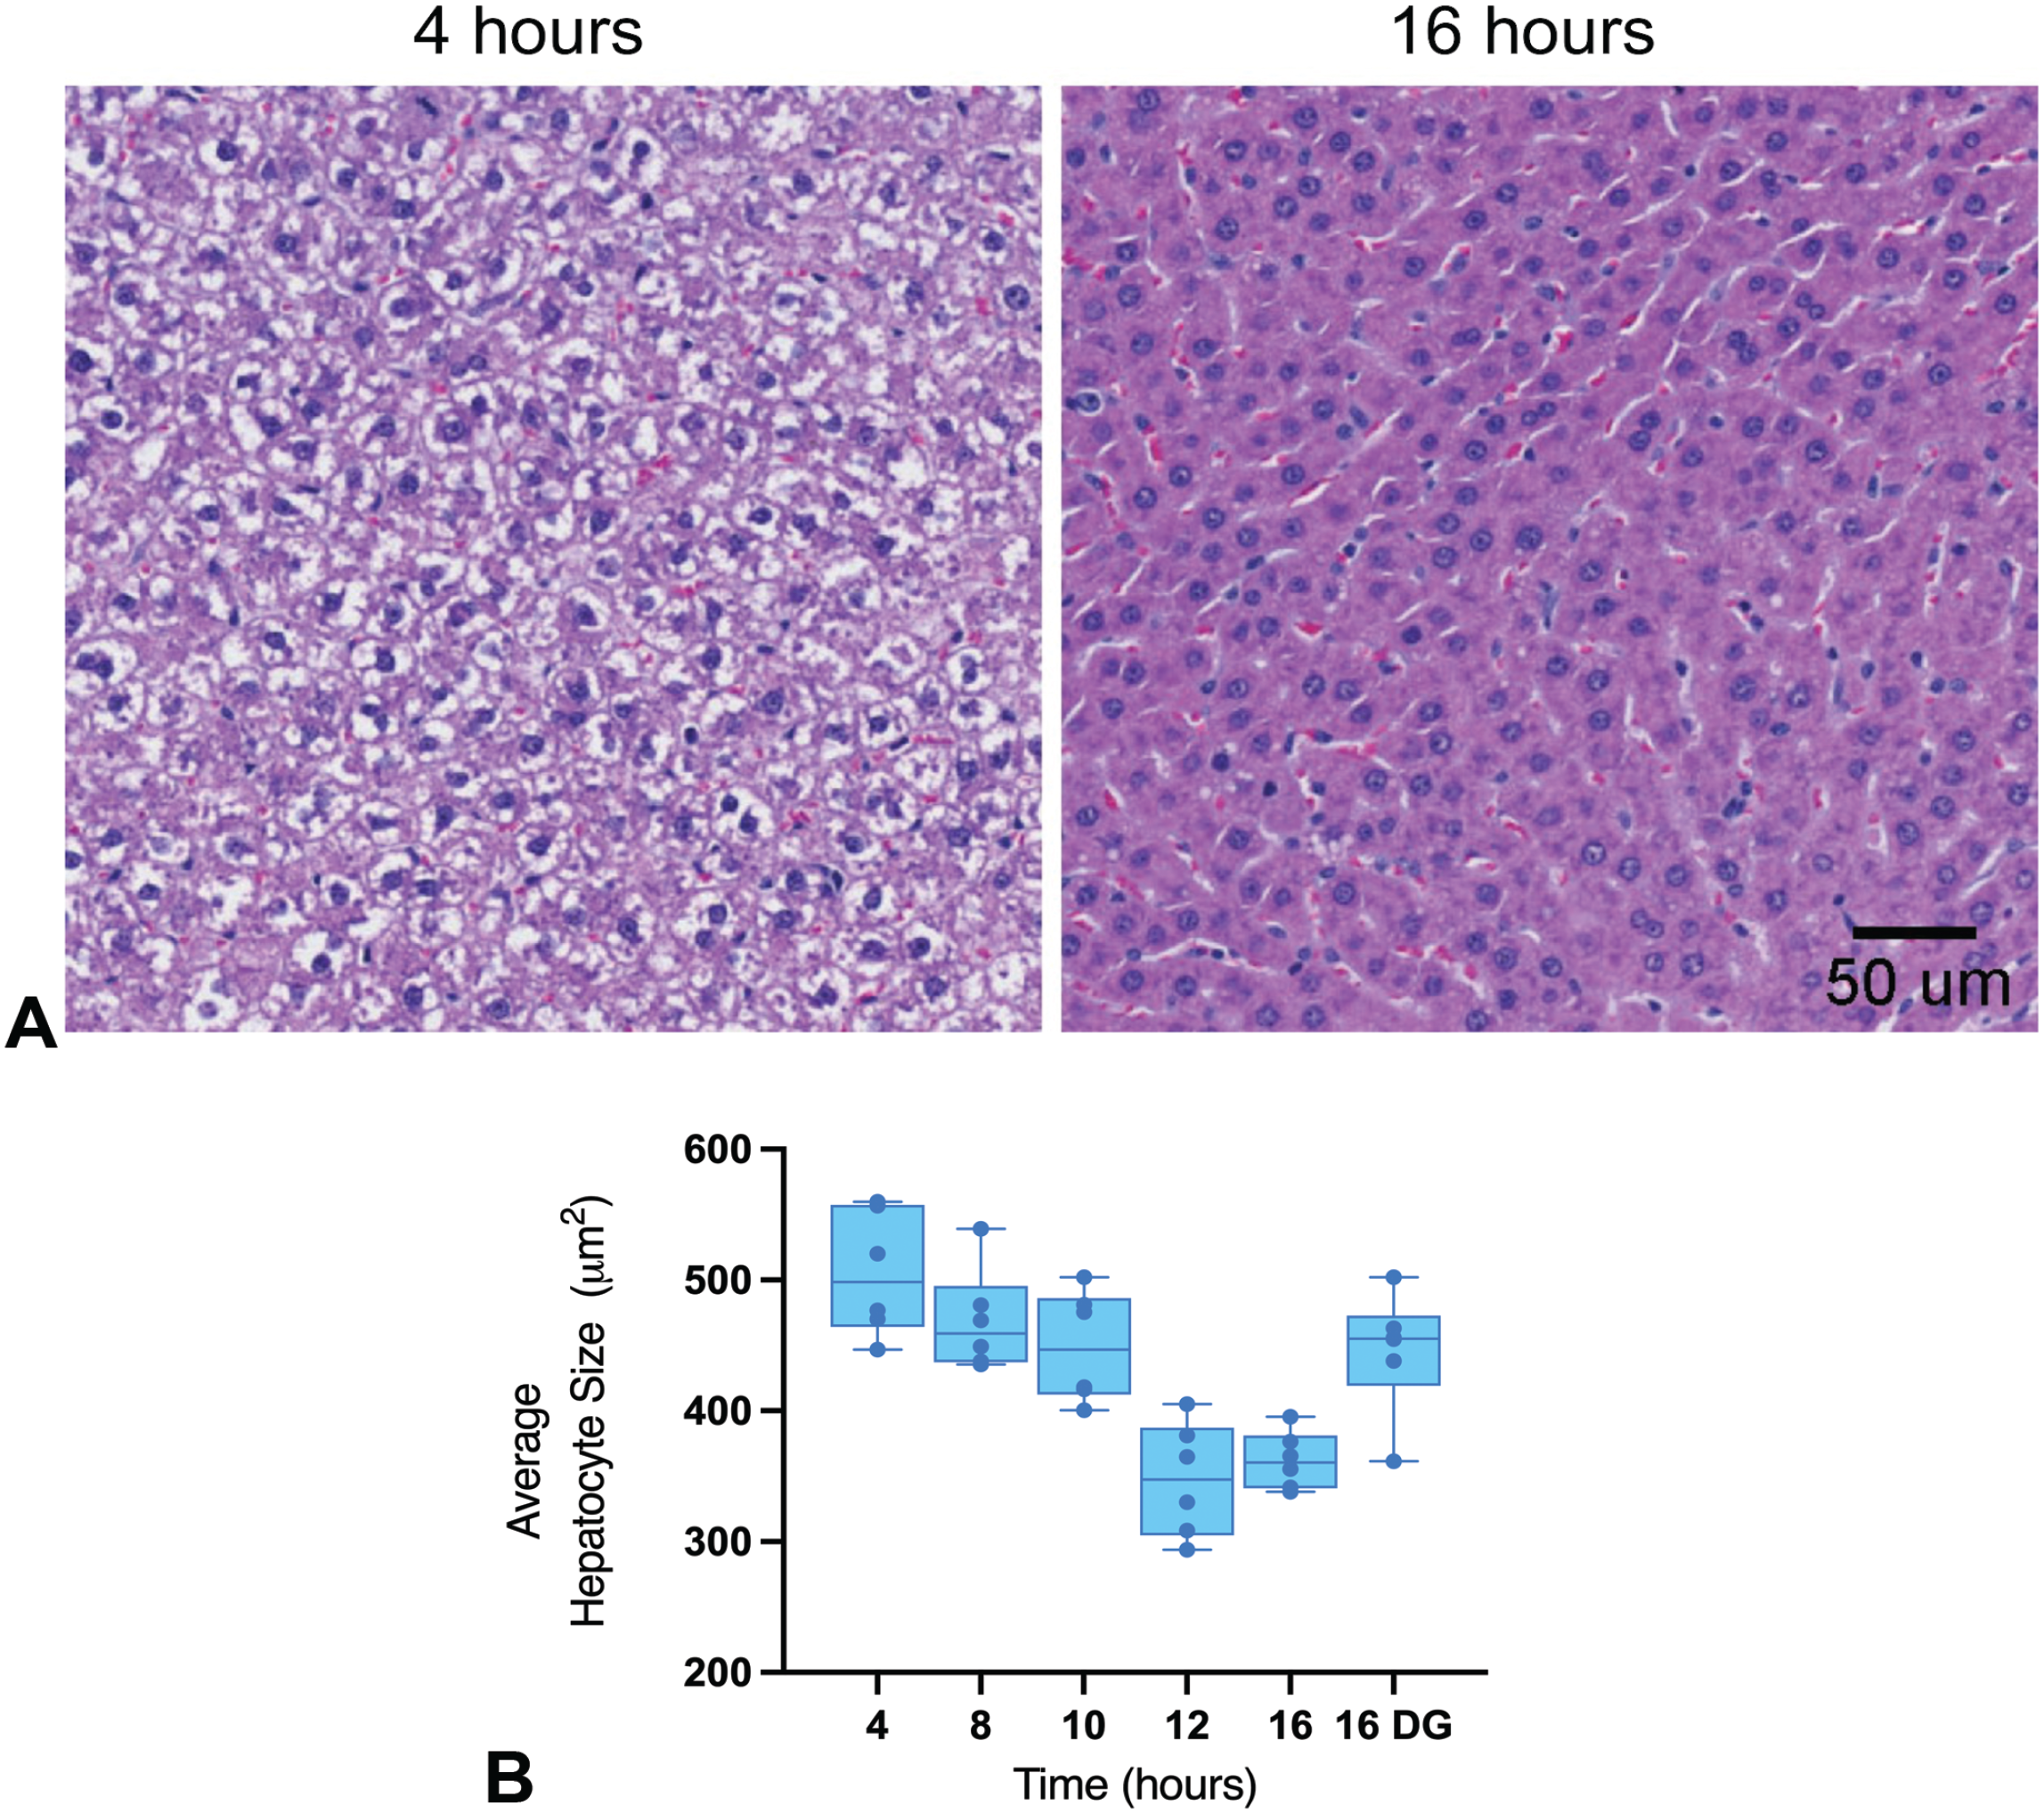
(A) Representative histology images of the liver from Sprague-Dawley rats at 4 hours of fasting versus 16 hours of fasting. The hepatocytes from the 4-hour time point showed hepatocellular hypertrophy along with cytoplasmic rarefaction due to glycogen accumulation, while these features were absent at the 16-hour time point. (B) Average hepatocyte sizes across different fasting groups. Average hepatocyte sizes were calculated and compared across different groups using deep learning and image analysis algorithms as described in the materials and methods. HG indicates HydroGel; DG, DietGel.
Average hepatocyte sizes across different fasting groups in male rats using deep learning and image analysis algorithms.
Abbreviation: DG, DietGel.
P ≤ .0001 relative to the 4-hour time point.
No Major Biologically Significant Changes in Hematology
Fasting up to 16 hours with or without the DG supplement did not cause any major biologically significant changes in the hematology parameters evaluated (Table 5). That said, relative to the 4-hour time point, minimal increases in hematocrit and hemoglobin concentrations were observed in female rats at the ≥ 8-hour time point regardless of the supplementation status of the animals. In male rats fasted for 16 hours without supplementation, minimal increase in hematocrit was observed. These minimal increases in some of the red cell mass parameters were likely due to underlying minor dehydration as a result of reduced blood volume from prolonged fasting.
Hematology results from rats fasted for different time periods with or without supplementations.
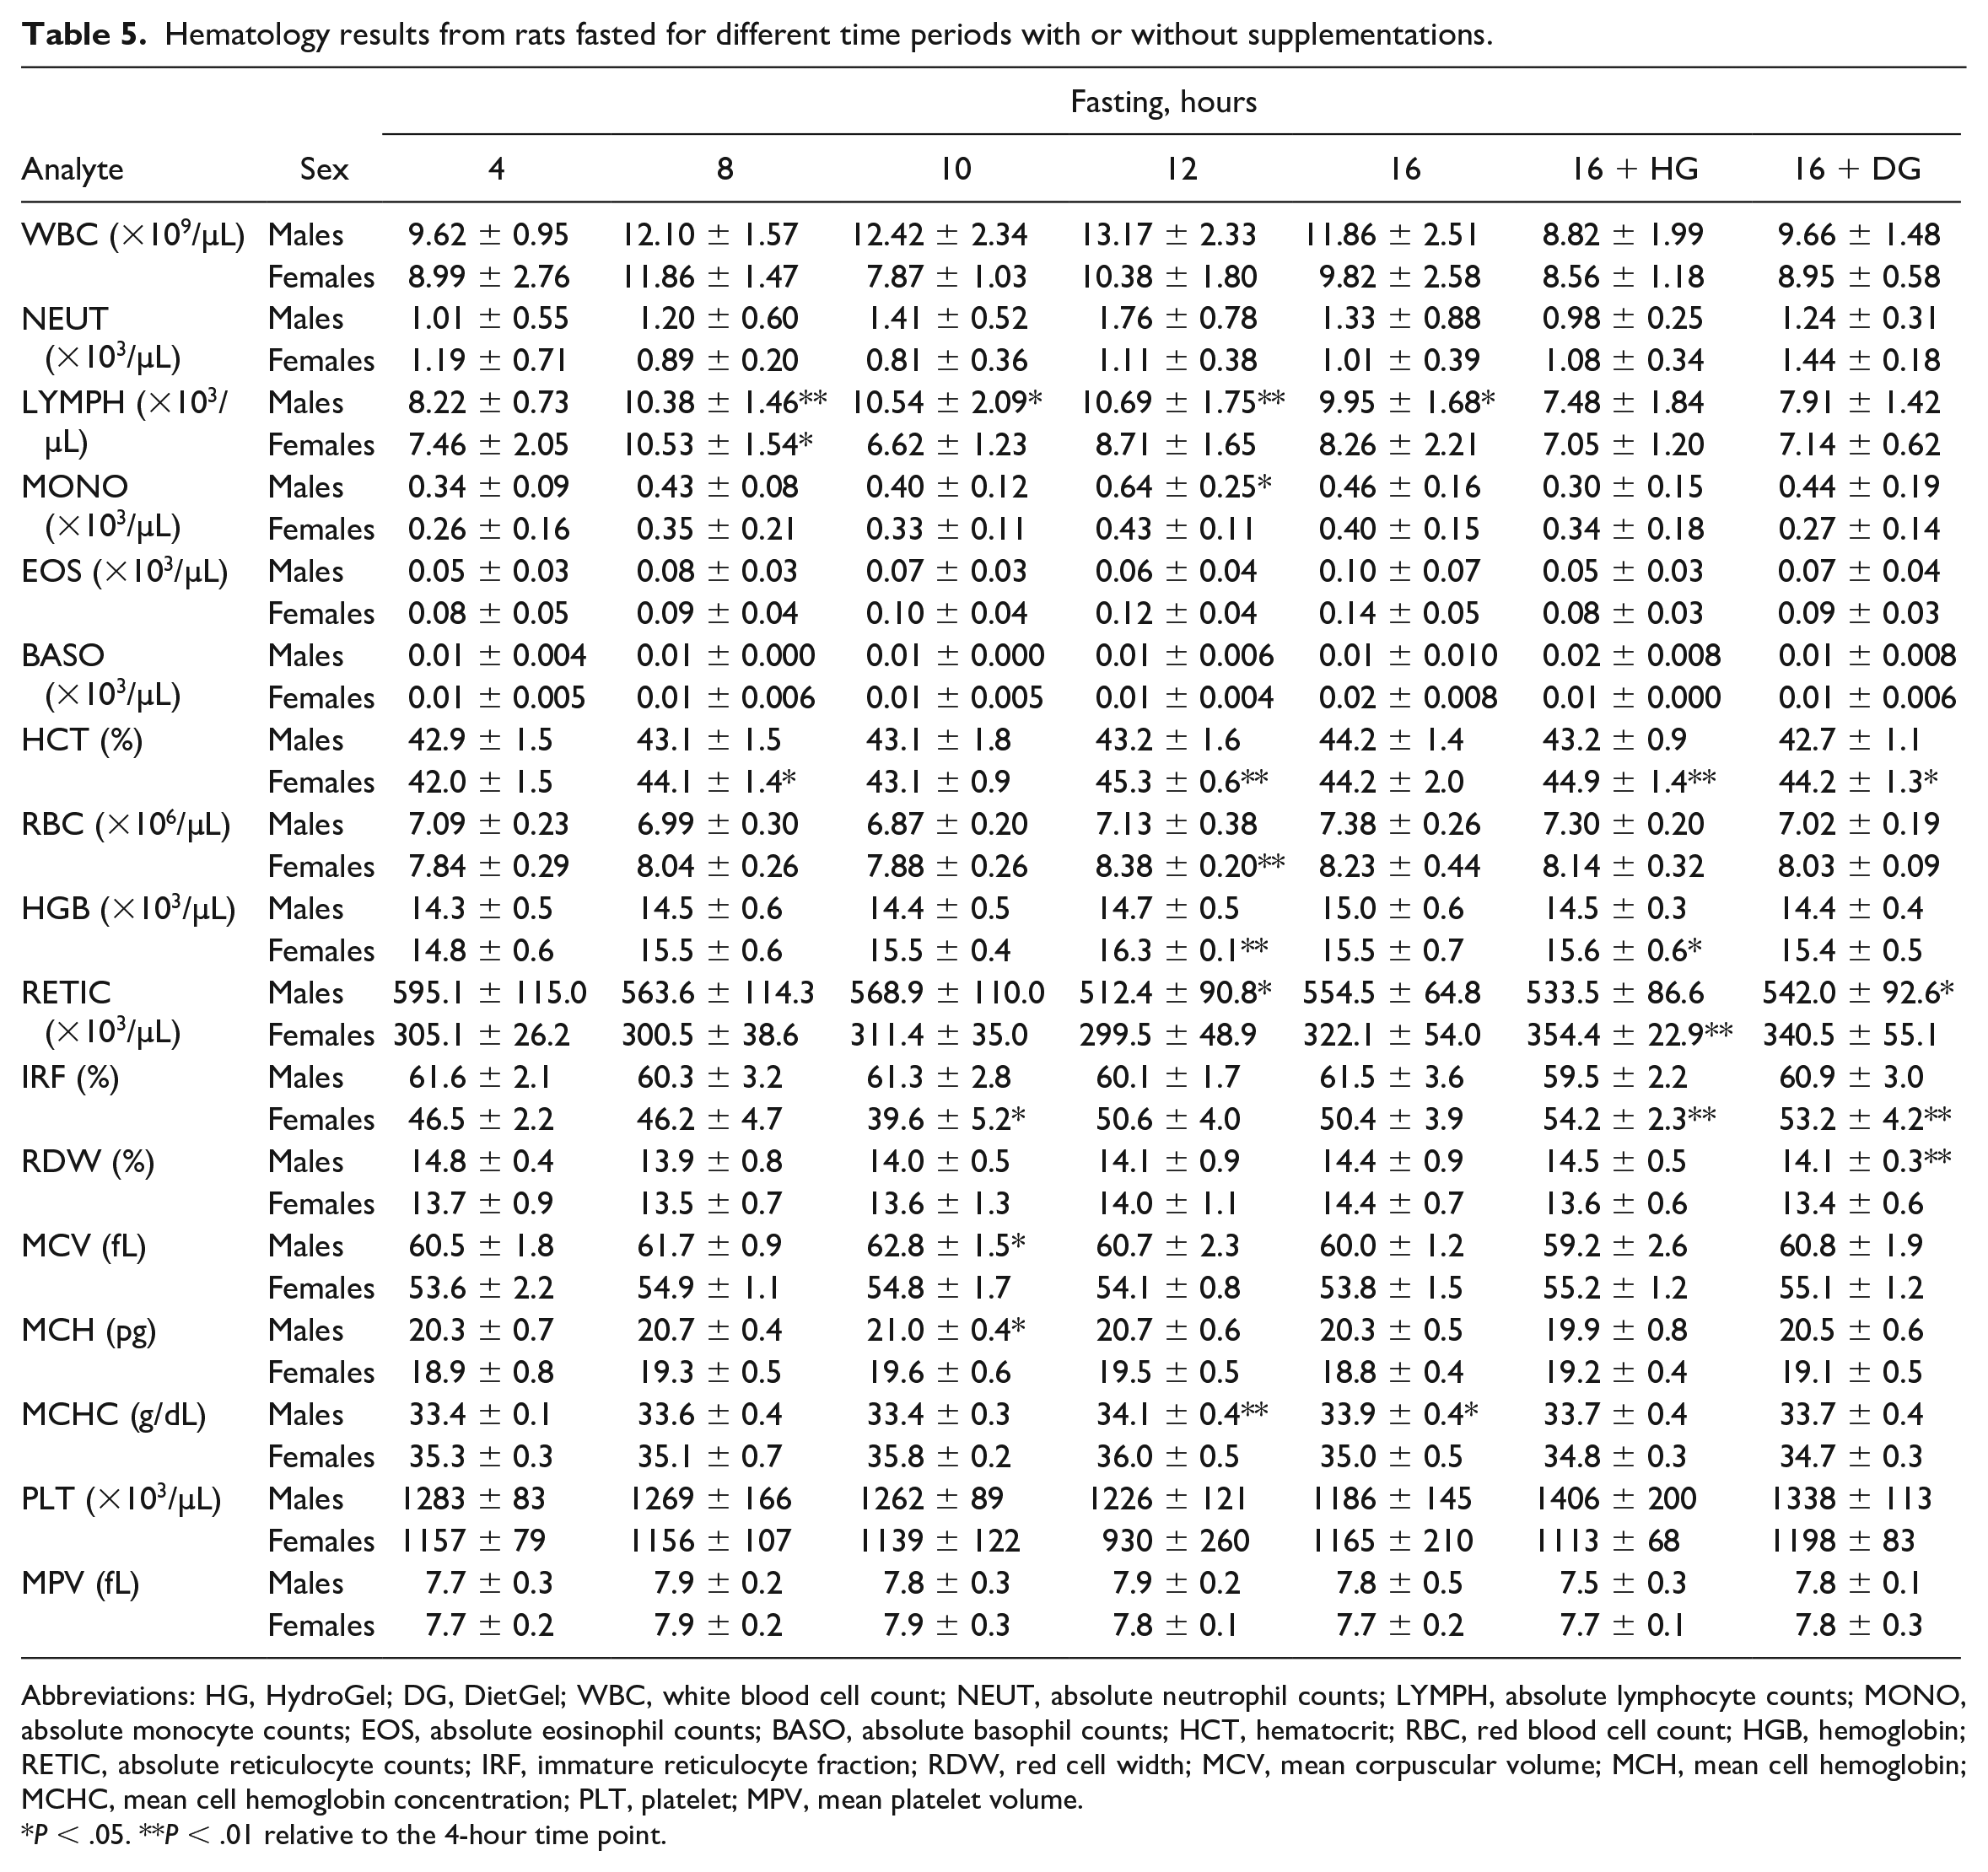
Abbreviations: HG, HydroGel; DG, DietGel; WBC, white blood cell count; NEUT, absolute neutrophil counts; LYMPH, absolute lymphocyte counts; MONO, absolute monocyte counts; EOS, absolute eosinophil counts; BASO, absolute basophil counts; HCT, hematocrit; RBC, red blood cell count; HGB, hemoglobin; RETIC, absolute reticulocyte counts; IRF, immature reticulocyte fraction; RDW, red cell width; MCV, mean corpuscular volume; MCH, mean cell hemoglobin; MCHC, mean cell hemoglobin concentration; PLT, platelet; MPV, mean platelet volume.
P < .05. **P < .01 relative to the 4-hour time point.
There were no significant differences in other red blood cell parameters. Similarly, there were no significant differences in the white blood cell- and platelet-related parameters.
Triglycerides and Glucose Serum Concentrations Were the Most Impacted Serum Chemistry Parameters in Long Versus Short Fasting Times
While there were generally minimal to no changes in most of the serum chemistry parameters between the fasting times, triglycerides (TRIG) and glucose (GLU) concentrations were moderately impacted at the long fasting times. Relative to the 4-hour fasting time, moderate decreases in TRIG (~45% decrease) and GLU (~31% decrease) were observed at ≥12 hours of fasting without supplement in both sexes (Table 6; Figure 3A and B). Other notable changes included minimal to mild decreases in serum creatinine (CREA) (~44% decrease) and cholesterol (CHOL) (~19% decrease) concentrations in males, at the ≥10- or ≥12-hour fasting times, respectively (Table 6; Figure 3C). Furthermore, there were decreases in alkaline phosphatase (ALP) (~40% decrease) at the ≥8-hour and 16-hour fasting times in male and female rats, respectively (Table 6; Figure 3D).
Serum chemistry results from rats fasted for different time periods with or without supplementations.
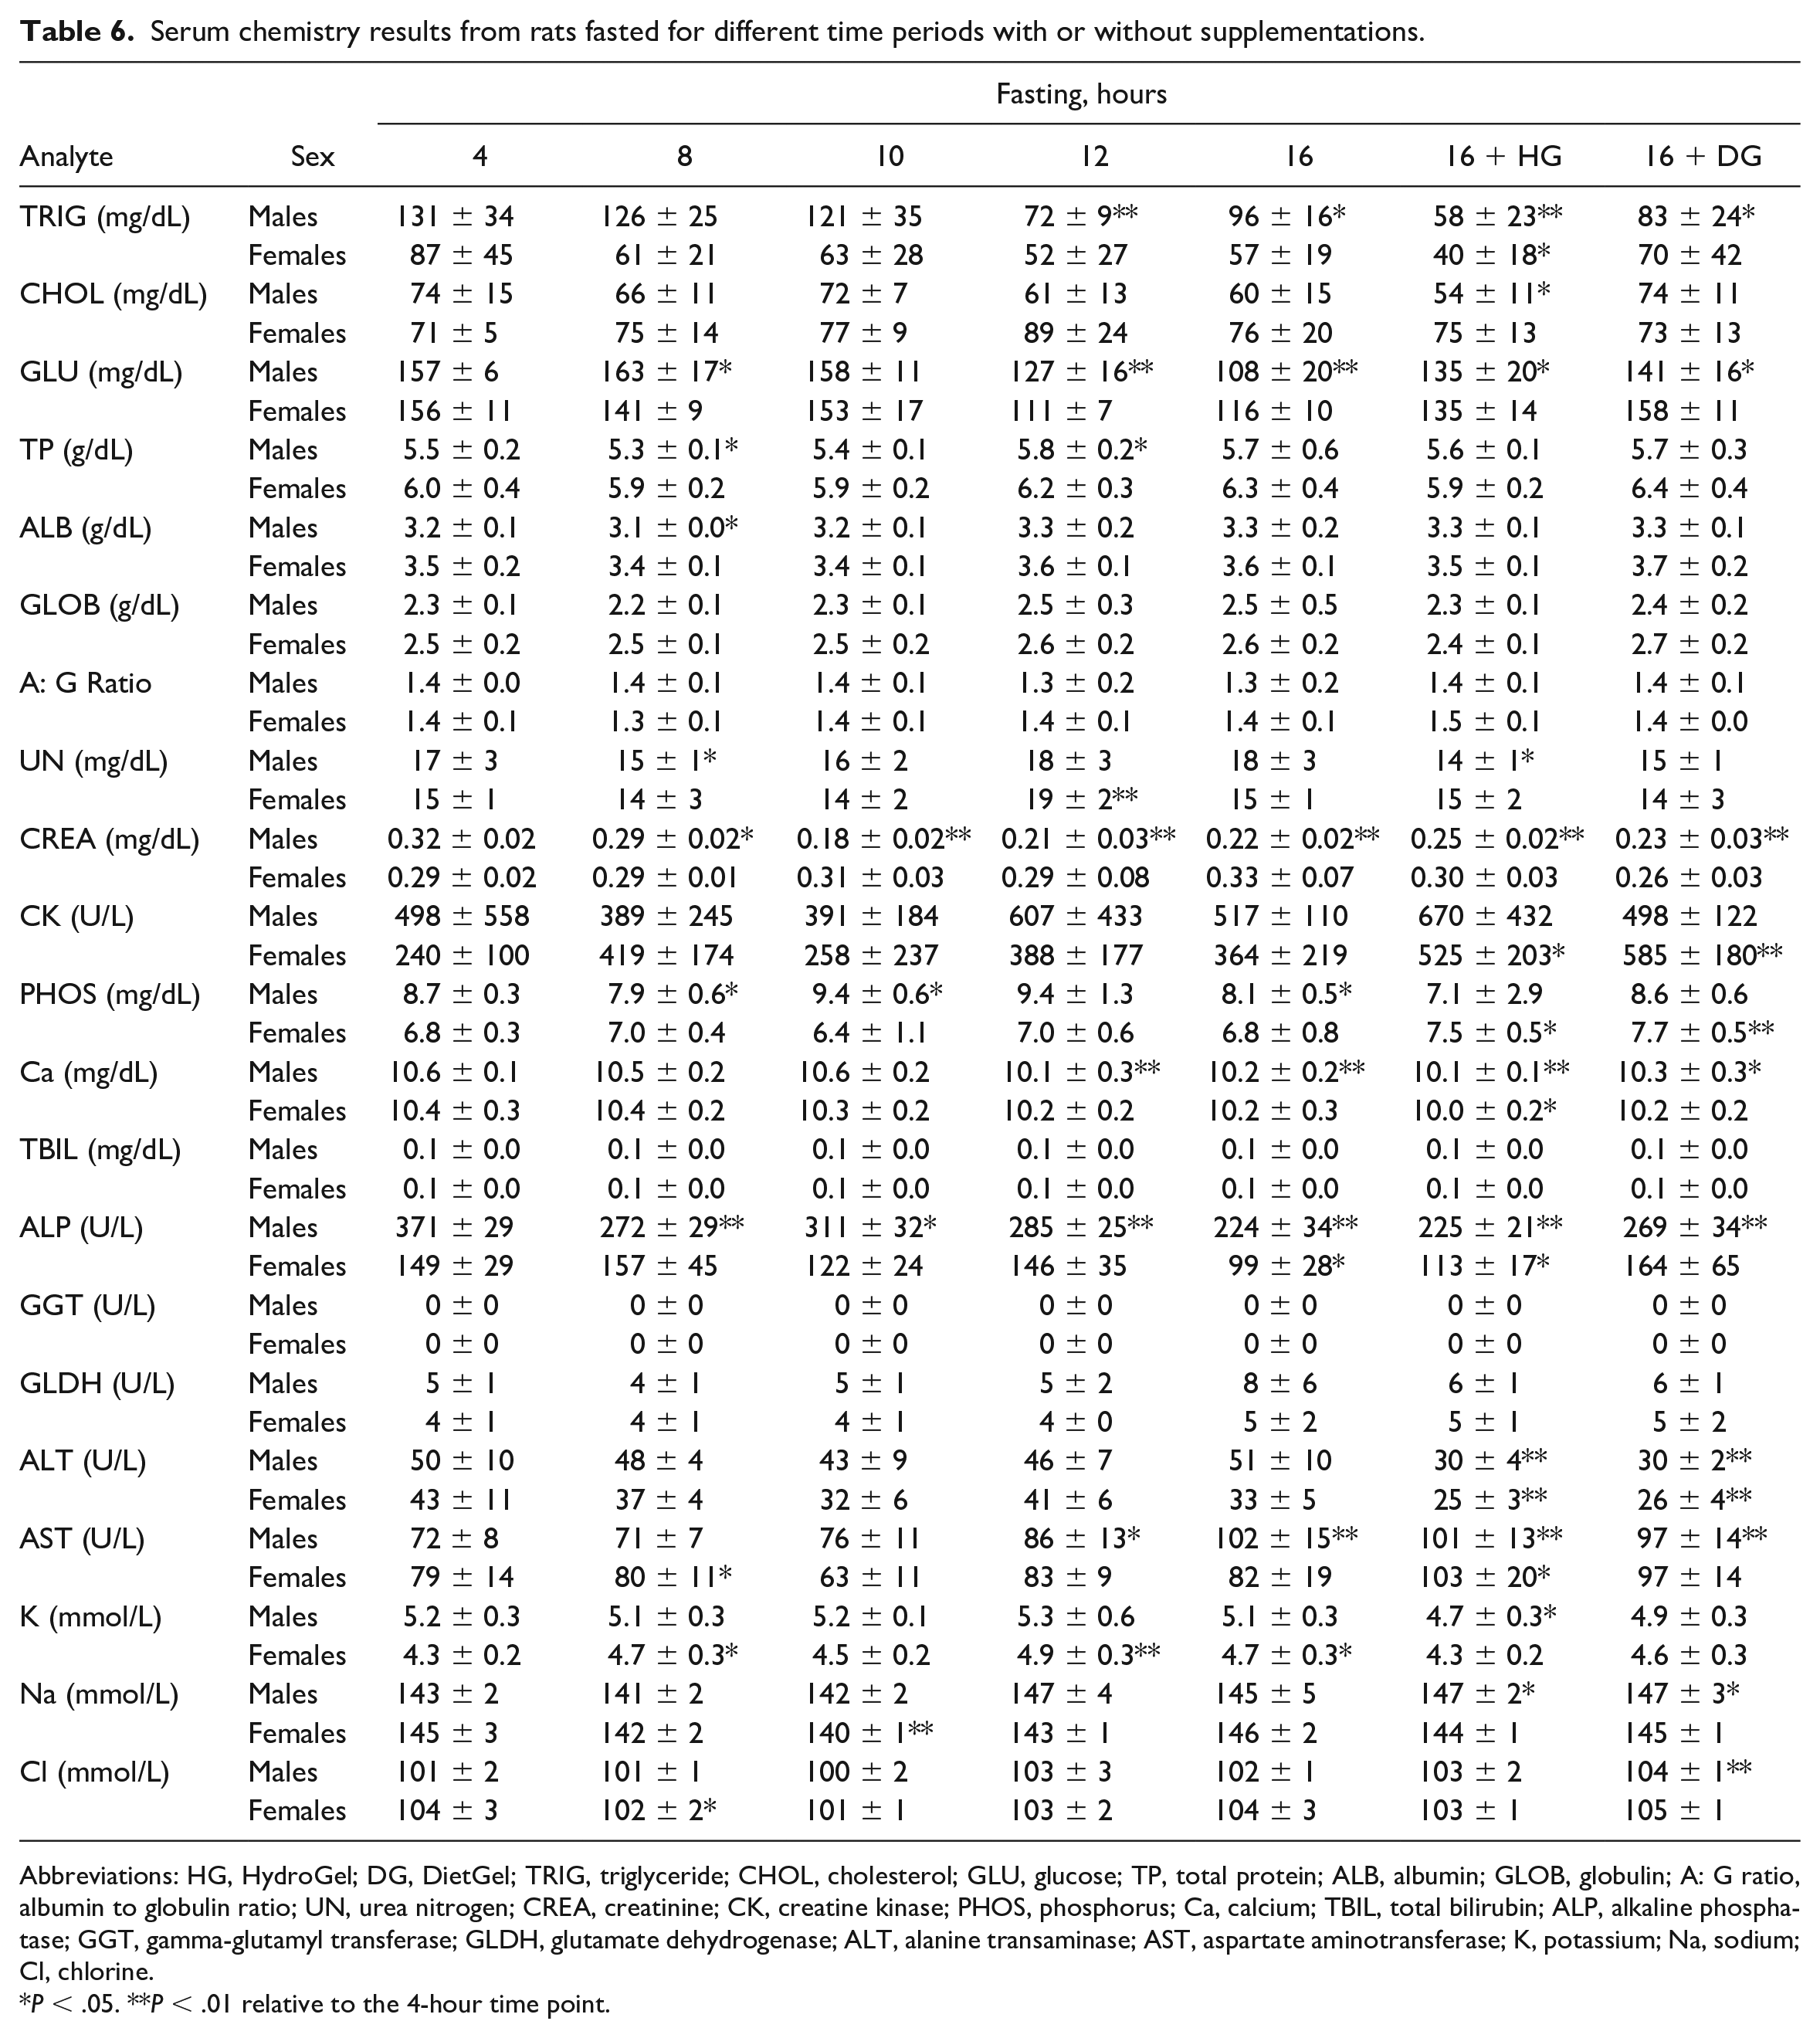
Abbreviations: HG, HydroGel; DG, DietGel; TRIG, triglyceride; CHOL, cholesterol; GLU, glucose; TP, total protein; ALB, albumin; GLOB, globulin; A: G ratio, albumin to globulin ratio; UN, urea nitrogen; CREA, creatinine; CK, creatine kinase; PHOS, phosphorus; Ca, calcium; TBIL, total bilirubin; ALP, alkaline phosphatase; GGT, gamma-glutamyl transferase; GLDH, glutamate dehydrogenase; ALT, alanine transaminase; AST, aspartate aminotransferase; K, potassium; Na, sodium; Cl, chlorine.
P < .05. **P < .01 relative to the 4-hour time point.
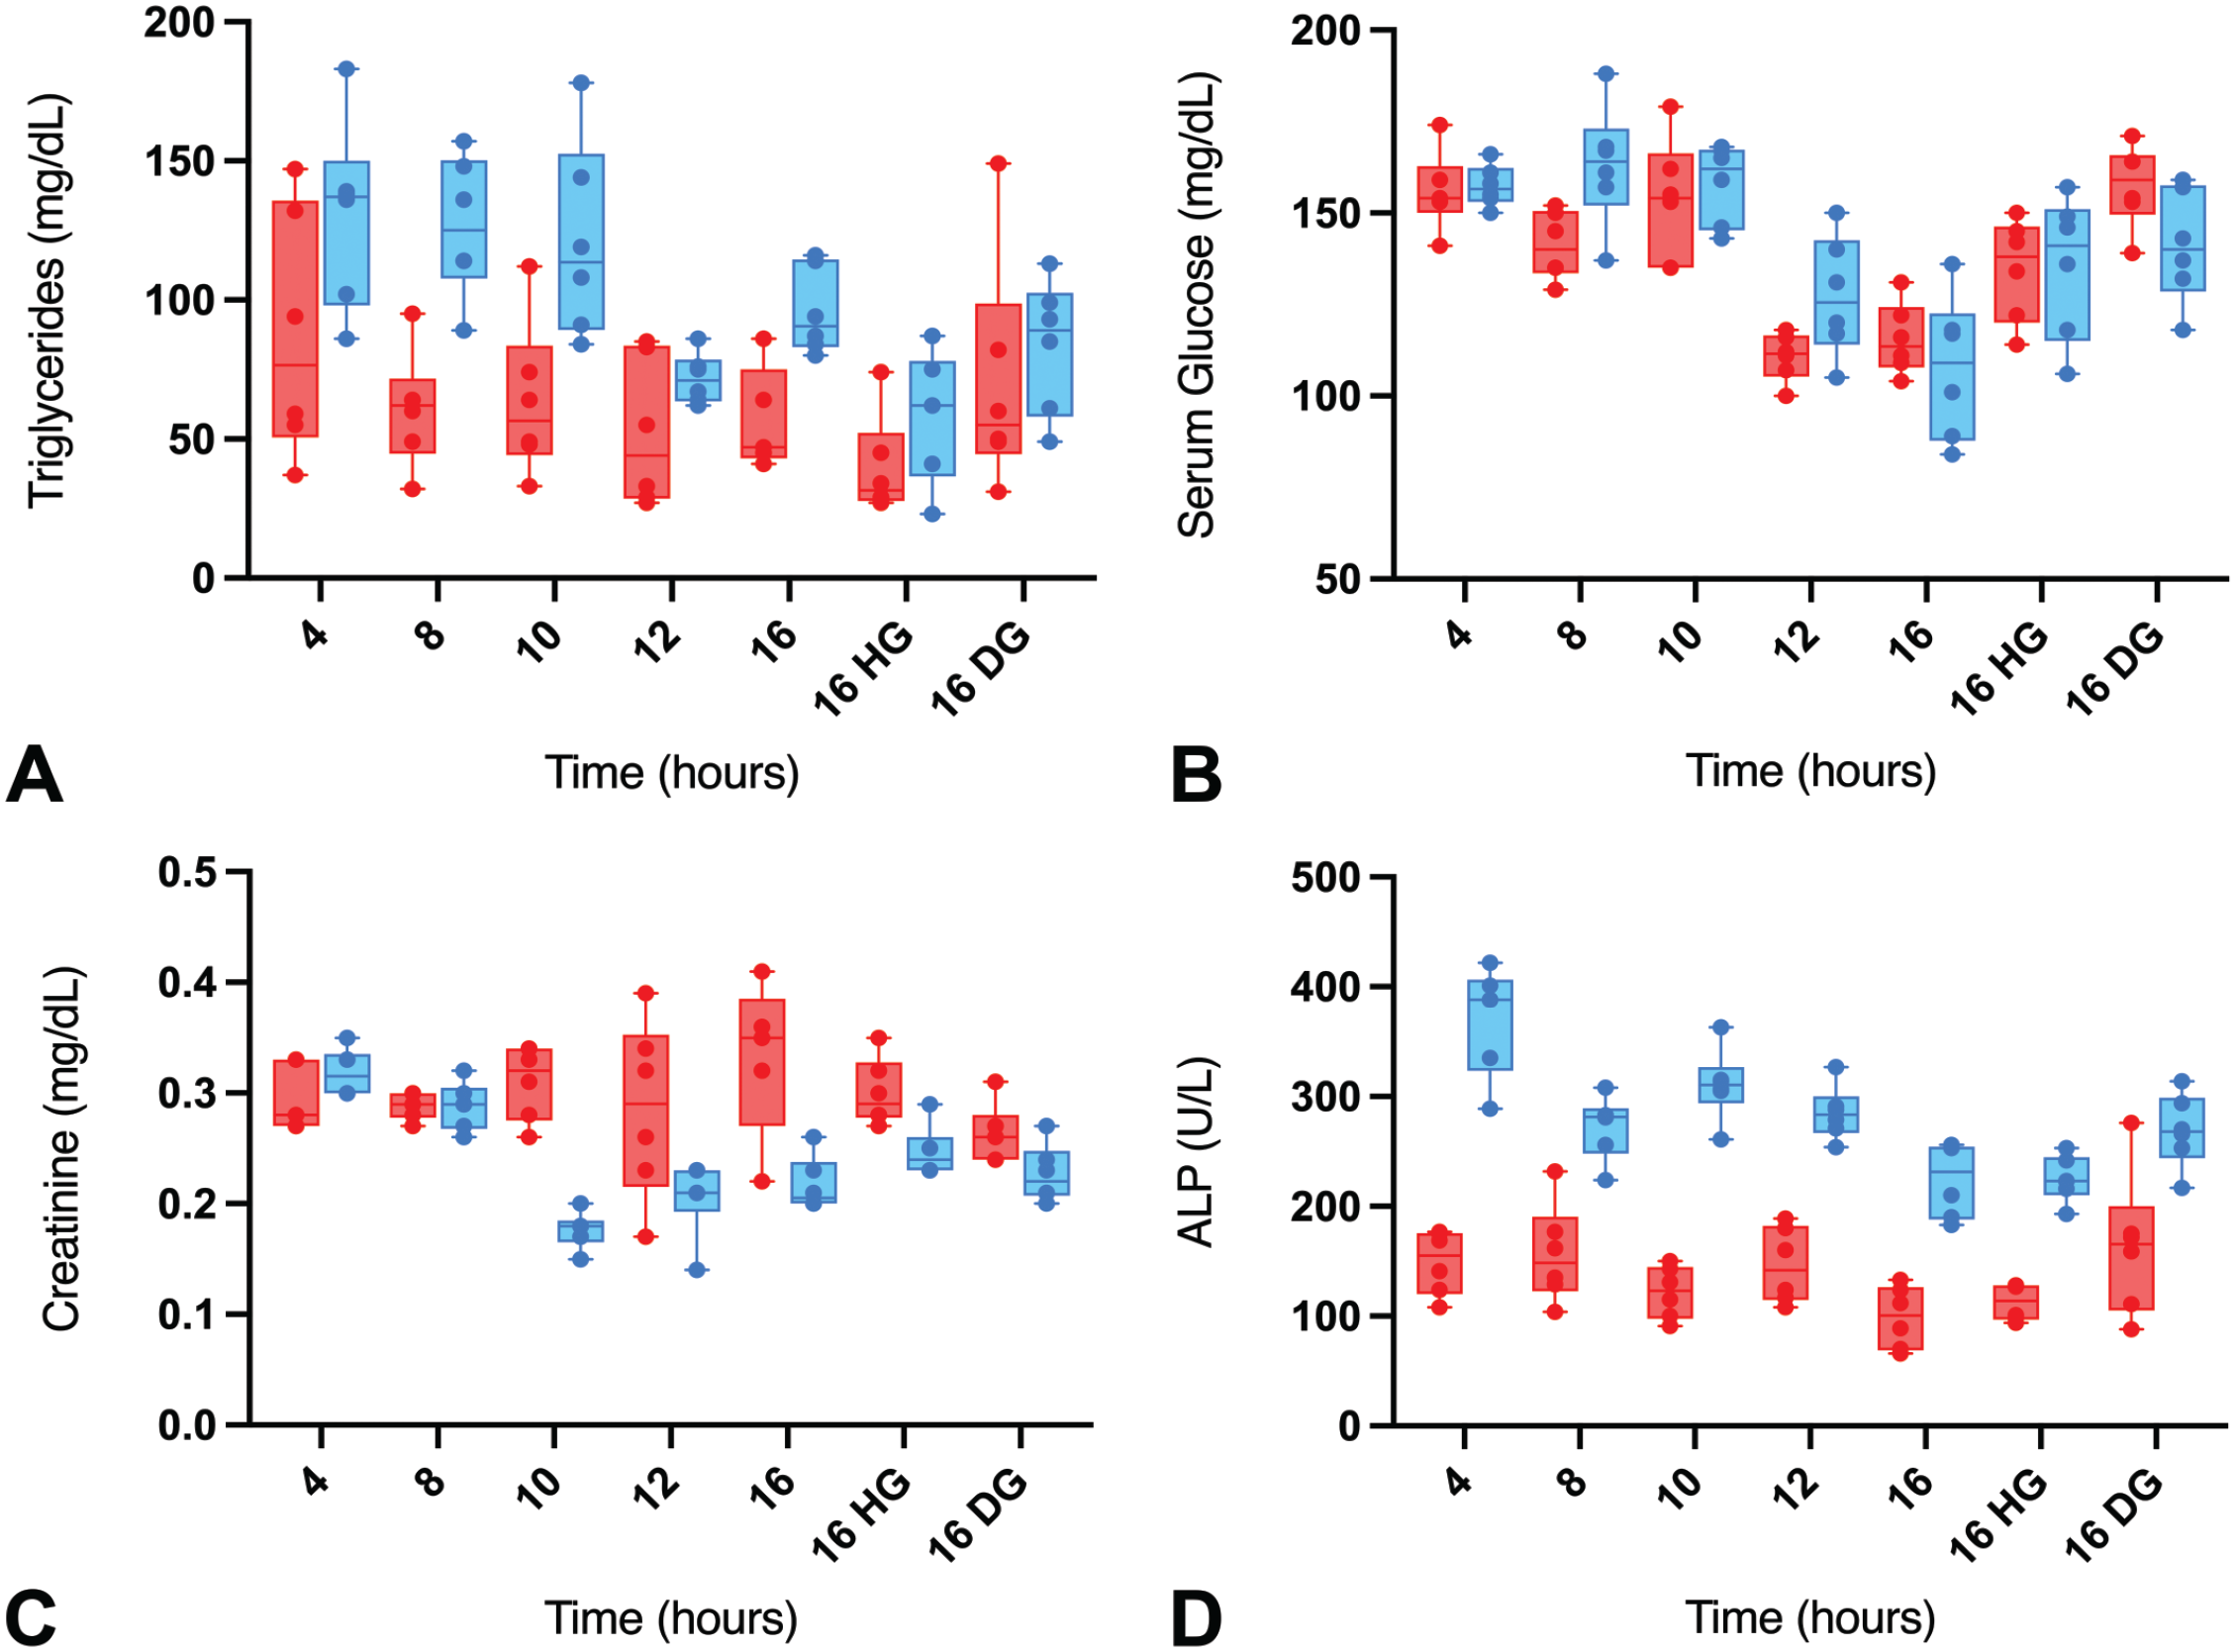
Serum triglyceride (A), glucose (B), creatinine (C), and ALP (D) concentrations (mg/dL) over different fasting times in male (blue) and female (red) Sprague-Dawley rats with or without supplementation. HG indicates HydroGel; DG, DietGel.
DG Supplement Largely Prevented the Serum Chemistry Changes Observed During Long Fasting Times
DietGel is sometimes given to rats to mitigate body weight loss due to overnight fasting during toxicology studies. To assess whether DG supplementation could alter the CP endpoints, we included a DG supplementation group at the 16-hour time point along with an HG group for comparison in a metabolic cage environment. As shown in Table 6 and Figure 3, DG supplementation largely prevented the serum chemistry changes observed in the long fasting times. For instance, GLU and ALP concentrations in the 16-hour fast DG group were largely comparable to the 4-hour fast values (Table 6; Figure 3B and D), while the values of these parameters in the 16-hour fast HG group were comparable to the nonsupplemented 16-hour fast group. In both sexes, the CHOL concentrations were similar in the 16-hour fast DG and 4-hour fast groups, while the TRIG concentrations were comparable in both groups in the female rats (Table 6; Figure 3A and C). Overall, these observations were consistent with the prevention of body weight loss observed in the 16-hour fast group in females.
Increased Triglyceride Concentrations Variability Mostly Associated With Short Fasting Times and Supplements Availability
While decreases in TRIG were observed in the long fasting times (≥12 hours), the TRIG concentrations at the earlier time points indicated higher variability between individual animals as supported by higher standard deviations (Table 6) and wider confidence intervals (Figure 3A). The variability was much higher in the male rats at the 4- to the 10-hour fasting times, and in females at the 4- to the 12-hour fasting times. In the supplementation groups, higher TRIG concentration variability was observed in males given both HG and DG supplements, while the variability was largely limited to the DG supplement in females.
Serum Chemistry Changes Limited to the HG and DG Supplementation Groups
While most of the hematology and serum chemistry parameters were comparable between the supplemented and the nonsupplemented groups, we observed the ability of the DG supplement to prevent some of the serum chemistry changes observed at the long fasting hours. However, there were some serum chemistry changes that were only observed in the supplementation groups. These included decreases in alanine transaminase (ALT) and minimal to mild increases in aspartate transaminase (AST) in both HG and DG groups in both sexes, along with minimal to mild increases in creatine kinase (CK) in females in both groups (Table 6). The cause of the AST and CK increases was unknown, but an underlying minimal skeletal muscle injury could not be ruled out, given the differences in the resting platforms of the metabolic cages (made from polycarbonate) of the supplemented groups versus the Allentown cages (made from natural soft cellulose) for the nonsupplemented groups. Nonetheless, similar increases in AST were also observed at the 16-hour time point of the nonsupplemented group in males.
Insulin and Corticosterone (but Not Glucagon) Changed as Expected in Response to Decreased Glucose Concentrations in Long Versus Short Fasting Times
Owing to the decreases in glucose generation from dietary carbohydrates during fasting, the secretions of corticosterone and glucagon are increased, while insulin secretion decreases. 36 To confirm that these endpoints are playing a role in fasted animals, we assessed the concentrations of these hormones at different fasting times and observed decreased insulin concentrations at the ≥12-hour fasting times in both sexes in the nonsupplemented group (~66% decrease) correlating with the decreases in glucose concentrations at these time points (Tables 6 and 7; Figures 3B and 4A). Moreover, at the ≥10-hour fasting time, minimal to mild increases in corticosterone concentrations were observed in both sexes (up to 59% increase) (Table 7 and Figure 4B). For glucagon, inconsistent changes with no specific pattern were observed throughout the fasting duration. For instance, significant increases in glucagon concentrations were observed in males at the 10-hour time point only, while minimal to mild decreases were observed in females at the 8- and 10-hour time points (Table 7). Therefore, the glucagon changes were considered inconclusive, as the inconsistent changes did not conform with our expectation as documented in the literature, 36 and also did not align with the decreased hepatocellular cytoplasmic rarefaction indicative of reduced liver glycogen contents in males at the long fasting time points. For the supplementation groups, the insulin and corticosterone concentrations in the 16-hour fast DG group were largely comparable to the 4-hour fast group in both sexes, while the insulin values in the 16-hour fast HG and the nonsupplemented 16-hour fast groups were similar. These results were consistent with our observations that the DG supplement largely prevented the body weight loss and serum chemistry changes observed in the long fasting times, especially in females.
Results for glucose homeostasis-regulatory proteins from serum of Sprague-Dawley rats fasted for different time periods.
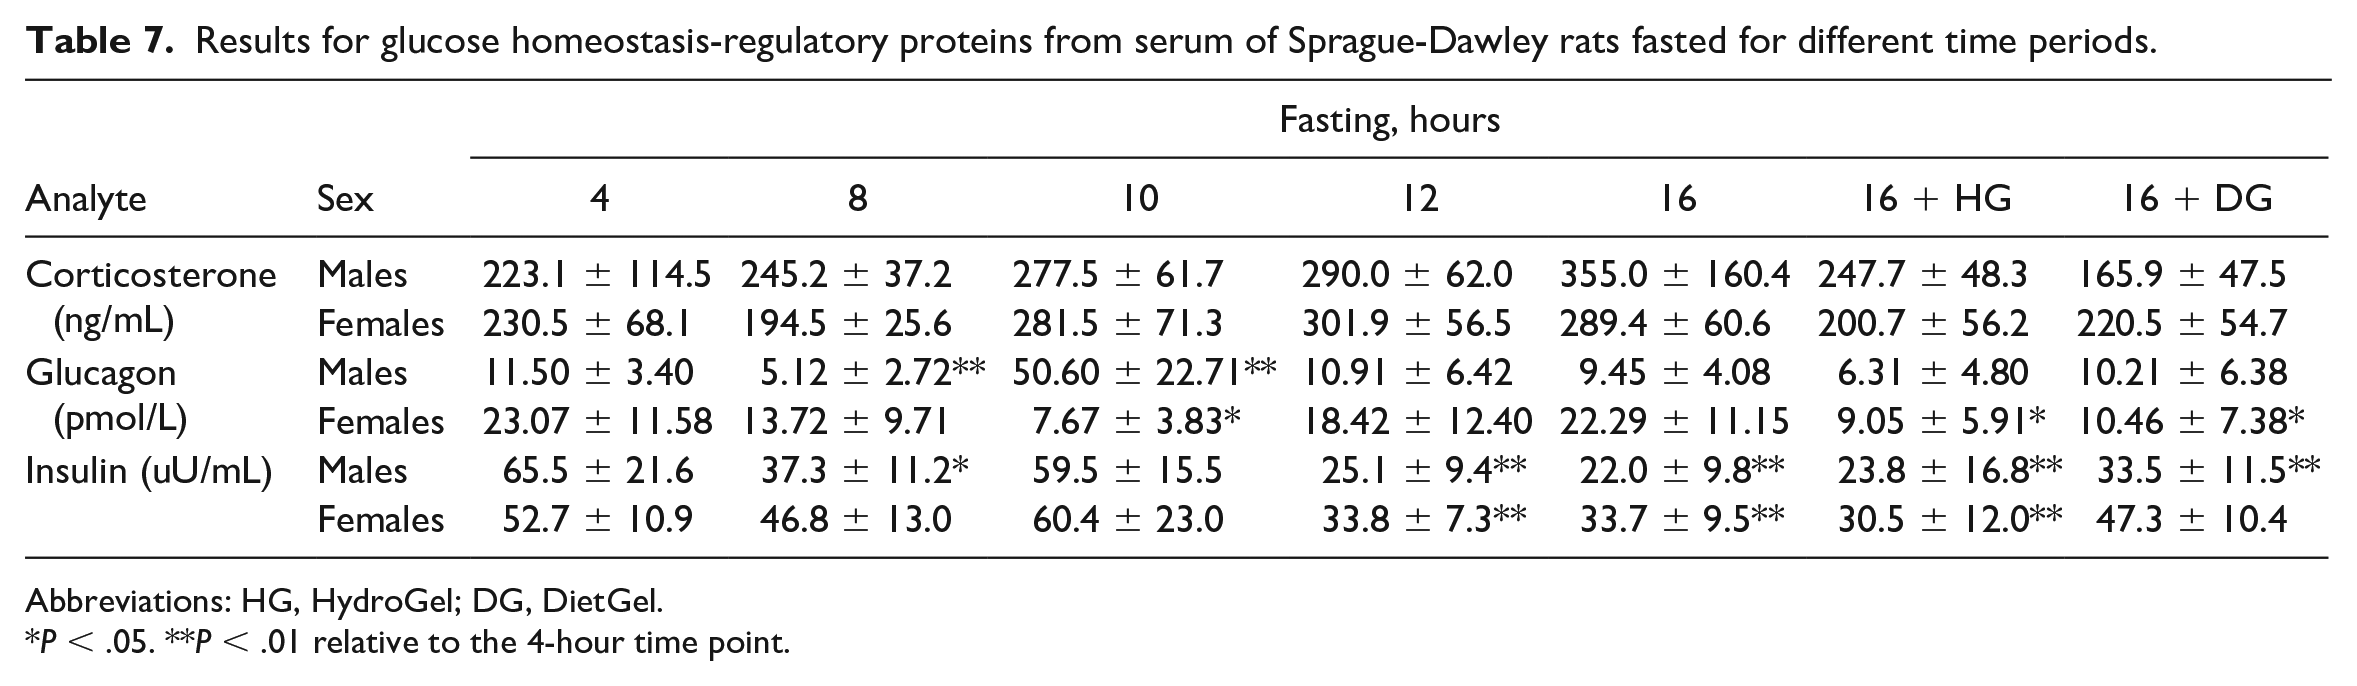
Abbreviations: HG, HydroGel; DG, DietGel.
P < .05. **P < .01 relative to the 4-hour time point.
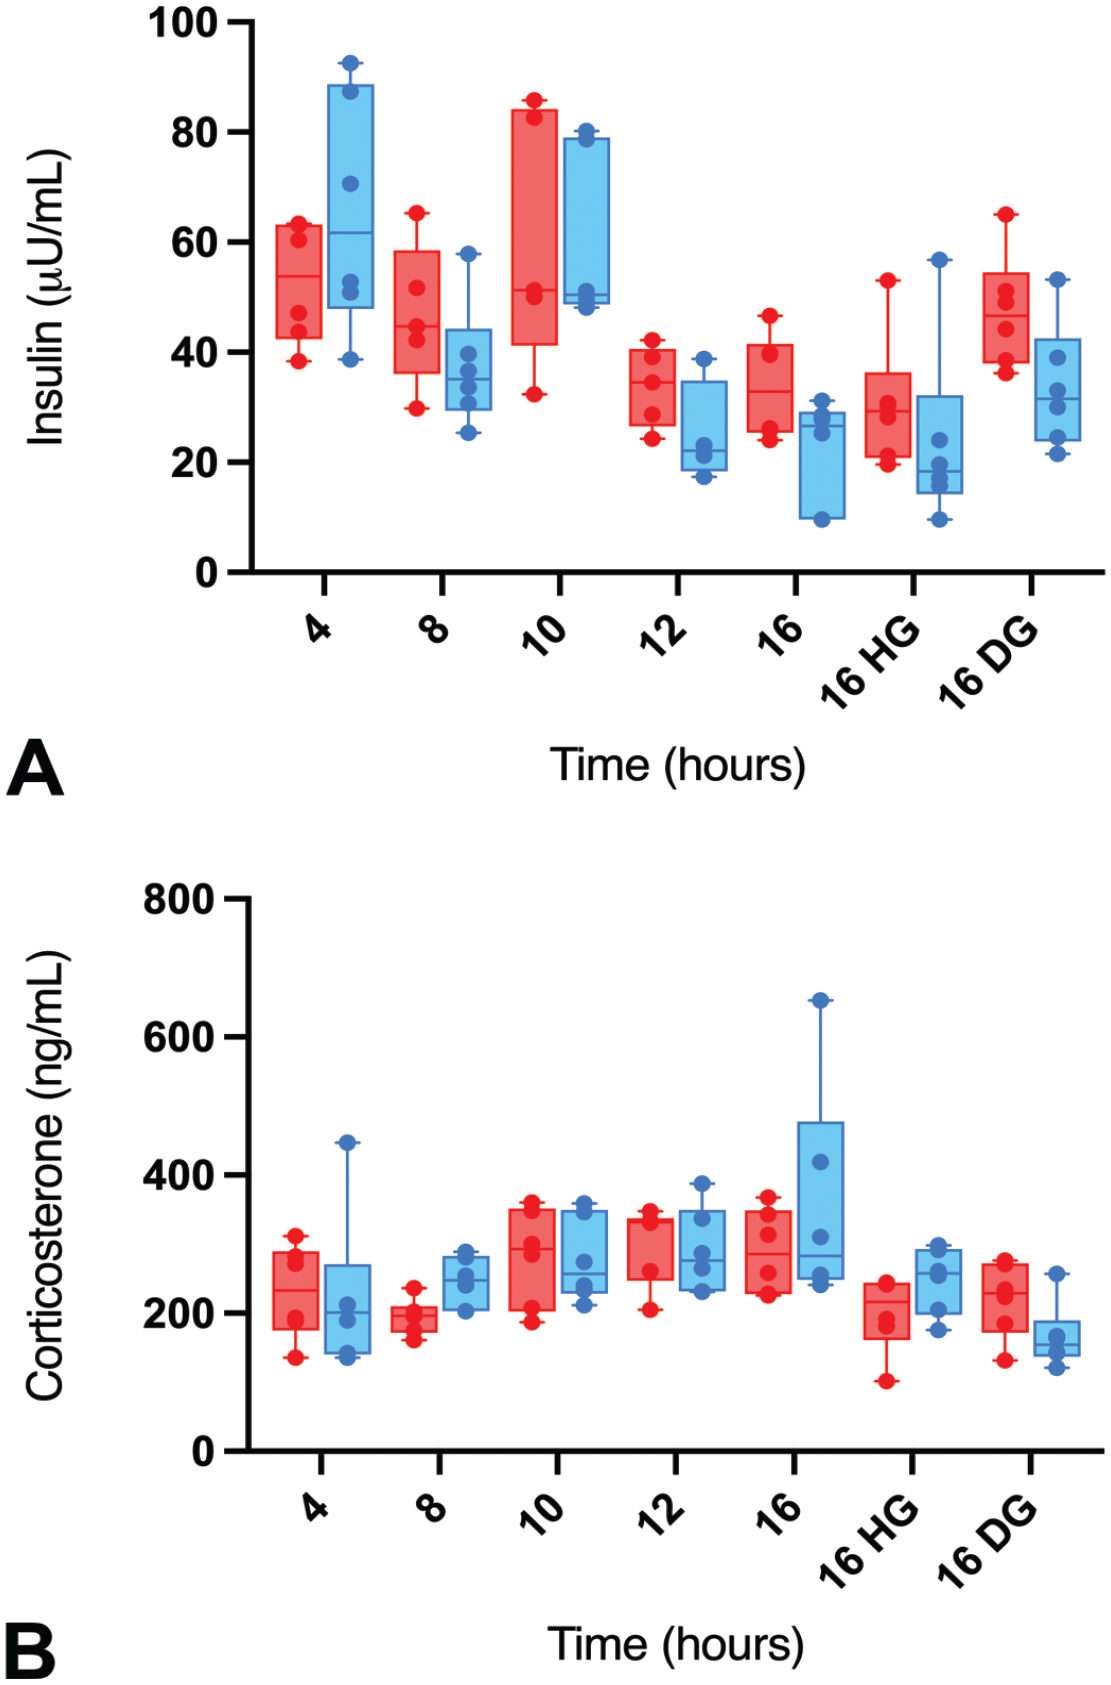
Serum insulin (µIU/mL) (A) and corticosterone (ng/mL) (B) concentrations over different fasting times in male (blue) and female (red) Sprague-Dawley rats with or without supplementation. HG indicates HydroGel; DG, DietGel.
Fasting Did Not Cause Oxidative Stress
Metabolism of some drug products in the liver can cause oxidative stress through excessive production of reactive oxygen species (ROS) leading to depletion of antioxidants such as GSH.18,26,35 To determine whether fasting up to 16 hours in rats can contribute to oxidative stress during a toxicology study, we assessed the concentrations of GSH, GSSG, GSH:GSSG ratio, and Cys in the blood (both sexes) and liver samples (males only). In the blood, minimal increases in GSSG concentrations along with concomitant minimal decreases in the GSH:GSSG ratio were observed at the ≥8 hours of fasting in the nonsupplemented groups in males (Table 8). No changes were observed in the GSSG concentrations and GSH:GSSG ratios in the females and the supplementation groups. Moreover, no changes were observed in GSH and Cys concentrations in both sexes in the nonsupplemented and supplemented groups. In the liver, minimal to mild decreases in GSH concentrations were observed at the ≥10 hours of fasting, along with minimal increases in GSSG in the 10-hour fast and 16-hour fast DG groups leading to overall minimal to mild decreases in the GSH: GSSG ratios at the ≥10-hour fasting times including the 16-hour fast DG group (Table 8). While these results suggested trends toward decreases in GSH:GSSG ratios in both the liver and blood samples over time, these changes were considered biologically irrelevant as there were still high serum GSH concentrations relative to GSSG, indicating fasting up to 16 hours did not cause oxidative stress in rats.
Results for oxidative stress compounds from blood and liver of Sprague-Dawley rats fasted for different time periods.
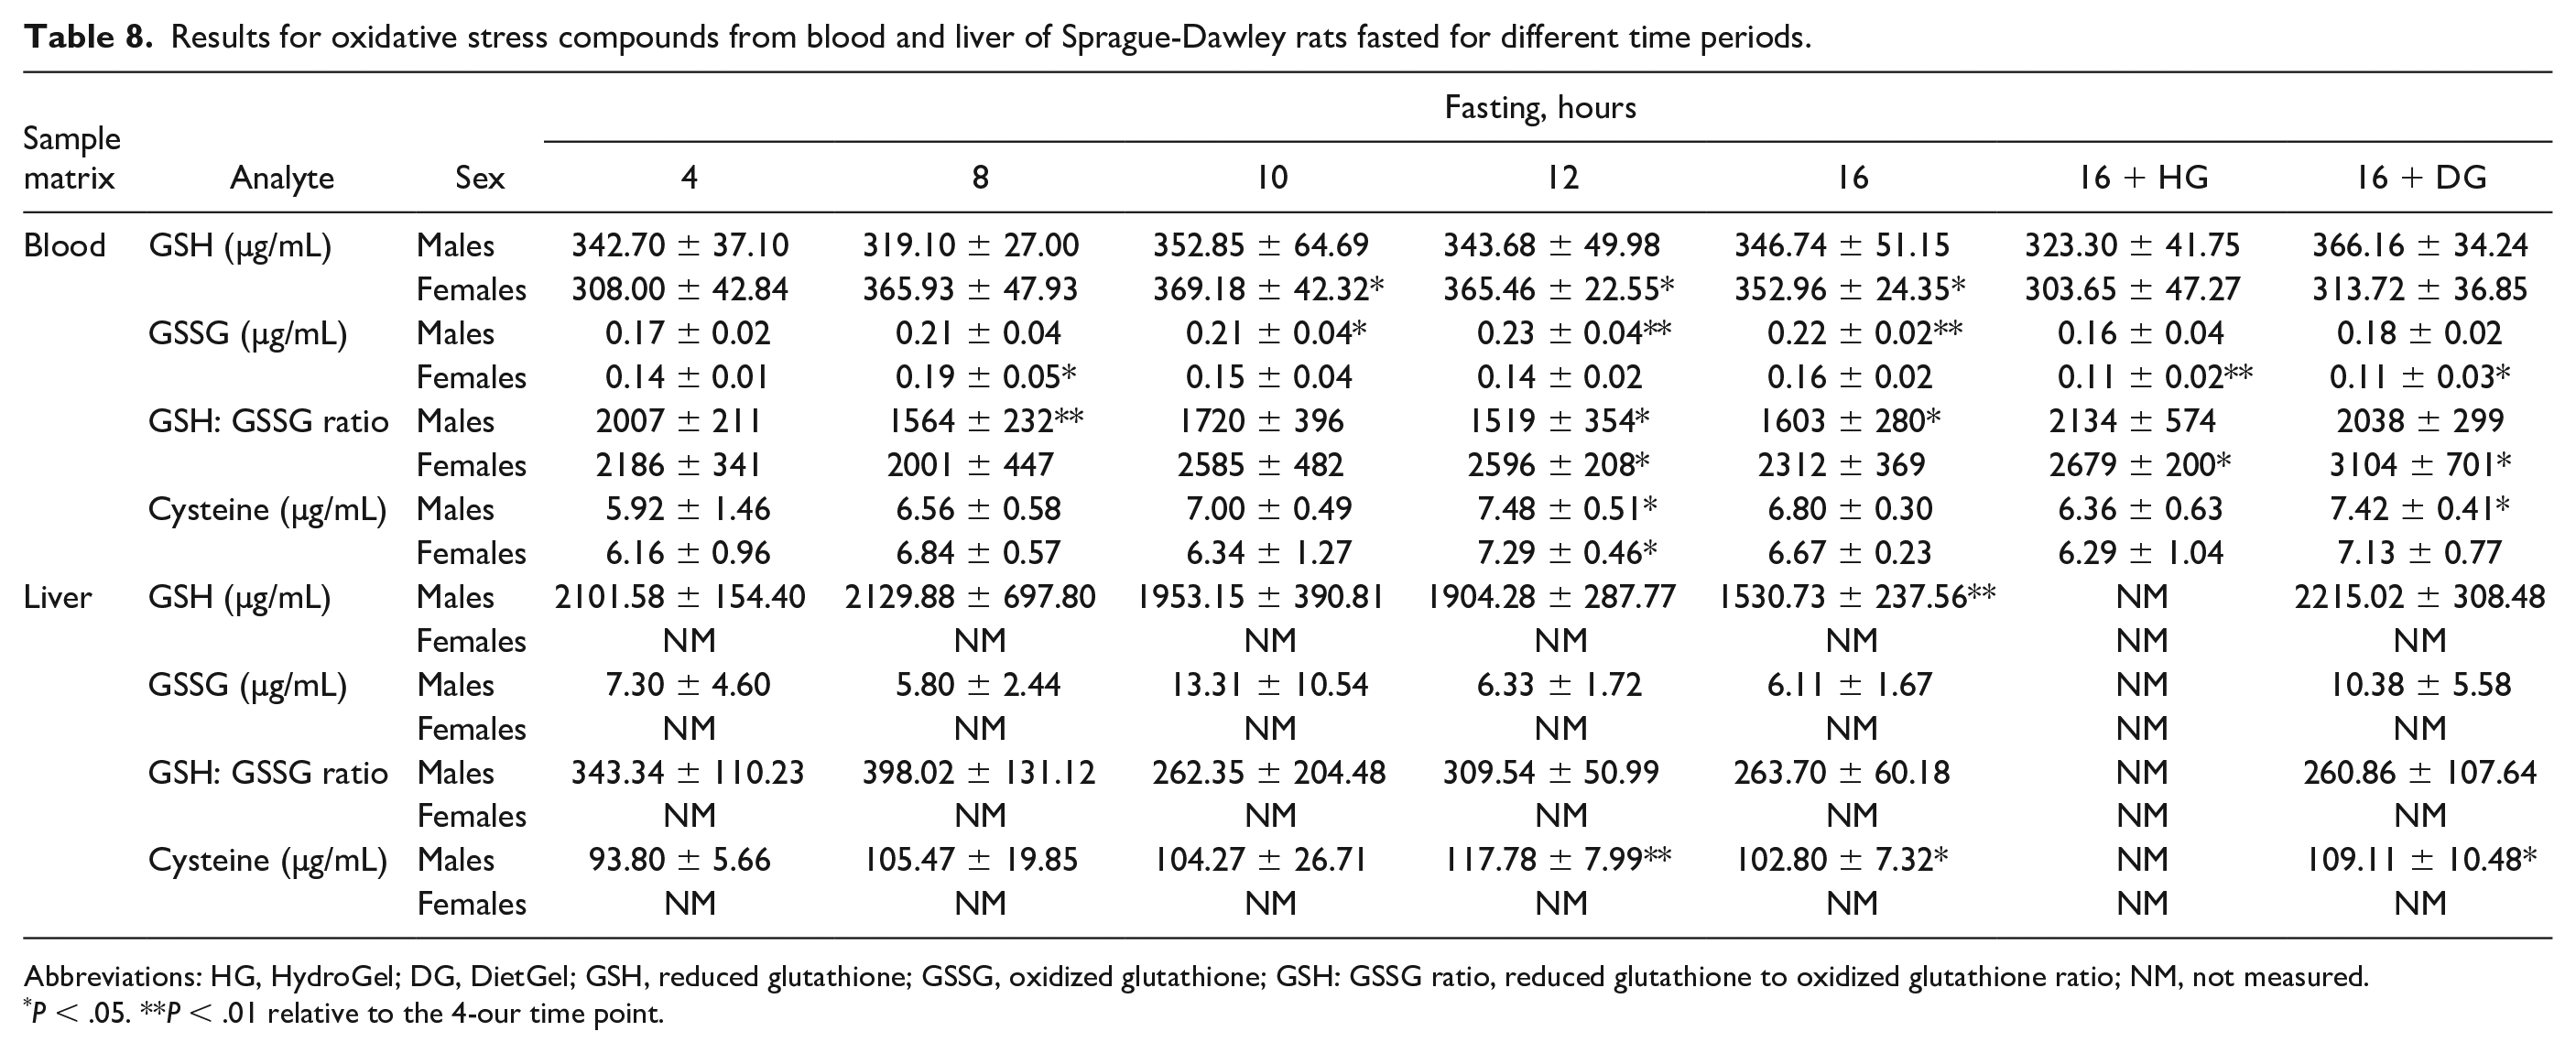
Abbreviations: HG, HydroGel; DG, DietGel; GSH, reduced glutathione; GSSG, oxidized glutathione; GSH: GSSG ratio, reduced glutathione to oxidized glutathione ratio; NM, not measured.
P < .05. **P < .01 relative to the 4-our time point.
Discussion
In summary, we demonstrated that long fasting times (≥8 hr) in rats significantly decreased body weight, liver weight, liver glycogen content, serum glucose, and triglyceride concentrations in rats, suggesting a negative metabolic state. Furthermore, long fasting times resulted in increased corticosterone concentrations, which may lead to glucocorticoid-induced stress with prolonged fasting. Hence, this study highlights the physiological consequences of fasting in rodents and the authors recommend a short fasting time for rat studies to maintain animal health and well-being while preserving data quality. That said, the TRIG concentrations at the earlier time points indicated higher variability between individual animals—an observation that was also reported in cynomolgus monkeys. 1 Hence, when triglyceride is considered a critical endpoint in a toxicology study for important drug development decisions, a 16-hour fasting time is recommended prior to blood sample collections for CP assessment.
During the long fasting periods, decreases in body weights, along with evidence of liver glycogen depletion in the face of decreased serum glucose and triglycerides, were some of the changes observed in this study. Some of these findings aligned with what has been previously reported in Han Wistar rats. 19 In contrast, no changes in TRIG and body weights were observed during long fasting times in a fasting study conducted in cynomolgus monkeys. 1 Moreover, other changes such as decreased CREA and CHOL observed in this study were also lacking in cynomolgus monkeys. One of the fundamental concepts of comparative physiology is that the mass-specific basal metabolic rate of mammals increases with a decrease in body mass.12,30 As such, the basal metabolic rates in rodents are ~6 to 10 times faster than in humans.2,12,25 Therefore, we attribute the decreases in these metabolic endpoints in rats to a faster metabolic rate relative to monkeys.
Another important observation in this study was decreased ALP observed at the long fasting times in both sexes. Generally, decreases in ALP are often considered clinically insignificant and in rodents ALP is not a useful marker of biliary injury or cholestasis because the intestinal isoenzyme is the main source of serum ALP activity. 34 While increases in ALP are primarily indicative of gastrointestinal (GI) injury in rodents, decreases in ALP may also be suggestive of reduced GI activity due to fasting as observed in this study and previous reports.4,19,21,29,38,39 Moreover, the prevention of ALP decreases in the 16-hour DG group may support this notion.
Oxidative stress is a common phenomenon that is observed during toxicology studies due to the depletion of antioxidants as a result of metabolism of xenobiotics. Glutathione is an important intracellular and extracellular protective antioxidant that engages in various key roles in the control of detoxification of certain xenobiotics and heavy metals, signaling processes, as well as other functions,8,6,13,20,22,32,33,37,40 and it is well known that certain xenobiotics and/or their metabolites (eg, quinones) can directly or indirectly cause depletion of antioxidants such as GSH, leading to oxidative stress.18,26,35 Previous studies in rats have shown that fasting for ≥24 hours can cause cysteine deficiency which can consequently lead to GSH depletion.17,23,28,31 While the results in this study indicated that fasting up to 16 hours in rat did not cause oxidative stress, there were trends toward that direction given the decreases in GSH:GSSG ratios, albeit minimal. Therefore, in a scenario where a xenobiotic is causing oxidative stress, fasting can be an additional contributing factor to oxidative stress, which would subsequently impact animal welfare and therefore, data quality.
DietGel is sometimes given to rats to mitigate body weight loss due to overnight fasting during toxicology studies. To assess whether DG supplementation could alter the CP endpoints, we included a DG supplementation group at the 16-hour time point along with an HG group for comparison in a metabolic cage environment. The results showed that the 16-hour fast DG group CP values were largely comparable to the 4-hour fasting time values especially in females, while the values for the 16-hour fast HG group were largely comparable to the nonsupplemented 16-hour fast group. Given the similarities between the 16-hour fast DG group and the nonsupplemented 4-hour fast group, we do not see the reason to subject animals to long fasting times with supplementation.
Although our main objective was to assess the physiological consequences of different fasting durations, a limitation to this study was the lack of a nonfasting group (ie, 0 hour). That said, a previous report showed that there were no significant differences in CP endpoints between 0 hour and 4 hours of fasting in Han Wistar rats. 19 Hence, we are open to the possibility that fasting rats may not be necessary for toxicology studies except: (1) when fasting would be needed for the bioavailability of an orally-administered test article3,10,11,15,41-44 and (2) when parameters that will be affected by nonfasting conditions are needed for test article safety and pharmacodynamic assessments (ie, glucose, triglyceride, creatinine, and cholesterol).
Another limitation of this study was the inconsistency associated with glucagon assessment, rendering the data uninterpretable. The cause of the inconsistency is unknown. While we cannot completely rule out an assay effect, the same assay was used to measure glucagon in a similar study conducted in cynomolgus monkeys with no concerns. 1 Nevertheless, a previous study showed that a low concentration of glucose per se does not cause increased glucagon secretion but that at low glucose concentrations the amino acid arginine stimulates a biphasic secretory response. 27 In this study, despite the decreased glucose concentrations observed, we could not completely rule out the possibility that the threshold needed for arginine to cause significant stimulation of glucagon secretion was not yet reached by the decreased glucose concentrations. Further studies will be needed to explore this possibility.
In conclusion, we have evaluated the effects of different fasting durations with or without supplementation on standard and ancillary CP parameters, along with body weight, organ weight, and histopathology. The results showed that most endpoints were largely comparable between the different fasting times regardless of supplementation status. In the long fasting times, there were biologically significant decreases in body and liver weights, serum GLU and TRIG concentration, along with minimal to mild decreases in serum CREA and CHOL concentrations. The DG supplement largely prevented these changes in the long fasting times. Other than TRIG concentrations that showed higher variability between individual animals at the earlier time points, all other parameters in the long versus short fasting times had lower variability at the earlier time points. Given the low variability of most endpoints at the short fasting time, coupled with changes indicating negative metabolic state in an animal species with a high basal metabolic rate and reduced food consumption during the daytime after an overnight fast, the authors propose that 4 hours of fasting should be adequate for most toxicology studies in rats, except when parameters that will be affected by nonfasting conditions are needed for test article safety and pharmacodynamic assessments. We acknowledged that a previous study in Wistar Han rats provided a different recommendation. 19 Fundamentally, there were no significant differences in the pattern of changes of the standard CP parameters between the Wistar Han study and our study. However, the objectives of the studies were different. In our study, our objective was to investigate whether fasting duration can be reduced for the purpose of animal welfare without compromising data quality. For the Wistar Han rats’ study, the objective was to determine an optimal fasting time without any emphasis on animal welfare. This difference in objectives led to different recommendations. We also included additional endpoints including organ weights, histopathology, glucose regulatory hormones, and markers of oxidative stress to support our recommendation of reduced fasting. Hence, we hope the results from this study will not only help scientists in the drug development field, but also those generally involved in animal studies, to make informed decisions on selecting the appropriate fasting duration for rats’ studies with the intent of improving animal welfare while preserving data quality.
Footnotes
Acknowledgements
The authors would like to acknowledge Paula Katavalos, DVM PhD, from Genentech and Kevin Williams from Labcorp Madison for study design support.
Declaration of Conflicting Interests
The author(s) declared no potential conflicts of interest with respect to the research, authorship, and/or publication of this article.
Funding
The author(s) disclosed receipt of the following financial support for the research, authorship, and/or publication of this article: All work was supported by Genentech, a member of the Roche group.