
Abstract
Digital pathology workflows in toxicologic pathology rely on whole slide images (WSIs) from histopathology slides. Inconsistent color reproduction by WSI scanners of different models and from different manufacturers can result in different color representations and inter-scanner color variation in the WSIs. Although pathologists can accommodate a range of color variation during their evaluation of WSIs, color variability can degrade the performance of computational applications in digital pathology. In particular, color variability can compromise the generalization of artificial intelligence applications to large volumes of data from diverse sources. To address these challenges, we developed a process that includes two modules: (1) assessing the color reproducibility of our scanners and the color variation among them and (2) applying color correction to WSIs to minimize the color deviation and variation. Our process ensures consistent color reproduction across WSI scanners and enhances color homogeneity in WSIs, and its flexibility enables easy integration as a post-processing step following scanning by WSI scanners of different models and from different manufacturers.
Introduction
Advanced technologies in whole slide imaging enable the generation of high-resolution digital whole slide images (WSIs) from histopathology samples. The standard and expected range of colors on WSIs of histologic-stained tissue sections is essential for pathologists’ diagnostic evaluation, although pathologists can accommodate some variability within this range. However, the success of computational approaches, such as the reliable quantification of biological information and the development of algorithms and tools for automated analysis, may require greater color consistency.1 -7 The color reproduction accuracy, therefore, is an important component of a whole slide imaging system’s value.1,8 -10
The color of WSIs varies due to inconsistencies throughout the slide preparation and imaging process.
The inconsistent preparation process of tissue to glass slides, including but not limited to non-standardized staining protocols across laboratories, can generate different intensities and contrasts of the stain color on tissue samples.3,7,11
Inconsistent optical and hardware characteristics of the WSI scanners can induce distorted color transformation from the tissue samples to the WSIs and inter-scanner color variation in the images.1 -6
Distorted color rendering from display devices can result in inconsistent color presentation to the viewer. 2
There are a number of techniques reported to address these issues by standardizing the color generated by the slide preparation and imaging process:
Stain normalization for standardizing the stain color appearance in histopathology WSI without intervention in pre-analytical phases and protocols.7,11 -14
Internal color calibration, using a calibration slide with known truth of colors, for mitigating the difference between true colors and the colors measured by the WSI scanners.1,2,4,8,15
External monitor calibration, using a colorimeter or spectrophotometer, for aligning the appearance of the colors on a display with the colors on the images.16,17
As a first step, in this study, we focus on the color generated by the WSI scanners. Color reproducibility of WSI scanners is the accuracy of color transformation from the tissue samples on the glass slide to a WSI. 10 The Food and Drug Administration (FDA) has issued a guidance requiring that WSI scanners have accurate and consistent color reproducibility. 10 Importantly, in this context, even though regular calibration processes are performed by the manufacturers, there is still observable variability of color representations across WSI scanners from the same and different manufacturers.
Color variability is often not a critical problem for pathologists’ interpretation since pathologists can visually adapt to a range of colors in WSIs. However, it has been an issue for the increasing applications of artificial intelligence (AI) and computational techniques in digital pathology. Development of robust AI-aided interpretation often relies on large amounts of WSI data for development. When these data are acquired by multiple scanners, at different time points, by different operators, the color variation among the WSIs can degrade computational algorithm performance.1 -7 A number of studies have been published in the literature that discuss the issue and describe methods to standardize and normalize color to improve algorithm performance.1 -7
Building on the previously reported methods, we developed a process for assessing color reproducibility and mitigating color distortion for our WSI scanners. The process is intended to improve the color reproducibility and reduce the color variability in our WSI scanners. Our process includes two modules: (1) assessing the color reproducibility of the WSI scanners, including the color performance of a single scanner and the color variation across scanners. If a color deviation is identified in the scanners, the process moves on to the second module and (2) performing color correction to the images generated by the WSI scanners to mitigate the color deviation.
Materials and Methods
Our process, including the two modules for assessing color reproducibility and performing color correction, was applied to three Hamamatsu Nanozoomer scanners (two S360 model scanners, designated S360A and S360B, and one XR model scanner) and an Olympus VS200 scanner. This section elaborates on these two modules and the performance assessment of our process.
Module 1: Assessing Color Reproducibility
Color reproducibility can be evaluated by measuring the difference between the true colors and the colors measured by the scanners (i.e., measured colors). In the following sections, the definition of a color and the calibration slide for generating the color information are introduced first. The collection process for color information and the metrics to assess the color performance of scanners are explained subsequently.
What is color?
A color perceived by an observer with typical vision can be represented by a triplet of values in various color spaces, such as linear RGB, sRGB, CIEXYZ and CIExyY coordinates, relative to a specified white point (i.e., white color under a specified illuminant). The white color, for example, can be described by the values of [R, G, B] = [1, 1, 1] in the sRGB color space, and also [X, Y, Z] = [0.9505, 1, 1.0888] in the CIEXYZ color space, equivalent to the white point under the International Commission on Illumination (CIE) standard illuminant D65 (i.e., the illuminant representing noon daylight). 18 Conversion between these systems is standardized. The computation of the conversion and characteristics of the color spaces are beyond the scope of this study. Readers can refer to prior reports 19 for more information about color spaces in digital pathology.
The triplet values of colors were collected from the WSI scanners in this study. The values were utilized to assess the color reproducibility and develop the color correction models.
Color calibration slide
To collect the color representation of WSI scanners, a color calibration glass slide was utilized to serve as the target ground truth from which the color information was measured.
A color calibration slide is a glass slide with a number of color patches on it, together with their calibrated colors or transmission spectra, which can be made in-house or bought from commercial vendors. The construction of color calibration slides for digital pathology, however, is currently not standardized. Calibration slides can be created from a number of different materials and arbitrarily chosen colors. This poses challenges for the standardization of color reproducibility assessment, and is an area that should be evaluated as digital pathology enters regulated settings, such as good laboratory practice (GLP) toxicologic pathology, for which calibrated instrumentation will be essential. Given the current absence of standardization, individuals may take the following considerations into account when choosing a color calibration approach. First, a wide range of colors used for calibration provides information broadly across the color spectrum and allows a thorough assessment of a scanners’ color reproducibility. Second, the reproducibility of specific stain colors can be assessed by a calibration slide with patches similar to the selected stain colors. Bautista et al 2 and Murakami et al 8 performed color assessments and correction procedures using nine-color calibration slides made within their organizations, which included typical colors and colors generally observed from hematoxylin and eosin (H&E)-stained tissue sections. Clarke and Treanor 3 developed a calibration slide incorporating 55 colors in the range typically observed in various stained slides 20 to provide a more representative set of colors for histopathology.
In our study, we used a color calibration slide from Applied Image Inc. as shown in Figure 1A. The slide includes 24 color patches and a clear zone, including basic colors (e.g., yellow, red, green, blue) and colors observed in various common stainings (e.g., purples, pink and brown from H&E, 3,3’-Diaminobenzidine (DAB), and periodic acid-Schiff (PAS) stains). These colors span the range of chroma across the visible spectrum, and also provide several example patches that are similar to typical H&E stain colors.
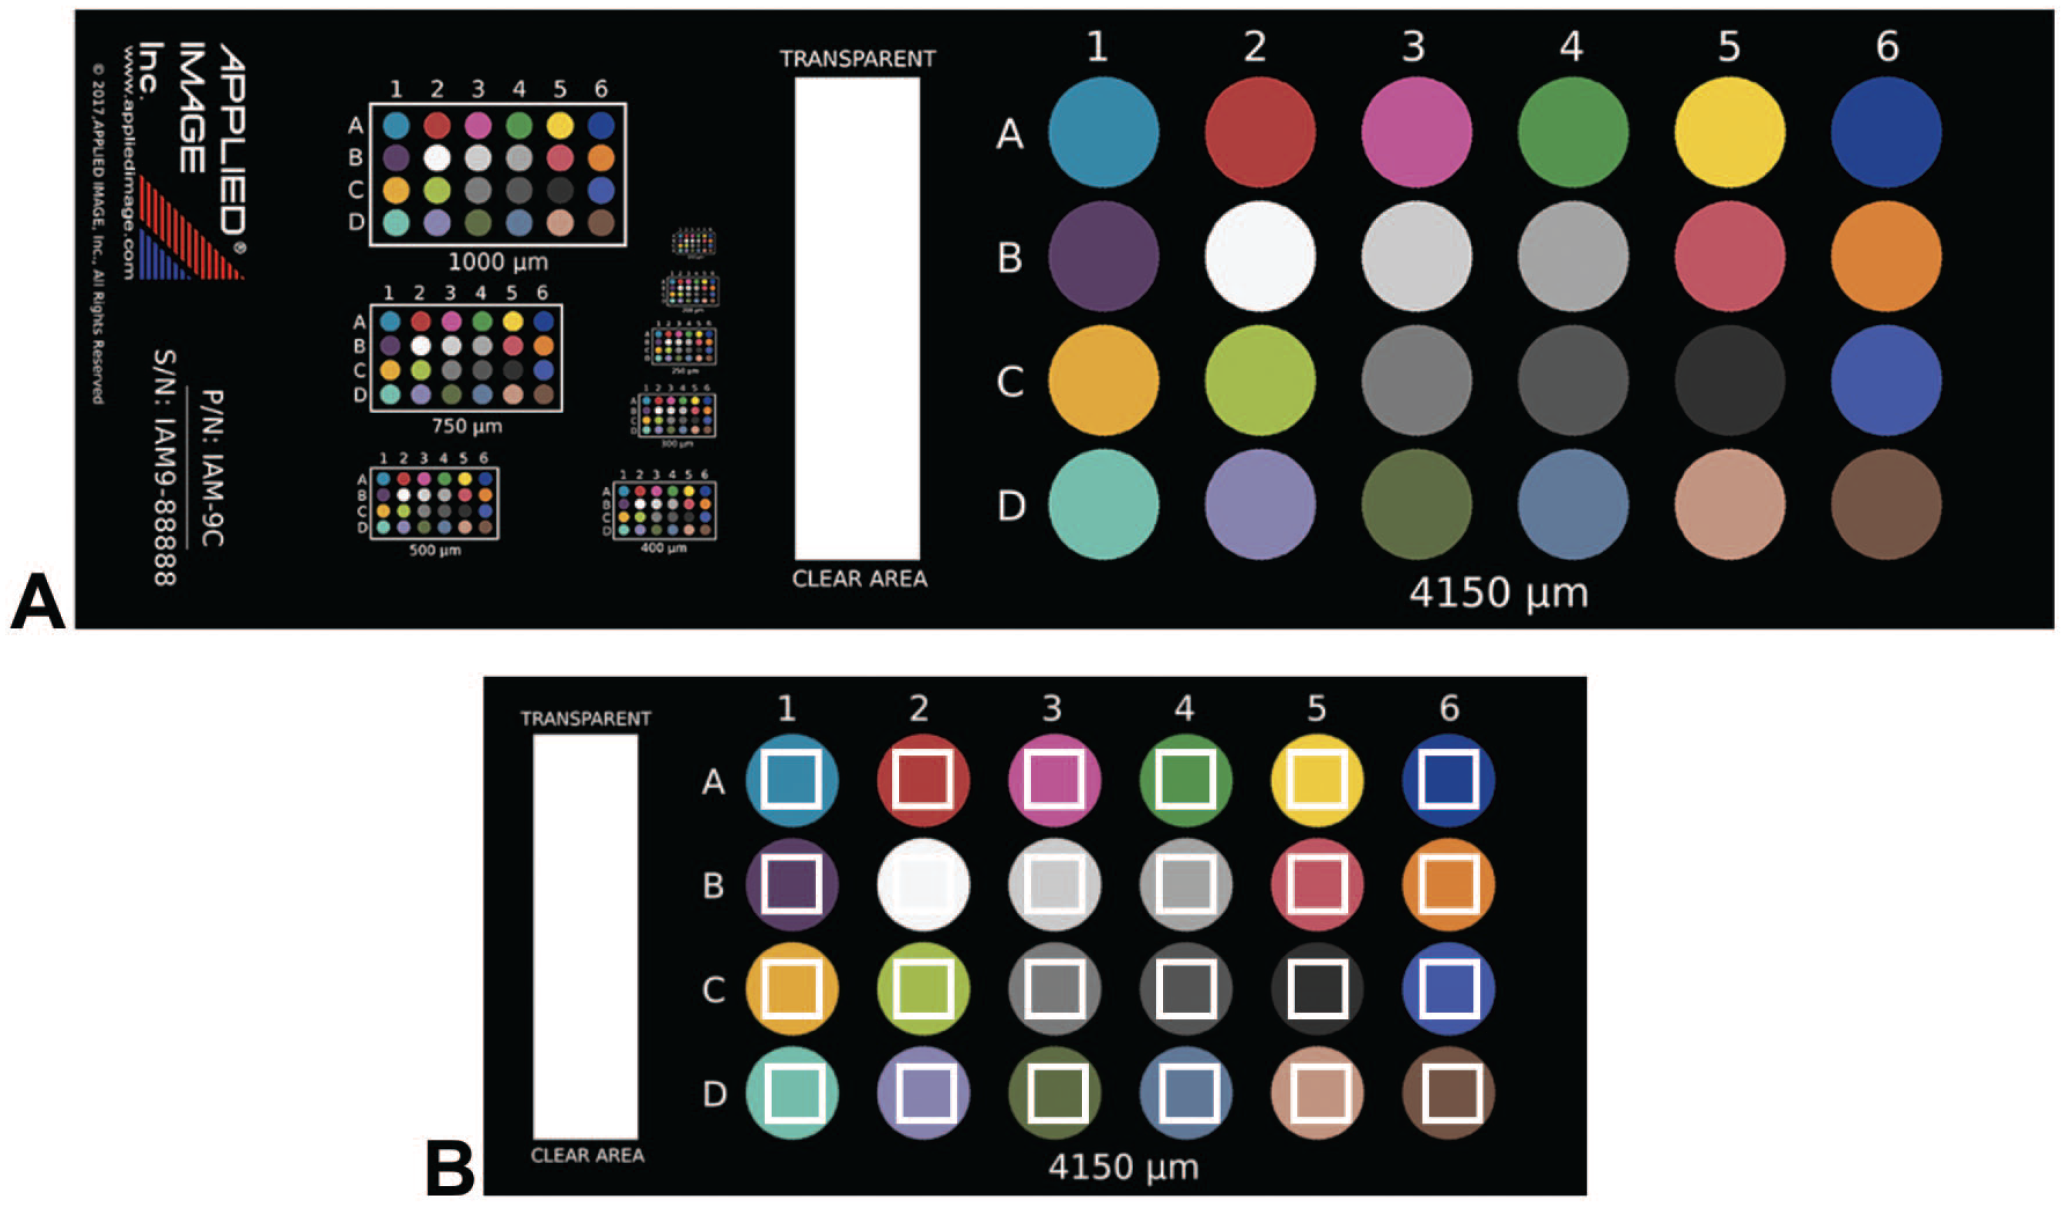
(A) The color calibration slide from Applied Image Inc. used in our studies. (B) The white rectangles within color patches highlight the regions of interest for calculating the color information. Images used with permission from Applied Image Inc.
Collecting color information
The color reproducibility of a WSI scanner can be assessed based on the differences between the true and measured colors from the calibration slide.
The true colors are determined by the colors on the glass slide illuminated by a light source, which can be computed in CIEXYZ coordinates based on their transmission spectra and the illumination spectrum of the light source. 1 In this study, the transmission spectra were provided by the slide manufacturer, which can also be measured using a spectrophotometer alternatively. In addition, the CIE standard illuminant D65 was assumed as the illumination spectrum, which is commonly used in colorimetric calculations that require a representative daylight viewing environment.1,21,22
To collect the measured color information, a WSI scanner scans the color calibration slide and generates a raw digital image. The raw image typically consists of three channels representing triplet values in a color space. In our study, the raw images generated by the Hamamatsu Nanozoomer scanners were in the linear RGB color space, and those generated by the Olympus VS200 scanner were in the sRGB color space, which incorporates a non-linear “gamma” correction. The measured color information was calculated by averaging the pixel values within manually selected regions of interest (ROIs) of each color patch, respectively, as shown in the ROI examples in Figure 1B.
Interpreting the color data obtained from a scanner requires knowledge of the color space in which the data is expressed. The color space associated with the three channels in the images is designated by the scanners, and is frequently not explicitly specified to the user. 19 In addition, the collected R, G, and B values in the three channels may be processed by inherent color processing also unspecified to the user, such as built-in gamma correction, before the image data are assembled into an image file by the scanner. This inherent processing can change the color space of the three channels, potentially leading to incorrect downstream processing and resulting in color variation when displaying raw images, as illustrated in Figure 2. Presenting raw images without standardizing their color spaces can lead to color variation, as demonstrated in Figure 2A and B, where the raw images from Hamamatsu Nanozoomer S360 and Olympus VS200 scanners displayed using ImageJ exhibit pronounced differences.
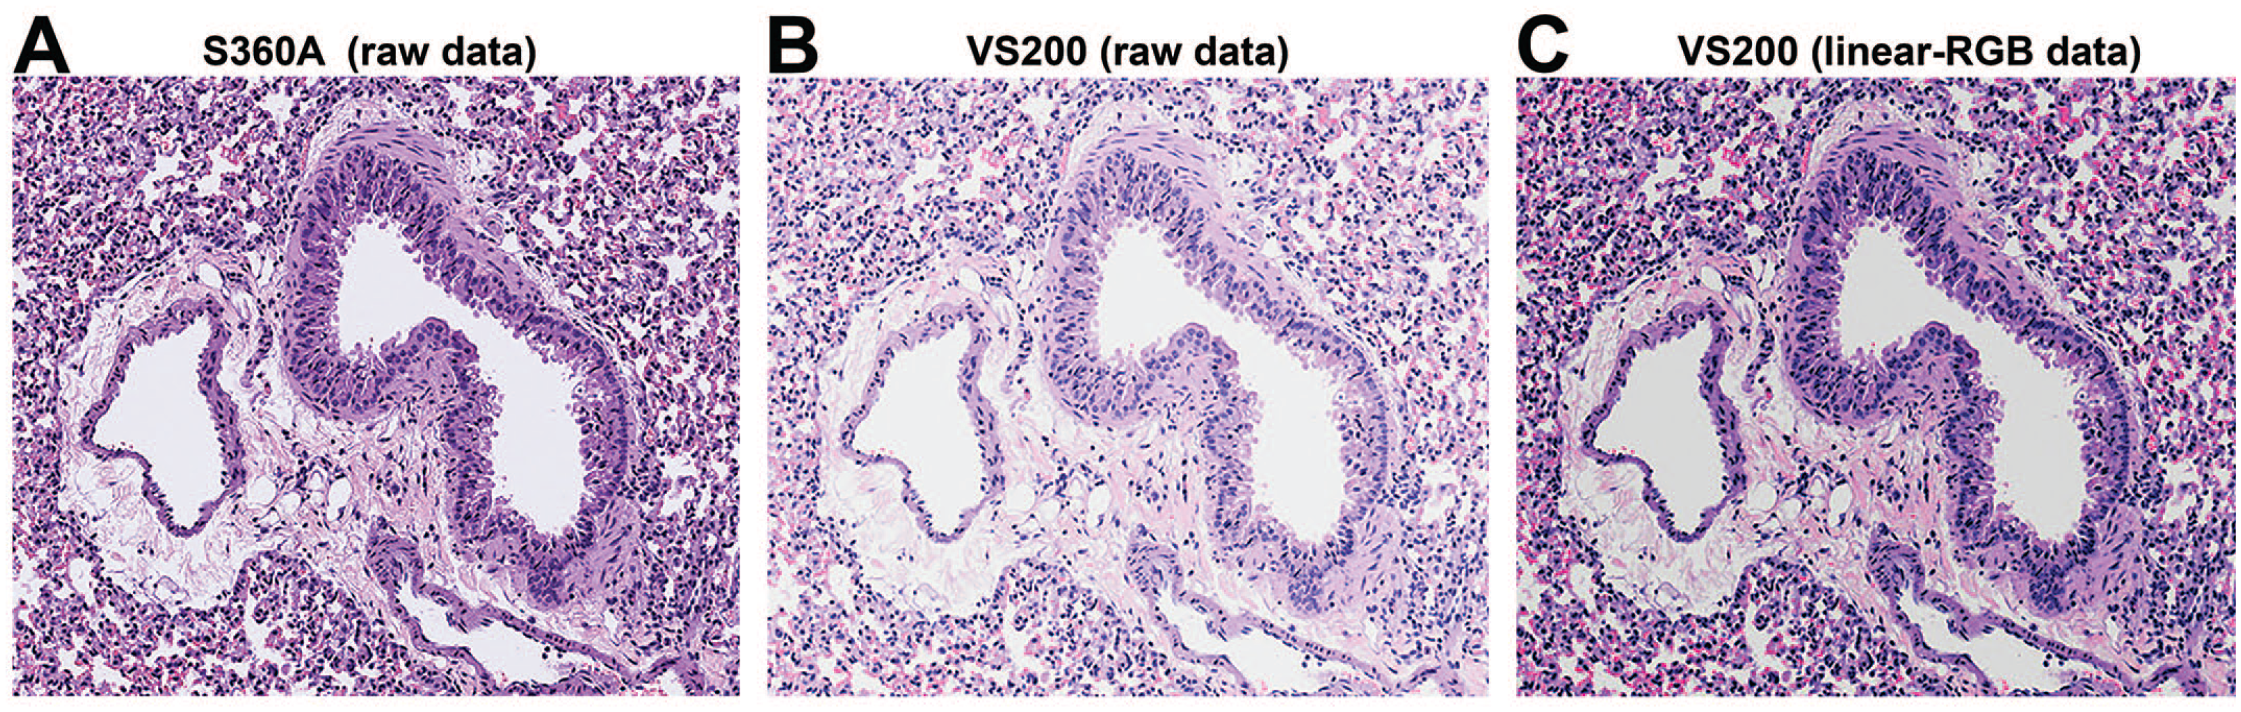
A region of interest in the raw images generated by (A) A Hamamatsu Nanozoomer S360 scanner and (B) An Olympus VS200 scanner from a single histopathology slide of lung tissue. (A) and (B) are screenshots obtained from the raw scanner-generated images displayed using ImageJ without any image processing. These images present the significant color variation between raw images provided in different color spaces by scanners from different manufacturers: (A) Raw image in the linear-RGB color space from Hamamatsu S360 Scanner and (B) Raw image in the sRGB color space from Olympus VS200 scanner. To ensure correct downstream processing and proper image display, the raw image from the Olympus VS200 scanner was converted to the linear-RGB color space, as shown in (C).
Therefore, it is important to verify the color space of the measured colors to ensure correct processing. Supplementary material S1 provides a procedure for verifying the color space. In our study, to ensure correct color correction and assessment for the Olympus VS200 scanner, it is essential to convert the raw image to the linear-RGB color space, as shown in Figure 2C. Importantly, once images are within the same color space, any remaining color variation between images from different scanners (Figure 2A and C) is attributed to inherent scanner-to-scanner color variation.
To assess the variation across multiple scanners, ideally, all scanners should scan the same color calibration slide to ensure the consistency for assessment. In our study, to collect the color information of our WSI scanners, three Hamamatsu Nanozoomer WSI scanners (i.e., two S360 models and one XR model) and an Olympus VS200 WSI scanner scanned an Applied Image color calibration slide using a 20x objective lens, leading to an overall optical magnification of 400x and yielding resolution of 0.23 μm per pixel. The slide includes regions of various resolutions for different scanning purposes; our studies focus on the color patches in the right panel in Figure 1A with the highest resolution, suitable for evaluation of our high-resolution scans.
Figure 3 depicts the collection process of both true and measured color information. These data are utilized as an input to assess the color reproducibility of scanners and to derive their respective color correction models.
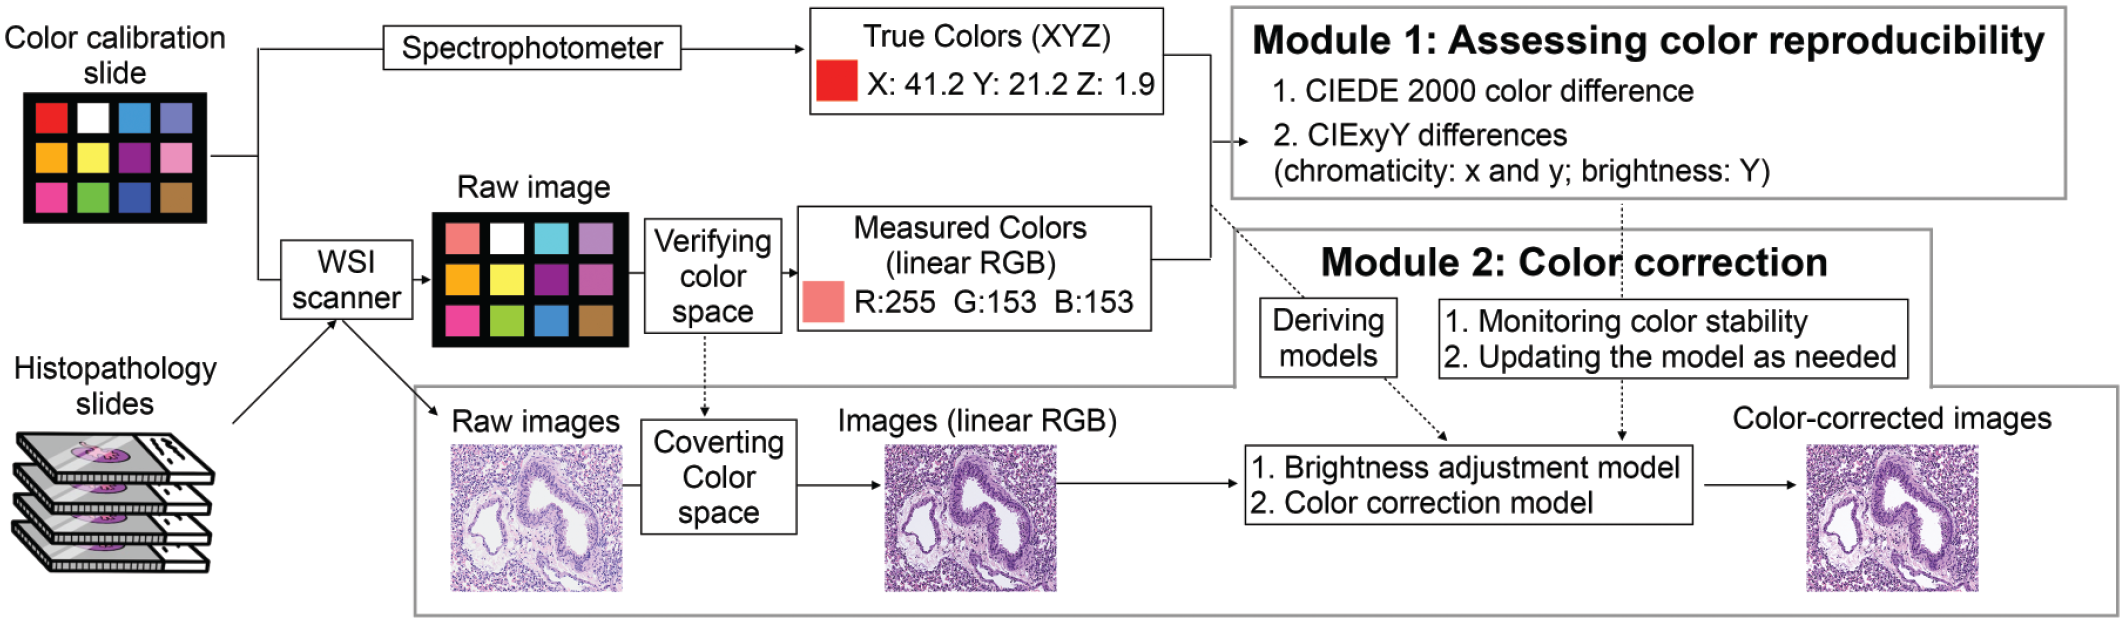
The process for assessing color reproducibility and mitigating color distortion in the whole slide image (WSI) scanners. The first module in the process assesses the color reproducibility of a scanner, utilizing a color calibration slide as a target to evaluate the deviation of colors generated by the scanner. The second module in the process performs color correction, which involves deriving correction models, applying these models to WSIs, and updating the models as needed.
The assessment of color reproducibility
The assessment of color reproducibility includes evaluating the color deviation from the ground truth and the color variation among scanners. Two metrics are exploited to quantitatively perform the assessment: (1) the CIEDE 2000 color difference formula and (2) the CIExyY values.
The CIEDE 2000 color difference
The CIEDE2000 color difference formula, 23 which was published by CIE in 2001, has been a standard metric of quantifying the perceptual difference between two colors. The difference between two colors can be calculated given a pair of CIELAB values (i.e., L, a*, and b* values, which can be derived from R, G, and B), and is denoted ΔE in the following paragraphs. General examples of CIEDE2000 color differences of two sets of color pairs are demonstrated in Figure 4. Clearly visible color difference in color pairs corresponds to a higher level of ΔE. It has been reported that two colors with ΔE below 2.2 are not discriminably different by a manual observer.2,24 We employ the same discriminability threshold in this work. For details on the formula, readers can refer to CIE’s initial report, 23 and Supplementary material S2 for insights into the parameter values used in our study.
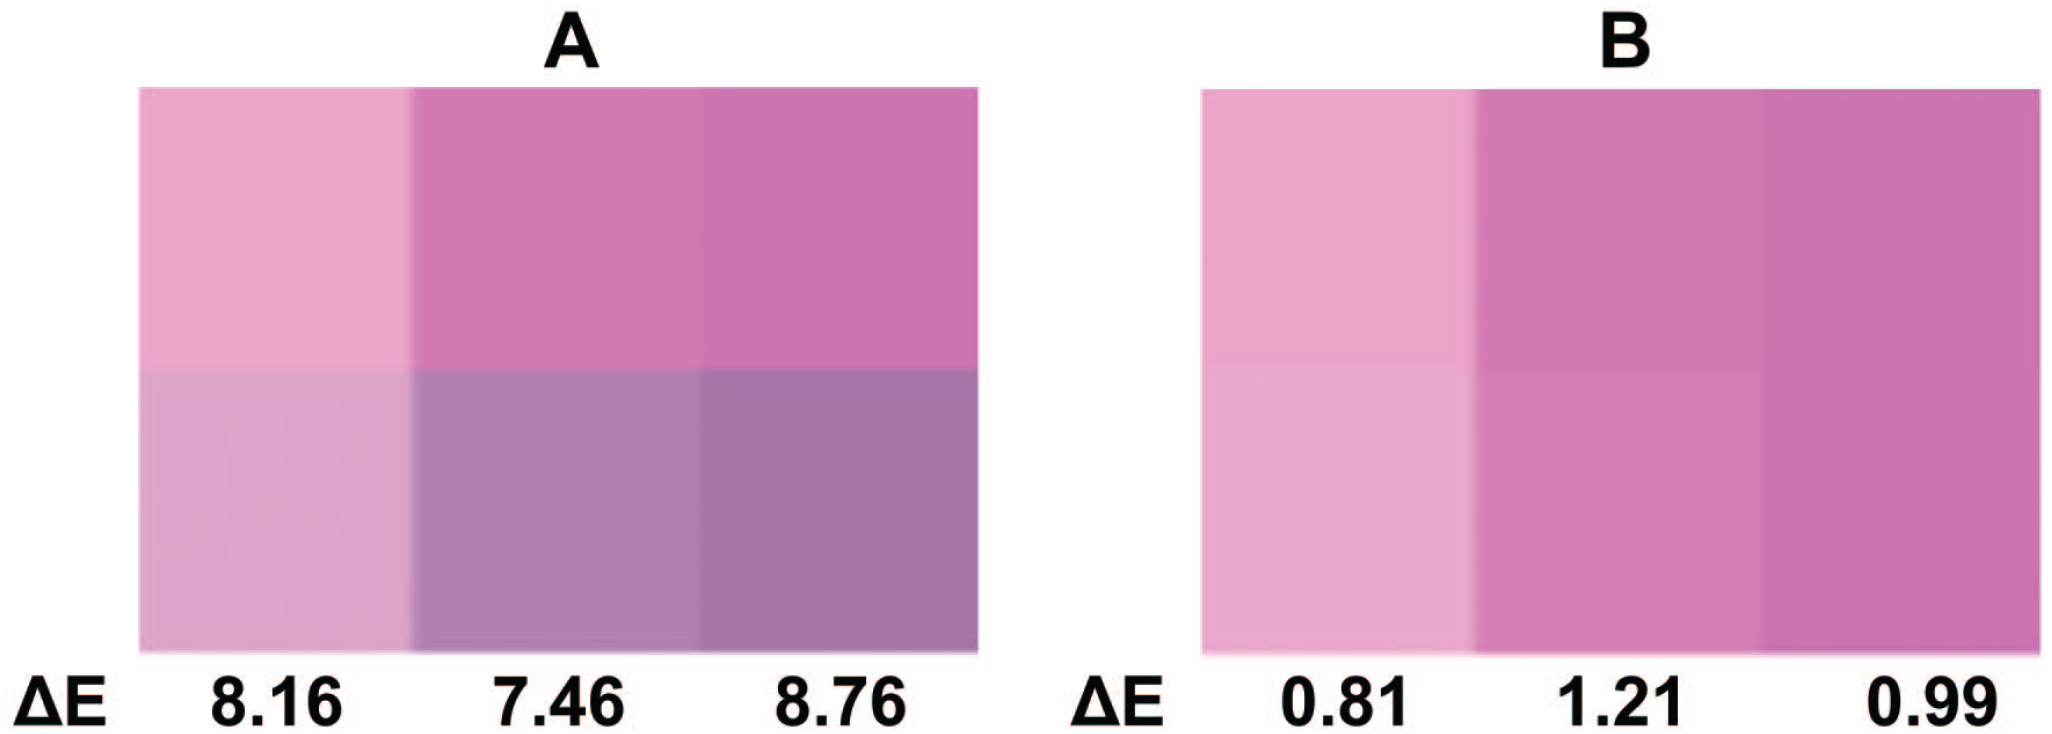
(A) Two rows of colors with visible differences show higher levels of color differences ΔEs. (B) Two rows of colors with barely visible differences show lower levels of ΔEs.
To assess the color deviation of our WSI scanners, we report the ΔE between the measured colors from four scanners and the ground truth, respectively. The ΔE between each scanner pair was also calculated to quantify the color variation among scanners.
ΔE quantifies the color difference by taking into account both brightness and chromaticity differences between two colors, using the formula
The CIExyY values
The ΔE provides general quantification of color deviation and variation of the scanners, including the effect from brightness and chromaticity. Their respective effects on the pathologist’s experience and automated analysis in WSI, however, can be different. A general concept is that overall variation in brightness can be easily adjusted by the display and viewing platform at the user’s end, while the chromatic variation has to be mitigated through a calibration process.
To understand the chromaticity and brightness reproducibility of a WSI scanner, respectively, the deviation and variation of the CIExyY values are assessed. The pair of x and y values in the CIExyY color space specifies the chromaticity of a color, and the Y value specifies the brightness. The differences of x, y, and Y values between two colors provide the information of the chromatic and brightness deviation of a scanner, respectively.
In our study, to present the chromaticity reproducibility of a WSI scanner, the CIE x-y plot (i.e., chromaticity chart), showing the chromatic position of the true and measured colors based on their x and y values, are provided to better visualize the deviation and variation of chromaticity among the true colors and the measured colors from WSI scanners.
In parallel, two H&E-stained histopathological slides, including multiple organ tissues from preclinical studies were also scanned by the four scanners under evaluation using 20x objective lens (leading to optical magnification of 400x and yielding 0.23 μm per pixel) to assess the impact of the measured color variability on the visual appearance of WSIs. The color variation could be assessed qualitatively by visually comparing WSIs from a single slide scanned on the multiple scanners.
Module 2: Color Correction
Following the thorough assessment of color reproducibility of our scanners, we evaluated whether it is necessary to mitigate the color distortion. Some manufactures provide internal color calibration modules in their scanners, and users can choose to perform the calibration at regular intervals or once they find out there is color distortion. The built-in color calibration module resets each scanner to its individual calibration point, and inter-scanner color differences may remain. Users need to perform an additional process to fully assess color performance and customize color correction.
We propose an integrated module working as a post-processing technique that can correct the color on the images generated by the scanners, as shown in module 2 in Figure 3. This module has the capability to correct colors from various scanners to a single source of ground truth. The color correction module comprises three sequential processes: (1) implementing a brightness adjustment model to modify the overall image brightness, (2) deriving a color correction model for the WSI scanner and performing the correction, and (3) continuously monitoring the color variability of the scanners for updating the models as needed over time.
Brightness adjustment
In the brightness adjustment stage, our module focuses on optimizing the overall brightness levels of the scanned images prior to color correction. The intensity of the light source can vary across different scanners and over time due to a variety of factors, such as different scanner models, aging of the light source, environmental factors, and scanner settings. These intensity variables can cause inconsistencies in image brightness, effectively resulting in multiplication of the measured linear-RGB values by a constant. To address this issue, we developed a brightness adjustment model that mitigates the impact of intensity variability by estimating the variation constant. The mathematical details of the model are explained in Supplementary material S3.
The brightness adjustment procedure then involves multiplying the linear RGB values of each pixel in the images from the scanner by the estimated correction constant. These adjusted linear RGB values are then passed to the subsequent color correction process. For simplicity, the measured colors mentioned in the next section are assumed to be brightness-adjusted.
Color correction
To correct colors, a mathematical model was needed to accurately transfer the measured colors from a WSI scanner (i.e., linear RGB values in our study) to the true colors (i.e., CIEXYZ values).
In this study, an empirically derived second-order root-polynomial model was used for color correction. 25 The model transforms the measured linear RGB values of a color obtained from a WSI scanner to its target CIEXYZ values. The transformation is described in Supplementary material S4.
It is important to note that as a result of varied color performance and variable internal calibration among the scanners, each WSI scanner has its own unique color correction model, comprising second-order root-polynomial equations with a unique set of coefficients.
The color correction process then transforms the linear RGB values of each pixel in the images from the scanner to the target CIEXYZ values using the derived model, resulting in a color-corrected image. Further color space conversions are then applied to generate images in various color spaces for display.
The performance of the integrated brightness adjustment and color correction process was evaluated by the color difference ΔE and the difference of the CIExyY values between the corrected and true colors.
Monitoring scanner color variation over time
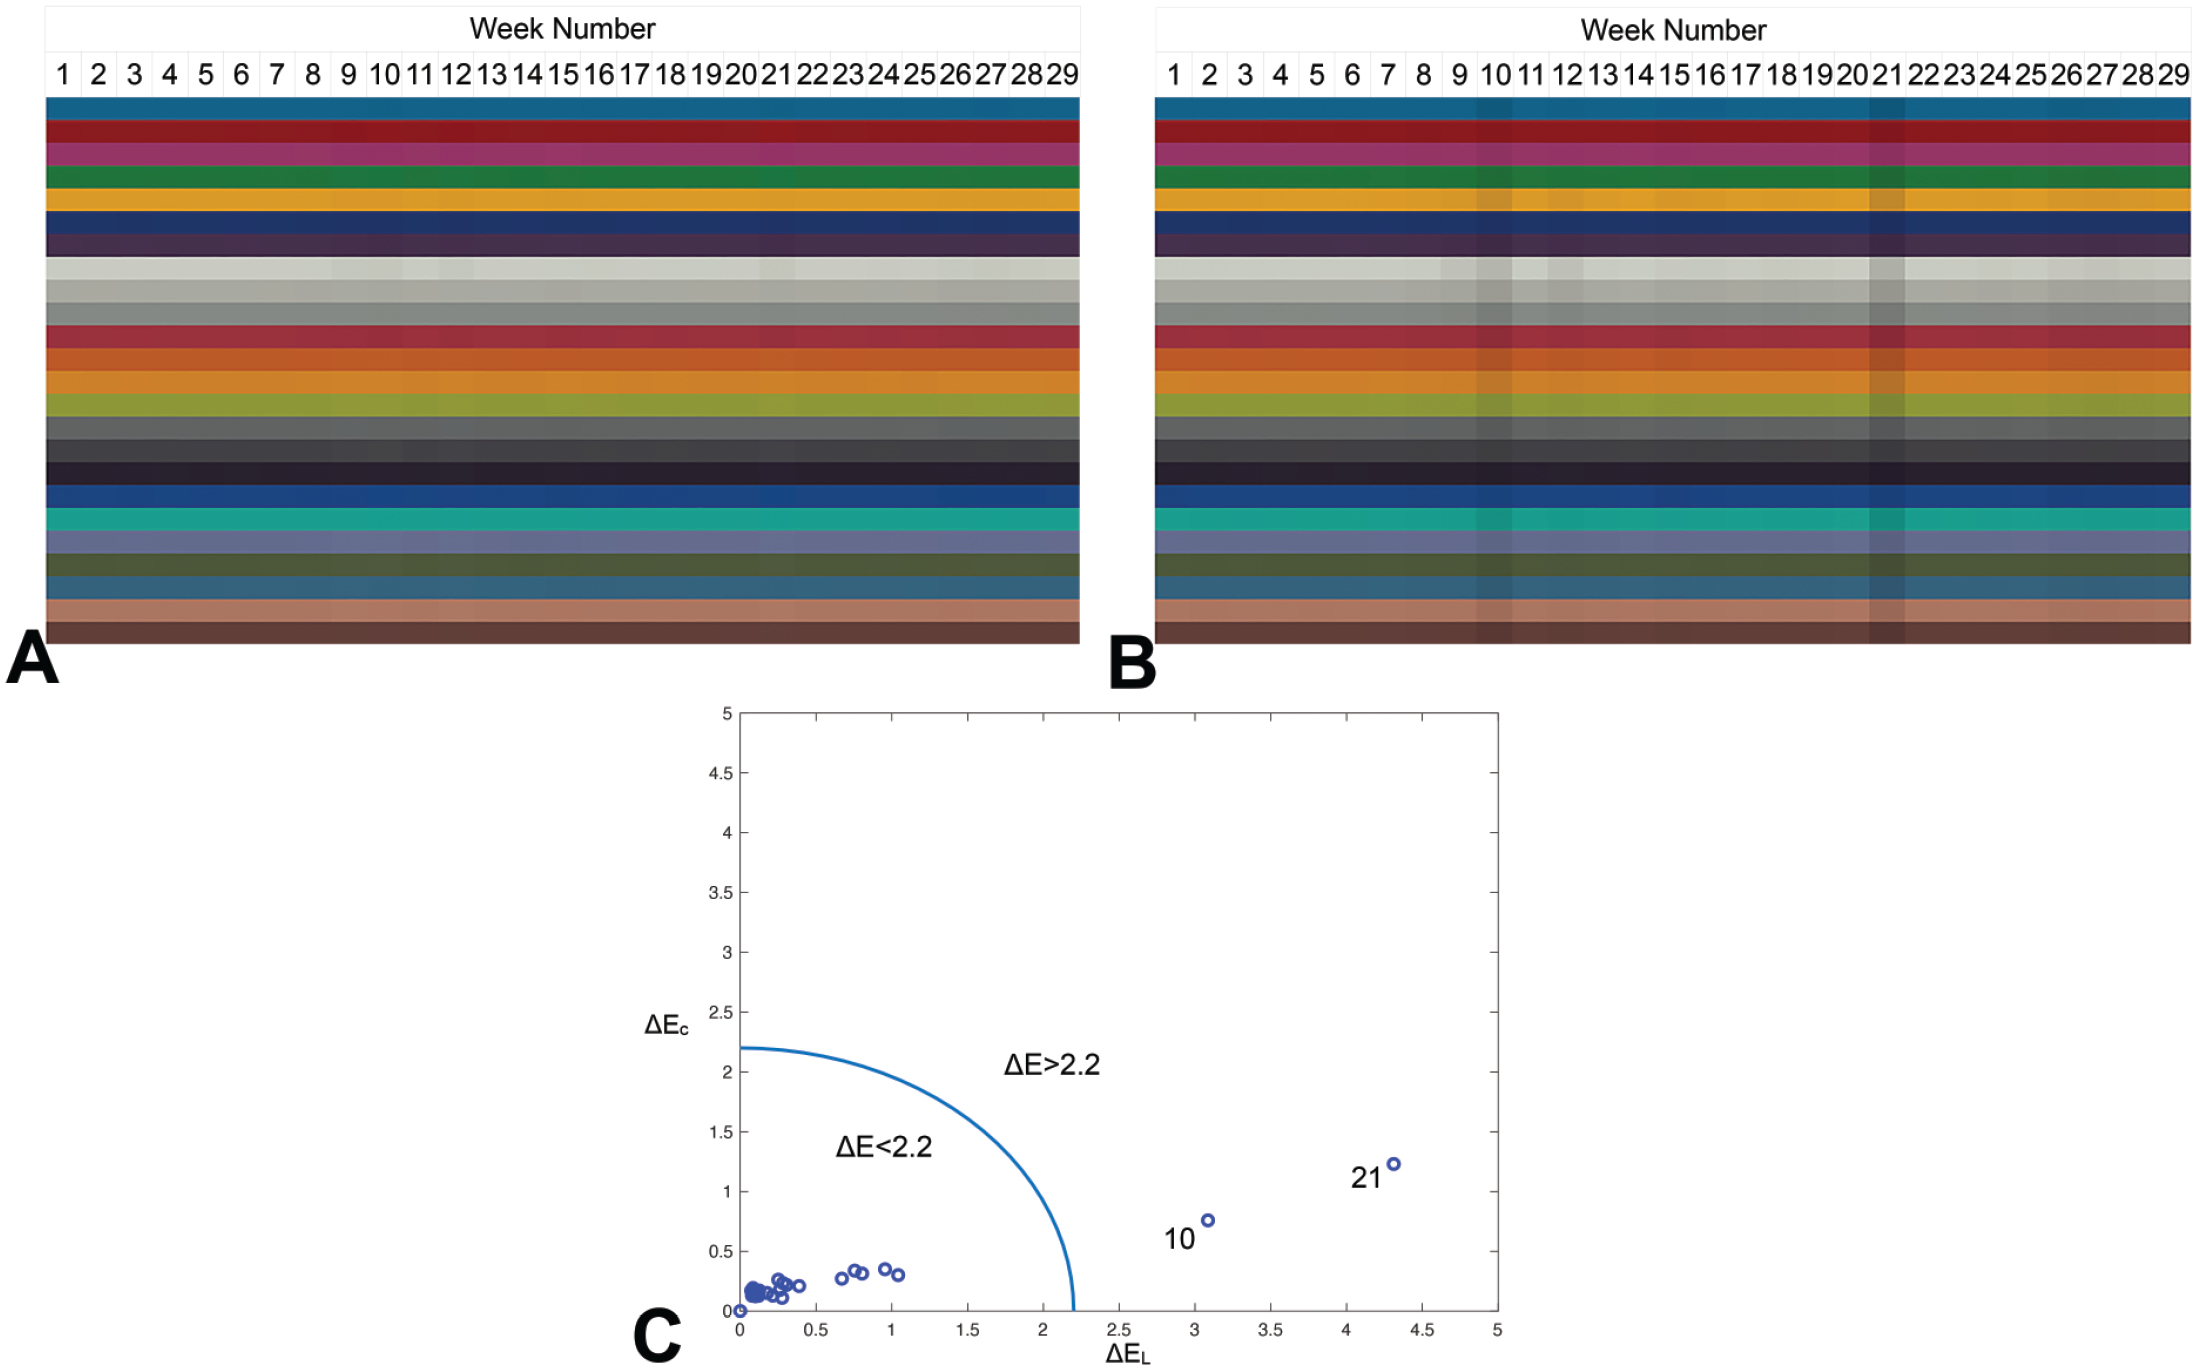
Maintaining consistent performance of the color correction models requires updating them based on the color stability of the scanners over time, as demonstrated in Figure 3. In this study, the stability of the three Hamamatsu scanner’s color performance was monitored by regularly scanning an Applied Image color calibration slide and two H&E-stained slides for eight months, once a week. During this eight-month period, the slides were protected from ambient light and no noticeable H&E stain fading was observed. 26 For each scanner, we calculated the linear RGB values of 24 color patches from manually selected ROIs on the color calibration images. The perceptibility of chromatic and brightness variations over time are quantitatively evaluated using the weekly average for chromaticity ΔEC and brightness ΔEL components in ΔE, compared with the eight-month average colors. The calculations for the weekly average ΔEC and ΔEL are detailed in Supplemental material S5.
A two-dimensional plot visually presents the weekly ΔEC and ΔEL with a line of circle delineating the perceptible ΔE threshold of 2.2. The figure shows the relative impact of chromaticity and brightness on the color fluctuation, and also identifies the weeks with ΔE exceeding 2.2, falling outside the boundary of the circle. This serves as a potential guideline, indicating the weeks where model updates for color correction are necessary.
To update the brightness adjustment and color correction models, a recalculation of the parameters within both models is executed by providing the updated color information (the linear RGB values in our study) from the scanner’s raw images. It is crucial to note that while these updated models retain the same mathematical structure, the values of their parameters are altered.
In addition, chromaticity and brightness values (CIExyY values) were extracted from the raw images obtained from the two H&E slides and the color calibration slide over time. This color information was utilized to rule out the possibility that observed variations were scan-specific, that is, occurring from individual scans, rather than originating from an overall temporal variation in scanner performance.
Results
The results reported in this section are based on the WSIs collected from a single scanning session, in which an Applied Image color calibration slide was scanned by the four scanners. Figure 5 presents the results for Scanner S360A, and the results for Scanner S360B, XR, and VS200 are available in Supplemental Figures S1-S3.
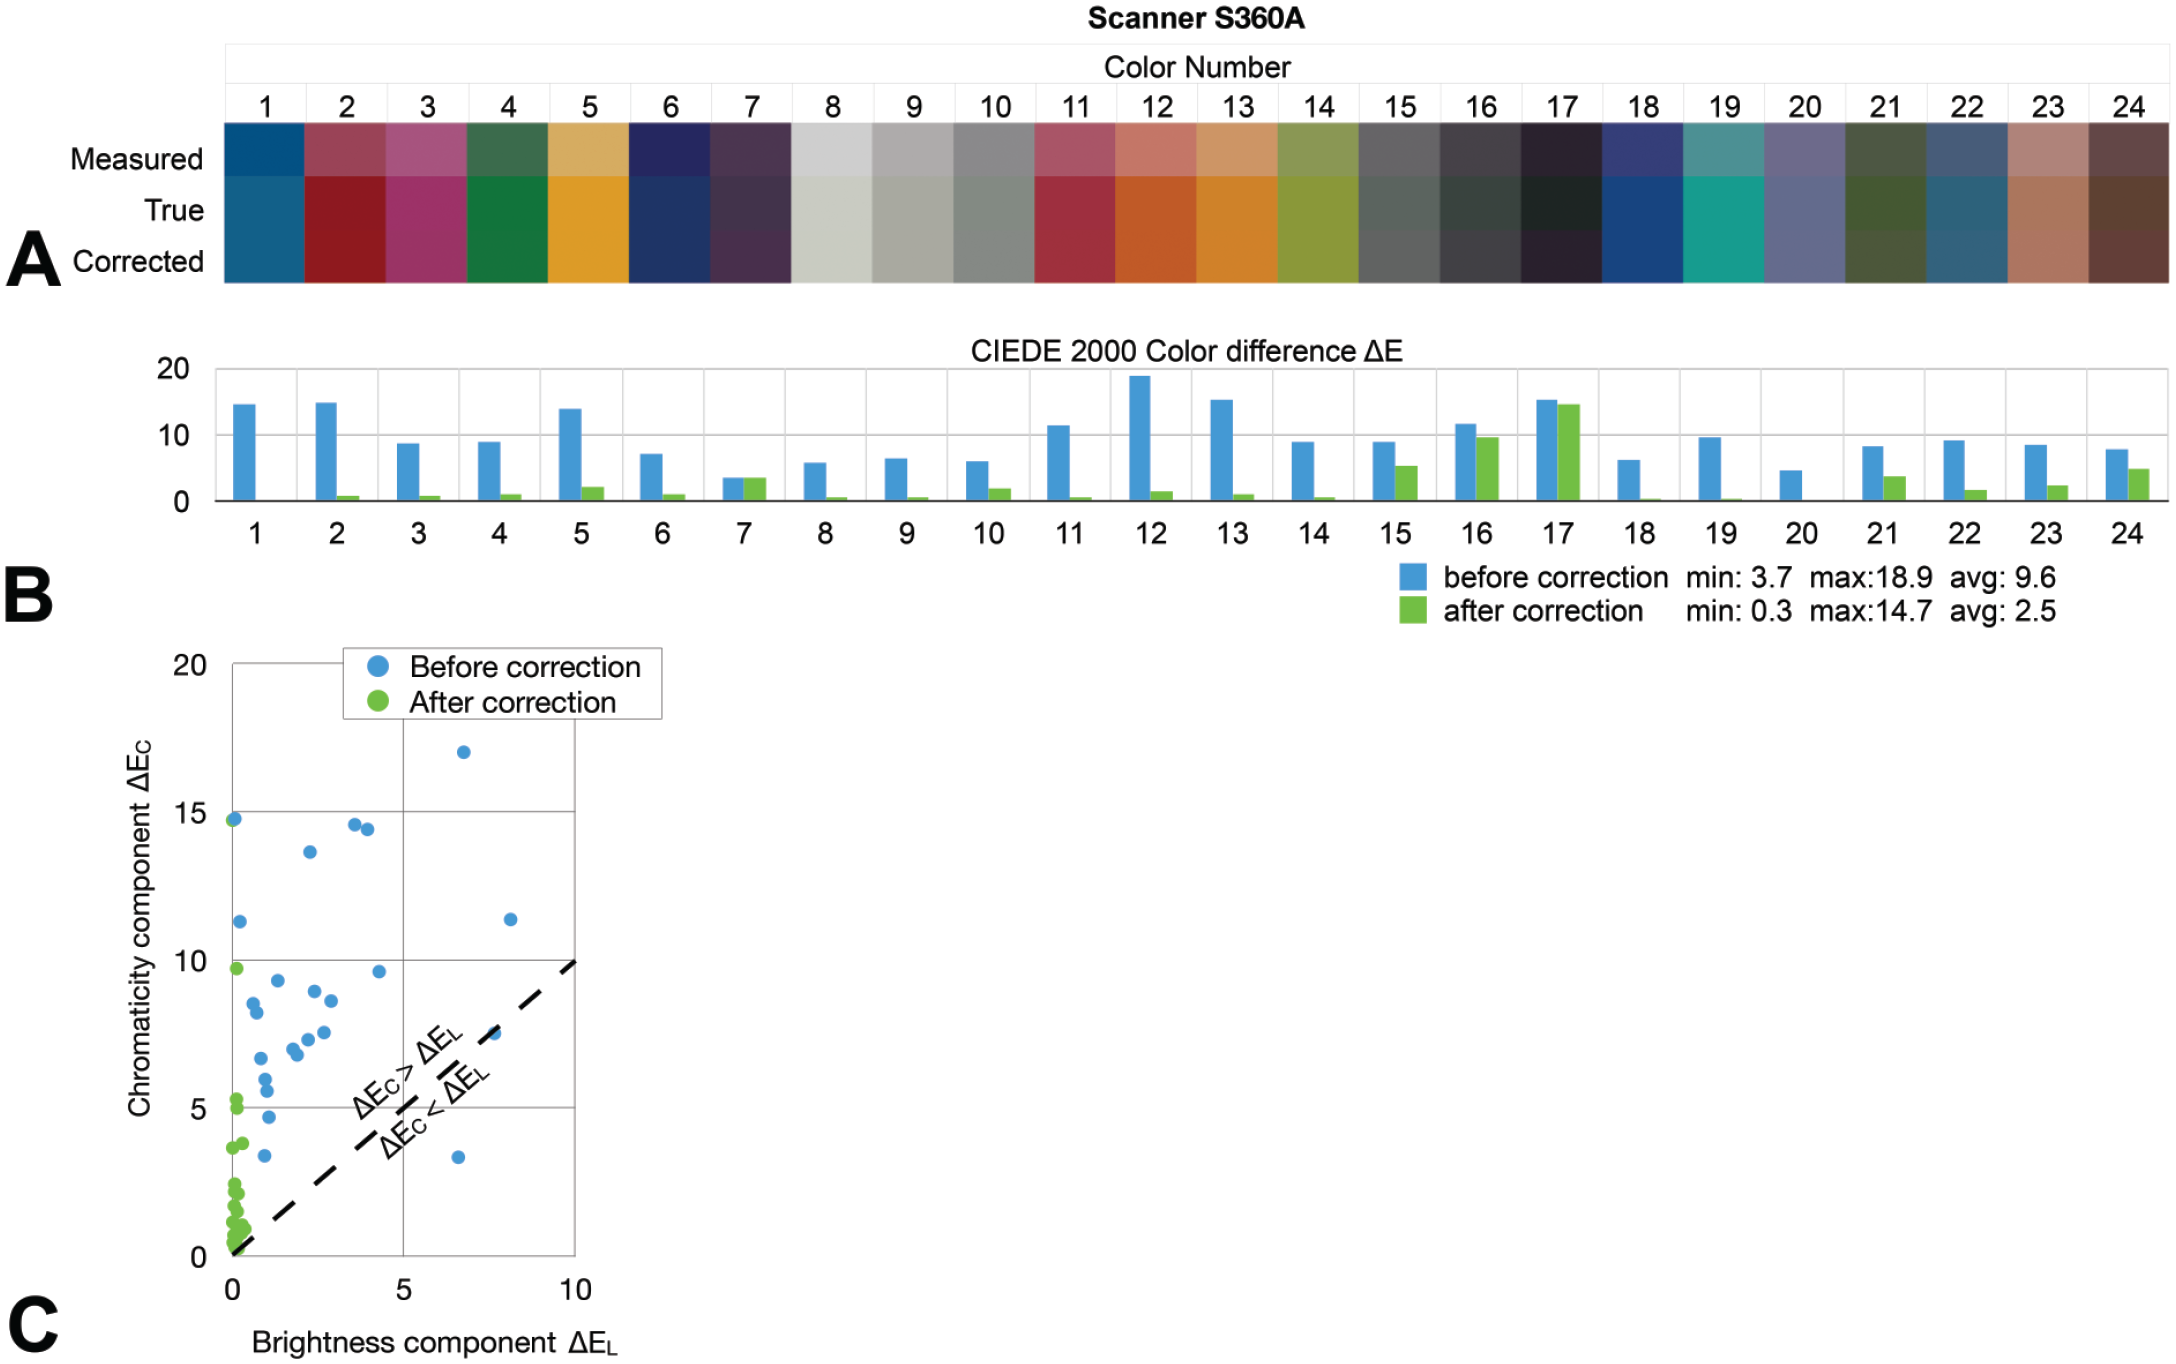
Evaluation of color reproducibility in Scanner S360A before and after color correction implementation: (A) Presents scanner-measured colors and corrected colors achieved through our color-correction module, shown on the first and third rows, respectively, with the second row showing the true colors, derived from the vendor-provided transmittance spectra. (B) Presents a quantitative analysis of the differences between true and measured colors (blue bars); between true and color-corrected colors (green bars). (C) Presents the brightness component ΔEL and chromaticity component ΔEC in ΔE between true colors and colors before (blue dots) and after color correction (green dots) implementation.
Color Reproducibility of three Hamamatsu Nanozoomer Scanners and an Olympus VS200 Scanner
Color deviation from true colors
The comparison of measured and true colors from Scanner S360A is displayed in the first two rows of Figure 5A. The deviation is shown as blue bars in Figure 5B, calculated using the color difference ΔEs between the measured and true colors.
A perceptible difference between the true and measured (i.e., uncorrected) colors was evident for all scanners, as most of the ΔEs were greater than 2.2. The mean ΔEs for 24 colors were 9.6, 9.1, 3.6, and 8.1 for Scanner S360A, S360B, XR, and VS200, respectively, indicating slightly better color reproducibility in the XR model compared with the S360 models and Scanner VS200.
In addition, both the chromaticity ΔEC and brightness ΔEL components in the ΔEs for all scanners were non-zero, as shown in Figure 5C and the supplemental materials. This implies that the color deviation was attributable to a combination of these two factors. Specifically, the chromaticity component was larger than the brightness component for the majority of colors, as shown in Figure 5C that most of the blue dots are in the area of ΔEC > ΔEL. The mean ratio of the two components (i.e., ΔEC/ΔEL) is 2.9 and 1.8 for Scanner S360A and S360B, 11.2 for Scanner XR, and 20.5 for Scanner VS200. These ratios confirm that chromaticity has a more significant impact on the deviation than brightness.
Color variation among four scanners
The color variation between all scanners is illustrated in Figure 6A by a color stripe. The S360 models had lower visible inter-scanner color variation, with a negligible mean color difference of 0.8 (purple bars in Figure 6B). These values were lower than the perceptible ΔE threshold of 2.2, indicating that there were no perceptible color differences between the S360 models.
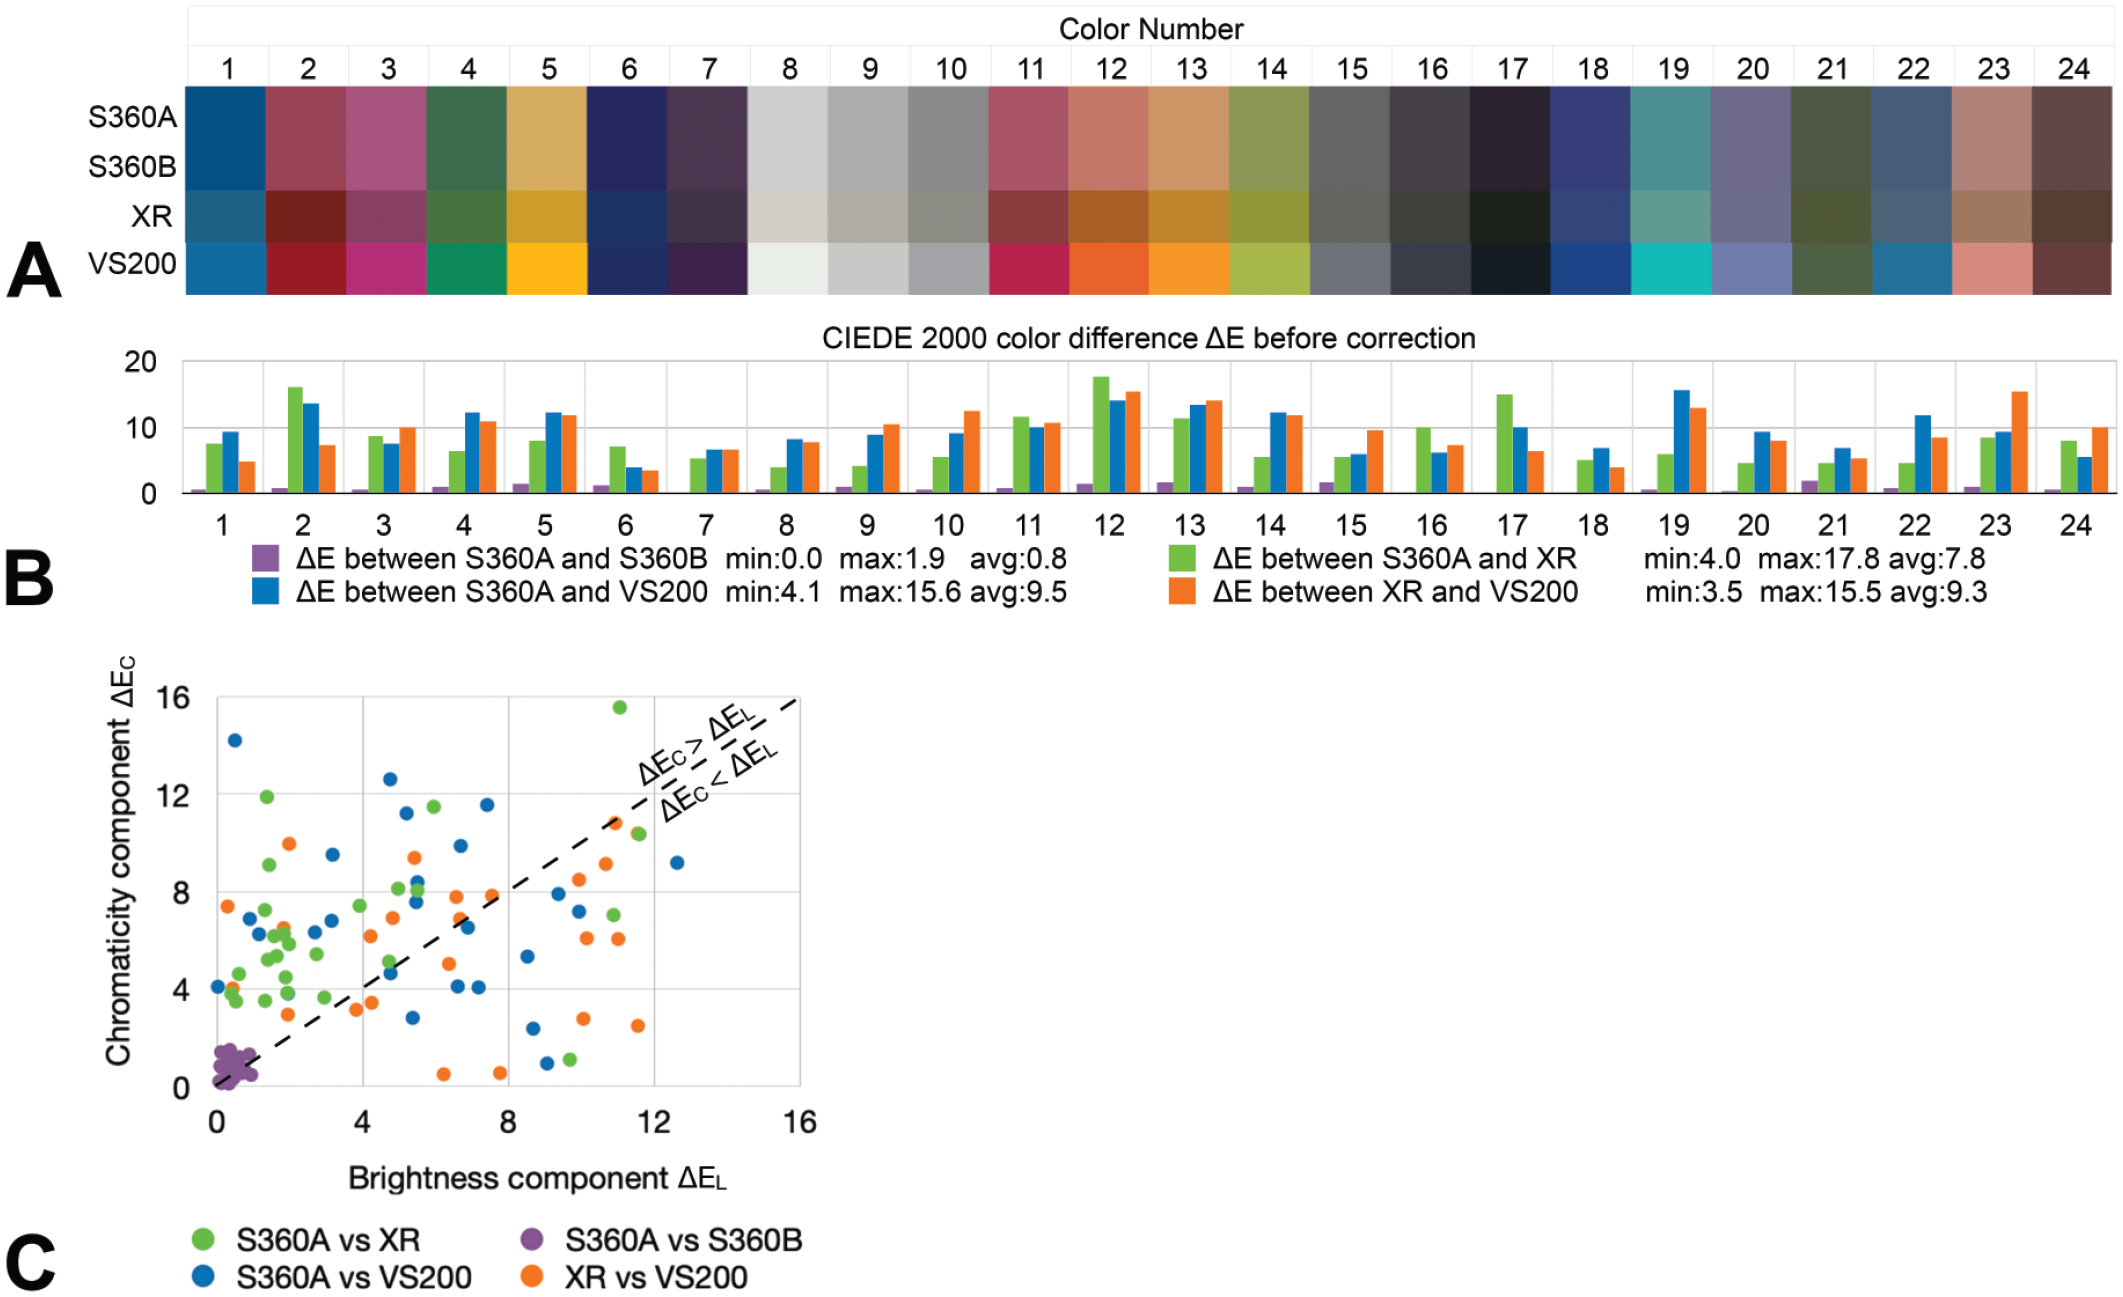
Color variation among scanners before applying color correction: (A) The four rows present the measured colors from the four scanners, respectively. (B) The color differences ΔE between scanner pairs. (C) The brightness and chromaticity components of ΔE between scanner pairs.
In contrast, greater color variation was present between the Scanner S360A, XR, and VS200, as evidenced by a higher mean ΔE of 7.8 between Scanner S360A and XR (green bars in Figure 6B), a mean ΔE of 9.5 between Scanner S360A and VS200 (blue bars in Figure 6B), and a mean ΔE of 9.3 between Scanner XR and VS200 (orange bars in Figure 6B). These values exceed the perceptible ΔE threshold of 2.2, clearly demonstrating perceptible color differences between scanners of different models, and an even larger color difference between scanners from different manufactures. These ΔEs reflect the visible color differences seen in Figure 6A and highlight the need for color correction.
In addition, in Figure 6C, comparing the brightness and chromaticity components in ΔE between the two S360 models (purple dots) reveals relatively small values, indicating a high degree of consistency between these devices.
In contrast, both ΔEL and ΔEC were higher between Scanner S360A, XR and VS200. Notably, the larger ΔEC for most colors suggest that the color discrepancy between the S360 and XR models was primarily driven by chromaticity differences (green dots in Figure 6C), with a mean ratio of the two components (i.e., ΔEC/ΔEL) of 4.9. This observation indicates that the two models exhibit more pronounced variation in color characteristics, with chromaticity being the main contributing factor.
Furthermore, Figure 6C reveals evident variation in both chromaticity and brightness (shown by blue and orange dots) between scanners from different manufacturers (Scanner VS200 from Olympus; Scanner S360A and XR from Hamamatsu). The mean ΔEC/ΔEL is 2.23 between Scanner VS200 and S360A, and 2.01 between Scanner VS200 and XR. These ratios indicate that while both chromaticity and brightness contribute to variation, chromaticity remains the dominant factor across different manufacturers’ scanners.
Chromaticity deviation and variation among scanners
In Figure 7A-C, a CIE x-y plot visualizes the chromatic deviation from the ground truth and variation among scanners. Figure 7A demonstrates the chromaticity of 24 color patches measured from three scanners and the ground truth, showing the non-linear distortion of the color reproduction from the scanners. Figure 7B and C are close-up views of two colors, exhibiting various chromatic shifts on the x-y plane. Moreover, the smaller dynamic range of chromaticity of the four scanners (i.e., the range of chroma covered by the 24 colors in Figure 7A), compared with the true chromatic dynamic range, was also evident in Figure 7A, suggesting the scanners’ limited capabilities in reproducing the full spectrum of colors.
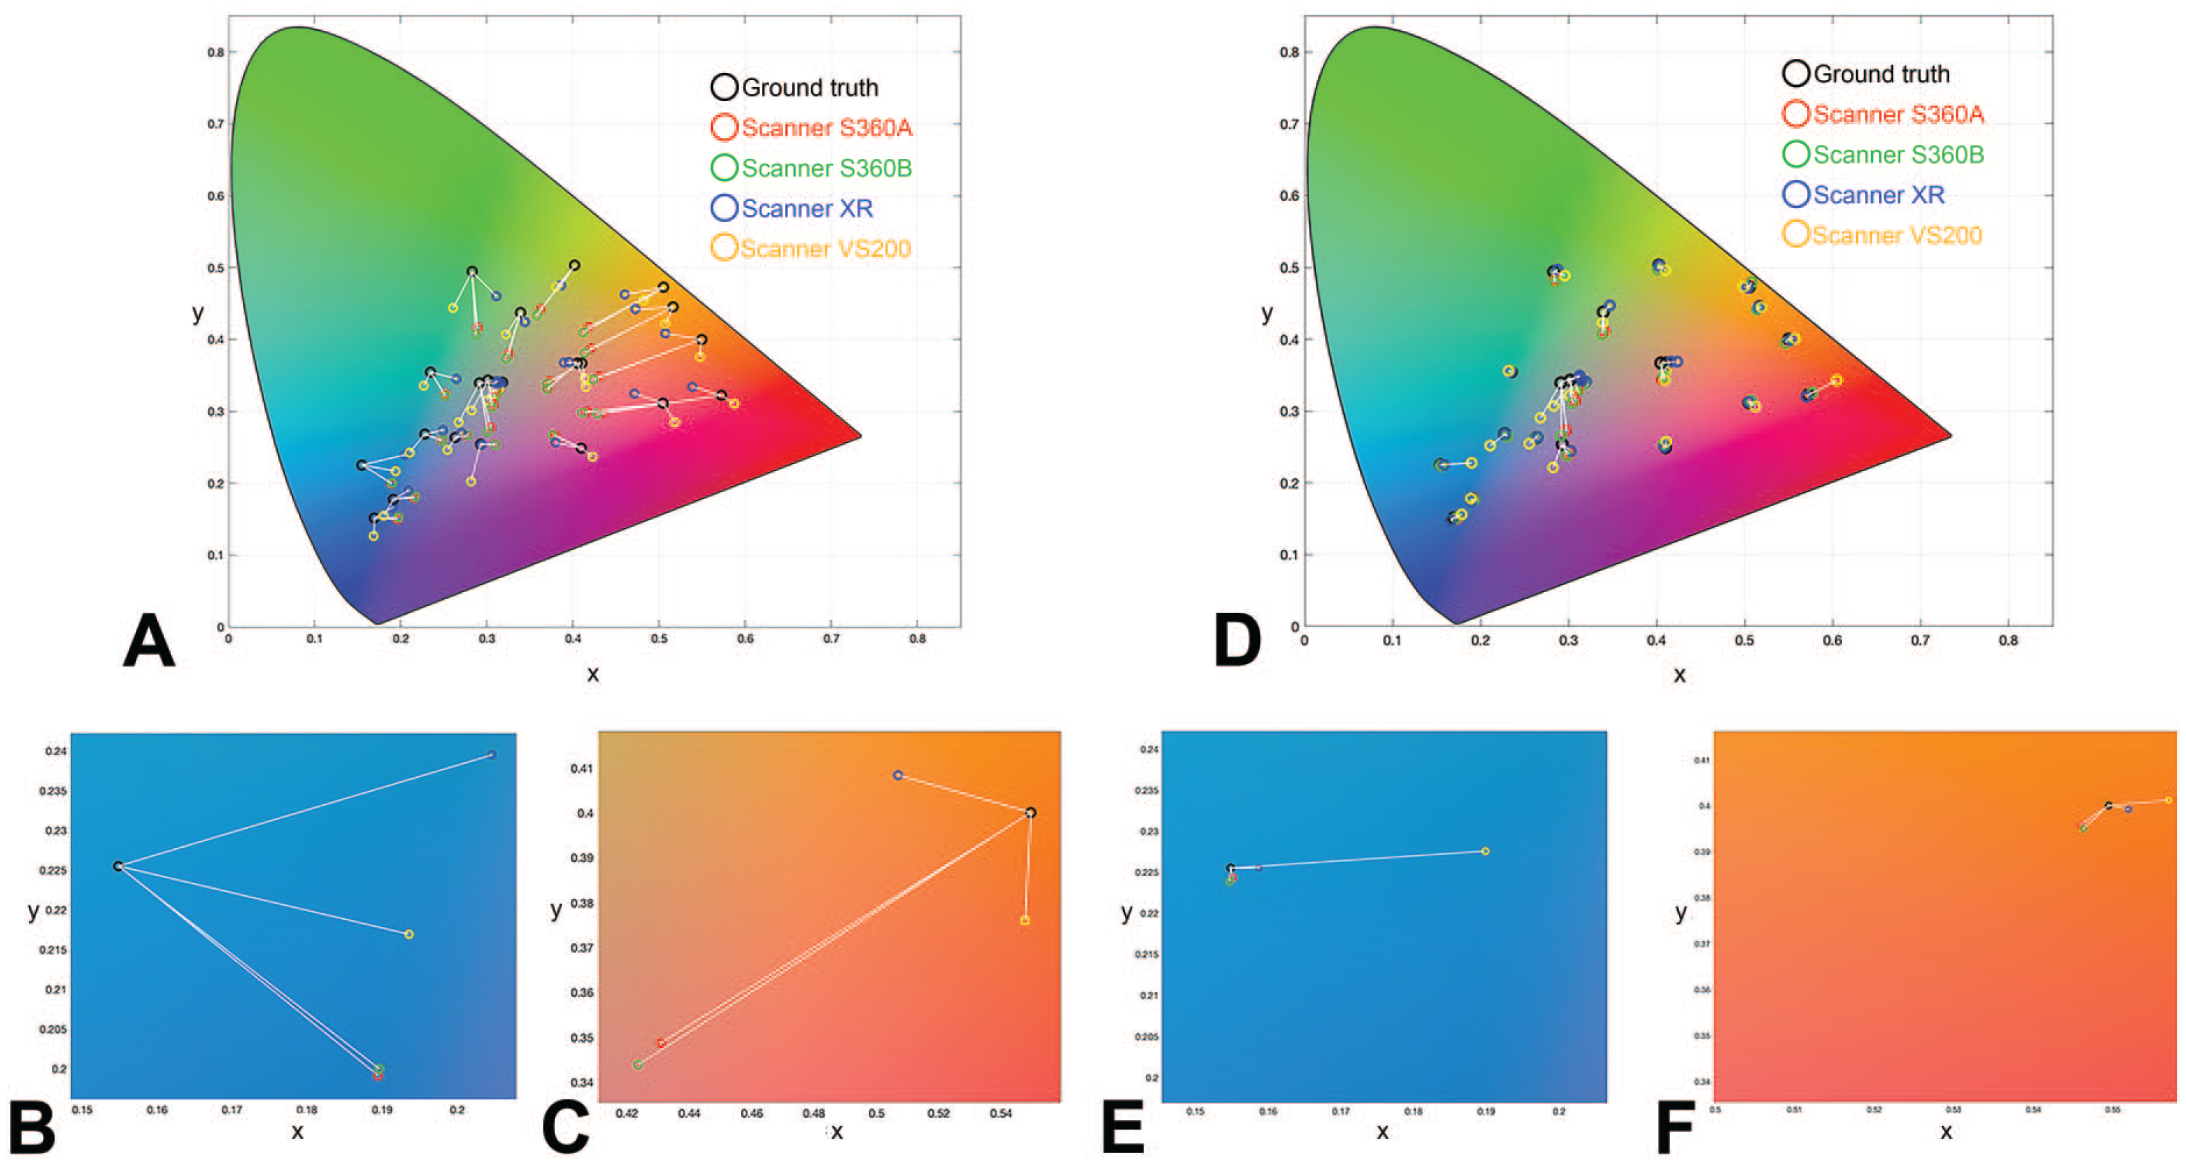
The CIE x-y plots showing the chromaticity of the true, measured and corrected colors. (A) The chromaticity of true and measured colors with close-up views from (B) blue, (C) orange colors, (D) the chromaticity of true and corrected colors with close-up views from (E) blue, and (F) orange colors.
The chromatic variation among the scanners can also be easily seen in Figure 7A-C where closer chromaticity is observed for the two S360 models, while the XR and VS200 models have larger chromatic deviations.
Color differences in H&E-stained images
The impact of this measured color variability on the visual appearance of WSIs was assessed qualitatively by visually comparing a single slide scanned on the scanners under evaluation. Two H&E-stained WSIs generated by the four WSI scanners are shown in Figures 8A and 9A, by displaying their raw images using ImageJ.
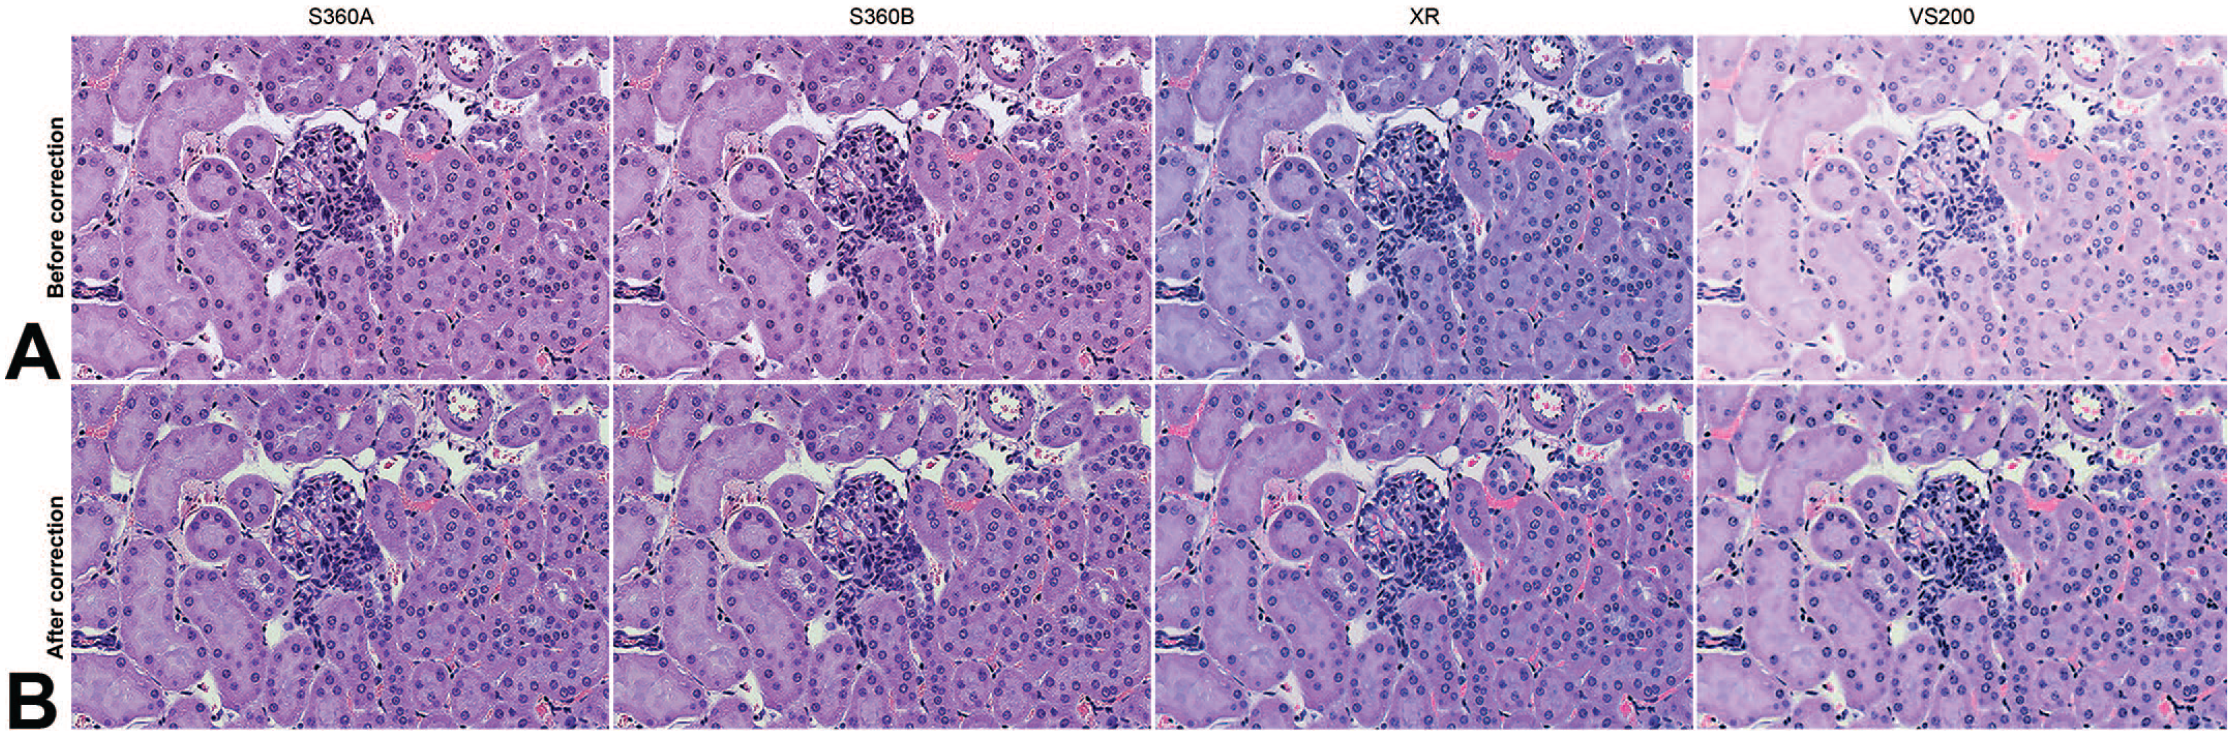
Pixels images, 1200 × 770, extracted from the whole slide images generated by three scanners from kidney tissue. (A) Raw images before color correction and (B) color-corrected images.
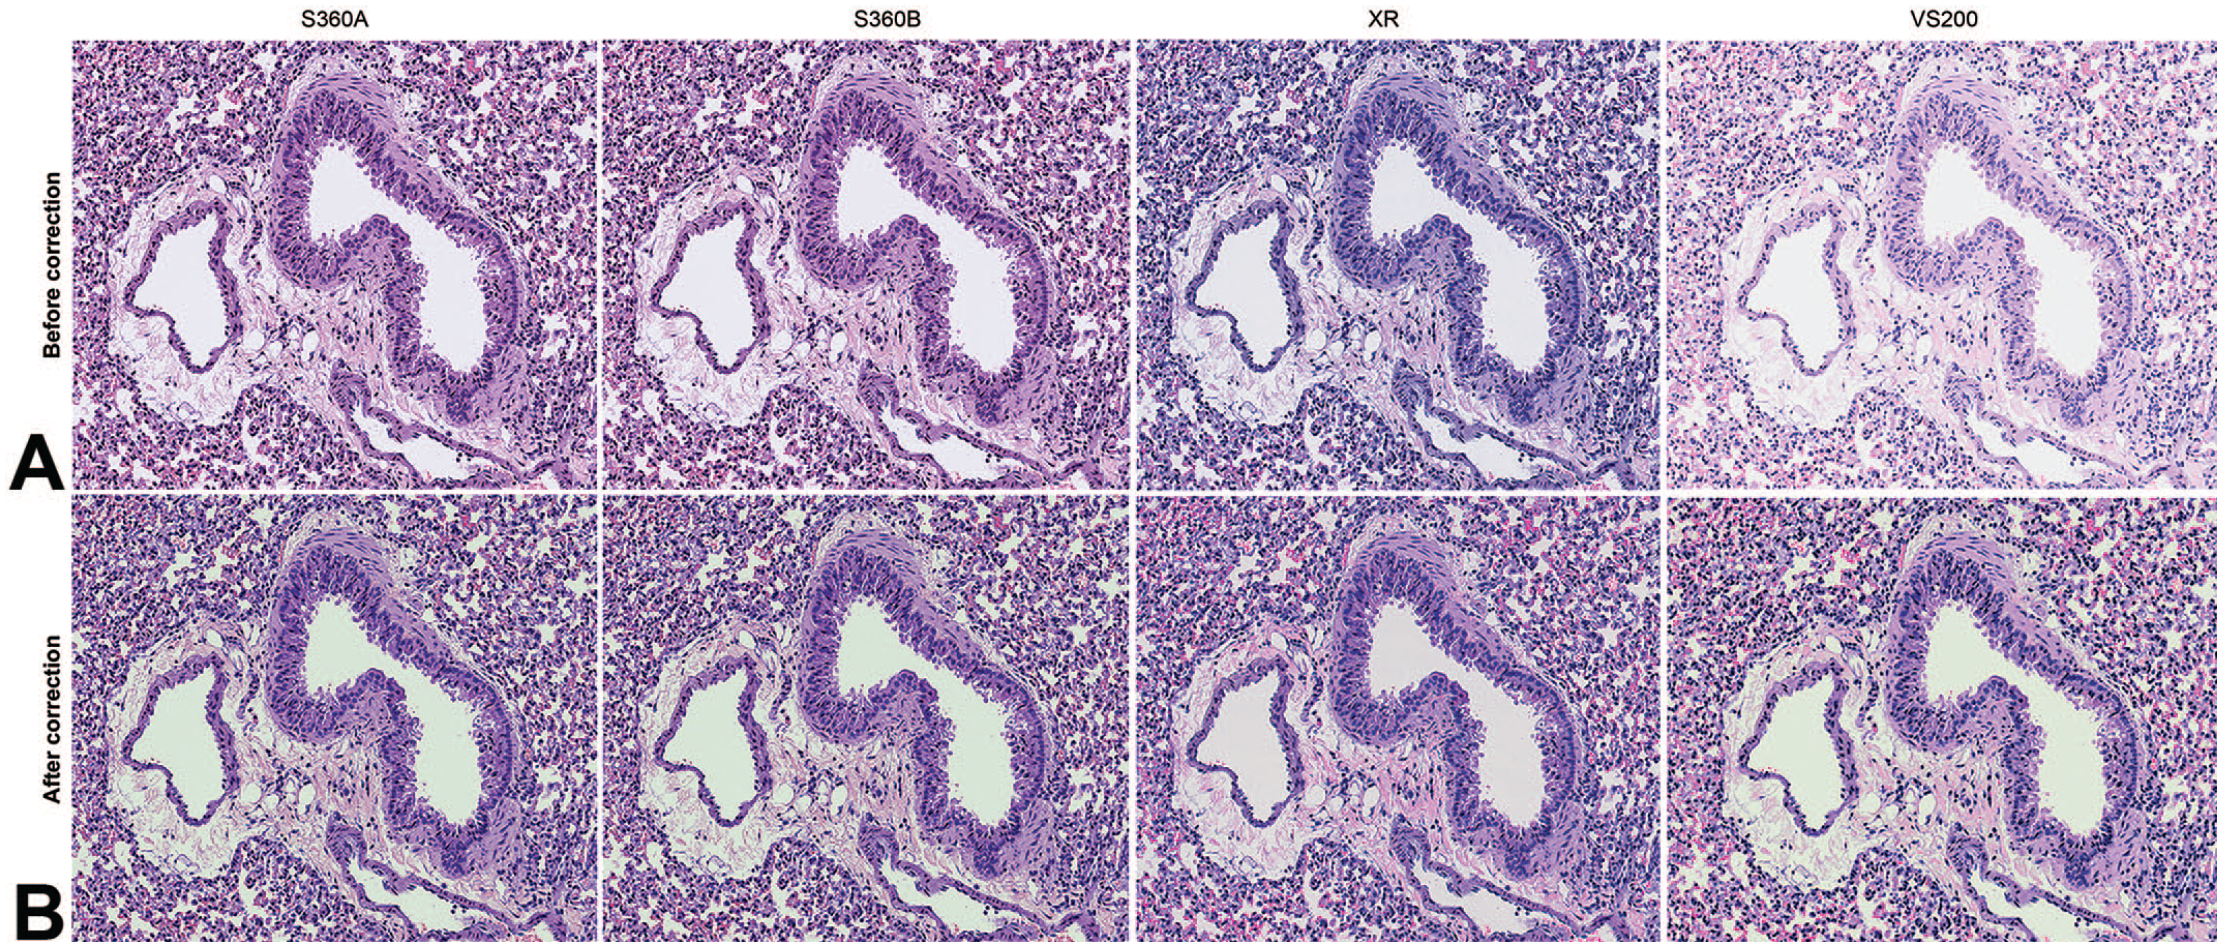
Pixels images, 1260 × 1080, extracted from the whole slide images generated by three scanners from lung tissue. (A) Raw images before color correction and (B) color-corrected images.
The results demonstrate barely visible differences between WSIs from Scanner S360A and S360B, while there were clearly visible color differences from Scanner XR and VS200. In particular, WSIs from Scanner XR visually appear more blue and WSIs from Scanner S360A and S360B appear more pink. These perceived differences were confirmed by quantitative analysis. Figure 10A presents the distribution of the x and y values for all pixels in WSIs from Scanner S360A, XR, and VS200 (shown in Figure 8A) using 99% confidence covariance ellipses. The chromaticity distribution in WSIs from Scanner S360A exhibited a pinkish inclination with a mean (x, y) of (0.31, 0.29), while Scanner XR and VS200 generated images with more blue with a mean (x, y) of (0.30, 0.29).
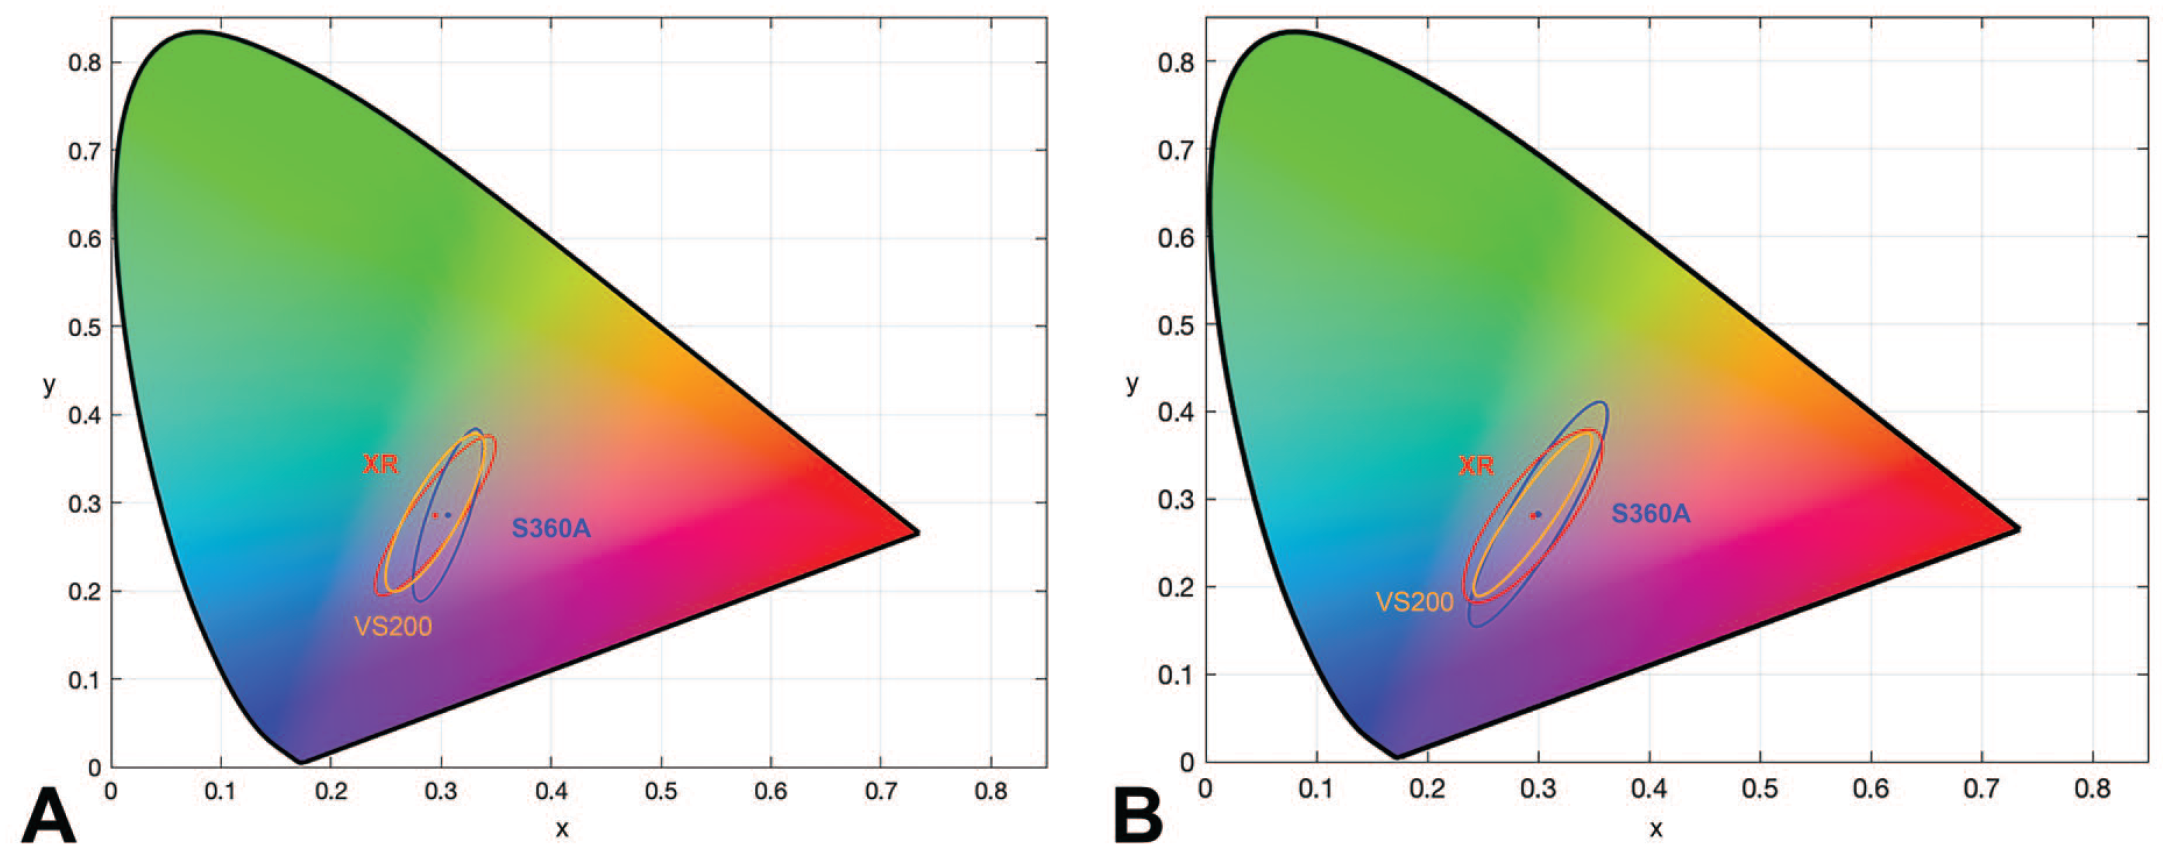
The chromaticity distribution of H&E-stained whole slide images (WSIs) before and after color correction, which is presented by showing the 99% confidence covariance ellipses of the x and y values for all pixels in WSIs. (A) The distribution of WSIs before color correction (shown in Figure 8A) and (B) After color correction (shown in Figure 8B) from Scanner S360A, XR and VS200.
In the first module of the process, the color reproducibility of WSI scanners was assessed by CIEDE 2000 color difference ΔE and the deviation of the CIExyY values. We found that there is color deviation and variation in the scanners, which can be more significant when the WSI scanners are of different models and from manufacturers. To mitigate the color distortion, a color correction module was developed and its performance is described below.
The Performance of Color Correction
Color calibration
The effectiveness of color calibration is demonstrated in the third row of Figure 5A, showing that the corrected 24 colors from Scanner S360A have reduced deviation from true colors. Similarly presented results for Scanner S360B, XR and VS200 can be found in Supplemental Figures S1-S3. The reduced deviations were also quantitatively assessed, with the results presented in Figure 5B (green bars). The results show substantial reductions in ΔEs, achieved as a result of completing the color correction processes.
In addition, both brightness and chromaticity components in the ΔE were reduced, as shown in Figure 5C (blue dots), indicating the reduction of deviation of both characteristics. The residual chromaticity components were larger than the brightness components, implying that the primary deviation of the corrected colors to the ground truth was chromaticity.
The chromatic deviation of the corrected colors from the true colors is also displayed in CIE x-y plots in Figure 7D-F, where the points are closer within each color cluster, indicating that the colors have been calibrated accurately and the chromatic differences have been reduced.
Color normalization
The color correction results for the four scanners are shown in a color stripe in Figure 11A, showing reduced variation in colors between scanners post-correction. Figure 11B shows an average ΔEs of 0.3 for the 24 colors between two S360 models, demonstrating the negligible color differences between them. The mean ΔE between the Scanner S360A and XR is 2.4, indicating that the color correction procedures effectively reduce the color difference between different models to nearly imperceptible (ΔE threshold of 2.2), and normalize color among scanners.
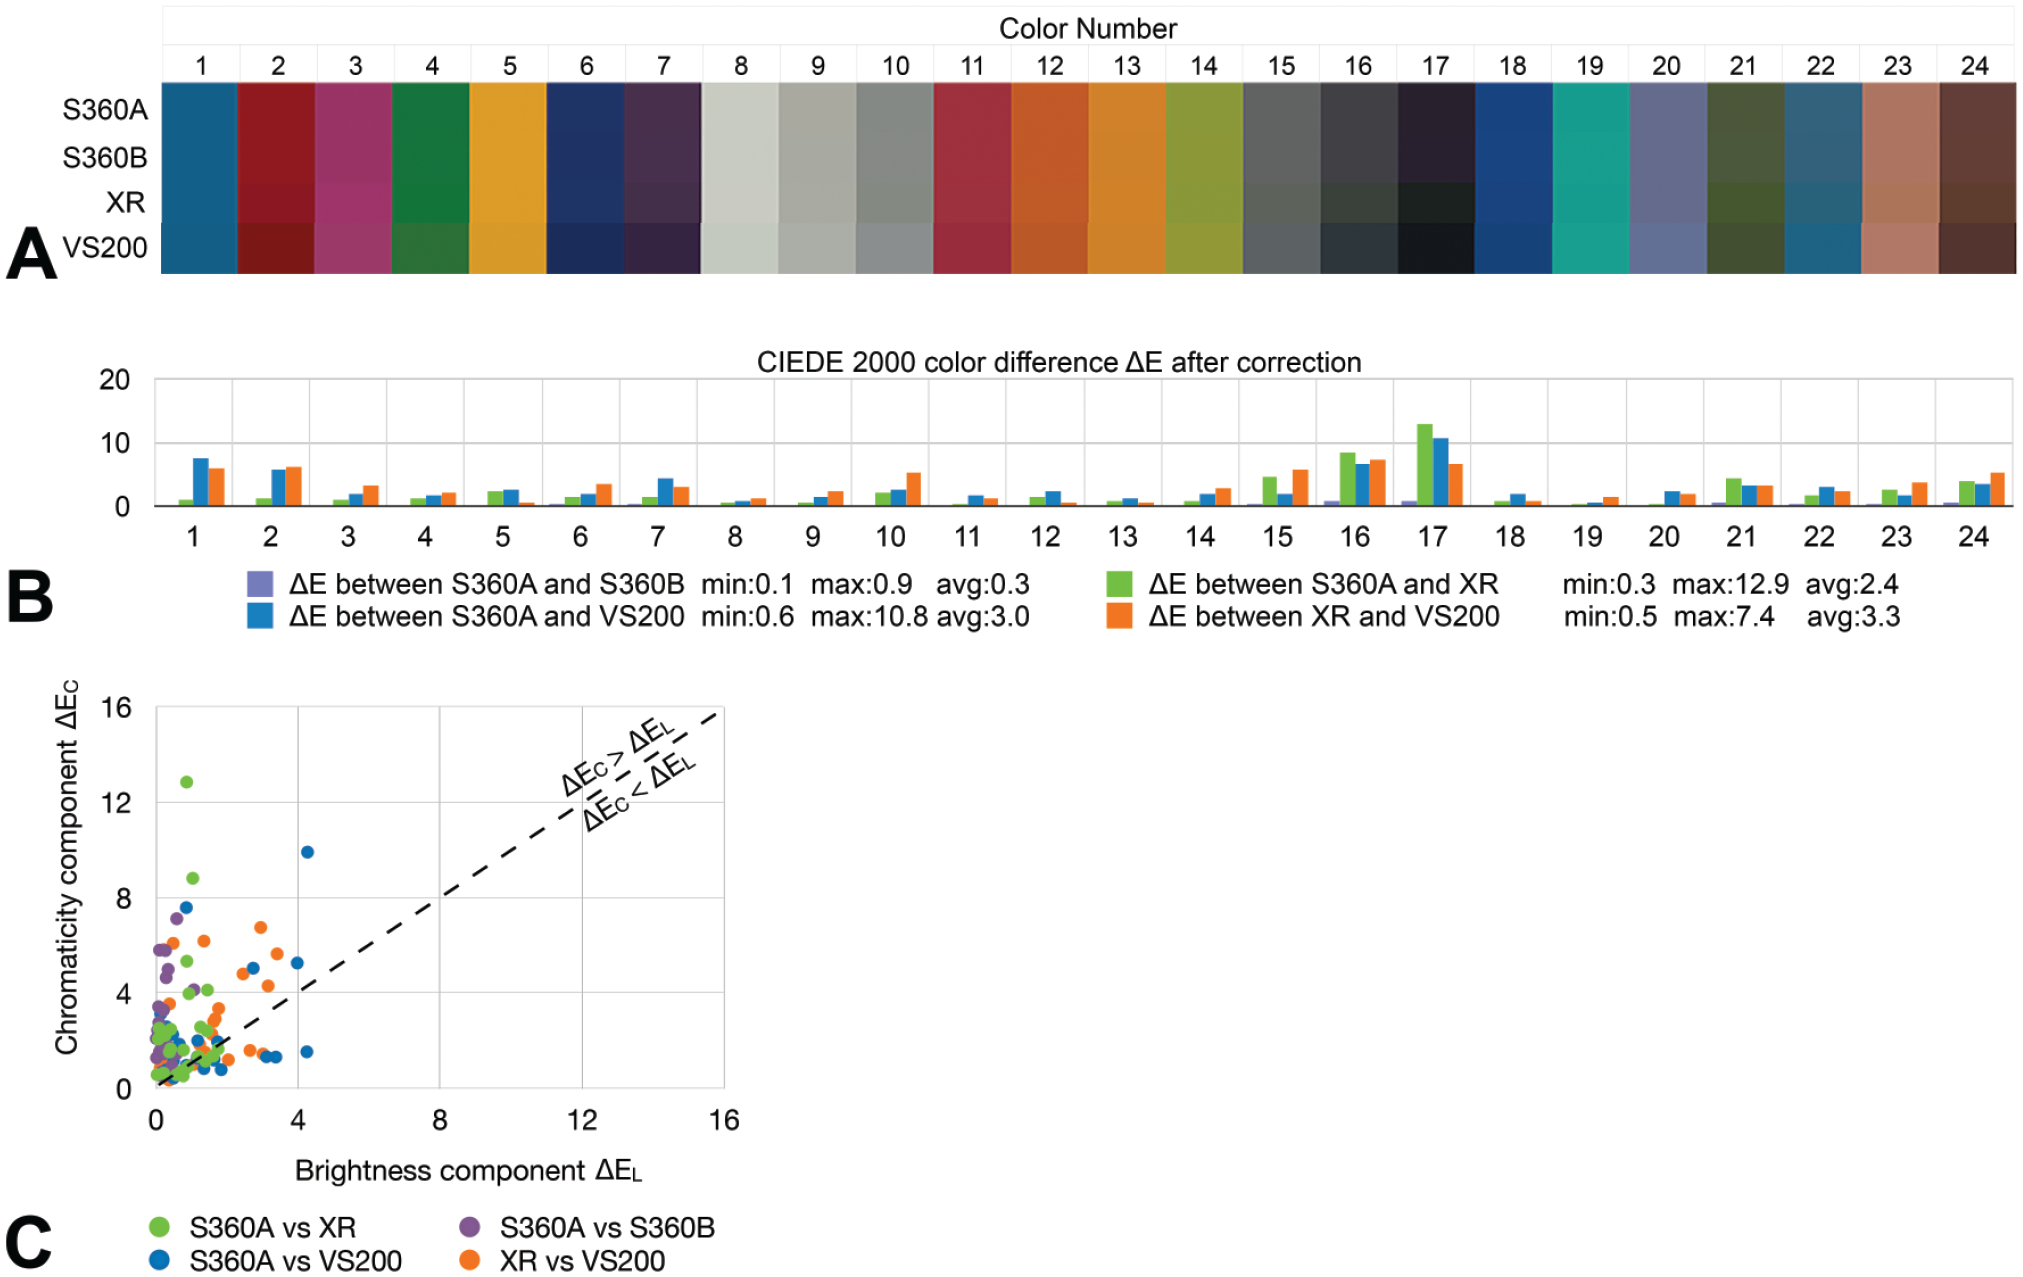
Color variation among scanners after applying color correction: (A) The four rows present the corrected colors from the four scanners, respectively. (B) The color differences ΔE between scanner pairs. (C) The brightness and chromaticity components in ΔE between scanner pairs.
Moreover, the color correction process also diminished output color variation between scanners from different manufacturers. This is indicated by the reduced mean ΔE values of 3.0 between Scanner S360A and VS200, and 3.3 between Scanner XR and VS200. These ΔE values highlight the effectiveness of our color correction procedures, reducing the color differences between scanners from different manufacturers to a level that is only marginally perceptible. An enhancement in both brightness and chromaticity homogeneity was evident from the color correction, as demonstrated by the low values for these terms shown in Figure 11C. The decreases in values indicate that the differences between the corrected colors from the four scanners have been reduced, with small residual chromaticity differences. However, in spite of these improvements, color differences in darker colors persist and remain perceptible.
Color correction in H&E-stained histopathology images
The color correction’s impact on WSI visual appearance was evaluated by visually comparing color-corrected images from a single slide scanned on different scanners. The color-corrected images generated by our color correction model are shown in Figures 8B and 9B.
The results show that our model maintains color homogeneity in images from the S360 models and minimizes color variation in images from Scanner S360A, S360B, XR, and VS200. This improved homogeneity was confirmed by quantitative analysis. In Figure 10B, the distribution of the x and y values of all pixels in color-corrected WSIs from Scanner S360A, XR, and VS200 (shown in Figure 8B) are displayed, presented by the 99% confidence covariance ellipses. This reveals that the chromaticity distribution in these WSIs is more closely aligned with the mean values of (x, y) = (0.30, 0.29) for all scanners.
Color Stability of the Hamamatsu WSI Scanners
The color stability of Hamamatsu WSI scanners was monitored by evaluating color variation over time. Scanners S360A and S360B operated continuously, scanning an average of approximately 730 and 760 slides per week, respectively. Scanner XR was not in routine use and is only turned on when additional slide scanning capacity is required. To include the XR scanner in this analysis, each scanning operation for this study (3-5 slides per week) was conducted 30 minutes after the scanner was powered on each week.
Figure 12 shows the weekly color information collected by Scanner S360A in eight months. The visual appearance of color variability was assessed by comparing the measured colors (Figure 12A), which revealed visible variance on weeks 10 and 21 for Scanner S360A. As shown in Supplemental Figures S5-A and S6-A, there were visible variances on weeks 11 and 15 for scanner XR, and Scanner S360B showed more visible color fluctuations at various time points.
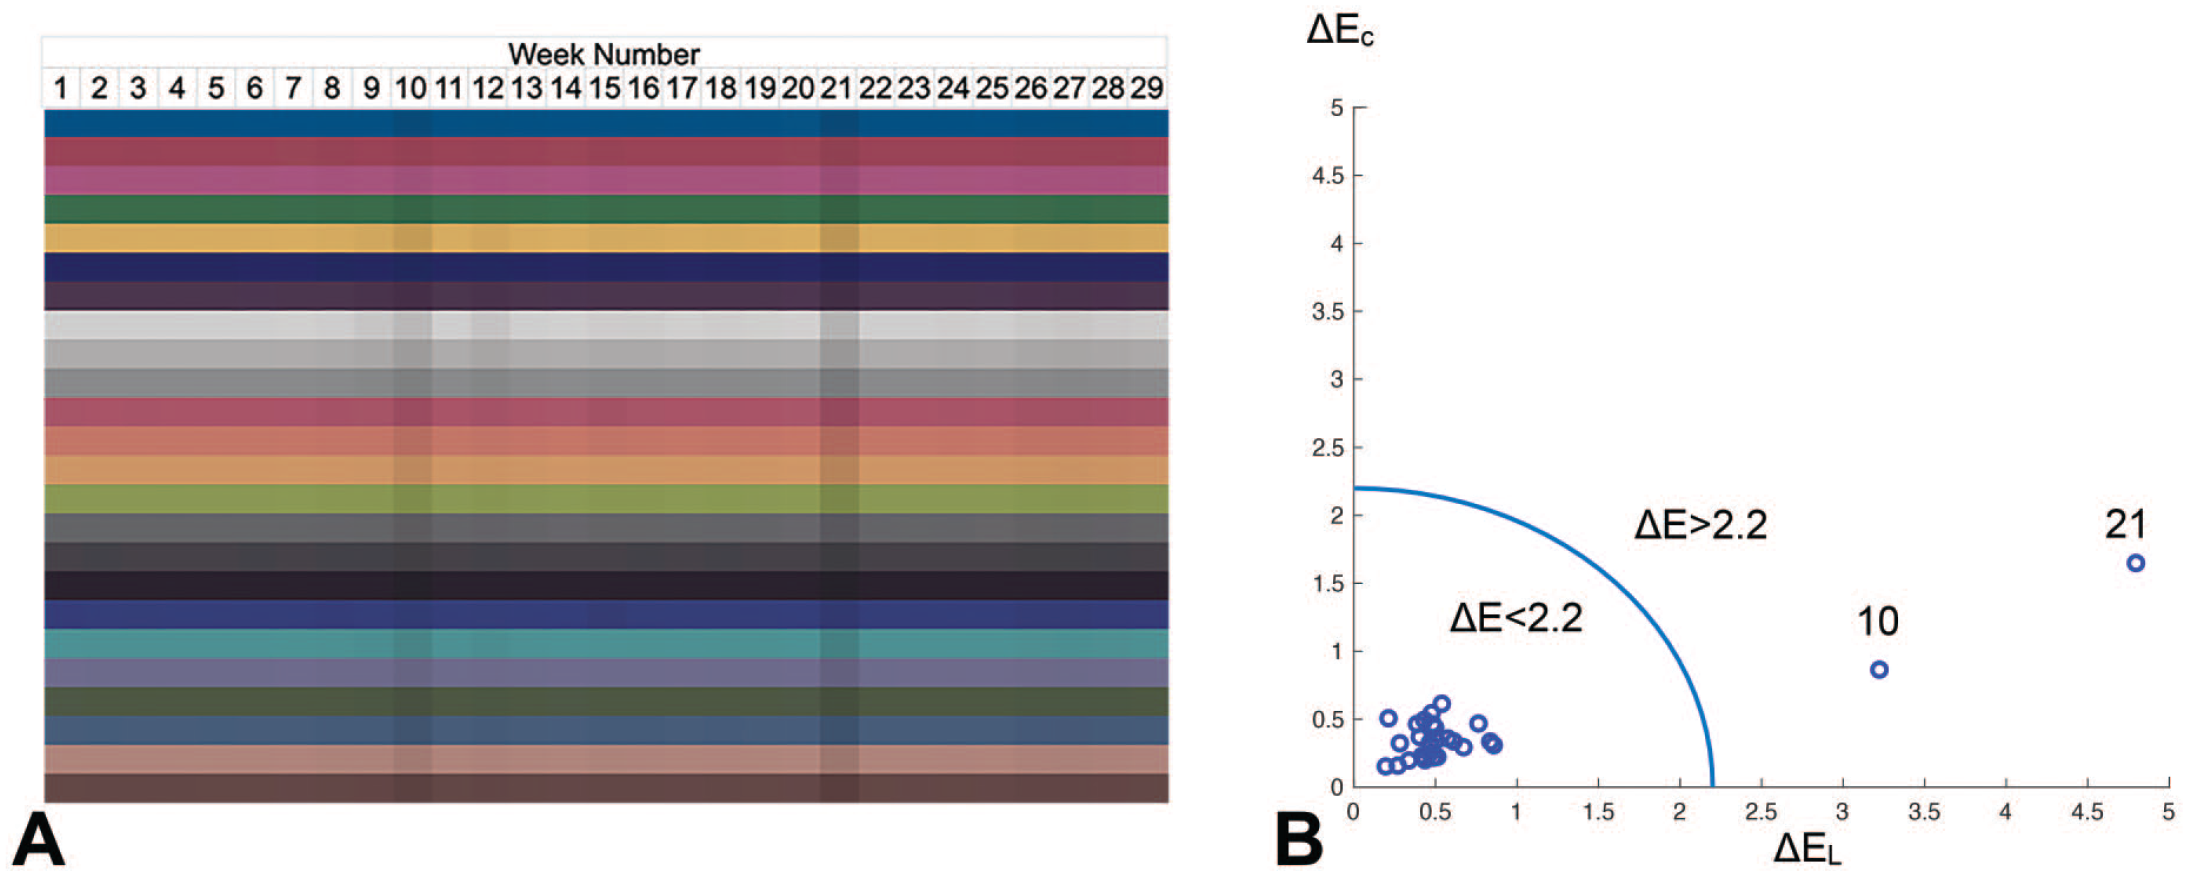
Color stability of the scanner S360A over time: (A) Measured colors from weeks 1 to 29. (B) A 2D-plot presenting the weekly averages for chromaticity (ΔEC) and brightness (ΔEL) components, with a circular blue line marking the perceptible threshold ΔE = 2.2. The weekly mean differences are denoted by blue circles. Only those weeks with ΔE > 2.2 are labeled.
Figure 12B quantitatively highlights the weeks 10 and 21 with perceptible color differences ΔE compared with the average for Scanner S360A—specifically, those that fall outside the circle delineating the perceptible threshold. The figure also presents a larger weekly brightness component ΔEL than chromaticity component ΔEC, implying that brightness is the primary factor inducing color variation over time.
The impact of brightness variation on the performance of our color correction module was evaluated by analyzing the differences in colors corrected using the weekly updated modules versus the first-week module (outdated module). Figure 13A and B displays the colors collected by Scanner S360A over 29 weeks, corrected by the weekly updated and the outdated modules, respectively. Figure 13C presents the average brightness and chromaticity component in ΔE between the two sets of colors for 29 weeks. The results reveal that the primary difference between colors corrected using the updated versus outdated modules was brightness, with ΔEL exhibiting larger values compared with ΔEC. This distinction is particularly pronounced for weeks 10 and 21, as indicated in the figure.
Evaluation of differences between colors corrected using updated versus outdated color-correction modules: The colors collected over 29 weeks as corrected by the (A) weekly updated modules and (B) the first-week module (outdated) are presented, respectively. The color differences between the two sets of colors are depicted in (C), presenting the average brightness component (ΔEL) and chromaticity component (ΔEC) in ΔE across the 24 colors for the 29 weeks using blue circles, with only those weeks with ΔE > 2.2 are labeled.
In this study, we also scanned two H&E slides on a weekly basis, along with the color calibration slide. Figure 14A shows the images generated weekly by the scanners from a single H&E-stained histopathology slide. Despite the reported chromatic and brightness variation, there was little visible color variation over time in these H&E images from all scanners.
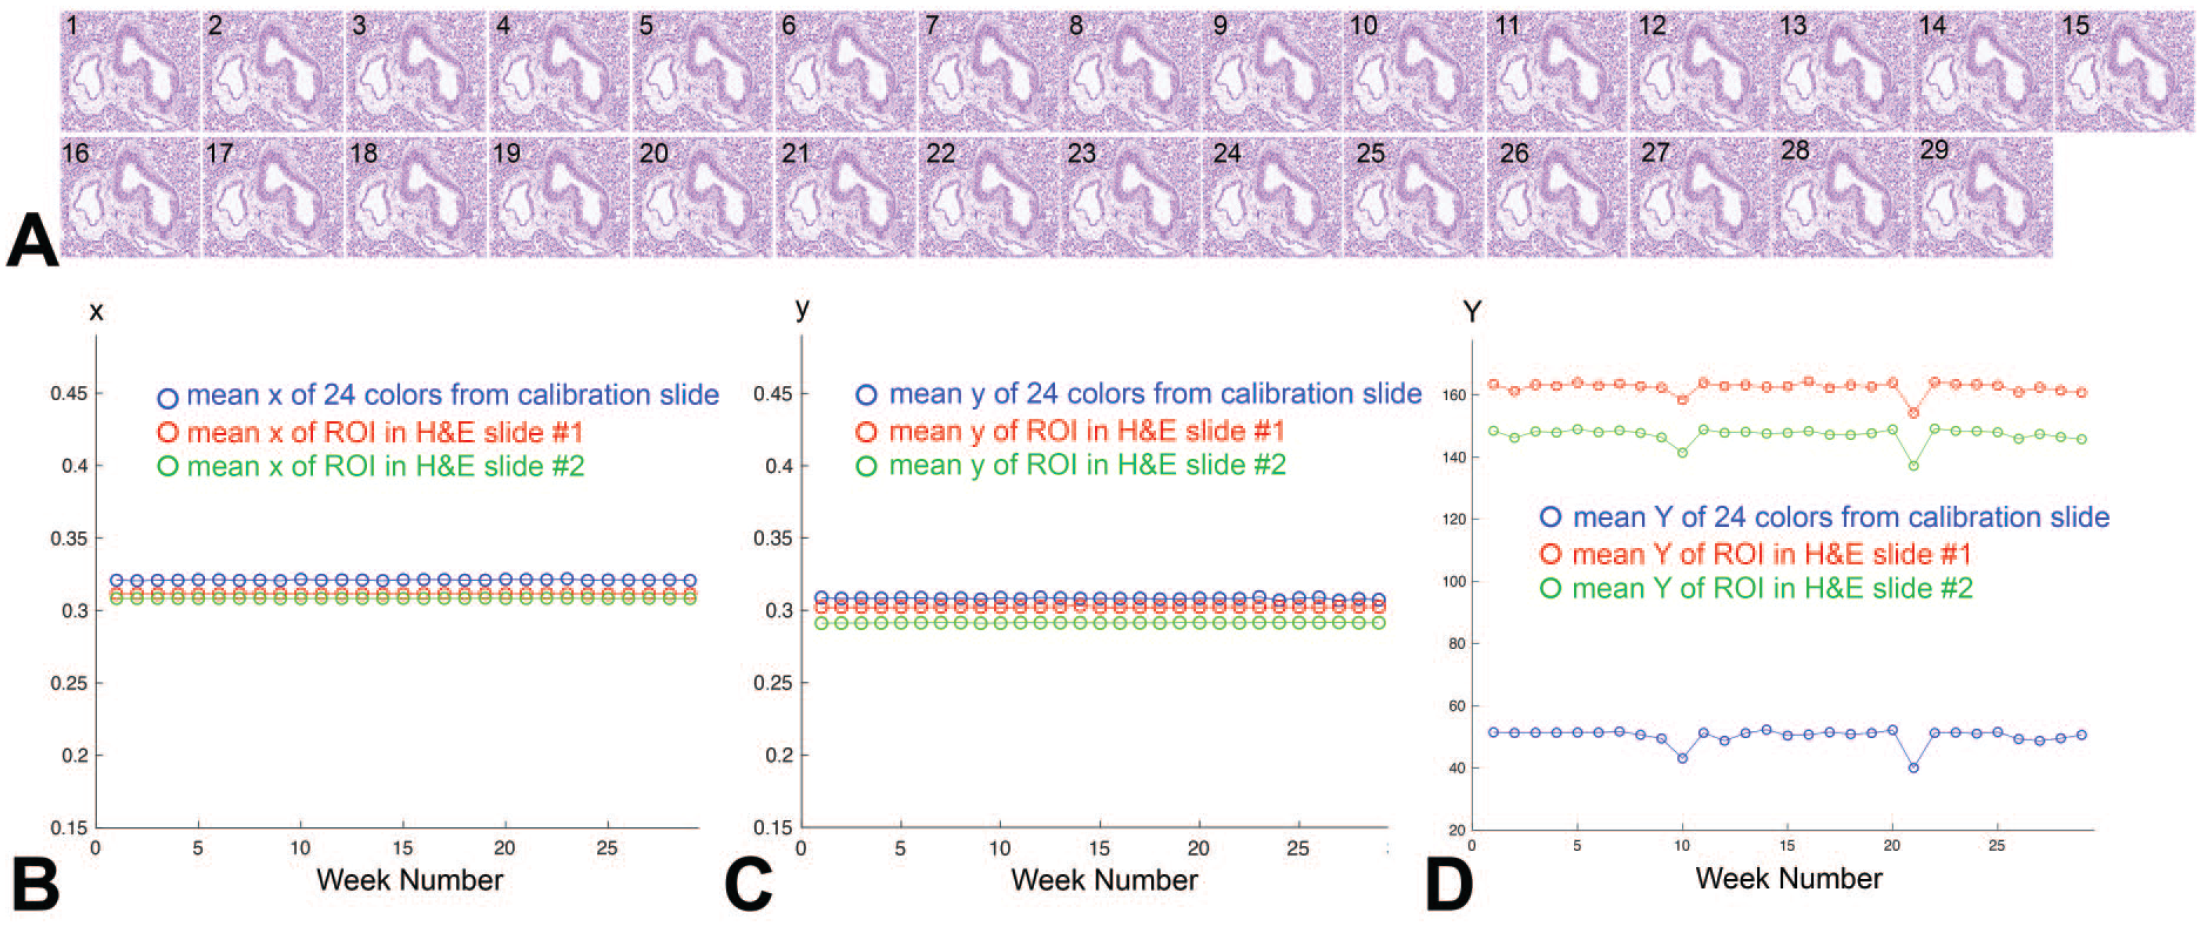
(A) The whole slide images generated by scanner S360A from weeks 1 to 29 are presented, with the week number indicated in the upper left corner. The average chromaticity (B) x and (C) y values and the brightness (D) Y values from the region of interests of two H&E slides and the 24 colors from the calibration slide are illustrated.
In addition, the chromaticity and brightness (CIExyY values) extracted from these images were utilized to rule out the possibility that observed variations were scan-specific. As shown in Figure 14B-D, there were consistent chromaticity and brightness fluctuation patterns for both the H&E images and the color calibration slide. These parallel fluctuations imply that the chromaticity and brightness variations over time were not confined to specific scans but were indicative of scanner-wide trends.
Supplemental material S6 provides a comprehensive analysis of the brightness and chromaticity fluctuations over time for the three Hamamatsu scanners, using CIExyY values. Readers interested in further insights into the scanners’ color stability can refer to this additional material.
Discussion
In this article, we present a process for color correction in WSIs that can assess color reproducibility and mitigate color distortion of WSI scanners. The process ensures consistent color reproduction among WSI scanners and enhances color accuracy on WSIs. It is important to clarify that the scope of this article does not extend to the validation of the whole slide imaging system for diagnostic purposes. There are established guidelines and updated recommendations27,28 specifically addressing this aspect, ensuring that pathologists make accurate diagnoses from WSIs to at least the same level as light microscopy. Our study, instead, focuses exclusively on the improvement of color reproducibility in WSI scanners, a factor that potentially correlates with the performance of digital image analysis applications.
Inaccurate and inconsistent color reproduction across WSI scanners may affect the performance of AI-aided image analysis applications and thus is a concern when building a large repository of WSI data for advanced computation.1 -7 Our study assessed the color reproducibility of our four WSI scanners, and found inaccurate color reproduction from each of them. Color variation among WSI scanners was also observed in our study, showing higher levels of chromatic variation between the different models and manufacturers. The impact of this measured color variability was apparent on the visual appearance of WSIs.
The proposed color correction module customized for each scanner effectively improves color accuracy and normalization across WSI scanners. Improved normalization also enhances the color homogeneity on the visual appearance of WSIs.
Our study assessed the color stability of our WSI scanners over a period of time, and found that the primary factor contributing to noticeable color variation was brightness. The need to update our color correction models, therefore, is based on whether brightness is important for the downstream digital pathology applications envisioned. For enhancing pathologists’ viewing experiences, the impact of updating the model is minor since there is subtle visual color variation on WSIs over time. In addition, pathologists can easily adjust the brightness on their displays and viewers to mitigate any brightness changes occurring over time.
On the other hand, for digital image processing and AI applications based on the color values in WSIs, frequent updates to the correction models would be expected to have a positive impact on color fidelity. However, from a practical standpoint, it is not feasible to scan a color calibration slide in every scanning run to update the models. For Scanner S360A, which exhibited chromatic stability and minor brightness fluctuation over an eight-month period, the primary difference in colors corrected using updated and outdated models was brightness. This suggests that if users establish color models for their scanners and update them only periodically, for example, on a quarterly or annual basis, the corrected images may exhibit brightness variation that require additional mitigation strategies. These strategies might involve adjusting brightness in the display for pathologists, and performing brightness augmentation or normalization when building downstream automated image analysis models.
Regular maintenance provided by the manufacturer of the WSI scanner may include color correction, aimed at calibrating the scanner’s color representation to a specified target. This calibration might cause color fluctuations, which can be detected with weekly monitoring of the scanner’s color stability. If the calibration results in color deviations beyond the average color range of the scanner (i.e., with perceptible color differences ΔE exceeding 2.2 compared with the average), it may be necessary for users to update the color correction models, in line with our suggestions.
One important observation from our study is the higher level of color difference ΔEs and the deviation of CIExyY values in the black color regardless of color correction. The color stability of the black color also exhibits a higher level of variation over time. This observation can be attributed to the low signal-to-noise ratio (SNR) in black color, which can result in inaccurate measurement of color values by the scanners and, as a result, inaccurate derived quantitative metrics. The deviation in the black color, although significant, is less impactful in the color presentation of H&E-stained slides given that H&E slides are predominantly pink, purple, and blue with very little black present. Given this, to overcome the issue of color deviation and stability of the black color, quantification excluding the black color might provide a more practical evaluation of a scanner’s color performance and stability in the context of H&E images.
On the other hand, this observation has implications for a potential limitation in our color correction module. The low SNR in the darker colors can lead to overall inaccuracies in color correction, given that the models are generated using all the colors present on the calibration slide. In the future, we plan to explore mitigating this issue by employing weighted linear regression when generating the color correction models. Weighted linear regression assigns different weights to the data from each color based on its individual variance. Consequently, colors with lower SNR should have a smaller impact on the final model, thereby improving the overall accuracy of color correction in the presence of noise.
Another important note for the implementation of color correction is that the algorithms must be customized for each scanner to capture their distinct color representation. The algorithms share the same mathematical equation format (i.e., Equations 2 and 3 in Supplemental materials S3 and S4) but have different parameters (i.e., α in Equation 2 and CX1-CZ6 in Equation 3 in Supplemental materials S3 and S4). Moreover, regularization and weighted optimization can be flexibly added to the algorithms to improve the correction performance, although we suggest cautiously balancing the tradeoff between generalization and overfitting when increasing the model complexity.
Our color correction module, introduced in linear RGB and CIEXYZ color spaces, can also be applicable to images of different color spaces through standard conversion. The implementation of color correction is also computationally lightweight, allowing for real-time application without modifying the raw data. Moreover, the color correction models can also be saved in International Color Consortium (ICC) profiles,29,30 streamlining record-keeping by embedding them into the image file structure. This flexibility enables easy integration of our process to the whole slide imaging process with WSI scanners of different models and from different manufacturers, which is essential for building a repository of data for digital pathology applications.
The lifespan of color calibration slides and the fading of the staining on the H&E slides is another issue when assessing the color performance of scanners and generating the color correction models. Unexpected deviation between the current ground truth and the ground truth measured a period of time ago would negatively impact the quality of assessment and the performance of color correction.
This study is currently limited to the use of H&E images as a first step for building the color-correction process for WSI scanners. Future studies would include WSIs with various histologic stains from both clinical and preclinical samples to evaluate the performance of the process for generalizability.
As highlighted in our introduction, the color of WSIs is prone to variation due to inconsistencies in the slide preparation and imaging process, including staining variation and scanner performance discrepancies. If the slides are prepared within the same lab, or in a lab that uses a similar staining protocol and combination of staining materials, results from scanning slides using the same scanner models may not induce noticeable color variation in WSIs.
However, when the slides are scanned by scanners of different models or from different manufacturers, as demonstrated in our study, color correction is essential to diminish the resultant color variation. Furthermore, if slides are prepared in different labs, staining color variation are likely to exist, necessitating the application of other staining color normalization techniques in addition to our color correction process.
In summary, we present a process to assess the color reproducibility and mitigate the color deviation of the WSI scanners. The process delivers consistent color representation of WSI from different scanners without intervention in scanning phases. The discussion of the effect of color standardization and normalization of WSIs on downstream processes is ongoing. There are a number of studies that show the negative impact of color variation in WSIs on the performance of AI and automated analysis, and demonstrate the need to mitigate the variation.1 -7,11 -14 We mentioned three inconsistencies in the whole slide imaging system that induce color variation in WSIs, and in this article, we focused on addressing the color variation among different WSI scanners using a color calibration slide. To further improve the color homogeneity in WSIs for digital pathology applications, integrating stain normalization into the process is the next step to resolve most of the evident inconsistencies in the system.
Supplemental Material
sj-docx-1-tpx-10.1177_01926233231224468 – Supplemental material for Assessment of Color Reproducibility and Mitigation of Color Variation in Whole Slide Image Scanners for Toxicologic Pathology
Supplemental material, sj-docx-1-tpx-10.1177_01926233231224468 for Assessment of Color Reproducibility and Mitigation of Color Variation in Whole Slide Image Scanners for Toxicologic Pathology by Mei-Lan Chu, Xing-Yue M. Ge, Jeffrey Eastham, Trung Nguyen, Reina N. Fuji, Ruth Sullivan and Daniel Ruderman in Toxicologic Pathology
Footnotes
Acknowledgements
The authors thank Melissa Gonzalez and Zara A Woo for their contribution in slide scanning and data uploading. The authors also thank the Safety Assessment Digital Pathology team at Genentech Inc. for the scientific discussions.
Author Contributions
Ruth Sullivan and Daniel Ruderman contributed equally to this work and are listed as co-last authors.
Declaration of Conflicting Interests
The author(s) declared the following potential conflicts of interest with respect to the research, authorship, and/or publication of this article: Mei-Lan Chu, Xing-Yue M Ge, Jeffrey Eastham, Trung Nguyen, Reina N Fuji, Ruth Sullivan and Daniel Ruderman are employees of Genentech, Inc. and are Roche stockholders.
Funding
The author(s) received no financial support for the research, authorship, and/or publication of this article.
Supplemental Material
Supplemental material for this article is available online.
References
Supplementary Material
Please find the following supplemental material available below.
For Open Access articles published under a Creative Commons License, all supplemental material carries the same license as the article it is associated with.
For non-Open Access articles published, all supplemental material carries a non-exclusive license, and permission requests for re-use of supplemental material or any part of supplemental material shall be sent directly to the copyright owner as specified in the copyright notice associated with the article.