
Abstract
Kidney biopsies are used sparingly to diagnose kidney injury in the clinic. Here we have conducted a small exploratory study to directly compare the low-grade kidney injury monitoring performance of serum safety biomarkers, novel urine safety biomarkers, microscopic histopathology and targeted gene expression alterations in kidney biopsy specimens in rhesus monkeys treated with tobramycin. Targeted gene expression increases were observed in the kidney biopsy samples and whole kidney sections for kidney injury molecule 1 (KIM-1), clusterin (CLU), osteopontin (OPN) messenger RNA transcripts. In addition, increases of the urinary kidney safety protein biomarkers including KIM-1, CLU, OPN were also observed. These increases in gene expression and urinary protein end point were in concordance with the eventual low-grade kidney lesions seen in terminal tissue sections. In contrast, conventional serum biomarkers blood urea nitrogen and serum creatinine were not as sensitive in monitoring kidney injury. Although these data do not support routinely adding kidney biopsies to regular toxicology studies, they provide evidence on the value and limitations of incorporating gene expression profiling on kidney biopsy specimens, further underscore the value of urinary kidney safety biomarkers for improved low-grade kidney injury monitoring, and open the door for future definitive studies.
Keywords
Introduction
Monitoring for kidney toxicity is very important for both nonclinical and clinical drug development and in clinical patient care settings. Conventional serum chemistry parameters blood urea nitrogen (BUN) and serum creatinine (sCr) have been used routinely in both nonclinical and clinical settings to assess kidney safety but these parameters change only after the occurrence of significant kidney injury. 1 Percutaneous kidney biopsy, in which a small sample of kidney tissue is examined microscopically for pathology, is the diagnostic gold standard in nephrology in clinical settings and it is justifiably reserved for situations of abnormal blood tests, proteinuria, hematuria, and the presence of other kidney disease concerns. 2,3
In the past 2 decades, advances have been made to enable more sensitive kidney toxicity monitoring. In the area of accessible biomarkers, a set of novel urinary protein biomarkers such as kidney injury molecule 1 (KIM-1) and clusterin (CLU) has been demonstrated to have superior performance over serum biomarkers across several different nonclinical test species. 4 –10 The urinary biomarkers when used together with BUN and sCr can also distinguish indirect intrarenal injury among dogs with prerenal azotemia. 11 Furthermore, these urinary biomarkers have received regulatory endorsement for their use in demonstrating monitorability of drug-induced kidney injury (DIKI) in rats and for application in human clinical trials on a case-by-case basis, 1,6,12 and a clinical trial with tobramycin-treated subjects is being completed to prospectively evaluate their clinical performance. There are reports of applying gene expression analyses in general to kidney biopsy samples, frozen tissues and formalin-fixed paraffin-embedded tissues, to identify tissue biomarkers of kidney damage or distinguish molecular categories of renal diseases. 13 –15 However, there is no knowledge of the utility of applying gene expression data of known urinary kidney safety biomarkers in kidney biopsy samples used for microscopic histopathologic analyses to monitor acute drug-induced kidney toxicity either in nonhuman primates (NHPs) or in clinical settings. These data could provide an additional diagnostic tool to the weight of evidence to consider along with serum and urinary kidney safety biomarkers and potentially offer insights to exploring the mechanisms of kidney toxicity.
Tobramycin is an aminoglycoside antibiotic often used clinically to treat Gram-negative bacterial infections. Like many aminoglycoside antibiotics, tobramycin is an effective protein synthesis inhibitor that has nephrotoxic and ototoxic side effects. We chose tobramycin-treated monkeys as a model due to prior tobramycin monkey study experiences (Howard Stock, PhD, personal communications, 2014) and the potential to provide additional NHP data to support ongoing clinical urine kidney biomarker qualification efforts. Using this monkey model, we conducted a small exploratory study in rhesus monkeys treated with tobramycin to compare the performance of several kidney toxicity monitoring methods including gene expression analysis of kidney biopsy samples and the terminal whole kidney sections, conventional serum chemistry parameter measurements, and urinary kidney safety biomarker analyses. The results of the study advance our understanding of the potential benefits of incorporating biopsy gene expression for detecting acute injury when biopsies are collected, confirm limitations of histologic analyses of small biopsy specimens for diagnosing acute injury, and most importantly, further underscore the value of urine safety biomarkers in kidney safety monitoring for acute injury. This manuscript represents the first such study report on this approach in monkey.
Materials and Methods
All studies were approved by the Institutional Animal Care and Use Committee of Merck & Co, Inc and were conducted in an Association for Assessment and Accreditation of Laboratory Animal Care International accredited facility in compliance with the NIH Guide for the Care and Use of Laboratory Animals and the Animal Welfare Act. The animals were acclimated and randomized into treatment and control groups. Tobramycin (Cat Number: NDC 39822-0412) was obtained from X-Gen Pharmaceuticals.
Fourteen Day Rhesus Monkey Study Design
Two 14-day rhesus monkey studies were conducted. For both monkey studies, the route of drug administration was through intravenous injection with the day of first dosing noted as study day 1. The dosing volume was 5 mL/kg and the injection rate was approximately 12 mL/min. The dose levels and the treatment duration were chosen with the intent to result in minimal renal injury based on a prior cynomolgus monkey kidney toxicity study using tobramycin (Howard Stock, PhD, personal communications, 2014).
In the first study, 6 female rhesus monkeys aged 3 to 9 years weighing 5.0 to 7.5 kg were obtained from Covance Research Products, Mannheimer Foundation, or University of Louisiana at Lafayette. The 6 monkeys were divided into 3 groups with 2 monkeys each: control, biopsy only, and tobramycin plus biopsy. The monkeys in control and biopsy-only groups were treated daily with vehicle only (0.9% sodium chloride) for 14 days, while the 2 monkeys in the tobramycin plus biopsy group were treated with 20 mg/kg/d tobramycin for 14 days. The biopsy was performed for the 4 monkeys in the biopsy-only and tobramycin plus biopsy groups, with 1 monkey from each group undergoing kidney biopsy on study days −4, 8, and 15, while the other monkey from each group was biopsied on study days 4, 11, and 15 (Table 1). Two different schedules of biopsy were adopted to provide insight over more time points while avoiding more than one in-life biopsy from the same kidney prior to the terminal study day 15 sample.
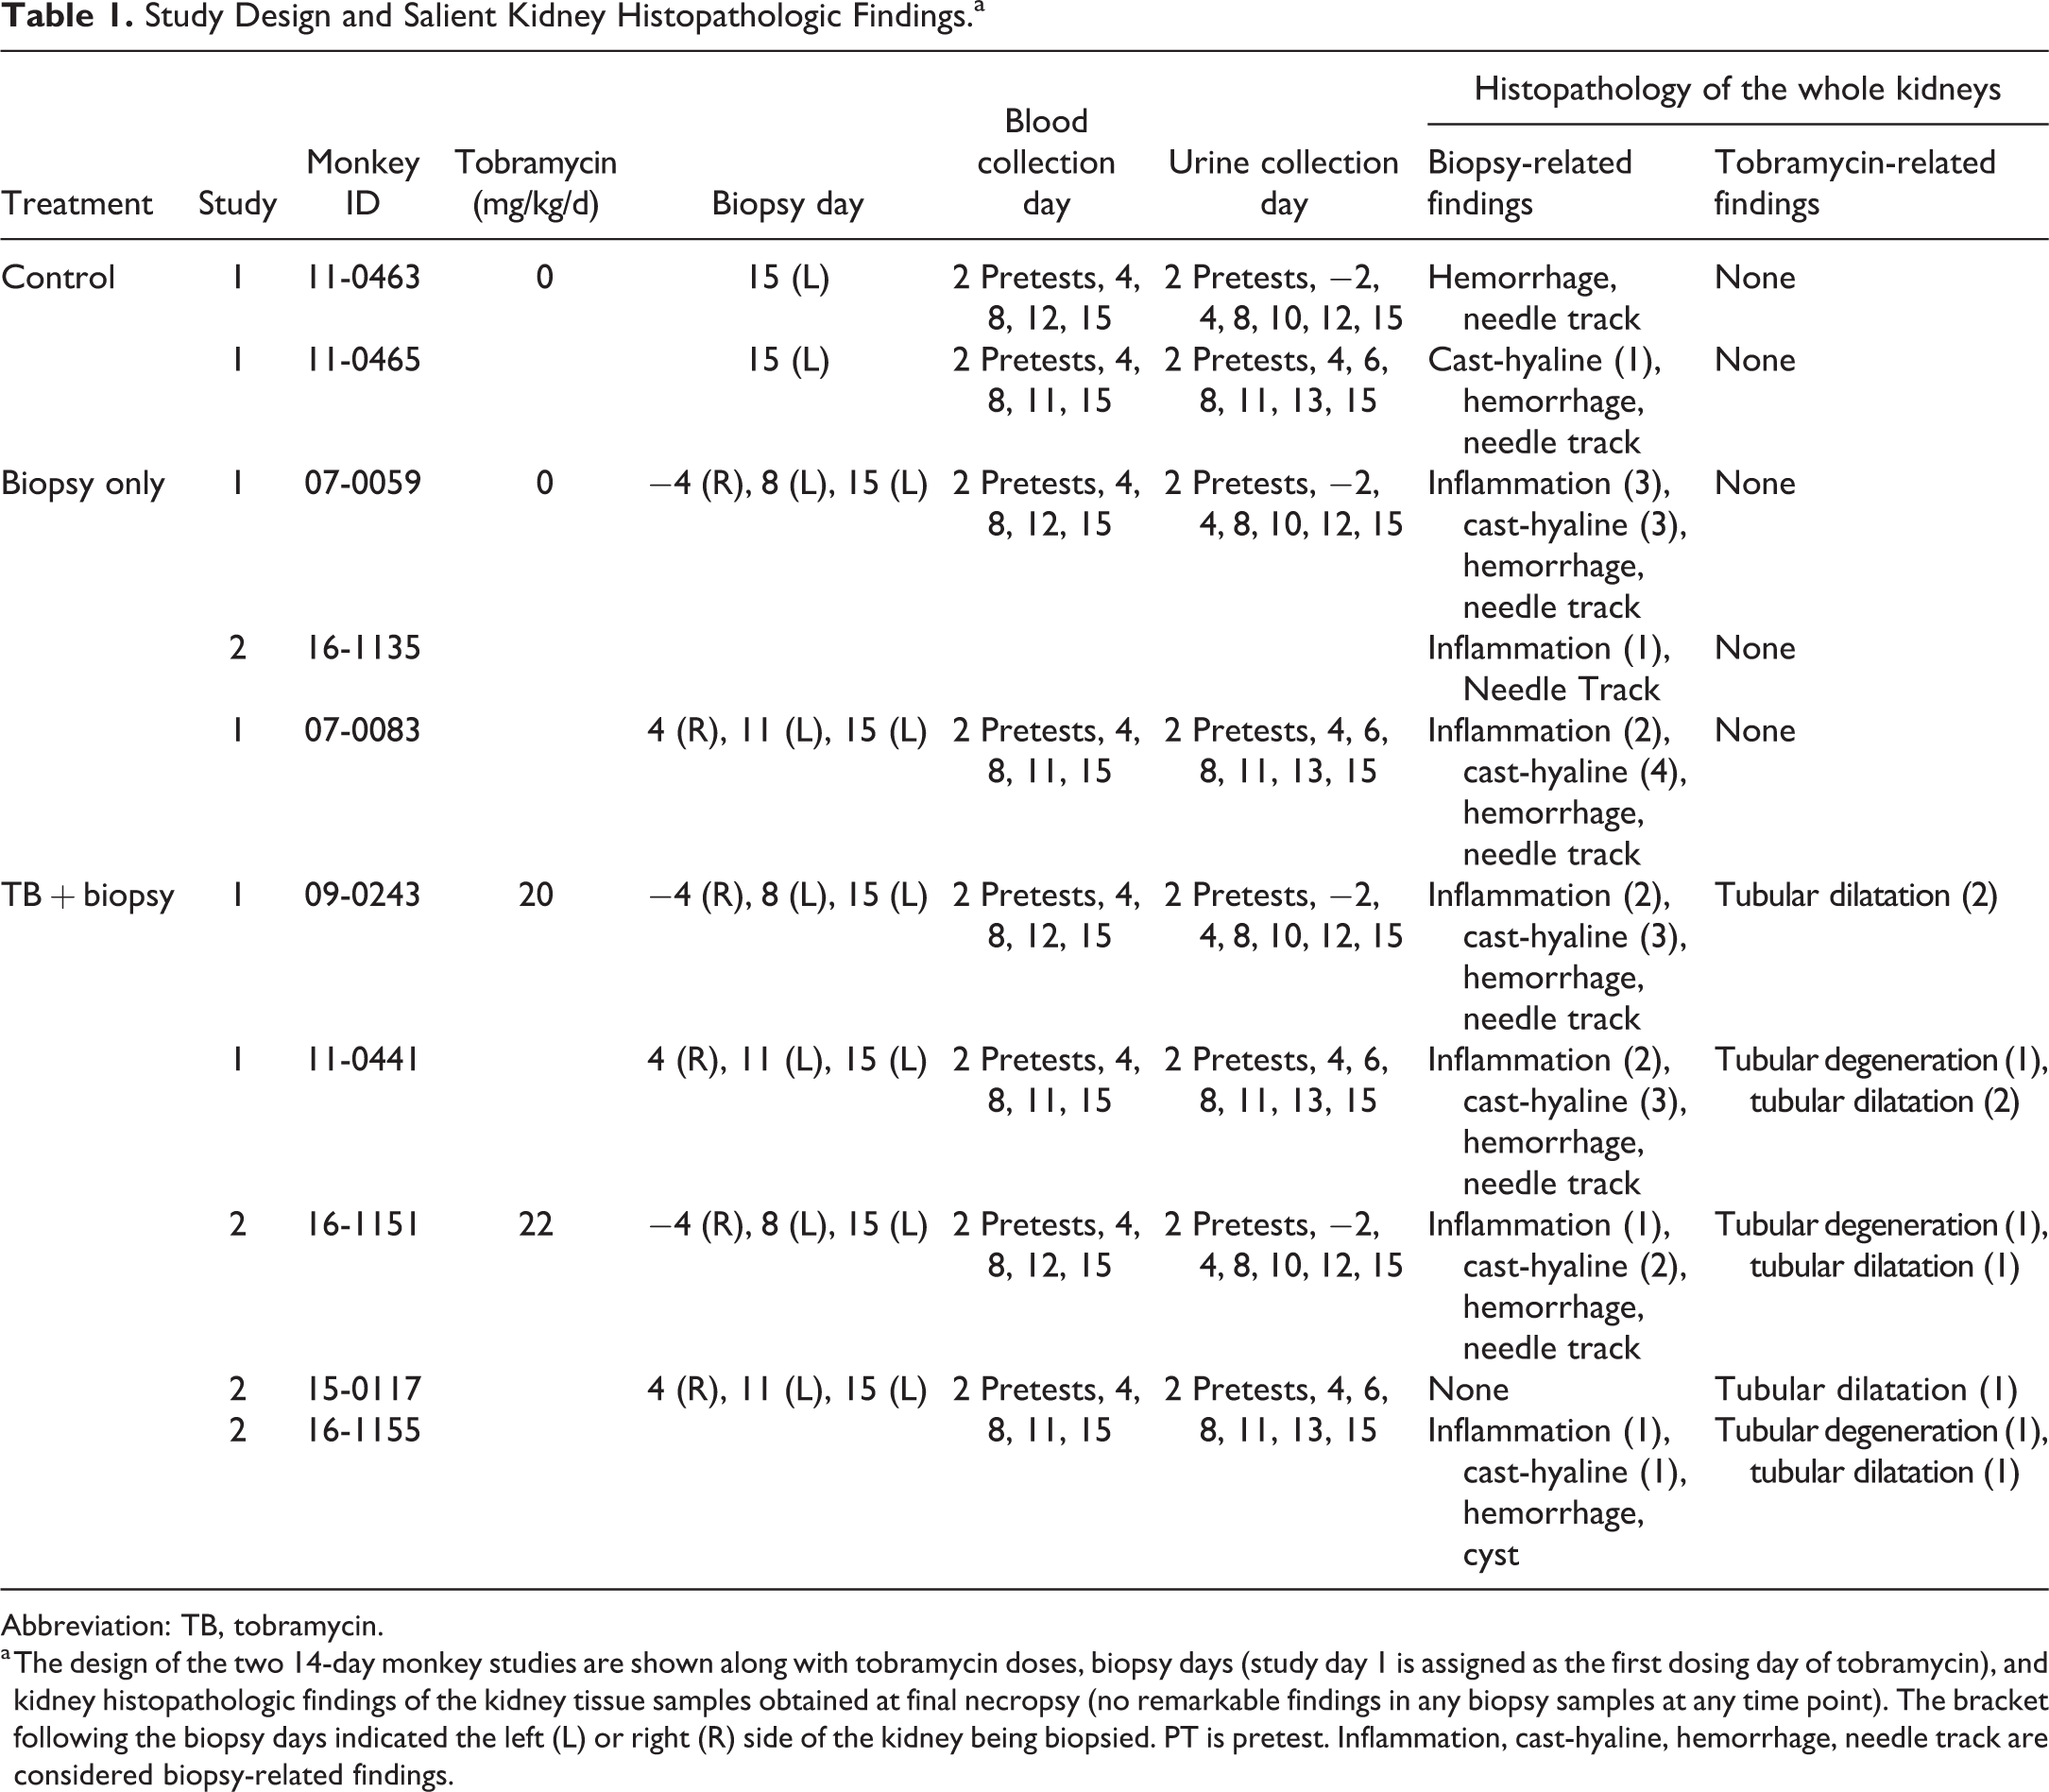
Study Design and Salient Kidney Histopathologic Findings.a
Abbreviation: TB, tobramycin.
a The design of the two 14-day monkey studies are shown along with tobramycin doses, biopsy days (study day 1 is assigned as the first dosing day of tobramycin), and kidney histopathologic findings of the kidney tissue samples obtained at final necropsy (no remarkable findings in any biopsy samples at any time point). The bracket following the biopsy days indicated the left (L) or right (R) side of the kidney being biopsied. PT is pretest. Inflammation, cast-hyaline, hemorrhage, needle track are considered biopsy-related findings.
In the second study, 4 female rhesus monkeys aged 3 to 4 years weighing 4.0 to 6.0 kg were obtained from Covance Research Products or University of Louisiana at Lafayette. One monkey received daily vehicle only for 14 days and underwent biopsy on study days −4, 8, and 15. The other 3 monkeys were treated with 22 mg/kg/d tobramycin for 14 days. One of the 3 tobramycin-treated monkeys underwent biopsy on study days −4, 8, and 15, while the other 2 monkeys underwent biopsy on study days 4, 11, and 15 (Table 1).
In total between the 2 studies, there were 5 control monkeys receiving saline vehicle: 2 control monkeys with biopsy only at terminal sacrifice on study day 15, and 3 control monkeys receiving 2 biopsies (1 from each kidney) prior to the terminal sacrifice biopsy on study day 15. In addition, there were 5 tobramycin-treated monkeys receiving either 20 or 22 mg/kg/d and 2 biopsies prior to terminal sacrifice on study day 15. All biopsies were collected percutaneously, guided by ultrasound imaging.
Sample Collection
Blood collection was performed twice during pretest period (pretest days −20, −14 for study 1 and −14, −7 for study 2) and on study days 4, 8, 11, and 15 for a control monkey (11-0465) and monkeys with biopsy days on study days 4, 11, and 15, while for the remaining monkeys blood was collected on study days 4, 8, 12, and 15 (Table 1). All urine samples were collected under fasting conditions (with access to water) overnight (16-18 hours) on wet ice for routine urinalysis parameters and urinary creatinine (Table 1). The date of urine collection was labeled as the date of the end of the urine collection. Urine samples were collected twice during the pretest period for all monkeys (pretest days −20, −14 for study 1 and −14, −7 for study 2). Additional urine collections were conducted on study days 4, 6, 8, 11, 13, and 15 for a control monkey (11-0465) and monkeys with biopsy days on study days 4, 11, and 15, and on study days −2, 4, 8, 10, 12, and 15 for the remaining monkeys (Table 1). Blood and urine samples were collected prior to conduct of the same day biopsy procedures. Following collection, blood samples are allowed to clot at room temperature. The samples are then centrifuged at 2500 rcf for 10 minutes at room temperature and analyzed the same day of the collection. The collected urine samples were centrifuged at 500 rcf for 10 minutes at room temperature and analyzed the same day of the collection. The remaining supernatant was stored frozen at −70 °C until urinary biomarker measurements, which were conducted within 6 months of the sample collection.
Kidney biopsy was performed 3 times per monkey on study days −4, 8, 15 or 4, 11, 15 (Table 1). For each monkey, the biopsy for the first time point was performed on the right kidney, followed by the biopsy for the second time point on the left kidney. The third biopsy was taken from the left kidney on study day 15, after which the monkey was euthanized for necropsy. For biopsy, the monkeys were administered ketamine hydrochloride via intramuscular injection at a dose of 10 mg/kg. Once sedated, they were intubated and put on 1% to 2% isoflurane. The monkey was placed in dorsal recumbency, the hair from the ventrum and the right and left lateral trunk areas was clipped, and the area over the kidneys was aseptically prepared with a mixture of betadine and alcohol (Duraprep). The targeted kidney was visualized with an ultrasound machine. A disposable spring-loaded biopsy needle (EZ 1809-15, E-Z Core Single Action Biopsy Devise, Products Group International, Inc) was introduced through the skin and into the kidney and a biopsy of renal cortex was targeted and collected. The biopsy needle was then withdrawn, and the renal tissue was removed from the device. All kidney biopsies were targeted for collecting kidney cortex and, when possible, outer stripe of medulla area with biopsy needles. Up to 2 biopsy attempts were made per time point, with a goal of collecting 2 to 4 mg of kidney tissue. Approximately 2 mg of kidney tissue was obtained and allocated for gene expression analysis, while the remaining tissue samples were fixed in 10% neutral buffered formalin (NBF), processed into the tissue sections and glass slides, and then stained with hematoxylin and eosin (H&E) for histopathologic evaluation. At the completion of the procedure, the monkeys were administered 0.2 mL/kg meloxicam via subcutaneous injection (Metacam, Boehringer Ingelheim Vetmedica), extubated, and allowed to recover. Monkeys were monitored closely for several days after the procedure and no adverse health effects were observed.
At the end of the study, major organs including kidneys collected at necropsy were fixed in 10% NBF, routinely processed, and embedded in paraffin blocks. A representative 4-µm thick tissue section was processed to glass slides and stained with H&E for histopathologic evaluation. The stained renal sections were evaluated for histopathologic findings and severity grades were assigned for any findings using a 0 to 5 grading scale 6 : 0 (no observable pathology), 1 (minimal, feature occupying up to approximately 5% of sectional area), 2 (mild, feature occupying 5%-15% of sectional area), 3 (moderate, feature occupying 15-50% of sectional area), 4 (marked, feature occupying 50%-75% of sectional area), and 5 (severe, feature occupying >75% of sectional area). In addition, the cortex and medulla sections of the kidney were collected in separate pieces for gene expression analysis.
For targeted gene expression profiling of the larger kidney tissues collected at final necropsy, an approximate 8 mm thick cross-section piece was dissected from the right kidney. From this cross section, the cortex and medulla portions were separated by cutting along the interface between the cortex and the medulla, and the resulting pieces were placed in −70 °C freezer until the time of RNA extraction.
End Point Measurements and Data Analyses
For gene expression analyses, RNA was extracted from kidney biopsy samples, as well as kidney cortex and medulla sections dissected from final necropsy using the miRNeasy micro kit from Qiagen according to manufacturer instructions. Fifty nanograms of extracted total RNA from all samples were used for transcriptome amplification using the WTA2 whole transcriptome amplification kit from Sigma-Aldrich following manufacturer instructions. The resulting complementary DNA was used to generate targeted gene expression profiles using a customized QuantStudio 12K Flex OpenArray plate (Thermo Fisher Scientific) according to manufacturer instructions. The custom plate consists of a set of monkey and human genes which includes 11 genes used to determine the kidney toxicity score (see below) and 11 housekeeping genes (Gene symbols: PUM1, RCHY1, TLK2, RAB35, GUSB, DDX47, TMED4, TMEM183A, INPP5A, SRRM1, and 18S RNA). Gene expression signals obtained from OpenArray plates were normalized against the set of housekeeping genes, and fold changes of individual genes were calculated against the average of the gene expression levels of the whole kidney tissues (both cortex and medulla) of the control monkeys on study day 15.
A kidney toxicity score (π) was developed in rat with a custom formula using fold changes of the genes KIM-1, CLU, osteopontin (OPN), tumor necrosis factor receptor superfamily member 12A (TNFRSF12A), tissue inhibitor of metalloproteinases 1 (TIMP1), transmembrane glycoprotein NMB (GPNMB), cyclin-dependent kinase 1 (CDK1), oxidized low-density lipoprotein receptor 1 (OLR1), aurora B kinase (AURKB), chemokine (C-X-C motif) ligand 1 (CXCL1), and early growth response protein 2 (EGR2). 16 These genes were included in our custom OpenArray plates and the gene expression changes were measured. But given the limited experience in NHP, no analogous NHP π-score is presented.
Serum parameters BUN and sCr, urinary protein analytes albumin (ALB), total protein, and creatinine, as well as N-acetyl-β-D glucosaminidase (NAG) activity were determined by routine clinical pathology procedures using a Beckman AU5800 Chemistry Analyzer. Urine creatinine concentration was used to normalize values of all urine protein biomarkers.
All other urine protein kidney safety biomarkers were measured using ELISA kits according to manufacturer instructions. KIM-1, retinol binding protein 4 (RBP4), and OPN were measured using human KIM-1 assay (K151JHD), human RBP4 assay (K151LXD), and a custom assay, respectively, from Meso Scale Discovery; CLU was measured using human CLU assay (DCLU00) from R&D Systems; neutrophil gelatinase-associated lipocalin (NGAL) was measured using monkey NGAL assay (KIT045) from BioPorto Diagnostics; cystatin C (CysC) was measured using human CysC assay (RD191009100) from BioVendor.
For data analyses, the averages of serum and urine kidney safety biomarker concentrations of all time points from control animals and pretest collections from treated animals were used as baselines for fold change calculations. The thresholds for meaningful changes of serum biomarkers and urine kidney safety biomarkers were set at 1.5-fold and 3-fold above baseline levels, respectively. 4,9 For the purpose of calculating fold changes, 50% of the lower limit of quantitation (LLOQ) value was used as the baseline value when the baseline analyte concentrations were all below the LLOQ of the assay, as in the case of urine KIM-1. Four urine samples, 2 study day 6 samples from animals 11-0465 and 11-0441, plus a pretest and a study day 13 urine sample from animal 07-0083, were contaminated with visually observable blood and were not included in data analyses since such levels of blood contamination are known to affect the assay accuracy of urine biomarkers such as CLU, ALB, and total protein. 4
Results
Ten female rhesus monkeys were included in the 2 studies from which comparisons of different kidney injury monitoring methods to detect early kidney toxicity including serum and urine kidney safety biomarkers as well as gene expression profile from both kidney biopsy and the whole kidney sections were attempted. The histopathologic evaluation of kidney tissues of both kidney biopsy and the whole kidney sections was also performed. The terminal histopathologic evaluation of study 1 showed histological changes in both tobramycin-treated monkeys with only 1 of the 2 monkeys receiving tobramycin developed minimal tubular degeneration. Therefore, the dose of tobramycin was increased to 22 mg/kg/d in study 2 in order to increase the likelihood of monkeys presenting with kidney tubular degeneration (Table 1). The monkeys treated with tobramycin from the 2 studies were binned together for the purpose of data analyses.
Histopathology
The salient histopathologic renal findings observed in the rhesus monkeys are summarized in Table 1 with representative histopathologic renal changes shown in Figure 1. No tobramycin-related histopathologic changes were observed in any renal biopsy samples from monkeys administered tobramycin regardless of the day of sampling, including biopsies obtained on the day of necropsy. On the other hand, the histomorphologic evaluation of kidney tissues from necropsy on study day 15 revealed tobramycin-related renal changes in all 5 tobramycin-administered monkeys. The tobramycin-related renal findings were focal to multifocal in nature and were consisted of minimal to mild tubular dilatation and minimal tubular degeneration most commonly in the cortex (proximal tubules) and to a lesser extent in the medulla. The tubular degeneration was characterized by hypereosinophilic epithelial cells with pyknotic nuclei, attenuated epithelium lining the dilated tubules, and occasional accumulation of eosinophilic material in the cytoplasm. All the monkeys from each of the 3 groups had biopsy procedure-related gross and/or histopathologic changes in the kidneys. Biopsy procedure-related renal findings included disruption of renal architecture by biopsy needle track, hemorrhage, inflammation, and occasional regeneration of renal tubules. Renal parenchyma adjacent to the affected biopsy tracks had multiple tubules with eosinophilic hyaline casts and increased cellular basophilia. Perirenal changes attributed to biopsy procedure were hemorrhage, fibrin, and mixed cell infiltrates in the perirenal connective tissue and renal capsule.
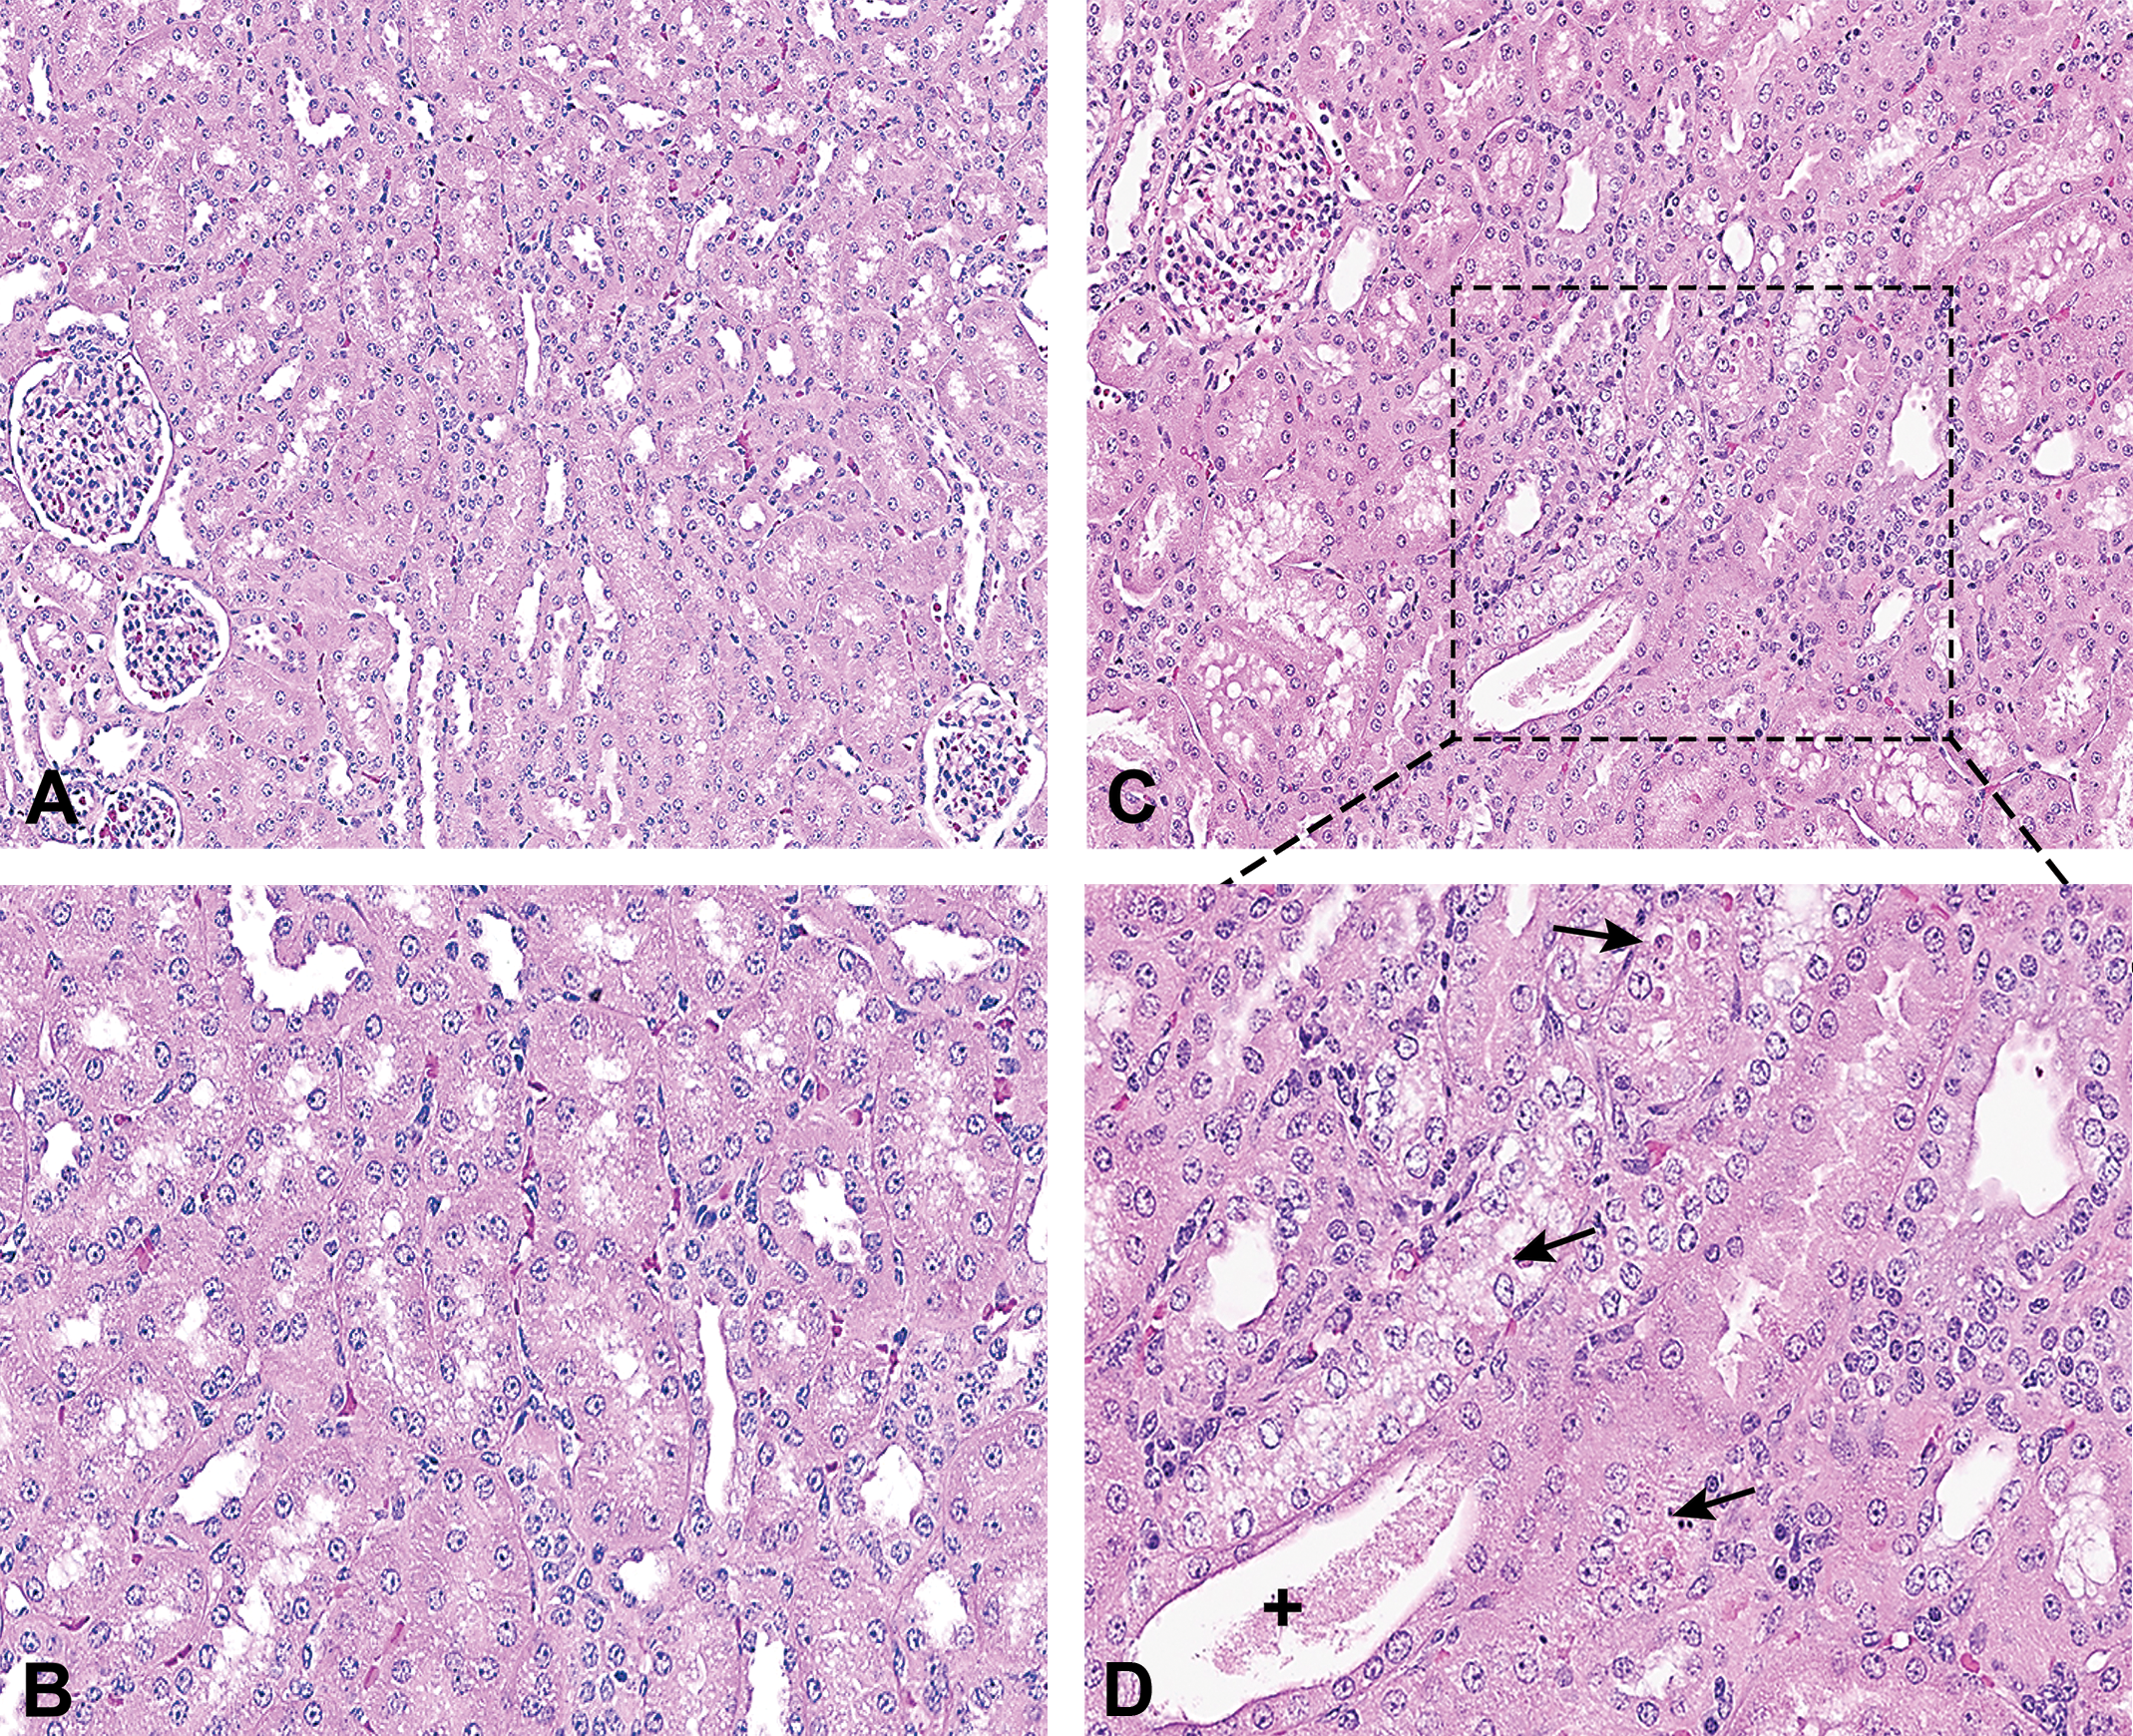
Histopathologic findings in whole kidneys of monkeys. A and B, Low (A) and high (B) magnification view of normal kidney from a control animal (ID 11-0463). C and D, Tobramycin-treated animal (ID 16-1155) low (C) and high (D) magnification view of tobramycin-induced renal tubular degeneration and dilatation. The black arrows indicate degenerated tubular epithelial cells with hypereosinophilic cytoplasm and pyknotic nuclei. The dilated tubules were lined by attenuated epithelium and contain eosinophilic material in the lumen as indicated (+).
Gene Expression Profiling of Kidney Biopsy and Kidney Tissues
Gene expression levels of the kidney safety biomarkers including KIM-1, CLU, and OPN were measured from both the kidney biopsy samples collected throughout the study time course and from the larger samples collected from the whole kidney sections obtained at the necropsy. Furthermore, gene expression changes of a set of 11 genes used in calculating a composite kidney toxicity score π in rat were measured from each tissue sample (Supplemental Table). Gene expression profiles of RNA extracted from the biopsy samples collected from monkeys treated with tobramycin indicated the presence of kidney injury.
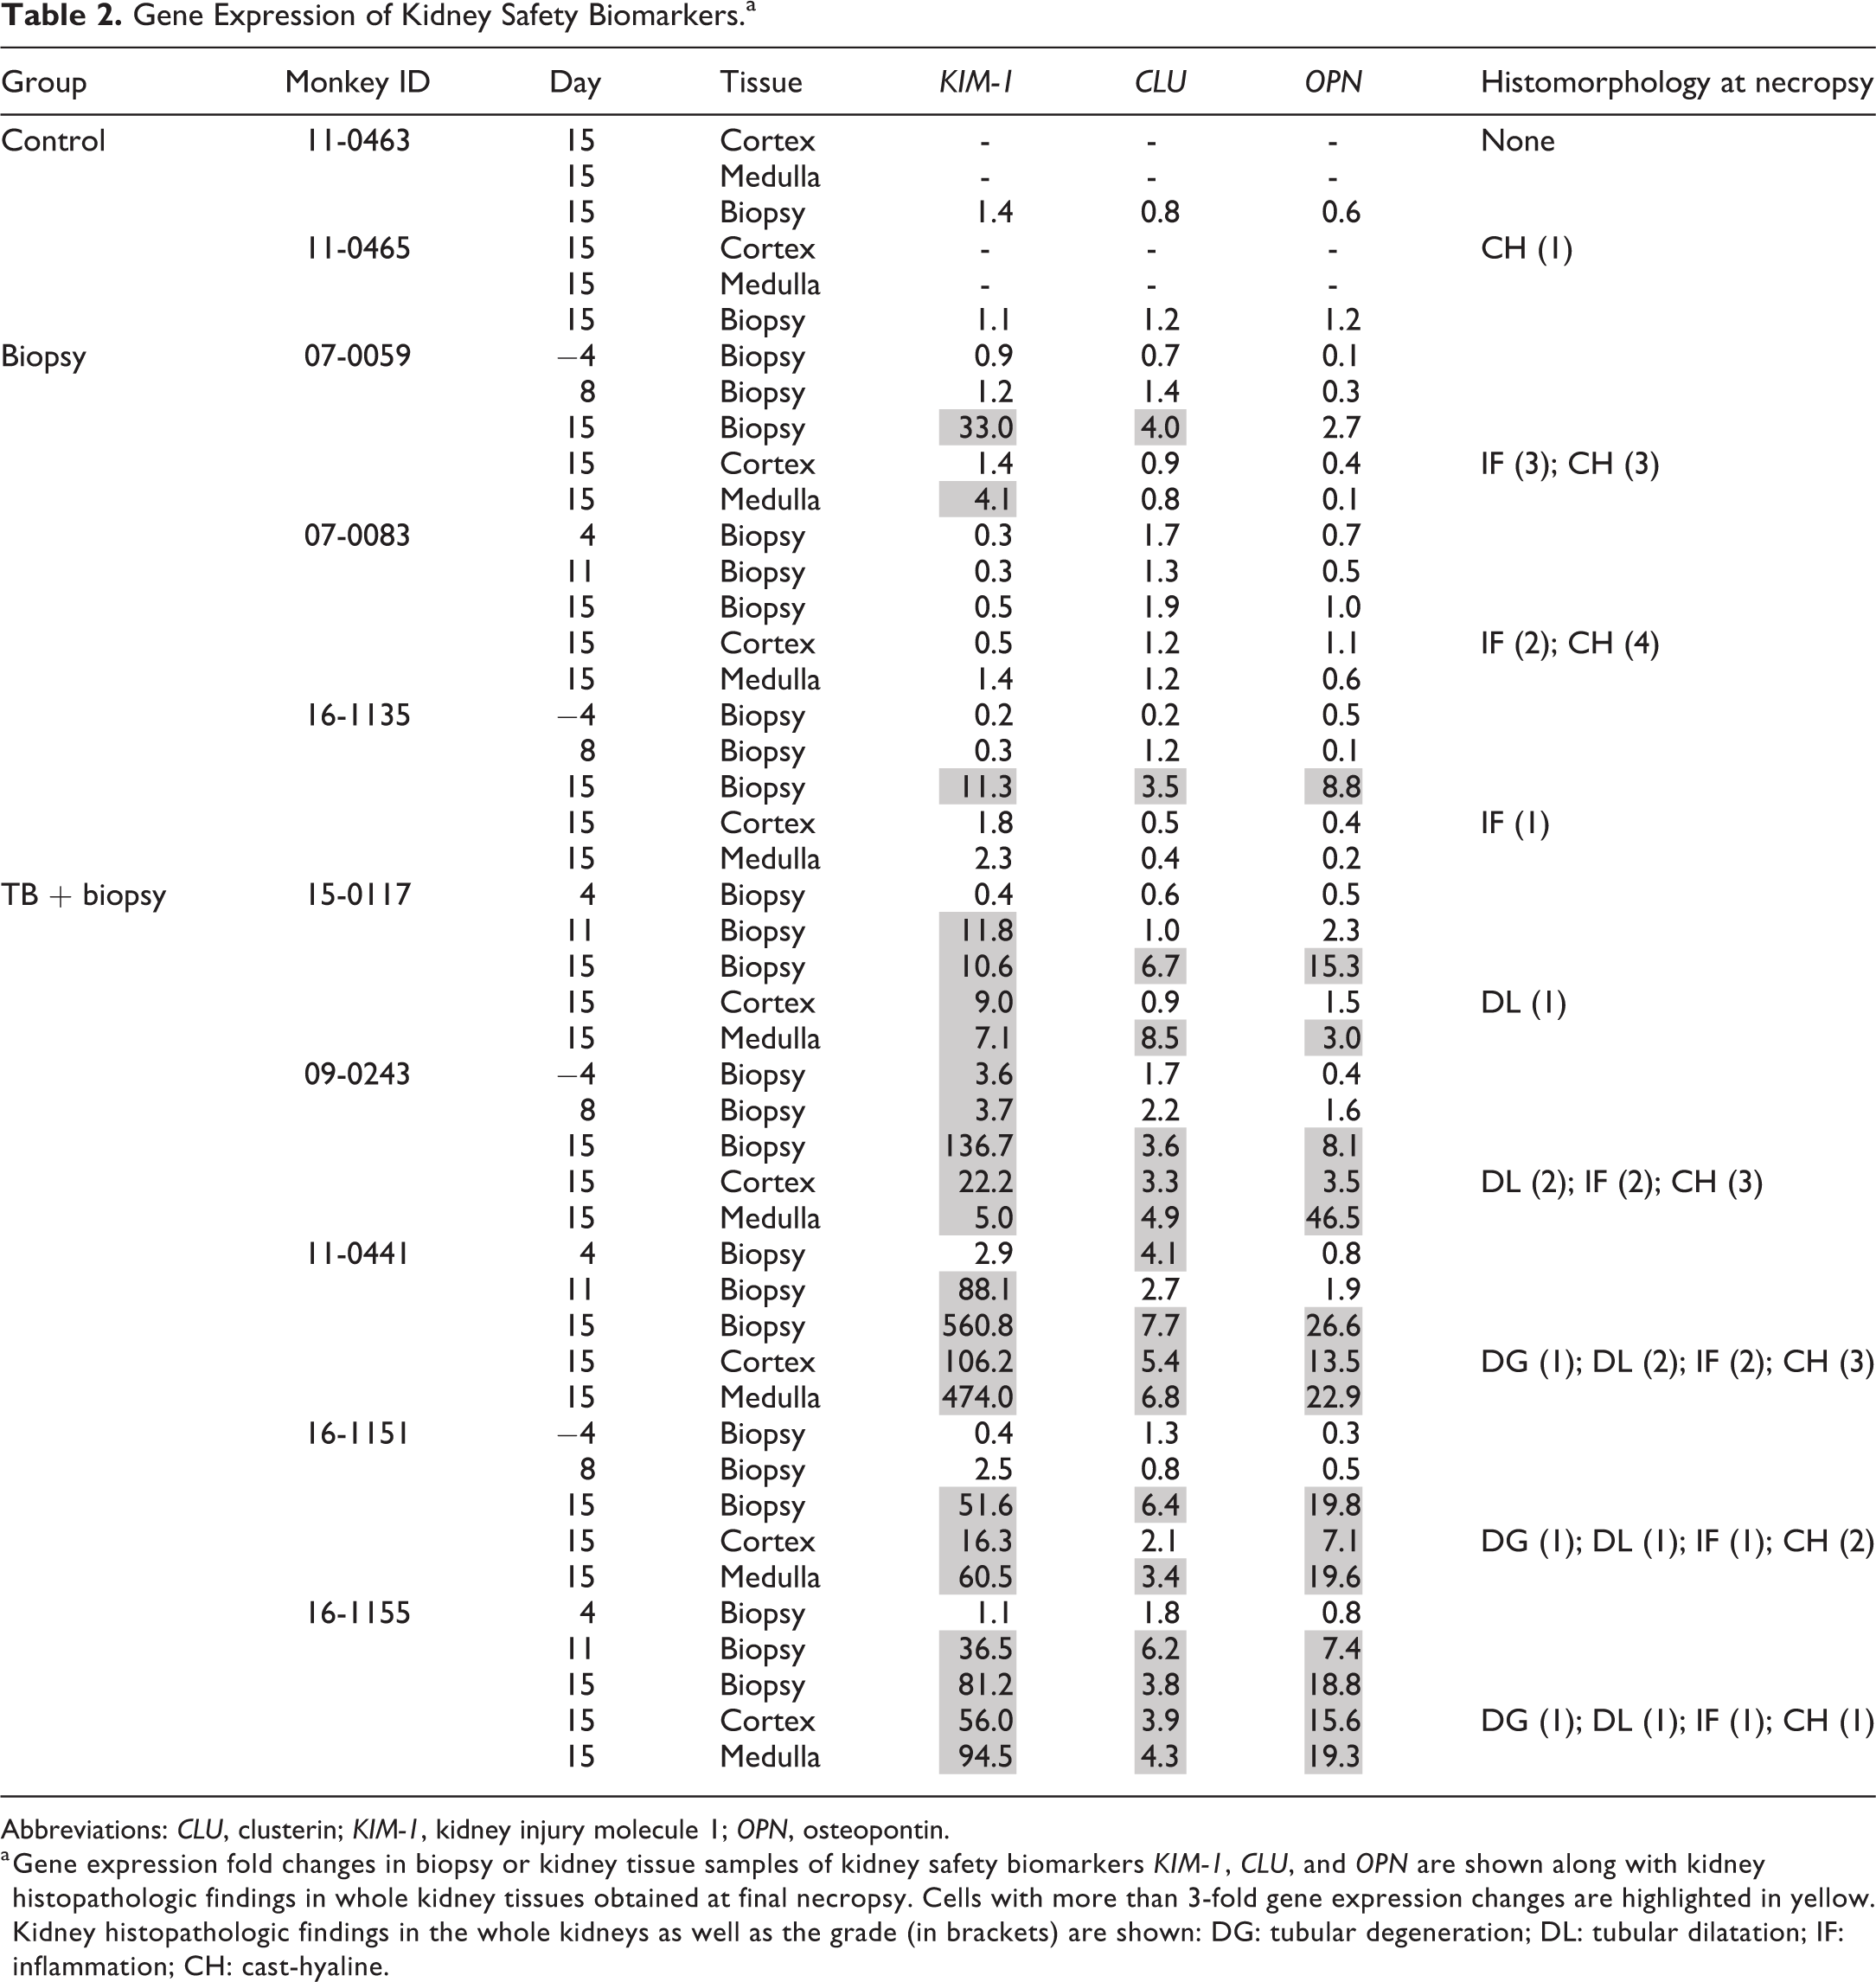
Three tobramycin-treated monkeys that had the biopsy on naive left kidney on study day 11 showed significant KIM-1 elevation reaching levels of 12- to 88-fold, suggesting the onset of a kidney injury response on study day 11 (Table 2). All 5 tobramycin-treated monkeys on study day 15 showed KIM-1 expression increases of 11- to 560-fold in kidney biopsy samples and of 5- to 474-fold in the whole kidney sections, correlating well with kidney histology changes seen at the necropsy. Furthermore, KIM-1 messenger RNA (mRNA) levels showed an overall higher induction in the 3 tobramycin-treated monkeys that presented with both tubular degeneration and tubular dilatation than the 2 tobramycin-treated monkeys that presented with tubular dilatation alone (Table 2). The KIM-1 levels remained at baseline levels in all control and biopsy-only monkeys in the samples that were collected before necropsy. For all initial biopsies taken from either kidney in the 5 vehicle treated control monkeys (biopsies at time points −4, 4, 8, 11 in 3 control biopsy animals, and biopsy on study day 15 in 2 control animals), there were no increases in KIM-1 mRNA levels.
Gene Expression of Kidney Safety Biomarkers.a
Abbreviations: CLU, clusterin; KIM-1, kidney injury molecule 1; OPN, osteopontin.
a Gene expression fold changes in biopsy or kidney tissue samples of kidney safety biomarkers KIM-1, CLU, and OPN are shown along with kidney histopathologic findings in whole kidney tissues obtained at final necropsy. Cells with more than 3-fold gene expression changes are highlighted in yellow. Kidney histopathologic findings in the whole kidneys as well as the grade (in brackets) are shown: DG: tubular degeneration; DL: tubular dilatation; IF: inflammation; CH: cast-hyaline.
In biopsy samples collected at the time of necropsy on study day 15, KIM-1 mRNA levels did show significant 11- to 33-fold increases in 2 of the 3 biopsy-only animals (Table 2, monkey IDs 07-0059 and 16-1135) that had received prior biopsies in the same kidney on study day 8, suggesting that the biopsies taken 7 days earlier (study day 8) were responsible. Also, KIM-1 gene expression levels just crossed threshold with marginal 4-fold increases seen in the whole kidney sections from the biopsy-only monkey 07-0059, suggesting an effect of the prior biopsy procedure performed on the same kidney 18 days earlier on study day −4.
Both CLU and OPN mRNA crossed the 3-fold threshold in kidney biopsy samples of all 5 tobramycin-treated monkeys on study day 15 per our analysis protocol, with CLU and OPN also reaching 3- to 46-fold increases in whole kidney sections in these monkeys on study day 15. In study day 11 biopsy, a 6- to 7-fold increase of both biomarkers was seen in 1 tobramycin-treated monkey 16-1155. In whole kidney sections from control and biopsy-only monkeys, CLU and OPN remained unchanged. But small CLU increases just cross threshold did appear on study day 15 biopsy samples in 2 biopsy-only monkeys and a 9-fold OPN increase was observed on study day 15 biopsy sample in a biopsy-only monkey (Table 2).
We have previously developed an algorithm to calculate a kidney π score using the average gene expression fold change of a set of 11 genes based on multiple kidney toxicity studies with true positive and true negative compounds for nephrotoxicity in rat. 16 We measured the fold changes of this set of 11 genes (Supplemental Table 1). The pattern of gene expression changes generally showed good consistency between rat and monkey.
Serum and Urinary Kidney Safety Biomarkers
To measure the performance of serum and urine kidney safety biomarkers, we measured their concentrations in serum or urine, respectively, with urine biomarker values normalized against urine creatinine concentrations. The baseline values as well as the fold changes of all analytes over baselines were calculated and are listed in Table 3.
Fold Changes of Serum and Urine Kidney Safety Biomarkers Over Baseline.a
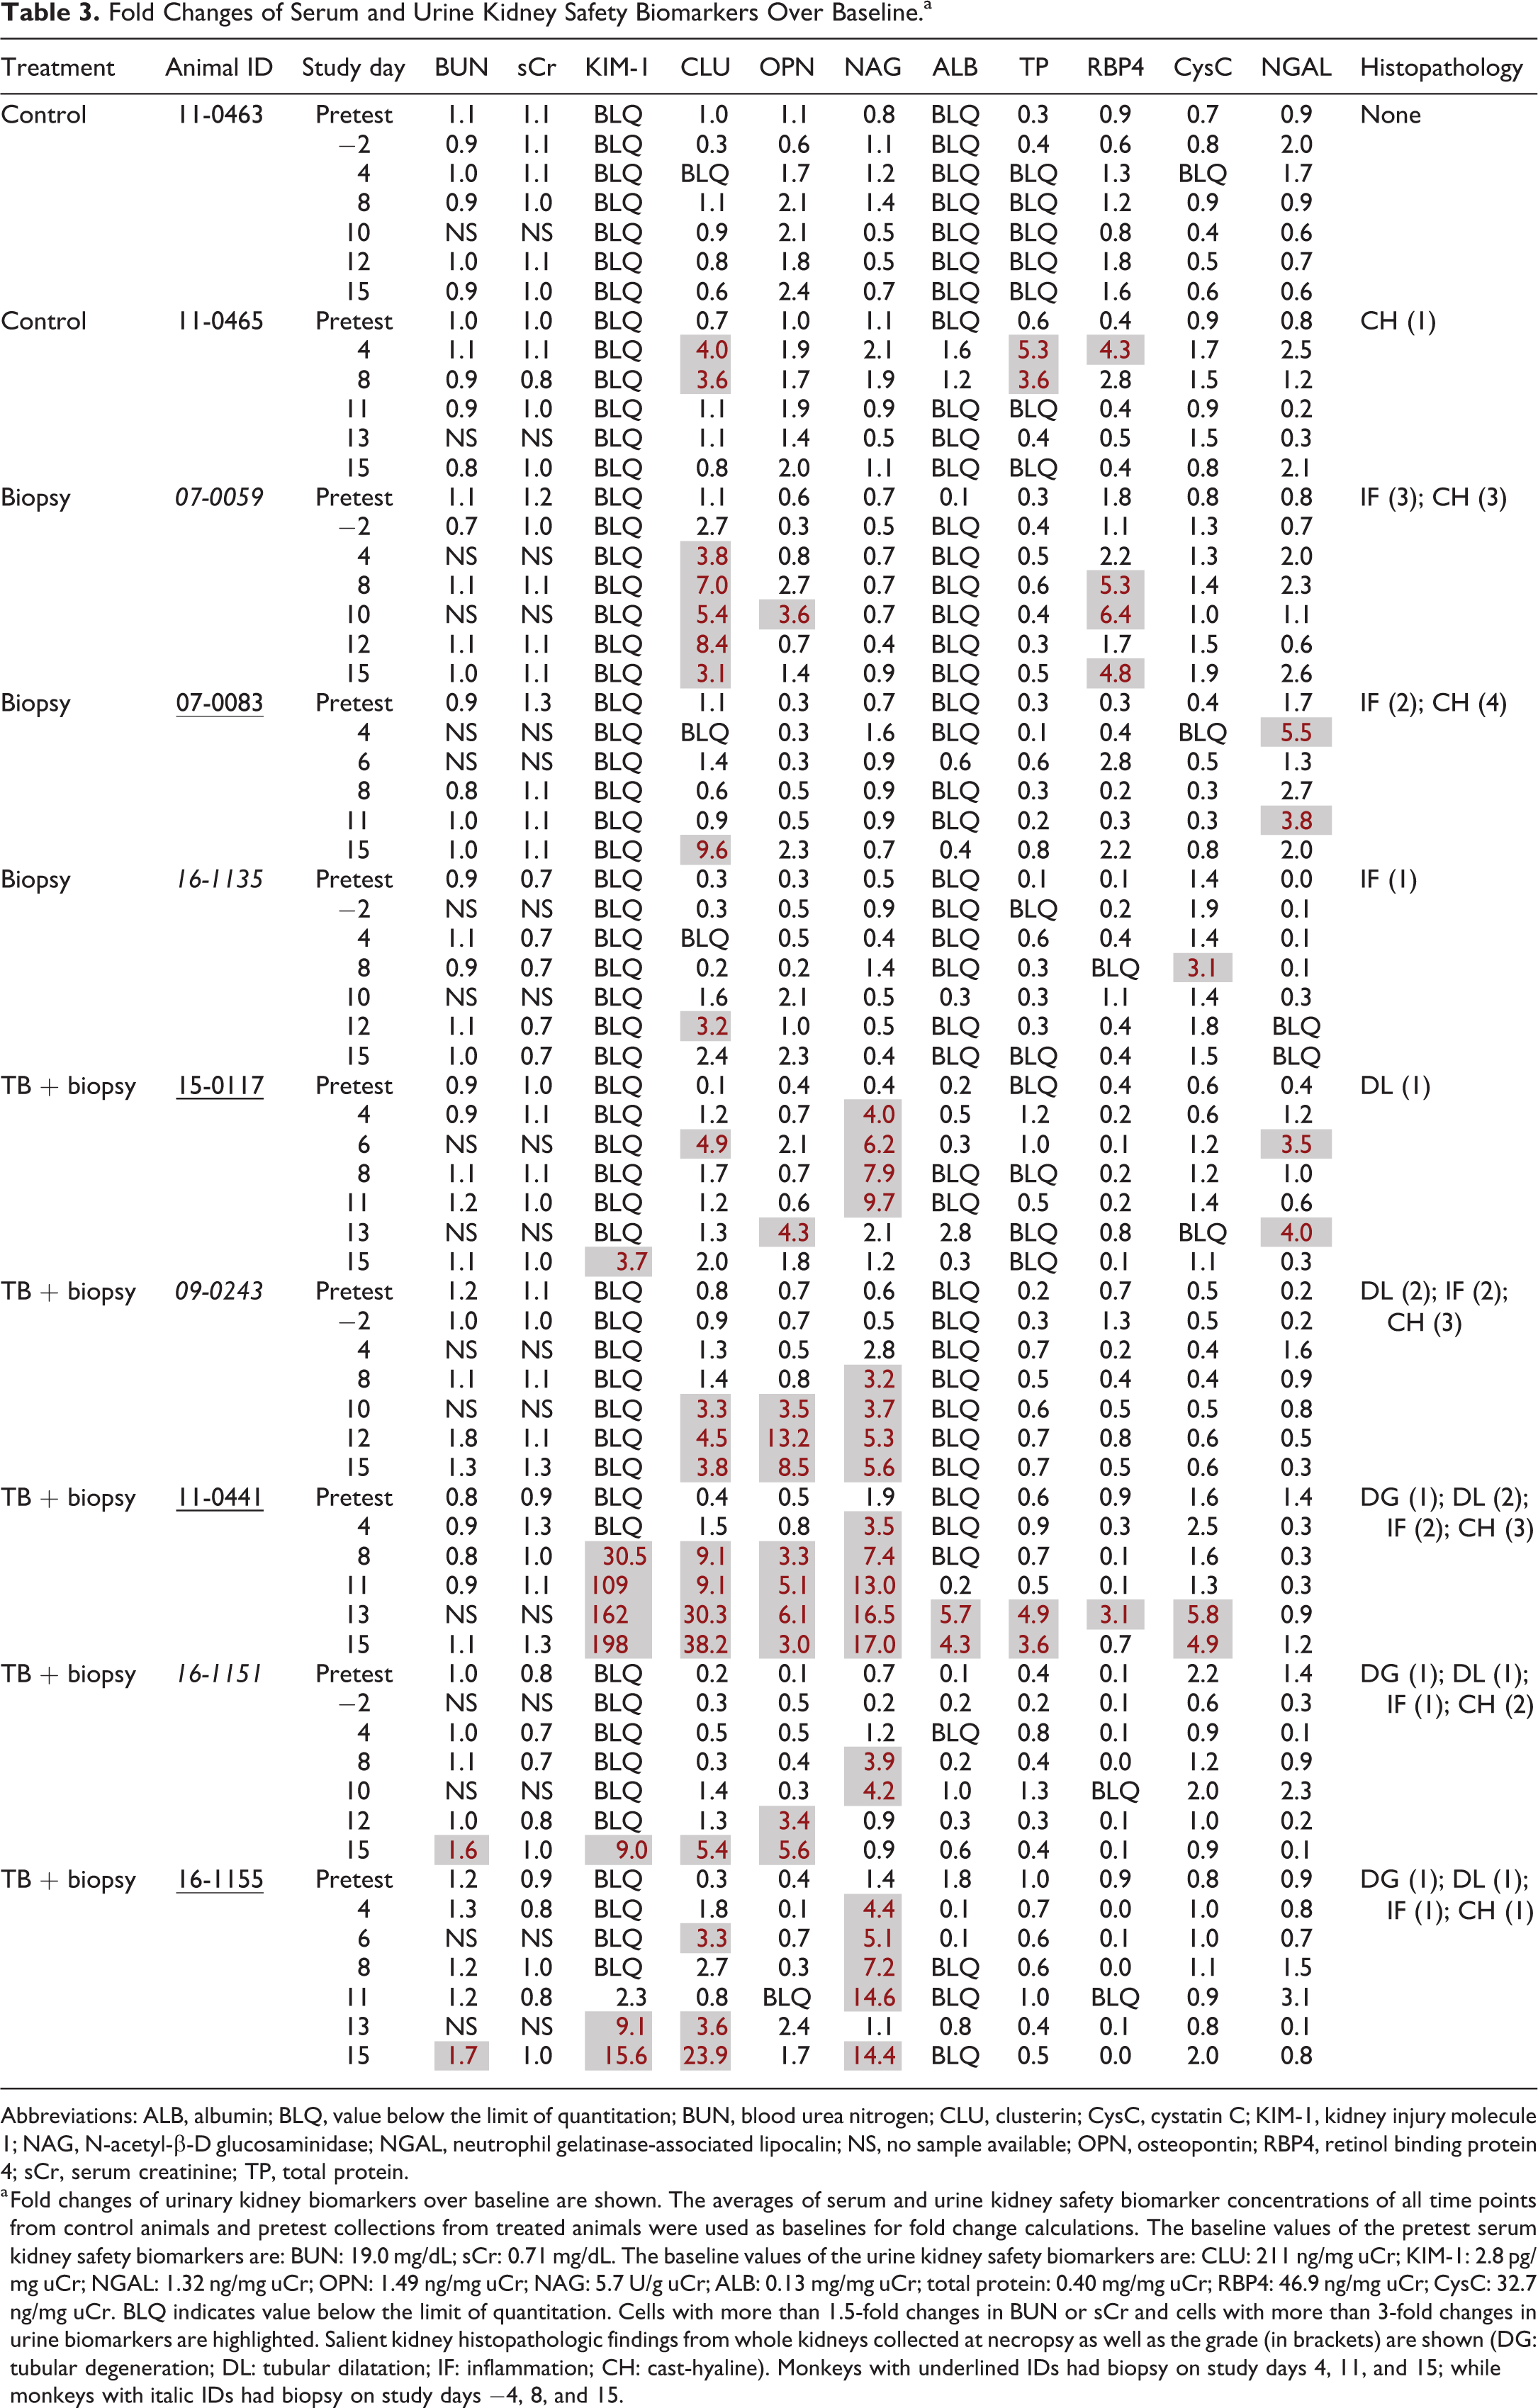
Abbreviations: ALB, albumin; BLQ, value below the limit of quantitation; BUN, blood urea nitrogen; CLU, clusterin; CysC, cystatin C; KIM-1, kidney injury molecule 1; NAG, N-acetyl-β-D glucosaminidase; NGAL, neutrophil gelatinase-associated lipocalin; NS, no sample available; OPN, osteopontin; RBP4, retinol binding protein 4; sCr, serum creatinine; TP, total protein.
a Fold changes of urinary kidney biomarkers over baseline are shown. The averages of serum and urine kidney safety biomarker concentrations of all time points from control animals and pretest collections from treated animals were used as baselines for fold change calculations. The baseline values of the pretest serum kidney safety biomarkers are: BUN: 19.0 mg/dL; sCr: 0.71 mg/dL. The baseline values of the urine kidney safety biomarkers are: CLU: 211 ng/mg uCr; KIM-1: 2.8 pg/mg uCr; NGAL: 1.32 ng/mg uCr; OPN: 1.49 ng/mg uCr; NAG: 5.7 U/g uCr; ALB: 0.13 mg/mg uCr; total protein: 0.40 mg/mg uCr; RBP4: 46.9 ng/mg uCr; CysC: 32.7 ng/mg uCr. BLQ indicates value below the limit of quantitation. Cells with more than 1.5-fold changes in BUN or sCr and cells with more than 3-fold changes in urine biomarkers are highlighted. Salient kidney histopathologic findings from whole kidneys collected at necropsy as well as the grade (in brackets) are shown (DG: tubular degeneration; DL: tubular dilatation; IF: inflammation; CH: cast-hyaline). Monkeys with underlined IDs had biopsy on study days 4, 11, and 15; while monkeys with italic IDs had biopsy on study days −4, 8, and 15.
The serum biomarker BUN showed no increase in the control monkeys or in the monkeys that underwent kidney biopsy. Blood urea nitrogen increased above its 1.5-fold threshold only at the time of study end in 2 of 5 tobramycin-treated monkeys with 1 additional monkey showing a transient increase at study day 12. Serum creatinine remained stable and showed no increase for all monkeys throughout the study.
In contrast, certain urine kidney safety biomarkers showed much better overall correlation with kidney histopathologic findings seen in whole tissue sections collected on study day 15 at study termination, as well as earlier increases in urine concentrations (Table 3). Urinary KIM-1 was below detection in all control and biopsy-only monkeys but increased above threshold in 4 of 5 tobramycin-treated monkeys with levels rising above threshold as early as study day 8 (animal 11-0441) and fold changes as high as 198-fold were seen at the time of necropsy. Urinary OPN showed increases in 4 of the 5 tobramycin-treated monkeys with only a single time point of a marginal 3.6-fold increase was observed in 1 biopsy-only animal. Osteopontin increases of 3- to 13-fold over baseline in 3 tobramycin-treated monkeys were seen on study day 15 and as early as study day 8, indicating urine OPN is also a sensitive kidney safety biomarker. N-acetyl-β-D glucosaminidase also performed well, showing increases at multiple time points in all 5 tobramycin-treated monkeys with increases of 3- to 17-fold seen as early as study day 4, while remaining unchanged at all time points in all control and biopsy-only monkeys. Clusterin was above threshold in 4 of 5 tobramycin-treated monkeys at the time of necropsy with levels rising above threshold as early as study day 8 and a transient increase in the other tobramycin-treated monkey. However, CLU also showed minimal increases in all 3 biopsy-only monkeys and a transient marginal increase in 1 of 2 control monkeys. Urine ALB, total protein, and CysC only showed increase in 1 tobramycin-treated monkey (11-0441), which had the most histopathological findings in this study with minimal tubular degeneration and mild tubular dilatation. Neutrophil gelatinase-associated lipocalin and RBP4 were overall not altered in tobramycin-treated animals and they are deemed not sensitive biomarkers in NHP to tobramycin-induced minimal kidney injury (Table 3).
Discussion
Kidney biopsies are used sparingly to diagnose kidney injury and diseases in the clinic. 3 In this study, we explored whether histopathologic evaluation and gene expression analysis of kidney biopsy samples would add value in monitoring kidney injury in monkey. The histologic results from kidney biopsy samples from tobramycin-treated monkeys were not remarkable, while the representative whole kidney sections from necropsy showed histopathologic findings of minimal tubular degeneration and/or minimal to mild tubular dilatation (Table 1). The lack of histopathologic changes in the renal biopsies of tobramycin-treated monkeys could be attributed to the limited availability of tissue for evaluation, 17 the artifactual distortion induced by biopsy sampling technique, and the subtle nature of the renal change.
Gene expression analysis of the kidney biopsy samples presented a clearer picture, but care must be taken to rely upon the naive kidney biopsy gene expression data from study days −4, 4, 8, and 11 as the gene expression levels of the study day 15 kidney samples might be impacted by prior biopsy procedures. In this study, each monkey had 3 kidney biopsy samples taken with the first and second biopsies representing the initial biopsy on naive kidneys on the right and left side, respectively. The third biopsy samples taken from the left kidneys and the whole kidney sections taken from the right kidneys on study day 15 represented samples which may possibly be affected by the biopsy procedure itself. Based on the gene expression patterns of 2 of the 3 biopsy-only monkeys (Table 2, monkey IDs 07-0059 and 16-1135), KIM-1 gene expression increases of 11- to 33-fold were seen in study day 15 biopsy samples from left kidney collected 7 days after a prior biopsy on the same kidney, indicating that the kidney insult by biopsy procedure alone was enough to cause changes at the molecular level to affect KIM-1 gene expression, consistent with the KIM-1 function in the kidney regenerative process. It should be noted though that in these 2 biopsy-only monkeys the KIM-1 fold changes observed in study day 15 samples of cortex or medulla collected from right kidney 18 days after a prior biopsy were only up to 4-fold, thus appearing less affected at the gene expression level after a longer recovery time period.
The increase of KIM-1 mRNA concentration reflects the role of KIM-1 in the dedifferentiation and regenerative proliferation response within the proximal tubule upon insult. 18 –20 KIM-1 showed the best performance of all genes in the gene expression profiling. KIM-1 gene expression showed high magnitude increases in all tobramycin-treated monkeys in contrast to its levels in control and biopsy-only monkeys and showed excellent correlation with histopathological findings that ultimately presented in the whole kidney sections (Table 2). Furthermore, KIM-1 gene expression increases, in general, rise higher in tobramycin-treated monkey that presented with tubular degeneration and dilatation than monkeys with tubular dilatation alone (Table 2). The KIM-1 levels showed high elevations in the kidney biopsy samples from all 3 biopsy-naive left kidneys on study day 11 of tobramycin-treated monkeys indicating ongoing response to the kidney insult at the molecular level. The upregulation of KIM-1 expression in both cortex and medulla sections of kidney in the monkey is consistent with KIM-1 expression in the proximal tubules of the cortex and the S3 segment of proximal tubules in the outer medulla in the rat 19 and the medullary tubule epithelium of the monkey. 21
CLU is a glycoprotein involved in various biological processes such as binding and trafficking of necrotic tissue debris 22,23 and is transcriptionally upregulated in both proximal and distal tubules upon kidney injury. 1 OPN is a glycophosphoprotein with presence in the loop of Henle and distal tubules and it is also upregulated upon kidney injury. 24 CLU and OPN gene expression performed similarly but were not as sensitive as KIM-1 in that their gene expression levels passed threshold in all 5 kidney biopsy samples, but the magnitudes of fold changes were lower than that of KIM-1. Furthermore, the changes in general did not occur until study day 15, with only one of the 3 tobramycin-treated animals with a biopsy collection on study day 11 showed gene expression elevations in CLU and OPN.
A threshold of 3-fold of the mean of urine creatinine normalized baseline biomarker values from all study animals was used here for all urinary kidney safety biomarkers based on the analysis of baseline variations of an internal monkey data set consisting of 160 monkeys, 25 of which also allowed an analysis of longitudinal intraanimal variability. Although this is a reasonable cutoff based on 95% upper confidence limits (mean + 2 standard deviation), a universal 3-fold cutoff may not work equally well for all urinary kidney safety biomarkers. Such thresholds for individual urinary kidney safety biomarkers should be further refined individually when larger data sets become available in monkey. Among accessible kidney safety biomarkers, conventional serum kidney biomarkers BUN and sCr showed poor correlation with the kidney lesions, while urinary kidney safety biomarker KIM-1 showed the best performance. KIM-1 had excellent sensitivity and specificity, as well as great correlation with both kidney histomorphological findings and KIM-1 gene expression. Urinary OPN and NAG also showed good performance. There was a transient increase of OPN just crossing threshold on study day 10 in 1 biopsy-only monkey (07-0059), which is likely due to the biopsy procedure itself. NAG showed excellent performance with increases in all 5 tobramycin-treated monkeys while staying at baseline level in control and biopsy-only monkeys. This is consistent with its previously published performance in NHP. 9 However, NAG was not a good indicator of toxicity in tenofovir-induced kidney injury in monkeys, 4 and the excellent performance here may be due to some particular toxicological aspect of the test article used, as tobramycin was shown to cause NAG increases in multiple prior studies. 25,26 The performance of urinary CLU was not as robust as KIM-1 and OPN. Urinary CLU crossed threshold in all 5 tobramycin-treated monkeys, with fold changes of up to 38-fold. However, CLU levels also crossed threshold in all 3 biopsy-only monkeys, although at lower fold change levels compared with tobramycin-treated monkeys, as well as just passing the threshold in a control monkey. Since all the time points when urinary CLU showed increase in biopsy-only monkeys were after the first kidney biopsy, the low levels of CLU increase were likely due to the biopsy procedure itself, and the high levels of CLU increase observed in the tobramycin-treated monkeys likely reflected the additive effect of biopsy and considered a more reliable indicator of the DIKI. Urine ALB and total protein showed increase only in 1 tobramycin-treated monkey which presented with the most kidney histopathologic findings, and they are useful in this regard at confirming an animal to have greater injury. Overall, urinary biomarkers KIM-1, OPN, NAG, along with ALB, total protein, and CLU, when considered together with serum biomarkers, provided very good monitoring capacity for kidney injury.
There is good overall concordance between the rise of gene expression levels of KIM-1, CLU, and OPN and the rise of their urinary levels. However, KIM-1 showed minimal to mild gene expression increases in 2 of the 3 biopsy-only monkeys (Table 2) without the corresponding increase in urinary KIM-1. This apparent discrepancy may be explained because urine KIM-1 baseline was undetectable and 50% of the assay LLOQ concentration was used as the baseline value for urine KIM-1 fold change calculations. The higher analytical limit of detection for urine protein, and the method applied as a result, for fold change calculation may explain why small increases of urine KIM-1 are not being captured in this particular experiment and are not matching the biopsy gene expression results for KIM-1.
Judging from the timing and the magnitude of induction, gene expression analysis of the kidney biopsy samples and urine protein concentration measurements resulted in comparable performances in monitoring kidney toxicity, surpassing the performance of serum biomarkers.
Since gene expression analysis of the kidney biopsy samples had comparable performance with urinary protein kidney safety biomarkers, our data do not support routinely adding additional kidney biopsy procedures to toxicology monkey studies in which urinary protein kidney safety biomarkers are being monitored. Kidney biopsy is rarely done in preclinical studies, and our data do not suggest any change should be made in that regard. However, in cases when kidney biopsies are included in the study and histopathological examination does not reveal much in both preclinical monkey studies and in the hospitals, our data suggest gene expression analysis could provide an additional diagnostic tool to the weight of evidence to consider along with serum and urinary kidney safety biomarkers. Furthermore, future situations may arise when mechanistic insights are being sought and this additional goal may be explored as we continue to learn more from gene expression data obtainable from such small biopsies collected at early time points when urine biomarkers signal the very onset of toxicity, allowing more insight to be obtained while animal use is being minimized.
Although the results from this study were compelling, we recognized that the limited quantity and the artifactual distortion of kidney biopsy samples prevented a thorough histopathological examination according to the accepted standards. 17,27 Although the needle size used in the biopsy in these experiments is comparable to that used in the clinic 28 and is considered generally safe for monkey kidney biopsy, 29 diverting a portion of the biopsy sample to gene expression analysis contributed to having insufficient samples for histology. Using a larger needle size would increase the biopsy size 30 but will also increase the risk of the internal bleeding and kidney damage since we have already observed the kidney injury with the 18 gauge biopsy needle size used. Furthermore, a limitation of this study is that this is a small exploratory study with a small number of monkeys that became available at the time, with the further complications of 2 separate studies conducted at slightly different tobramycin dose levels. A larger study with more monkeys per group would further solidify the conclusions reached from this study. An additional study arm without setting aside a portion of the kidney biopsy for gene expression analysis would yield a larger specimen for histopathologic examination and could potentially address whether histopathologic examination of biopsy specimens for acute drug induced toxicity can still serve as the gold standard for biomarker qualification.
In summary, kidney biopsy is performed in clinical settings to diagnose kidney injury and disease, typically when albuminuria, proteinuria, or hematuria are observed, and a change of kidney histology is suspected. We conducted a small exploratory study and performed the first multiparametric comparison of different kidney safety monitoring methods also involving longitudinal biopsies in a tobramycin-treated monkey model. Our data support the incorporation of measuring the gene expression levels of the kidney biopsy samples for KIM-1, CLU, and OPN, either alone or together with TNFRSF12A, TIMP1, GPNMB, CDK1, OLR1, AURKB, CXCL1, and EGR2 to monitor kidney injury. Furthermore, our data support the incorporation of urinary concentration measurements of KIM-1, OPN, CLU, NAG, ALB, and total protein urinary levels as superior indicators of low-grade acute kidney injury alongside the conventional BUN and sCr parameters. We anticipate that integration of the above more sensitive kidney injury detection methods could further enhance early detection and diagnoses of acute kidney injury.
Supplemental Material
Supplemental Material, sj-docx-1-tpx-10.1177_01926233211049171 - Kidney Injury Monitoring in Tobramycin-Treated Rhesus Monkeys: Supplementing Urinary Kidney Biomarkers With Kidney Biopsy Gene Expression Profiling
Supplemental Material, sj-docx-1-tpx-10.1177_01926233211049171 for Kidney Injury Monitoring in Tobramycin-Treated Rhesus Monkeys: Supplementing Urinary Kidney Biomarkers With Kidney Biopsy Gene Expression Profiling by Yi-Zhong Gu, Larry Handt, Katerina Vlasakova, Vasudevan Bakthavatchalu, Roger Smith, Guillermo E. Fernandez, Stephanie L. Born, Warren E. Glaab and Frank D. Sistare in Toxicologic Pathology
Footnotes
Declaration of Conflicting Interests
The author(s) declared no potential conflicts of interest with respect to the research, authorship, and/or publication of this article.
Funding
The author(s) received no financial support for the research, authorship, and/or publication of this article.
Supplemental Material
Supplemental material for this article is available online.
References
Supplementary Material
Please find the following supplemental material available below.
For Open Access articles published under a Creative Commons License, all supplemental material carries the same license as the article it is associated with.
For non-Open Access articles published, all supplemental material carries a non-exclusive license, and permission requests for re-use of supplemental material or any part of supplemental material shall be sent directly to the copyright owner as specified in the copyright notice associated with the article.