
Abstract
Dose-response expression of kidney injury molecule-1 (KIM-1) gene in kidney cortex and its correlation with morphology and traditional biomarkers of nephrotoxicity (plasma creatinine and blood urea nitrogen, BUN) or segment-specific marker of proximal tubule injury (kidney glutamine synthetase, GSK) were studied in male rats treated with proximal tubule segment-specific nephrotoxicants. These included hexachloro-1:3-butadiene (HCBD, S3 segment-specific), potassium dichromate (chromate, S1-S2 segment-specific), and cephaloridine (Cph, S2 segment-specific). Rats were treated with a single intraperitoneal (ip) injection of HCBD 25, 50, and 100 mg/kg, subcutaneous (sc) injection of chromate 8, 12.5, and 25 mg/kg; or ip injection of Cph 250, 500, and 1,000 mg/kg. KIM-1 gene showed a dose-dependent up-regulation induced by all segment-specific nephrotoxicants. Interestingly, magnitude of the up-regulation reflected the severity of microscopic tubular changes (degeneration, necrosis, and regeneration). Even low-severity microscopic observations were evidenced by significant gene expression changes. Furthermore, KIM-1 showed significant up-regulation even in the absence of morphological changes. In contrast, traditional and specific markers demonstrated low sensitivity or specificity. In conclusion, this study suggested KIM-1 as a sensitive molecular marker of different levels of tubular injury, and it is likely to represent a potential tool for early screening of nephrotoxicants.
Keywords
Introduction
Renal epithelial cell injury is a feature of many acute and chronic renal diseases. Morphological characteristics of injury to the proximal tubule epithelial cells include loss of brush border, loss of cellular polarity, dedifferentiation, and apoptosis (Ichimura et al. 1995). In advanced injury, viable and necrotic tubular epithelial cells detach from the basement membrane and contribute to intraluminal obstruction. Surviving dedifferentiated cells spread over the denuded basement membrane undergo mitogenesis and ultimately redifferentiate and reestablish normal epithelial polarity, resulting in a normal functional epithelium (Thadhani, Pascual, and Bonventre 1996; Sheridan and Bonventre 2000). Although these processes are well described at the histopathological level, very little is known about the molecular factors that regulate these events. One of the genes identified from post-ischaemic rat kidney by representational difference analysis (Hubank and Schatz 1994) was designated (Ichimura et al. 1998) as kidney injury molecule-1 (KIM-1). KIM-1, also known as TIM-1 (T cell immunoglobulin mucin domains–1), as it is expressed at low levels by subpopulations of activated T cells, and hepatitis A virus cellular receptor–1 (HAVCR-1), expressed by hepatocytes, is a transmembrane protein with extracellular mucin and immunoglobulin domains. KIM-1 is not detectable in the normal human and rodent kidney but is increased in expression more than any other protein in the injured kidney and is localized predominantly to the apical membrane of the surviving proximal epithelial cells (Ichimura et al. 2008). This gene encodes a type I cell membrane glycoprotein containing, in its extracellular portion, a six-cysteine immunoglobulin-like domain and a mucin domain. Immunoglobulin-like domains have been widely implicated in mediating protein-protein interaction (Barclay et al. 1999), in particular at the cell surface, where they are responsible for cell-cell and cell-extracellular matrix interactions. The mucin domain could play a dual role of configuration and protection (Jentoft 1990) as well as being involved in cell adhesion. The cytoplasmic domain of KIM-1 is relatively short and possesses a potential phosphorylation site, indicating that KIM-1 may be a signaling molecule. Although it is clear that KIM-1 is upregulated in the post-ischaemic kidney (Ichimura et al. 1998), it is not clear whether its expression serves as a general biomarker for tubular injury and processes that lead to repair.
Traditional markers of kidney toxicity, such as blood urea nitrogen (BUN) and creatinine for toxicological evaluation, have limitations (Duarte and Preuss 1993). First, they are not region specific, and second, significant changes may not occur until 30–50% damage has occurred (determined by histopathology assessment and/or functional tests). Consequently, there has been an ongoing interest in developing new, early biomarkers of renal damage (Duan et al. 1999; Taylor et al. 1997). Many initiatives are in progress to address this objective—among them the Predictive Safety Testing Consortium (PSTC), a pharmaceutical industry public-private partnership led by the nonprofit Critical Path Institute (C-Path). Recently, the PSTC submitted to the regulatory Food and Drug Administration (FDA) and the European Medicines Agency (EMEA) the data for a panel of urinary proteins, including KIM-1, that obtained qualification for specific regulatory purposes. Integration of emerging transcription technology into traditional safety assessment evaluation offers the possibility to take new steps toward understanding mechanism of target organ toxicity. Thus, it is intriguing to determine whether genomics evaluation could lead to the elucidation of markers that may provide additional sensitivity or earlier detection of proximal tubular damage. In fact, a transcriptional response offers a preliminary indication of the biochemical or biological mechanism that could possibly be affected by a toxicant.
The aim of the present research was to investigate the dose-related response of KIM-1 gene in male rats treated with proximal tubule segment-specific nephrotoxicants, namely, hexachloro-1:3-butadiene (HCBD) specific for S3 segment (Ishmael, Pratt, and Lock 1982), potassium dichromate (chromate) specific for S1-S2 segments (Biber et al. 1968), and cephaloridine (Cph) specific for S2 segment (Atkinson et al. 1966). Histopathological examination was performed to confirm the presence of segment-specific damage caused by those chemicals. KIM-1 response was compared to conventional markers of kidney toxicity, BUN and plasma creatinine or segment-specific (S3) marker of proximal tubule injury such as glutamine synthetase in kidney tissue (GSK), and light microscopy to evaluate if changes in gene expression may be used to detect signals of renal tubular dysfunction induced by nephrotoxicants.
Materials and Methods
Chemicals
HCBD (purity > 97%) and chromate were purchased by Fluka (Buchs, Switzerland). Cph was generously supplied by GlaxoSmithKline (Verona, Italy).
Experimental Design
Animal husbandry and treatment were performed according to European Directive 86/609/EEC governing animal welfare and protection (acknowledged by Italian law 116/92), and the research project was approved by the Padua University Laboratory Animal Care Service and by the Italian Board of Health.
Forty-eight albino, male Wistar rats (Harlan, Udine, Italy) 8 weeks old (body weight 215±16 grams), were maintained in plastic cages in a conditioned environment with a natural dark-light cycle, fed with a standard diet and were able to drink ad libitum. The rats (4 animals per group) were treated with a single ip injection of HCBD 25, 50, and 100 mg/kg bw dissolved in corn oil; s.c. injection of chromate 8, 12.5, and 25 mg/kg bw dissolved in saline corresponding to 2.8, 4.4, and 8.8 mg/kg body weight (bw) as chromium, respectively; or ip injection of Cph 250, 500, and 1,000 mg/kg bw dissolved in distilled water. For the selected compounds, doses were chosen on the basis of previously published studies (Kurota and Yamaguchi 1995; Trevisan et al. 2001). Concurrent control groups (4 animals per group) were treated with the compound-specific vehicle (corn oil, saline, or distilled water) only.
Forty-eight hours after the treatments, the rats were anaesthetized with isoflurane, and blood was drawn from the heart in heparinized tubes. The animals were then sacrificed with an overdose of isoflurane, and the kidneys were promptly removed and prepared as follows: the right kidney was fixed in 10% neutral phosphate buffered formalin for light microscopy; and the left kidney (cortical region) was chopped into smaller pieces (3–5 mm3), collected into 5 mL RNALater reagent (Ambion, Milan, Italy), and stored at –80°C for gene expression measurement.
BUN, Plasma Creatinine, and GSK
Blood was centrifuged 10 minutes at 2,000g to divide plasma that was stored at –80°C until the measure of BUN and creatinine, using an automated clinical chemistry analyzer (ADVIA 1650 Chemistry System, Siemens, Milan, Italy). The method for BUN quantification is based on Talke and Schubert enzymatic procedure (1965). The plasma creatinine method is based on basic-picrate Jaffe’ reaction (Jaffe 1886).
GSK was spectrophotometrically (Perkin Elmer lambda 5 model, Monza, Italy) determined in 10% w/v supernatant of kidney cortex, modifying the method of Rowe et al. (1970) as previously described (Trevisan et al. 2001). Enzyme activity was expressed as nmoles of product per mg (nmol mg–1) of proteins according to the method of Miller (1959).
KIM-1 Gene Expression in Kidney Cortex
RNA Isolation and Conversion to cDNA
Total RNA was isolated from 30 mg kidney cortex using the RNeasy Mini Kit (Qiagen, Milan, Italy) following homogenization by a Qiagen Tissue Lyser homogenizer. After quantification by a spectrophotometer (BioPhotometer 6131, Eppendorf, Milan, Italy) measuring the absorbance at 260 nm, RNA samples were treated with DNase I enzyme (Ambion, Milan, Italy) to eliminate any possible genomic DNA contamination. RNA quality was assessed on an Agilent 2100 Bioanalyzer (Agilent Technologies, Milan, Italy). DNased RNA was quantified using the RiboGreen™ RNA Quantitation Kit (Invitrogen, Milan, Italy) by a plate fluorescence reader (SpectraMax Gemini XPS, Molecular Devices, Milan, Italy) at λ-480 nm excitation and λ-520 nm emission. Synthesis of the cDNA template was based on the ABI High Capacity cDNA Archive Kit protocol (Applied Biosystems, ABI, Monza, Italy). Reverse transcription of 4 μg RNA was carried out in the presence (RT+) and absence (RT–) of the Superscript II reverse transcriptase enzyme. The RT– sample was prepared to allow the identification of eventual genomic DNA contamination. RT+ samples were created in duplicate (a and b) to evaluate variability caused by RT-PCR reaction.
Real-Time PCR Analysis of Gene Expression
qRT-PCR was performed using the ABI 7900 HT Sequence Detection System (ABI, Monza, Italy), with 40 ng of cDNA, and TaqMan™ Universal PCR Master Mix (ABI, Monza, Italy). Specific TaqMan™ Gene Expression Assay (assay no. Rn00597703_m1, ABI, Monza, Italy) was used to quantify KIM-1.
In addition to the target gene, an endogenous control or housekeeping gene (18S ribosomal RNA, assay no. HS99999901_s1, ABI, Monza, Italy), with constant expression level between samples was selected using the TaqMan™ Low Density Array Rat Endogenous Control Panel (part no. 4378704, ABI, Monza, Italy). It allowed a screening of control and treated samples across different sixteen most commonly used rat housekeeping genes.
All samples were performed in triplicates. RT-PCR data were analyzed using the RQ Manager Software (ABI, Monza, Italy), using the comparative Ct method as described in the manufacture’s instructions. Gene expression was expressed as relative amount of mRNA (RQ): 2–ΔΔCt, where ΔΔCt is the normalized signal level in a sample relative to the normalized signal level in the corresponding calibrator sample (an untreated control for each experiment). The normalized signal levels refer to the signals generated by the amplification of the target sequence in the unknown and calibrator samples, which is normalized to the signal generated by the amplification of the endogenous control.
Histopathology
The 10% neutral phosphate buffered formalin fixed kidneys were then processed in paraffin wax, cut (3 μm in thickness), and stained with H&E. At microscopic examination, tubular cell degeneration, necrosis, and regeneration were graded as minimal to marked according to the tubular involvement (minimal [+]: single tubules; mild [++]: groups of tubules; moderate [+++]: almost all tubules; marked [++++]: all tubules). The severity of tubular dilation was graded according to the extension of the damage (minimal [+]: cortex only; mild [++]: cortex to outer medulla; moderate [+++]: cortex to upper portion of inner medulla; marked [++++]: cortex to deep portion of inner medulla [papilla]).
Statistics
Statistical evaluation of the results was performed by means of Dunnett’s t-test, and significance was stated from p < .05.
Results
BUN, Plasma Creatinine, and GSK (Figure 1A-C)
HCBD and chromate caused a significant (p < .05) increase in BUN (3.7- and 3.4-fold vs. control, respectively) and plasma creatinine (2.7- and 2.1-fold vs. control, respectively) at the high dose only. No changes were observed in BUN and creatinine after treatment with Cph at all doses.
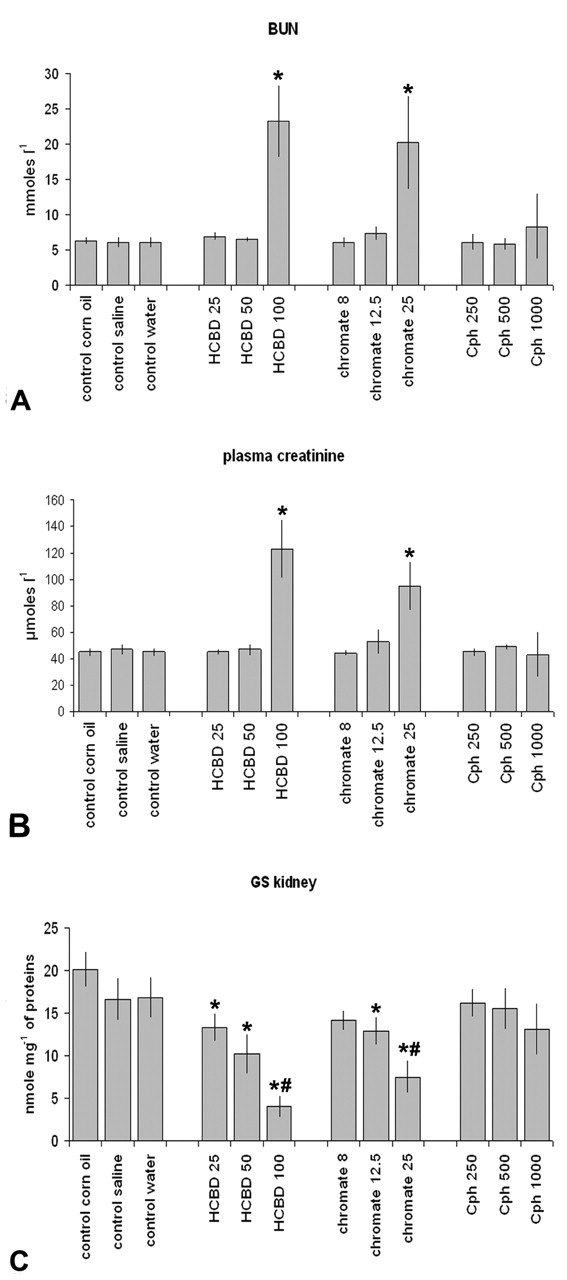
Increase (mean ± standard deviation) in blood urea nitrogen (BUN) (A) and plasma creatinine (B), or decrease in glutamine synthetase in kidney tissue (GSK) (C) in male rats treated with different doses of hexachloro-1:3-butadiene (HCBD), potassium dichromate (chromate), or cephaloridine (Cph) in comparison with concurrent controls. * = Statistically significantly different from control, p < .05. # = Statistically significantly different from the adjacent value, p < .05.
By contrast, a significant (p < .05) decrease in GSK activity was observed starting from the low dose (from 34% up to 80% of control) after HCBD treatment or from the middle dose (from 22% up to 55% of control) after chromate treatment. No significant changes in GSK activity were observed after Cph treatment.
KIM-1 Gene Expression in Kidney Cortex (Figure 2)
In contrast to BUN and plasma creatinine responses, the three chemicals caused significant (p < .05) dose-dependent up-regulation of KIM-1. In details, KIM-1 mRNA levels were increased of 26-, 137-, or 503-fold versus control by HCBD 25, 50, or 100 mg/kg, respectively. Chromate appeared to be the nephrotoxicant that induced the most significant gene up-regulation, being mRNA levels 33-, 1,008-, or 2,076-fold versus control, at 8, 12.5, or 25 mg/kg, respectively. KIM-1 up-regulation caused by Cph was marked at the high dose (700-fold vs. control), whereas middle and low doses, even though significant (p < .05), caused a less marked increase in gene expression (4- and 3-fold vs. control, respectively).
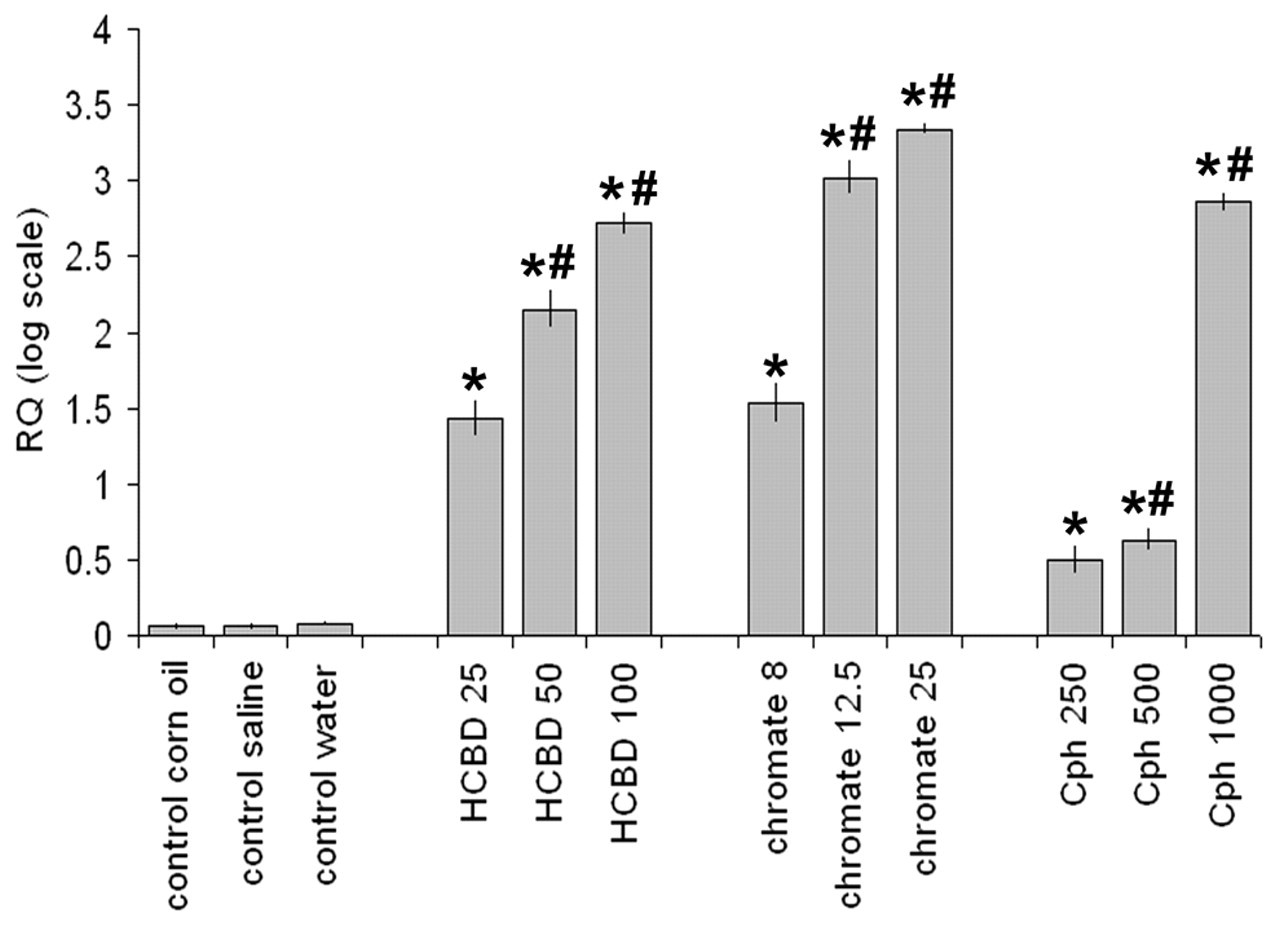
Dose-dependent up-regulation of kidney injury molecule-1 (KIM-1) (mean ± standard deviation) in male rats treated with different doses of hexachloro-1:3-butadiene (HCBD), potassium dichromate (chromate), or cephaloridine (Cph) in comparison with concurrent controls. Real-time RT-PCR results are expressed as relative amount of mRNA (RQ) in logarithmic scale (logRQ). * = Statistically significantly different from control, p < .05. # = Statistically significantly different from the adjacent value, p < .05.
Histopathology
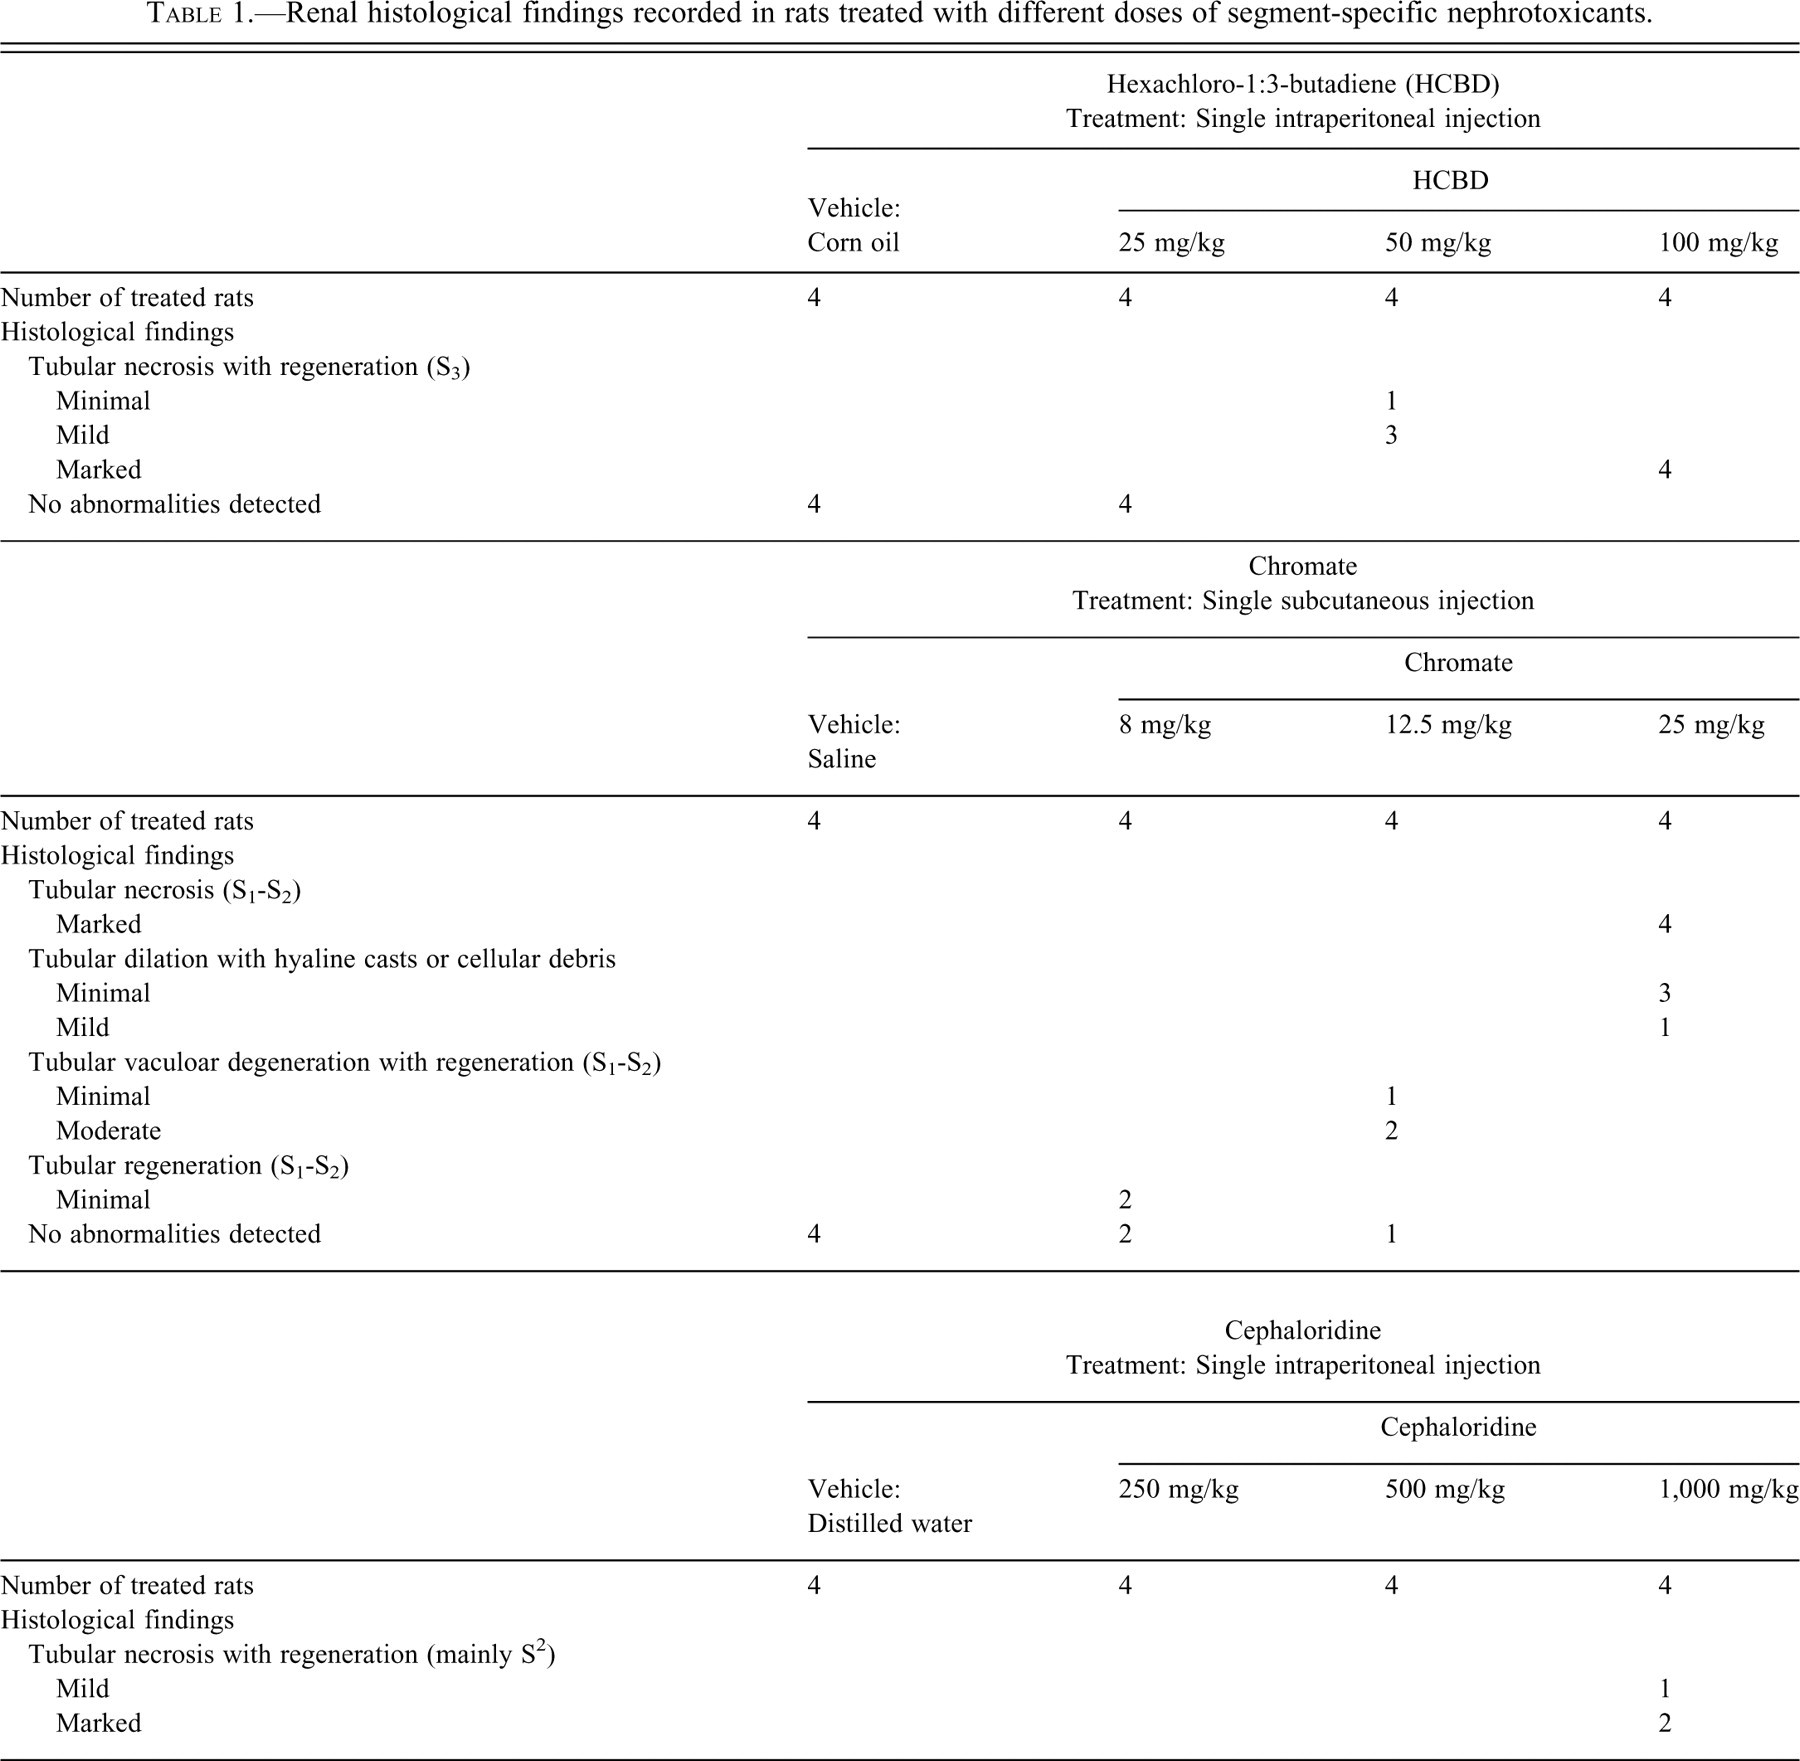
Single ip injection of HCBD induced dose-related histopathological findings (Table 1 , Figure 3A). At 100 mg/kg, 4/4 rats were affected by marked tubular necrosis with regeneration of the S3 segment of proximal tubules. At 50 mg/kg, tubular necrosis with regeneration was still present in 4/4 rats but appeared less severe, being minimal (3/4 rats) or mild (1/4). At 25 mg/kg, tubules of the S3 segment were unaffected in all rats. No abnormalities were recorded for the vehicle-treated rats.
Renal histological findings recorded in rats treated with different doses of segment-specific nephrotoxicants.
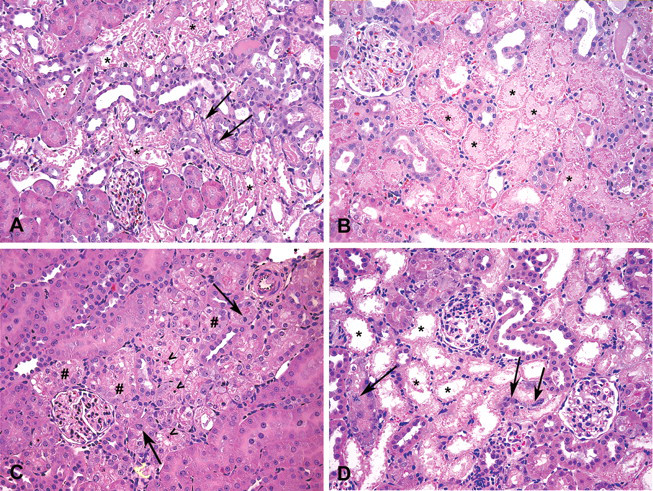
Micrographs showing histopathological changes induced by tested nephrotoxicants. (A) Administration of hexachloro-1:3-butadiene (HCBD) at 100 mg/kg was associated with effacement of pars recta (S3), characterized by hypereosinophilic tubular cells with loss of nuclear detail, detaching from the basement membrane and exfoliating into the lumen (tubular necrosis). Fusiform cells with plump nuclei, occasionally undergoing mitoses, were seen starting to repopulate the denuded basement membrane (tubular regeneration). (B) Administration of potassium dichromate (chromate) at 25 mg/kg induced necrosis of the pars convoluta (S1-S2), with tubular epithelium showing granular hypereosinophilc appearance of the cytoplasm without evidence of nuclear detail. Distally, tubular lumina appeared variably dilated and/or containing eosinophilic proteinaceous material. (C) At 12.5 mg/kg, chromate-related changes were represented by variably sized, clear vacuoles (vacuolar degeneration), detectable in the cytoplasm of the same tubular segment, associated with scattered apoptotic figures. Occasionally, features of regeneration (mitoses) were also present. (D) Similar changes (tubular necrosis with regeneration) were seen after cephaloridine (Cph) treatment at 1,000 mg/kg. A–D: H&E, 200×. (* = tubular necrosis; # = tubular vacuolar degeneration; arrows = tubular regeneration; > = apoptotic figures).
Administration of single sc injection of chromate induced dose-related histopathological findings (Table 1, Figure 3B, 3C). At 25 mg/kg, 4/4 rats showed marked tubular necrosis of the S1-S2 segments of the proximal tubules. In addition, distally to necrotic segment, tubular dilation occasionally associated with intratubular casts or intraluminal cellular debris was recorded for all rats and graded as minimal (3/4 rats) to mild (1/4 rat) distally to necrotic segment. At 12.5 mg/kg, tubular vacuolar degeneration with regeneration was minimal in 1/4 rat, or moderate 2/4 rats. Evidences of regeneration (mitotic figures/basophilic cells with prominent nuclei/nucleoli) were occasionally detected. At 8 mg/kg, regeneration only, without clear evidences of tubular cell necrosis, were seen in 2/4 rats, affecting a minimal number of tubules. No abnormalities were detected for the remaining 2 rats at 8 mg/kg as well as for all vehicle-treated rats.
Finally, single ip injection of Cph induced histopathological findings at 1,000 mg/kg only (Table 1, Figure 3D). These consisted in tubular necrosis with regeneration of the S2 segments of the proximal tubules with relative sparing of some tubules closely associated with the renal corpuscles (possibly the S1 portion). Tubular necrosis with regeneration was seen in 3/4 rats and graded mild in 1 rat or marked in 2. No abnormalities were detected in rats receiving Cph at doses of 250 and 500 mg/kg as in vehicle-treated rats.
Discussion
The identification and evaluation of novel markers of target organ toxicity has been one of the main applications of genomic-based technologies (Fielden and Zacharewski 2001; Huang et al. 2001; Goodsaid 2004; Wang et al. 2008). An area in which this approach has been recently applied is drug-induced nephrotoxicity in rodents. Much of the published literature employed cDNA arrays to assess nephrotoxicity in rats induced by known xenobiotics (Huang et al. 2001). Gene expression changes were observed in a multitude of distinct pathways. One of these genes, KIM-1, not expressed in healthy kidney but strongly up-regulated after toxic or ischemic injury, is thought to be associated with dedifferentiated tubular epithelial cells, although a role in cellular regeneration has not been established.
For application purposes, it is highly desirable to identify predictive biomarkers of toxicity following exposure. For a gene expression change to be predictive, it must occur rapidly following exposure, before the onset of histopathological changes. In fact, as a result of temporal effects, changes in genomic markers may occur before subsequent protein translation and initiation of histological kidney damage. An increase in severity or incidence in severity of the lesion over time or by increased doses of toxicant should correlate with changes in gene expression.
In the current study, KIM-1 gene expression was measured in rats treated with three proximal tubule segment-specific toxicants, namely, chromate (S1-S2 segments), Cph (S2 segment), and HCBD (S3 segment). Results obtained using three incremental doses of nephrotoxicants were compared with common and specific parameters of kidney toxicity (plasma creatinine, BUN, and GSK) and histopathology to evaluate the correlation among gene expression response and morphological or functional disruption induced by the compounds.
The three chemicals exert their nephrotoxicity with different mechanisms, damaging different segments of the nephron. HCBD is a halogenated alkene that undergoes liver glutathione conjugation and further biotransformation to S-(pentachlorobutadienyl)-1-cysteine, and it is cleaved by cysteine conjugate ß-lyase to a nephrotoxic thioketene in the kidney (Dekant et al. 1991). The hydrocarbon affects specifically the S3 segment (pars recta) of the proximal tubule (Ishmael, Pratt, and Lock 1982). On the contrary, chromate can react with hydrogen peroxide to hydroxyl radical inducing DNA damage (Aiyar et al. 1991). The metal is accumulated in the renal cell by an anion transport system and subjected to intracellular reduction (Standeven and Wetterhahn 1989). The target of chromate is the pars convoluta (S1-S2 segments) of the proximal tubule (Biber et al. 1968). Finally, Cph is a first-generation cephalosporin antibiotic, known to cause renal damage in human and experimental animals (Tune 1993). The nephrotoxicity of cephalosporins is mainly dependent on the balance between uptake into the kidney from the blood circulation by the anion transporter located in the basolateral membrane and secretion into the tubular lumen at the luminal part of the plasma membrane (Tune 1975). The renal damage is characterized by acute proximal tubular necrosis, most prominently to the S2 segment of the pars convoluta (Atkinson et al. 1966).
In the current study, KIM-1 gene showed a significant dose-dependent up-regulation induced by all segment-specific nephrotoxicants. Microscopic damage in proximal tubules reflected the magnitude of the up-regulation, with marked necrosis being observed at the high doses. Lower doses induced less severe necrosis and/or degeneration and/or regeneration or no changes at all.
In contrast to Zhou et al. (2008), a marked up-regulation of KIM-1 gene in kidney cortex was also found after treatment with lower doses of chromate (2.8 and 4.4 mg/kg bw as chromium). A possible explanation is that KIM-1 gene was measured 48 instead of 24 hours after treatment, and this delay could justify the higher levels of KIM-1 mRNA. A support to this hypothesis is supplied by the same study (Zhou et al. 2008) showing a high increase of KIM-1 in urine (no expression was measured in kidney cortex) 48-72 hours after single sc injection of 5 mg/kg bw chromate considered as chromium.
Histopathological findings induced by HCBD and chromate were accompanied by changes in BUN and plasma creatinine levels at the high doses only when significant tubular damage had already occurred, confirming the low sensitivity of these markers of kidney toxicity (Duarte and Preuss 1993). On the contrary, S3 segment-specific markers of tubular damage as GSK (Trevisan et al. 2001) were dose-dependent decreased by HCBD, partially by chromate (prevalently when distal portion of proximal tubule was damaged), but not by Cph. Although Cph–induced tubular damage (necrosis) observed at the high dose only was more variable in severity and less frequent, it was captured by gene expression analysis but not accompanied by modification in BUN, plasma creatinine, or GSK activity. Lower doses of Cph induced a minimal but significant increase in KIM-1 transcript levels, without any evidence of damage observed at histopathology. These data are in agreement with results published in a recent study (Rokushima et al. 2008) where microarray technology evidenced KIM-1 up-regulation after treatment with single i.v. injection of 600 mg/kg Cph. The lack of a gene expression response at lower doses (150 and 300 mg/kg) can be attributed to the lower sensitivity of the technique, since qRT-PCR is the most appropriate method for precise quantization of transcriptional abundance of identified genes by microarray (Provenzano and Mocellin 2007).
Tubular damage and severity detected in all our experiments were correlated with gene changes. Commensurately with the damage, epithelial necrosis was associated with a greater degree of gene expression changes. Interestingly, even low-severity microscopic observations were evidenced by gene expression changes, capturing different levels of damage. In addition, KIM-1 showed significant upregulation even in the absence of morphological changes. Moreover, KIM-1 gene expression not only was associated with regenerative process, particularly evident in HCBD-treated rats, but also present at low doses of chromate. On the other hand, the highest increases in KIM-1 mRNA levels were measured for the high dose of chromate, causing established damage (necrosis) not associated with regeneration. These results confirm the implication for KIM-1 not only in dedifferentiated tubular cells but also in renal injury not associated to regeneration.
In situ hybridization and immunohistochemistry revealed that KIM-1 is expressed in proximal tubular epithelial cells in damaged regions, especially in the S3 segment in the outer stripe of the outer medulla, a region that is highly susceptible to injury as a result of ischemia or toxins (Ichimura et al. 1998). Ichimura et al. (2004), using three different types of nephrotoxicants, showed that S-(1,1,2,2-tetrafluoroethyl)-1-cysteine caused a KIM-1 expression pattern similar to that in the post-ischemic kidney, with folic acid having a clear localization in the apical brush border of well-differentiated proximal tubular epithelial cells, and cisplatin having widespread expression in S3 cells of proximal tubules. Previously, we have shown that treatment with segment-specific nephrotoxicants could permit segment-specific localization of proteins and enzymes along the nephron (Trevisan et al. 1998). Accordingly, our results showed significant KIM-1 upregulation induced by all the segment-specific nephrotoxicants used, confirming other studies (Zhang et al. 2008) in which KIM-1 expression is related to the injured tubular epithelial cells depending on the chemical involved in renal damage, and it does not have a segment-specific localization. Further investigations will be performed for KIM-1 localization by in situ hybridization for mRNA and immunohistochemistry for protein, to verify these preliminary indications.
In conclusion, this study evidenced KIM-1 as a molecular marker of different levels of tubular injury (degeneration, necrosis, and regeneration) that could provide a more sensitive indication of damage compared with common clinical measurements. Moreover, since its increased expression was also shown when minimal or even no morphologic modifications were observed, KIM-1 is likely to represent an important genomic marker for the potential screening of nephrotoxicants, confirming the hypothesis that alterations in gene expression can provide a far more sensitive, specific, and measurable endpoint than the manifestation of toxicity, detected by histopathological and/or functional changes (Gatzidou, Zira, and Theocharis 2007). Predictive markers should demonstrate both time- and dose-response relationships to drug treatment, and for this reason a time-course study will be performed using the same segment-specific nephrotoxicants of the current research.
Footnotes
Acknowledgments
This research was presented to the 27th Annual Symposium Society of Toxicologic Pathology, Systems Pathology, San Francisco, June 22–26, 2008.