
Abstract
Hexachloro-1:3-butadiene (HCBD) causes segment-specific injury to the proximal renal tubule. A time course study of traditional and more recently proposed urinary biomarkers was performed in male Hanover Wistar rats receiving a single intraperitoneal (ip) injection of 45 mg/kg HCBD. Animals were killed on days 1, 2, 3, 4, 5, 6, 7, 10, 14, and 28 postdosing and the temporal response of renal biomarkers was characterized using kidney histopathology, urinary and serum biochemistry, and gene expression. Histopathologic evidence of tubular degeneration was seen from day 1 until day 3 postdosing and correlated with increased urinary levels of α-glutathione S-transferase (α-GST), albumin, glucose, and kidney injury molecule-1 (KIM-1), and increased gene expression of KIM-1, NAD(P)H dehydrogenase, quinone 1, and heme oxygenase (decycling) 1. Histopathologic evidence of tubular regeneration was seen from day 2 postdosing and correlated with raised levels of urinary KIM-1 and osteopontin and increased gene expression of KIM-1 and annexin A7. Traditional renal biomarkers generally demonstrated low sensitivity. It is concluded that in rat proximal tubular injury, measurement of a range of renal biomarkers, in conjunction with gene expression analysis, provides an understanding of the extent of degenerative changes induced in the kidney and the process of regeneration.
Keywords
Introduction
Recently, regulatory authorities in Europe, the United States, and Japan endorsed the use of a number of novel and established renal biomarkers (urinary kidney injury molecule-1 [KIM-1], clusterin, albumin, β2-microglobulin, renal papillary antigen, total protein, trefoil factor 3, and serum cystatin C) for the detection of nephrotoxic injury to either the renal tubules or the glomeruli in preclinical safety studies (Dieterle et al. 2010; Harpur et al. 2011; Ozer et al. 2010; Yu et al. 2010). These biomarkers, for the detection of acute drug-induced renal toxicity, were judged to be qualified for limited use in nonclinical and clinical drug development to help guide safety assessments (Dieterle et al. 2010). In reaching this level of regulatory acceptance, these biomarkers have had to meet defined qualification criteria.
Ideally, useful and effective urinary biomarkers of kidney injury should be easily and accurately measurable, noninvasive, detect early stages of damage, be organ and site specific, and correlate clearly with histopathologic findings (Lisowska-Myjak 2010; Tesch 2010). However, in the assessment of the usefulness of a renal biomarker, performance should be evaluated in response to varying degrees of insult (i.e., dose–response), the duration of the response (i.e., time course changes), and the recovery of the response to pre-insult levels (Bonventre et al. 2010). In the appraisal of the more recently proposed urinary biomarkers of renal injury, the use of experimental nephrotoxicants to induce site-specific and organ-specific injury allows investigators to assess dose- and time-related changes in the more recent biomarkers and compare performance with those biomarkers that have been used traditionally (e.g., urine albumin, total protein, glucose, serum urea, creatinine). By correlating such changes with histopathologic findings, renal-specific biomarkers can be assessed in relation to the criteria mentioned above.
Hexachloro-1:3-butadiene (HCBD) is an experimental nephrotoxicant that induces site-specific degeneration/necrosis of the pars recta (S3 portion) of the proximal tubules in the rat nephron (Lock and Ishmael 1979). HCBD exerts specific effects on the proximal tubules after undergoing hepatic glutathione conjugation to S-(pentachlorobutadienyl) glutathione and further transformation to S-(pentachlorobutadienyl)-
Using HCBD to induce proximal tubular injury, dose–response studies have been reported correlating the degree of proximal tubular injury with several of the more recently proposed renal biomarkers (Chiusolo et al. 2010; Swain et al. 2011, 2012). This work has demonstrated the sensitivity of the urinary biomarkers in detecting early renal tubular injury in response to increasing dose levels of HCBD. However, as the kidney undergoes an initial phase of acute degeneration after HCBD administration, followed by a relatively rapid return to normal morphology (Kirby and Bach 1995), the temporal effect of HCBD administration on the more recent renal biomarkers can also be characterized using this animal model. Urinary output of renal biomarkers that are closely aligned to cytoplasmic leakage, such as the urinary glutathione S-transferases (GSTs; Harrison et al. 1989), may differ from the production of biomarkers associated with functional and morphologic recovery. For example, in preliminary studies, using high doses of HCBD (120 mg/kg) in the rat, peak increases in urinary α-GST occurred at day 1 post-dosing, followed at a later stage (day 4 post-dosing) with peak increases in urinary KIM-1 (Swain et al. 2011). These changes supported the correlation of urinary α-GST with early degeneration and toxicity, and KIM-1 with regeneration and repair. However, time course studies are also required to correlate changes (i.e., onset, duration, magnitude, and recovery of the response) in the more recently proposed urinary biomarkers with changes in kidney pathology. Indeed, one limitation identified in the initial renal biomarker qualification submission process concerned the need for recovery studies to demonstrate that reversibility of histopathologic renal lesions could be similarly monitored by biomarker changes (Ozer et al. 2010). Following on from the preliminary dose–response and time course studies (Swain et al. 2011), and the dose–response investigations (Swain et al. 2012), the aim of the present work was to characterize the temporal responses in several traditionally used and more recently proposed urinary biomarkers, employing HCBD-induced proximal tubule damage and to correlate the patterns of change in urinary biomarker levels with tubular histopathology and gene expression.
Materials and Methods
Animals and Husbandry
Male Hanover Wistar rats (Harlan UK, Bicester, Oxfordshire, UK) were acclimatized for a minimum of 3 days, in communal cages, before the start of the study. Tap water and diet (Eurodent Diet 22%; PMI Nutrition International, LLC; P.O. Box 19798, Brentwood, MO 63144, USA; Code 5LF5; crude fat content 3.50%) were provided ad libitum. Animals were maintained with a regular 12-hr light–dark cycle with lights on at 07.00 hr, and at a temperature of 20°C (±2°C); relative humidity was 40% to 60%. Animals were weighed before HCBD administration and at appropriate times post-dosing; they were observed once each day, or more frequently, for signs of ill health. Procedures were conducted under local ethical committee guidelines and approval for Home Office Project and Personal Licences, and followed the UK Home Office “Code of Practice for the Housing and Care of Animals Used in Scientific Procedures” (1989).
Experimental Design
One hundred and twenty rats, mean body weight 215.3 g (7 weeks of age), were allocated to 10 treatment groups of 12 animals each. At 10.00 hr, 6 animals from each treatment group (rat numbers 1 to 6) were weighed and treated with corn oil (vehicle-treated controls); the remaining 6 animals (rat numbers 7 to 12) were weighed and treated with HCBD at 45 mg/kg. The administered dose of HCBD was chosen based on the work from preliminary studies (Swain et al. 2011, 2012), in which 45 mg/kg of HCBD produced consistent and acute evidence of histopathologic proximal tubular degeneration. After treatment, rats were replaced in their communal cages, with diet and water ad libitum. For the day 1 post-dosing necropsy, six vehicle-treated and six HCBD-treated rats were placed singly in metabolism cages for 16 hr (i.e., 6 hr post-dosing), and 18 hr overnight urine samples collected. At 10.00 hr (i.e., at 24 hr post-dosing), the animals were removed from the metabolism cages, necropsied, and the serum prepared. This procedure was then repeated at days 2, 3, 4, 5, 6, 7, 10, 14, and 28 post-dosing, with 6 control and 6 HCBD animals being sampled at each time point for urine and subsequent necropsy.
Administration of HCBD
HCBD (Sigma-Aldrich Chemie GmbH, Steinheim, Germany; 97% purity) was dissolved in corn oil (Mazola Corn Oil, Mazola Edible Foods, Liverpool, Lancashire, UK) and administered by intraperitoneal (ip) injection in a dose volume of approximately 0.3 mL/rat. Control (vehicle-treated) animals were dosed with the equivalent volume of corn oil by the ip route.
Collection of Urine
Animals were placed singly in metabolism cages (Techniplast S.P.A., Varese, Italy) and given access to water ad libitum but not to diet. Animals were weighed before being placed in the metabolism cages and when removed. Consumption of water was calculated from the reduction in water bottle weight (1 g = 1 ml). Urine was collected over ice, and the volume determined from the increase in urine tube weight (1 g = 1 ml). An initial analysis of urine samples was conducted using Multistix Reagent Strips (Siemens Healthcare Diagnostics, Camberley, Surrey, UK), and the samples stored at −80°C prior to a further more detailed analysis.
Necropsy Procedure and Sample Collection
Rats were killed by ip injection of pentobarbital sodium (Pentobarbital Solution 20%; J. M. Loveridge, Southampton, Hampshire, UK) and blood removed from the abdominal aorta. Blood was placed in microtainer tubes (Becton Dickinson, Plymouth, Devon, UK) at room temperature, for the preparation of serum. Microtainers were centrifuged at 2000g (5 min), the serum removed and stored at −80°C. The kidneys and liver were removed and weighed. The right kidney was sectioned transversely and placed in RNAlater Tissue Protect Tubes (Qiagen, Crawley, Sussex, UK); the tubes were gently inverted 10 times before being placed on ice and subsequently were stored at −20°C. The left kidney and a section of the left lateral lobe of the liver were fixed in 10.5% phosphate-buffered formalin.
Histopathologic Examination
Formalin-fixed kidney and liver samples were processed into paraffin wax and sections (3 µm thick) were stained with hematoxylin and eosin (H&E). Kidney sections were graded for the degree of tubular degeneration and regeneration on a 6-point scale of no abnormality detected through to very marked (Table 1).
Summary of microscopic findings of kidney degeneration and regeneration in male Hanover Wistar rats receiving a single dose of 45 mg/kg hexachloro-1:3-butadiene (HCBD) and necropsied at day 1 to day 28 post-dosing.
a HCBD was administered to six animals at each of the 10 time points. However, 6 animals out of a total of 60 animals dosed with HCBD were categorized as “nonresponders.” Results from these animals are not included.
b Six control animals were treated with vehicle and necropsied at each of the 10 time points. No equivalent histopathologic changes were evident in these animals on microscopic examination at any time point.
c Histopathologic grading scheme for degeneration: NAD, no abnormality detected; Minimal, occasional degenerate (brightly eosinophilic) cells with pyknotic nuclei; Mild, small clusters of 2 to 4 degenerate cells with pyknotic nuclei; Moderate, larger clusters, and chains of degenerate cells, some with complete loss of chromatin, affecting numerous tubules; Marked, majority of tubules affected by chains of degenerate cells, loss of chromatin prominent; Very Marked, S3 segment of all tubules affected by degeneration.
d Histopathologic grading scheme for regeneration: NAD, no abnormality detected; Minimal, occasional tubules showing regeneration (increased tubular basophilia, increased. cellularity of regenerative tubules, increased nuclear size, frequent mitotic figures, and decreased chromatin clumping); Mild, scattered tubules showing regeneration; Moderate, frequent tubules showing regeneration; Marked, most tubules showing evidence of regeneration; Very Marked, S3 segment of all tubules with evidence of regeneration.
Histopathologic grading scheme for degeneration: NAD, no abnormality detected; Minimal, occasional degenerate (brightly eosinophilic) cells with pyknotic nuclei; Mild, small clusters of 2 to 4 degenerate cells with pyknotic nuclei; Moderate, larger clusters and chains of degenerate cells, some with complete loss of chromatin, affecting numerous tubules; Marked, majority of tubules affected by chains of degenerate cells, loss of chromatin prominent; and Very Marked, S3 segment of all tubules affected by degeneration.
Histopathologic grading scheme for regeneration: NAD, no abnormality detected; Minimal, occasional tubules showing regeneration (increased tubular basophilia, increased cellularity of regenerative tubules, increased nuclear size, frequent mitotic figures and decreased chromatin clumping); Mild, scattered tubules showing regeneration; Moderate, frequent tubules showing regeneration; Marked, most tubules showing evidence of regeneration; and Very Marked, S3 segment of all tubules with evidence of regeneration
Serum and Urine Clinical Biochemistry
Advia 1650 Clinical Chemistry System
Routine measurements for alanine aminotransferase, glutamate dehydrogenase, aspartate aminotransferase, alkaline phosphatase, total bilirubin, total protein, albumin, urea, creatinine, inorganic phosphorus, calcium, total cholesterol, triglycerides, potassium, sodium, chloride, and glucose were performed on serum. Routine measurements for creatinine, total protein, albumin, and glucose were performed on urine. Both were assayed on the Siemens Advia 1650 Clinical Chemistry System (Siemens Healthcare Diagnostics, Frimley, Surrey, UK) using commercially available reagent kits.
Meso-scale Discovery Immunoassays
Urine samples were assayed using Meso-Scale Discovery electrochemiluminescent immunoassays, with responses evaluated on the Sector Imager 6000 analyser (MSD, Gaithersburg, MD). Kits used were the Rat Kidney Injury Panel 1 (albumin, KIM–1, lipocalin–2 [LCN-2], osteopontin), the Argutus Acute Kidney Injury Panel (α–GST and GST Yb1), and the Clusterin Test Kit (MSD).
Gene Expression Measurement
Three animals at each sampling time point were selected at random from the HCBD-treated group and from the concurrent vehicle-treated control group for kidney gene expression analysis.
RNA Isolation and Conversion to Complementary DNA
RNAlater-preserved kidney tissue samples (65 ± 15 mg) were homogenized using a Tissue Lyser homogenizer (Retsch GmbH, Haan, Germany). Following extraction of RNA/DNA using the RNeasy Mini Kit (Qiagen Ltd), genomic DNA was removed by treatment with DNase 1 enzyme (Ambion, Huntingdon, Cambridgeshire, UK). The RNA concentration was measured using a Nanodrop ND-1000 Spectrophotometer (LabTech International Ltd, East Sussex, UK). Based on the concentration, a fixed amount of RNA was converted to complementary DNA (cDNA) template using the High-Capacity cDNA Reverse Transcription Kit protocol (Applied Biosystems, Warrington, Cheshire, UK).
Real-time Polymerase Chain Reaction Analysis of Gene Expression
The cDNA template was mixed with TaqMan 2X Universal PCR Master Mix (Applied Biosystems) and loaded into a custom low-density array (LDA) card. The LDA card was processed using the 7900 HT Sequence Detection System (Applied Biosystems). The cDNA template was also processed using a Specific TaqManR Gene Expression Assay (number Rn00597703 m1; Applied Biosystems) for quantifying KIM-1 mRNA. All assays used 5 ng cDNA and were based on the quantitative real-time polymerase chain reaction (PCR). Cycle threshold (Ct) values were converted to copy number using the equation: copy number =10 exp[(39 − Ct)/3.4].
Statistical Analysis
Urine concentration data were corrected for urine volume to give a measure of total excretion and are reported as per “collection period” (c.p.). Calculation as follows: concentration per ml × urine volume (ml) collected. Data were log transformed and results from HCBD-treated animals were compared to the concurrent control group means using a two-tailed Student t test. Significance was set at three levels: *p < .05, **p < .01, and ***p < .001. Where used, the “fold increase” or “fold decrease” in a parameter is the ratio of the mean value of the HCBD-treated group in relation to the mean value of the concurrent control group (Swain et al. 2011, 2012).
Results
In Life and Necropsy Findings
During the 18-hr overnight period in the metabolism cages, vehicle-treated control animals at all time points (n = 60) demonstrated a mean loss in body weight of 7.7%. Control animals (n = 6), necropsied at day 1 post-dosing, showed a mean body weight loss of 7.2% during the 18-hr period, whereas in the concurrent HCBD-treated animals (n = 6), the mean body weight loss was 8.4% (p ≤ .05). However, at all other time points (days 2–28 post-dosing), the HCBD-treated animals did not show body weight loss in the metabolism cages significantly greater than concurrent control animals.
The average water consumption, at all time points, for the control animals (n = 60) during the 18-hr period in the metabolism cages was 14.0 ml. At no time point did the HCBD-treated rats show a statistically significant increase in water consumption in comparison with concurrent control animals (Table 2). However, at day 1 post-dosing, the mean water consumption of the HCBD-treated rats (19.2 ml) was higher than the mean volumes at the other time points.
Mean (SD) values of renal biomarkers in the urine of male Hanover Wistar rats treated with vehicle (control; n = 6) or a single injection of 45 mg/kg hexachloro-1:3-butadiene (HCBD) and necropsied at day 1 to day 28 post-dosing.a
a At each time point, six HCBD-treated animals and six concurrent control animals were necropsied, and data analyzed statistically; significant differences are presented, *p < .05, **p < .01, ***p < .001. Results for day 1 control animals are given; results for day 2 to day 28 concurrent control animals are not presented.
b Numbers of animals on days 2, 3, 5, 6, and 7, as explained in Table 1.
c c.p. = collection period (18 hr).
d Mean (SD) values for serum urea and creatinine are also presented.
The average urine production for the control animals, at all time points (n = 60), during the period in the metabolism cages was 17.9 ml (Table 2). At no time point was the urine production of HCBD-treated rats significantly increased, in comparison with concurrent control animals. Nevertheless, at day 1 and day 3 post-dosing, the mean values for urine production in HCBD-treated rats (24.9 and 27.9 ml, respectively) were higher than the mean volumes at the other time points. The mean urine volumes, excluding day 1 and day 3, ranged from 13.3 ml (day 14) to 20.0 ml (day 10). However, on day 5 post-dosing, there was a significant decrease in urine volume in the HCBD-treated group (p ≤ .05) in comparison with the concurrent control animals.
Using reagent strips, analysis of urine samples from HCBD-treated animals showed some evidence of increased levels of glucose, protein, and leucocytes over the day 1 to day 5 post-dosing time points, in comparison with concurrent control animals. Most urine samples from HCBD-treated animals were also positive for blood (28 of 36 samples) from day 2 to day 7 post-dosing and many urine samples from HCBD animals were also positive for ketones (22 of 30 samples) from day 1 to day 5 in comparison with concurrent control animals.
The kidneys of HCBD-treated rats appeared enlarged, and sometimes pale, at necropsy from day 1 to day 5 post-dosing. The mean relative weights of the kidneys from control rats, at all time points (n = 60), was 3.64 g/kg body weight (Table 2); at days 1, 2, 3, 4, and 5, the mean relative kidney weights of HCBD animals were significantly increased by 11.0%, 22.2%, 24.7%, 41.0% and 20.7%, in comparison with concurrent controls, respectively. The mean relative weight (Table 2) of the livers from control rats at the 10 time points (n = 60) was 31.84 g/kg body weight; however, in HCBD-treated rats the mean relative liver weights were significantly increased, in comparison with concurrent control animals, on days 1, 2, 3, and 4, by 9.1%, 11.2%, 12.4%, and 16.2%, respectively.
Nonresponders
Of the 60 animals treated with HCBD, six were considered to have been mis-dosed based on comparison with findings in the concurrent HCBD-treated and control group animals; these animals were therefore categorized as nonresponders. This applied to single animals sampled on days 2, 3, 5, and 7 post-dosing, and to two animals on day 6 post-dosing. Results from these animals showed no clear evidence of proximal tubular injury and findings from these animals are not included in statistical analysis. Data from the six nonresponding animals are presented and discussed later.
Histopathology
The single ip injection of 45 mg/kg HCBD induced time-related histopathologic evidence of degeneration and regeneration in the S3 segment of the proximal renal tubules (Table 1; Figure 1). Histopathologic evidence of degeneration was present from day 1 until day 3 post-dosing. On day 1, HCBD-treated animals showed minimal (2 of 6), mild (2 of 6), and moderate (2 of 6) epithelial degeneration. On day 2, HCBD-treated animals displayed moderate (2 of 5) or marked (3 of 5) evidence of degeneration. On day 3, degeneration was slightly reduced, in terms of the incidence of each severity, with HCBD-treated animals showing mild (2 of 5), moderate (2 of 5), and marked (1 of 5) degeneration. Degeneration was not evident at any time point after day 3 post-dosing.

Images of the renal cortex in male Hanover Wistar rats treated with either vehicle (control) or 45 mg/kg hexachloro-1:3-butadiene (HCBD) and necropsied at 1 to 10 days post-dosing. A, Section from a control animal demonstrating the normal appearance of the renal cortex. B, Section from an animal treated with HCBD and necropsied at 24 hr post-dosing (Day 1), showing tubular degeneration with hypereosinophilia and loss of nuclear and cellular detail in the proximal renal tubules (*). C, Section from an HCBD-treated animal necropsied at day 2 post-dosing, illustrating evidence of degeneration (*) and focal areas of regeneration (†) with increased tubule cellularity and nuclear size. D, Section from an HCBD-treated animal necropsied at day 3 post-dosing; there are slight focal areas of degeneration (*) and marked regeneration (†) with increased
Regeneration of the S3 segment of the proximal tubule was identified as early as day 2 post-dosing with HCBD-treated animals showing moderate (1 of 5) and marked (4 of 5) evidence of tubular regeneration (Table 1; Figure 1). Regeneration peaked on day 4 and day 5 post-dosing with very marked regeneration present on both days in all HCBD-treated animals (6 of 6 and 5 of 5, respectively). Thereafter, the evidence of regeneration decreased and the tubules regained a generally normal morphologic appearance, with a minimal (2 of 6) degree of regeneration present at the end of the study (day 28 post-dosing). Histopathologic changes in the kidney and liver were not present in any control animals. Livers from HCBD-treated animals did not display any nephrotoxicant-related pathologic changes at any time point.
Urinary Biomarkers of Kidney Injury
There was a trend for increased urinary biomarker levels in HCBD-treated animals from day 1 until day 4 to day 7 post-dosing, depending on the particular biomarker concerned (Table 2; Figure 2). In particular, α-GST (Figure 2A) and GST Yb1 displayed peak urinary outputs on day 1, after which there was, in general, a gradual return to the values of the concurrent control animals by days 5/6. However, on day 5 post-dosing, urinary α-GST was statistically significantly decreased compared to concurrent controls. Urinary KIM-1 (Figure 2B) was significantly increased in HCBD animals from day 1 until day 7, with peak urinary levels on days 2, 3, and 4 (82.3-fold, 48.6-fold, and 83.8-fold increases, respectively). Clusterin (Figure 2C) and osteopontin (Figure 2D) and were also significantly increased in HCBD-dosed animals with peak concentrations recorded for both biomarkers on day 4 (6.5-fold and 6.6-fold increases, respectively). LCN-2 (Figure 2E) showed a statistically significant decrease in urinary levels on day 3 post-dosing (p ≤ .05), but the mean level in the matched control animals was also high at this time point. Urinary albumin output (Figure 2G) was significantly increased in HCBD-treated rats from day 1 to day 5 post-dosing, with the peak fold change recorded on day 1 (152.2-fold increase). Urinary total protein (Figure 2H) and urinary glucose (Figure 2F) levels were also significantly increased in HCBD-treated rats from day 1 until day 4 post-dosing. In contrast, urinary total protein and urinary albumin were significantly decreased in HCBD animals on day 6 and day 7, respectively.
Mean (SD) urinary outputs and serum concentrations of renal biomarkers in male Hanover Wistar rats treated with vehicle (control; blue bar) or hexachloro-1:3-butadiene (red bar) and necropsied at days 1, 2, 3, 4, 5, 6, 7 ,10, 14, and 28 post-dosing. *p < .05; **p < .01, ***p < .001. A, Urinary α-glutathione S-transferase. B, Urinary kidney injury molecule-1. C, Urinary clusterin. D, Urinary osteopontin. E, Urinary lipocalin-2. F, Uurinary glucose. G, Urinary albumin. H, Urinary total protein. I, Serum creatinine. J, Serum urea.
Serum Biomarkers
Of the traditional serum biochemistry markers (Table 2; Figure 2), only serum creatinine (Figure 2I) showed any statistically significant change in HCBD-dosed animals, with increased concentrations noted on day 1 and day 2 over concurrent controls (2.0-fold increases at both time points, respectively); however, considerable variability existed in serum creatinine levels on an individual animal basis. There was no significant increase in the mean values of serum urea (Figure 2J) in HCBD-treated animals at any time point, although some individual animals demonstrated clear increases above concurrent control animals.
Kidney Gene Expression
The single injection of 45 mg/kg HCBD resulted in significant upregulation of genes associated with xenobiotic metabolism (Table 3), with a trend toward increases on day 1 to day 3 post-dosing; this was evident in particular with NAD(P)H dehydrogenase, quinone 1 (NQO1) and with epoxide hydrolase 1 (microsomal). However, cytochrome P450 2C and cytochrome P450 1A1 messenger RNA (mRNA) were notable exceptions. Levels of cytochrome P450 2C were decreased from day 1 to day 5 and again on day 7 and day 10 post-dosing, and cytochrome P450 1A1 was decreased on day 5 and day 7.
Mean (SD) values for kidney gene expression (copy number [×103/5ng cDNA]) in male Hanover Wistar rats treated with vehicle (control; n = 3) or a single dose of 45 mg/kg hexachloro-1:3-butadiene (HCBD; n = 3) and necropsied at day 1 to day 28 post-dosing; data grouped by functional category.a
Note: cDNA = complementary DNA.
a At each time point, gene expression data from three HCBD-treated animals and three concurrent control animals (two control animals on day 14) were analyzed statistically; significant differences are presented, *p < .05, **p < .01, ***p < .001. Results for day 1 concurrent control animals are given; results for day 2 to day 28 concurrent control animals are not presented.
In genes involved in oxidative stress (Table 3), significant increases between HCBD-treated and concurrent control animals were present from day 1 to day 3 post-dosing, with the exception of glutamate-cysteine ligase, catalytic subunit (GCLC). This difference was evident, in particular, in the case of heme oxygenase (decycling) 1(HMOX1) and thioredoxin reductase 1. GCLC was downregulated on day 4 and day 5 and also on day 7 post-dosing.
In the functional category of inflammation, LCN-2 mRNA was upregulated from day 2 to day 5 post-dosing and also on days 7 and 14; tissue inhibitor of metalloproteinase-1 was upregulated on day 1 and on day 2 and again on day 4 and day 5 post-dosing (Table 3).
In the functional category of regeneration and repair (Table 3), gene transcription for all associated genes was significantly upregulated on day 1 post-dosing, with the exception of glycoprotein (transmembrane) nmb which was at control levels. In particular, KIM-1 mRNA expression was increased from day 1 to day 5 and on day 7 and day 10; annexin A7 (ANXA7) mRNA was upregulated from day 1 to day 4 post-dosing.
Discussion
Using urinary biomarkers and gene expression, the patterns of temporal response after acute proximal renal tubular injury have been investigated. Of the renal protein biomarkers examined, urinary levels of α-GST, albumin, glucose, KIM-1, osteopontin, and clusterin demonstrated significant increases in comparison with the matched control animals.
The administration of a single dose of HCBD induced marked renal tubular injury (Figure 1). Of the renal urinary biomarkers that were closely associated with proximal tubular damage, the GST group of enzymes and urinary albumin appeared most sensitive. In particular, α-GST levels paralleled the early histopathologic changes of degeneration, reflecting the role of the isoenzyme as a marker of increased plasma membrane permeability and cellular leakage (Harrison et al. 1989). As in previous work (Swain et al. 2011), urinary output of α-GST was markedly elevated in HCBD-treated animals when compared to matched control animals on day 1, and the levels remained significantly increased until day 4 (Table 2). Urinary α-GST was also shown to be a sensitive renal biomarker in a cisplatin model of proximal tubular injury, with significant increases in urinary outputs on days 3 and 5 post-dosing (Gautier et al. 2010); urinary α-GST was also demonstrated to be superior to urea, creatinine, and N-acetylglucosaminidase for the diagnosis of proximal tubular degeneration/necrosis (Harpur et al. 2011). Recent work by Pinches et al., using a cisplatin model of renal injury, presents data of particular interest to the present investigation (Pinches et al. 2012a; 2012b; 2012c). In Pinches et al. (2012a), it was demonstrated that increases in α-GST may be influenced by the sex of the animals; it was reported that increases in α-GST were limited to male rats, rather than female animals, and it was also concluded that α-GST did not perform any better than serum urea or creatinine using receiver–operating characteristic curve analysis (ROC analysis). In the present study, after the initial injury on day 1, the kidney underwent marked regeneration (Table 1), and the urinary output of α-GST decreased (Figure 2A). However, there was good concordance between an increased urinary output of α-GST and the period of tubular degeneration identified microscopically (days 1–3). There are several subclasses of GSTs and these include α-GST, which is located in the epithelial cells of the proximal renal tubules, and GST Yb1, which is found in the epithelial cells of the distal renal tubules (Rozell et al. 1993). Urinary output of GST Yb1 was also significantly increased from day 1 to day 4, and the changes generally paralleled those of α-GST. However, given the marked elevation of α-GST output, it was considered that the increase in GST Yb1 may have reflected a lack of antibody specificity and may not have been the result of epithelial damage in the distal tubules. α-GST is known to cross react with the GST Yb1 assay (by 7.22%, MSD, Argutus AKI Test, Assay Qualified Kit, 2011). Swain et al. (2012) considered that apparent elevations of urinary GST Yb1 output could be compromised in the presence of markedly elevated α-GST excretion, and results for GST Yb1 in the present study should therefore be treated with some caution. Furthermore, no evidence of histopathologic injury was noted in the distal tubules. This observation is in agreement with other workers who noted increases in GST Yb1 (also referred to as µ-GST) but with no accompanying microscopic lesion in the distal tubule, in the presence of a predominant proximal tubular injury and concomitant marked urinary release of α-GST (Harpur et al. 2011; Yang et al. 2007).
Glucose and albumin, traditionally regarded as useful urinary biomarkers for renal injury, demonstrated significantly increased levels on day 1, with urinary outputs remaining increased to day 4 and day 5 post-dosing, respectively (Table 2; Figure 2F, G), while serum creatinine returned to concurrent control levels by day 3, demonstrating the relative insensitivity of this biomarker to functional nephron mass. The usefulness of urinary albumin as a biomarker in toxicologic pathology studies is reported to be influenced by factors such as age and sex as well as by the strain of rat used (Cessac et al. 1993; Ishola et al. 2006; Remuzzi et al. 1992). However, despite these possible shortcomings, in the present HCBD model the measurement of urinary albumin levels was found to be sensitive and specific for the early detection of renal injury. An increased urinary albumin level may have reflected dysfunction in the retrieval pathway for filtered albumin in the proximal tubules, rather than increased glomerular leakage (Greive et al. 2001). No evidence of glomerular damage was evident on light microscopic examination of HCBD-treated animals in the present study. The increase in urinary glucose may also be associated with the severity of tubular injury. When rats received low doses of HCBD (≤10 mg/kg), urinary glucose was not significantly increased (Swain et al. 2012). Recently Pinches et al. (2012a) documented similar findings and speculated that the association of increased urinary glucose with the degree of tubular injury may reflect the loss of functional reserve with more severe damage.
Urinary α-GST and urinary albumin appeared to correlate well with the initial histopathologic evidence of epithelial cell degeneration. KIM-1 by comparison appeared to be both an early marker of tubular damage (significant fold increases in both gene and protein product [Tables 2 and 3] on day 1) and subsequent raised levels were considered to reflect regeneration and repair. The experimental design of the present investigation allowed the temporal response of KIM-1 (gene expression and protein product) following the initial insult to be closely charted. Peak gene expression data (Table 3) for KIM-1 on days 2 and 3 preceded the peak in urinary KIM-1 protein output (day 4), allowing time for KIM-1 protein to be expressed on the surface of renal epithelial cells, where it is reported to be involved in the phagocytosis of apoptotic cells present in the renal tubular lumen (Bonventre and Yang 2010), in essence turning epithelial cells into “semiprofessional phagocytes” (Ichimura et al. 2008). The findings of the present study (Tables 2 and 3) support the suggested use of urinary KIM-1 protein as a biomarker for ischemic–reperfusion injury of proximal renal epithelial cells, as the protein is upregulated during epithelial proliferation and regeneration (Ichimura et al. 1998). Also, the return of the epithelium to a normal morphology was paralleled by declines in both urinary KIM-1 protein output (Table 2) and KIM-1 gene copy number (Table 3). KIM-1 has also been reported to be expressed on the apical surface of proximal tubule epithelial cells in rats exposed to several nephrotoxicants (chromium, mercury, and gentamicin; Zhang et al. 2008).
In the present study, the earliest increases in KIM-1 were recorded at 24 hr post-dosing, the first time point examined (protein product and gene expression). Other investigators have demonstrated increases in urinary KIM-1 as early as 3 hr post-insult (Vaidya et al. 2010). The present findings agree with recently published studies looking at KIM-1 gene expression in rats treated with HCBD, potassium dichromate, or cephaloridine (Chiusolo et al. 2010), where KIM-1 gene expression was upregulated 48 hours after exposure, regardless of the nephrotoxicant used, but more dependent upon the target cell damaged within the nephron. Similarly, other workers have noted increases in urinary KIM-1 employing different nephrotoxicants, S-(1,1,2,2-tetrafluoroethyl)-L-cysteine (TFEC), cisplatin, and folic acid to induce renal tubular injury by a variety of pathological mechanisms (Ichimura et al. 2004; Pinches et al. 2012a). These last studies demonstrated that KIM-1 upregulation was not specific to any single nephrotoxic agent. It is considered that an examination of both urinary α-GST and KIM-1 protein together may give an overall assessment of the functional status of proximal renal tubules following a toxicologic insult, providing evidence of degeneration and/or regeneration.
Significant increases in urinary osteopontin levels were not recorded until day 2 post-dosing (Table 2). However, after this time point, osteopontin remained increased until day 5, with peak changes evident on day 4. This temporal pattern of response coincided with the earliest evidence of epithelial regeneration in the proximal tubules on light microscopy. It appeared that while osteopontin as a biomarker was not as sensitive as KIM-1 in detecting very early regenerative changes in the proximal renal tubular epithelial cells, osteopontin levels did closely parallel the microscopic evidence of regeneration and repair. Xie et al. (2001) also found an association between osteopontin levels and the proliferation and regeneration of tubular epithelial cells in a rat model of gentamicin-induced tubular necrosis. Wang et al. (2008), using 4 nephrotoxicants (gentamicin, bacitracin, vancomycin, and cisplatin), noted that gene expression for osteopontin was upregulated in animals treated with each agent. The highest fold changes in osteopontin levels were seen after treatment with bacitracin, cisplatin, and vancomycin. The changes in osteopontin levels displayed a temporal relationship following compound administration, with increased biomarker values evident on day 5 post-treatment. Pinches et al. (2012a) also noted a temporal association of osteopontin with proximal renal tubular injury, in rats receiving a single injection of cisplatin. Osteopontin may also be upregulated in both the proximal and distal renal tubular epithelial cells in ischemia–reperfusion injury models, and osteopontin staining in the proximal tubules has been reported to be closely associated with morphologic regeneration (Persy et al. 1999). In the present study, it is considered that urinary osteopontin was likely to have been derived from proximal renal tubules rather than distal tubules, as there was no histopathologic evidence of distal renal epithelial pathology.
Urinary output of clusterin also demonstrated peak values at a time of marked tubular regeneration on day 4/5 post-dosing. This pattern of response may reflect the role of clusterin in cellular protection, cell aggregation, and attachment (Rosenberg and Silkensen 1995). Clusterin levels have been shown in other studies to correlate with severity grading of proximal tubular injury (Dieterle et al. 2010) and other investigators have noted increased urinary outputs of clusterin on day 3 and day 5 posttreatment in Han-Wistar and Sprague-Dawley rats treated with 3 mg/kg cisplatin (Gautier et al. 2010). Clusterin is not specific to any particular site in the nephron (Hidaka et al. 2002) although, like osteopontin, in the present study it was considered possible that the protein originated from proximal renal tubular epithelium.
As in earlier investigations (Swain et al. 2012) using the same animal model, urinary output of LCN-2 protein was not significantly increased in HCBD-treated animals (Table 2). However, it was of interest that with gene expression analysis (Table 3), LCN-2 mRNA showed significant upregulation from day 2 to day 5 post-dosing. It is considered possible that this finding may have reflected assay insensitivity for the protein as other workers have reported urinary LCN-2 to be an early indicator of acute kidney injury in both a mouse model of cisplatin nephrotoxicity and a rat model of ischemia–reperfusion injury (Mishra et al. 2003).
The morphologic evidence of proximal tubular injury was supported by the upregulation of several genes associated with oxidative stress and xenobiotic metabolism (Table 3), thereby providing surrogate evidence for exposure to HCBD and the duration of an oxidative stress response. The changes in individual genes on day 1 (i.e., 24 hr post-dosing) noted in the present study were comparable with gene expression changes observed previously at a dose of 45 mg/kg (Swain et al. 2012). In particular, attention is drawn to the increased expression of NAD(P)H dehydrogenase, quinone 1 (NQO1), and heme oxygenase (decycling) 1 (HMOX1). NQO1 is an enzyme induced by oxidative stress (Nioi and Hayes 2004) functioning as an antioxidant and may be involved in detoxifying carcinogens and stabilizing the tumor suppressor gene P53 (Ross et al. 2000). Using NADH or NADPH as a reducing cofactor, NQO1 catalyzes the two electron reduction of quinines to hydroquinones, thereby limiting the formation of semiquinone radicals and the generation of reactive oxygen species (Gong, Gutala, and Jaiswal 2008; Ross 2004). Recently, increased upregulation of NQO1 has been demonstrated in rats subjected to unilateral urethral obstruction for 7 days (Rinaldi Tosi et al. 2011). Interestingly, these last authors also found levels of NQO1 were decreased after 10 to 14 days of urethral obstruction, and it was considered that this may impair the ability of the kidney to counteract prolonged obstruction-induced oxidative stress (Rinaldi Tosi et al. 2011). The expression of NQO1 mRNA and the protein product also increased in rat renal tubular cells when exposed to 1,2-dithiole-3-thione (Zhu et al. 2008). In that particular study, glutathione reductase and heme oxygenase (gene expression and protein product, respectively) were also found to be increased; however, in contrast to the present work, glutamate-cysteine ligase, catalytic subunit (GCLC) was upregulated (Zhu et al. 2008). In the present experiment, NQO1 mRNA was found to be upregulated to approximately 25-fold, and in a previous experiment, dose-related upregulation was seen starting from a dose of HCBD of 5 mg/kg (Swain et al. 2012). HMOX1 is present in the tubules of the rat kidney (da Silva et al. 2001) and plays a critical role in protecting the kidney against oxidative and inflammatory stress by degrading heme to produce bilirubin and carbon monoxide, both of which have anti-inflammatory effects (Abraham and Kappas 2005). In earlier studies (Swain et al. 2012), it was shown that HMOX1 was upregulated, even when very-low-dose levels of HCBD (5 mg/kg) were administered.
The downregulation of cytochrome P450 2C mRNA from day 1 to day 5 post-dosing (Table 3) was consistent with previous results (Swain et al. 2012). Cytochrome P450 2C may also be inhibited by doxorubicin administration in the male rat kidney (Zordoky et al. 2011).
Other findings of interest in the present study included some evidence (although not statistically significant) of increased water intake on day 1. This was attributed to the diuresis effect of glycosuria (Table 2). Increased concentrations of urinary glucose have been associated with acute tubular necrosis and have been reported previously in HCBD-treated rats (Kirby and Bach 1995; Swain et al. 2011, 2012).
In general, the urinary biomarkers α-GST, KIM-1, and to a lesser degree osteopontin and clusterin provided additional and complementary information to the traditional urinary markers of tubular function (protein and glucose), helping to define the time period of proximal tubular degeneration followed by functional and structural recovery following acute exposure to HCBD. As in a previous study (Swain et al. 2012), serum concentrations of creatinine did show a significant increase on days 1 and 2. However, fold changes over concurrent controls for serum creatinine were much lower when compared to the urinary biomarkers KIM-1, α-GST, glucose, or albumin.
Finally, a small proportion of animals (6 out of a total of 60) did not respond to HCBD administered by the ip route. This method of compound administration has been associated with an 11% to 20% failure rate in the hands of other investigators (Lewis, Kunz, and Bell 1966). The subcutaneous tissues, retroperitoneum, stomach, or intestine may be erroneously injected. In a recent article evaluating novel biomarkers in rats treated with cisplatin, the removal of 5 “nonresponders” was reported, due to possible intraintestinal injection (Gautier et al. 2010). In the present study, a careful examination of the findings from the 6 individual animals showed no clear evidence of injury to the proximal tubules; results for histopathology, α-GST, KIM-1, and albumin are presented in Table 4. A comparable situation involving the incorrect dosing of HCBD administered by the ip route was encountered in an earlier study (Swain et al. 2012); however, in this experiment, 2 of 42 animals dosed with HCBD showed histologic, urine biochemistry and gene expression findings that indicated a partial response to treatment. In addition, a similar case of ip mis-dosing was identified in initial studies with HCBD (Swain et al. 2011).
Histopathology and urinary biochemistry findings for six individual Hanover Wistar rats (nonresponders) treated with a single dose of 45 mg/kg hexachloro-1:3 butadiene (HCBD) and examined at day 2 post-dosing (animal 7), day 3 (animal 11), day 5 (animal 12), day 6 (animal 7 and 11), and day 7 (animal 12)a
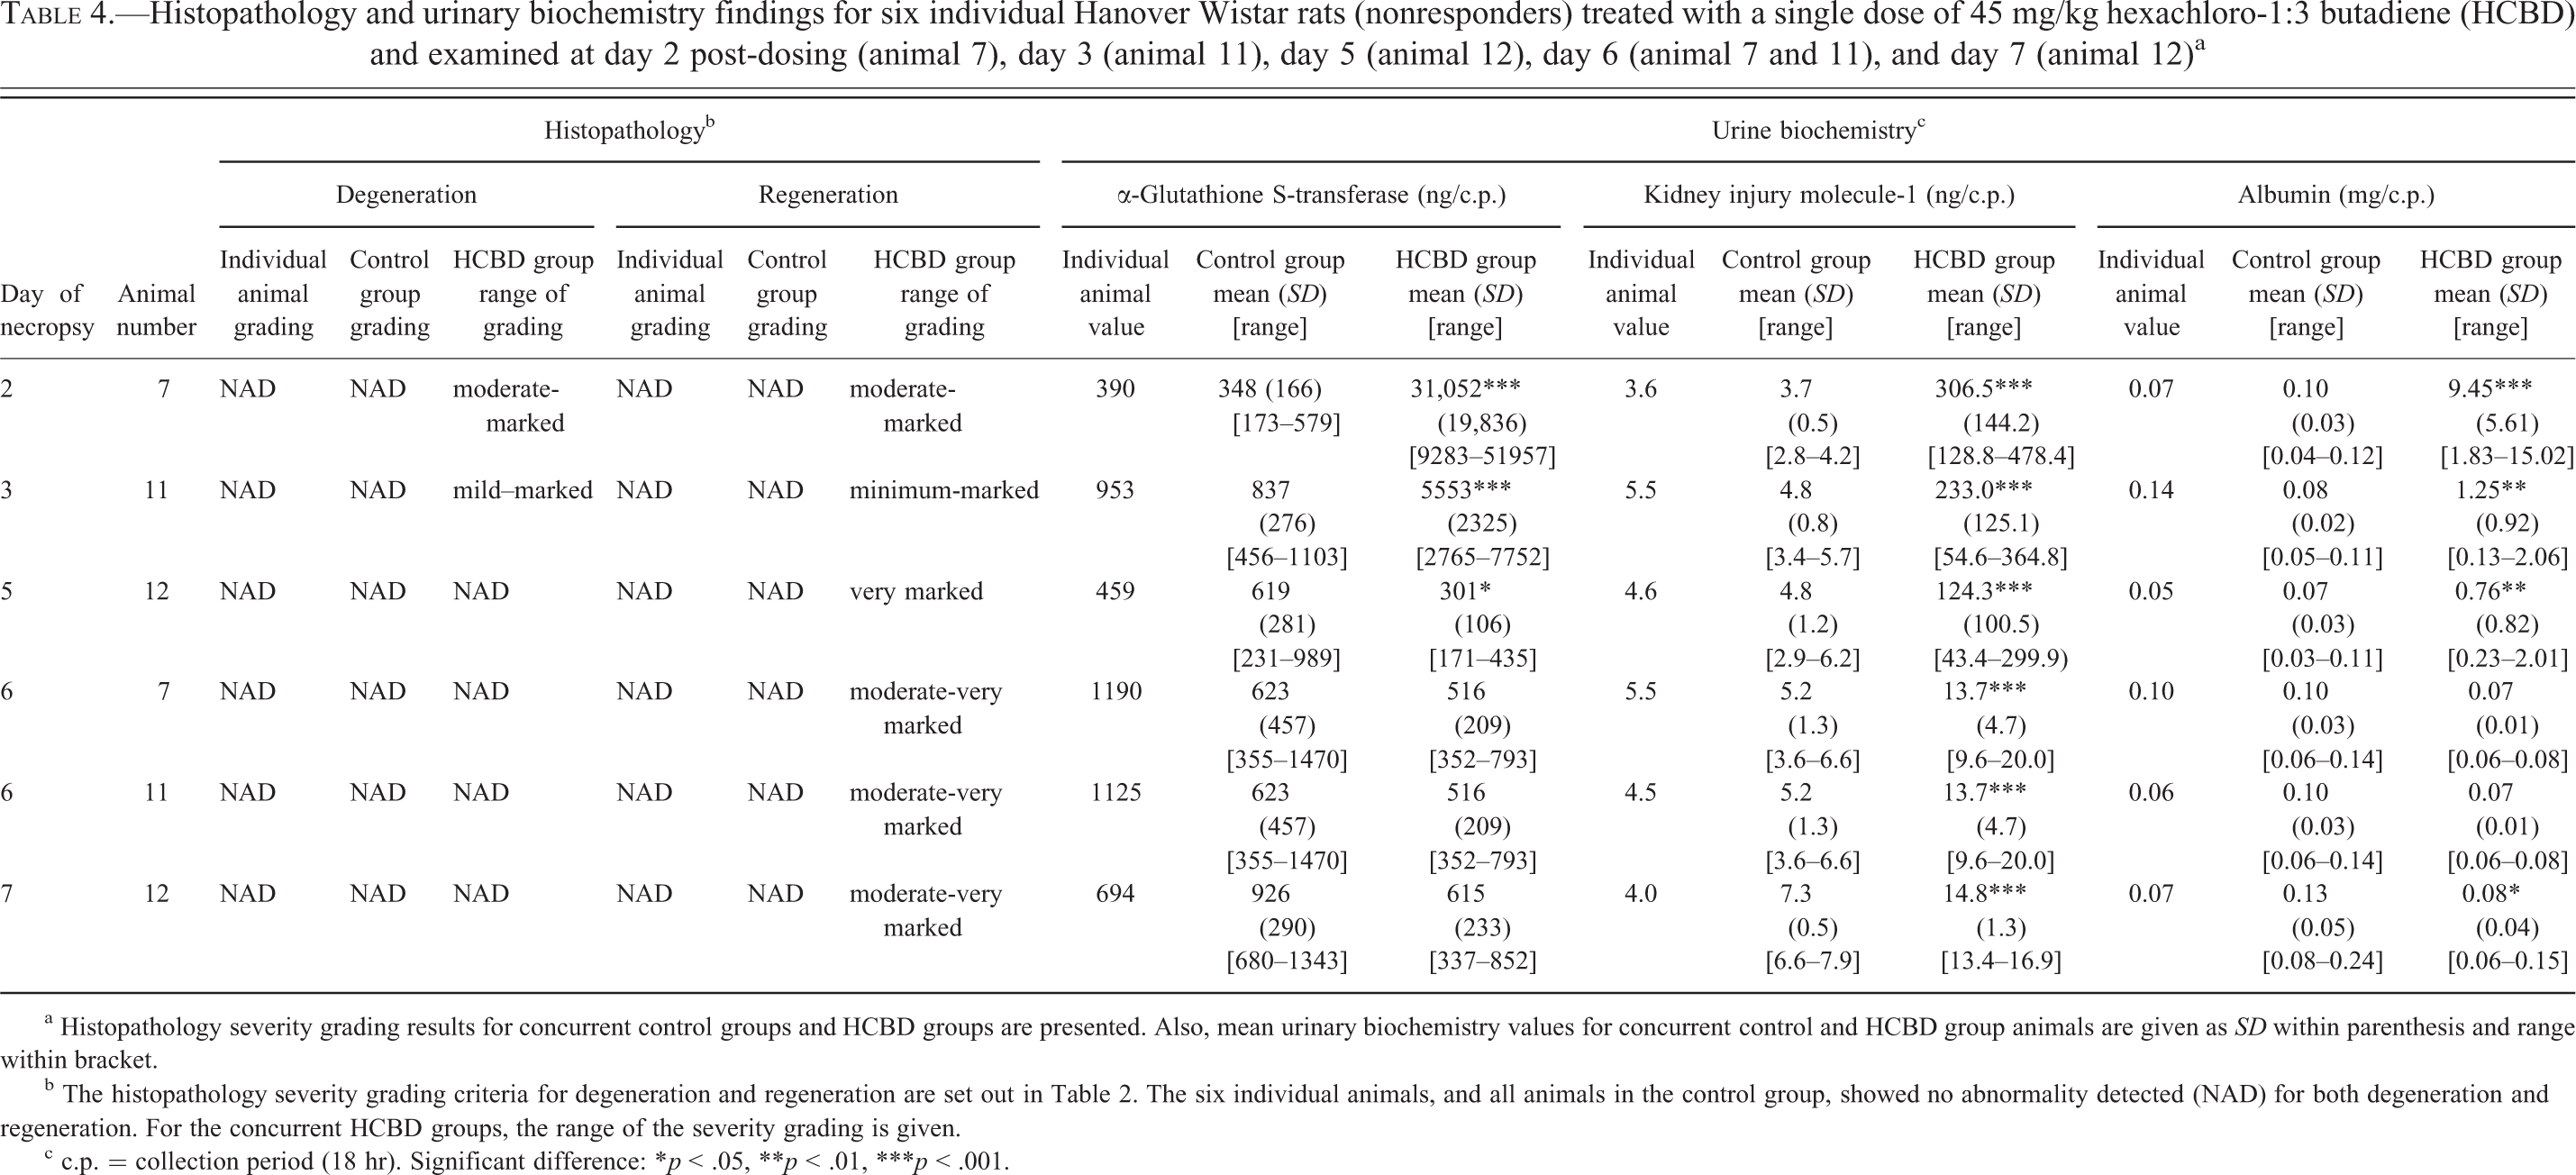
a Histopathology severity grading results for concurrent control groups and HCBD groups are presented. Also, mean urinary biochemistry values for concurrent control and HCBD group animals are given as SD within parenthesis and range within bracket.
b The histopathology severity grading criteria for degeneration and regeneration are set out in Table 2. The six individual animals, and all animals in the control group, showed no abnormality detected (NAD) for both degeneration and regeneration. For the concurrent HCBD groups, the range of the severity grading is given.
c c.p. = collection period (18 hr). Significant difference: *p < .05, **p < .01, ***p < .001.
In the present study, the temporal patterns of selected urinary renal biomarkers have been associated with the onset of acute proximal tubular injury and subsequent recovery, in rats given a single 45 mg/kg dose of HCBD. Urinary α-GST, albumin, KIM-1, glucose, clusterin, and osteopontin appear to be the most reliable biomarkers in this particular animal model of proximal tubular injury, degeneration, and functional return. These findings are in broad agreement with those of Ozer et al. (2010) who monitored the reversibility of carbapenem A- and gentamicin-induced renal injury in the rat. They noted that α-GST appeared to be an excellent early toxicity biomarker for epithelial cell necrosis. KIM-1 and clusterin levels persist during regeneration and appear to reflect the triggering and continuation of the repair process, and albumin elevations indicated early loss of tubular function which is seen after tubular epithelial cell necrosis and degeneration. In the present study, proximal tubular damage was also associated with the upregulation of selected genes, in particular NQO1 and HMOX1, in comparison with concurrent controls. Proximal tubular recovery was associated with changes in the urinary outputs of KIM-1, and to a lesser degree, osteopontin, and the upregulation of KIM-1 and ANXA7 gene expression (Table 3).
The present work follows two previous studies on renal biomarker response using an HCBD model of proximal tubular injury (Swain et al. 2011, 2012). The aims of the work have been to evaluate emerging urinary renal biomarkers of proximal tubular injury and to correlate temporal changes in biomarker levels (i.e., onset, duration, magnitude, and the recovery of the response) and biomarker sensitivity with minimal to marked changes in kidney pathology. No single renal biomarker can be recommended in the assessment of proximal tubule injury. However, by using a panel of biomarkers, investigators can gain a more detailed understanding of the changes present within the kidney, in terms of both the extent of the acute injury and the process of functional and structural recovery. It is therefore hoped that the more recent renal biomarkers will be utilized more extensively in assessing renal function and integrity in future toxicological studies and supplement, if not replace, the more traditionally used urinary biomarkers for the assessment of renal tubular pathology.
Footnotes
Acknowledgments
The authors would like to thank Mrs. Sonal Patel, Dr. Cindy O’Malley, and Ms. Clare Stamp (Clinical Pathology; GSK) for sample analysis and Mrs. Karen Cartwright (Histotechnology; GSK) for tissue processing.
The author(s) declared no potential conflicts of interest with respect to the research, authorship, and/or publication of this article.
The author(s) received no financial support for the research, authorship, and/or publication of this article.