
Abstract
Rodent progressive cardiomyopathy (PCM) encompasses a constellation of microscopic findings commonly seen as a spontaneous background change in rat and mouse hearts. Primary histologic features of PCM include varying degrees of cardiomyocyte degeneration/necrosis, mononuclear cell infiltration, and fibrosis. Mineralization can also occur. Cardiotoxicity may increase the incidence and severity of PCM, and toxicity-related morphologic changes can overlap with those of PCM. Consequently, sensitive and consistent detection and quantification of PCM features are needed to help differentiate spontaneous from test article-related findings. To address this, we developed a computer-assisted image analysis algorithm, facilitated by a fully convolutional network deep learning technique, to detect and quantify the microscopic features of PCM (degeneration/necrosis, fibrosis, mononuclear cell infiltration, mineralization) in rat heart histologic sections. The trained algorithm achieved high values for accuracy, intersection over union, and dice coefficient for each feature. Further, there was a strong positive correlation between the percentage area of the heart predicted to have PCM lesions by the algorithm and the median severity grade assigned by a panel of veterinary toxicologic pathologists following light microscopic evaluation. By providing objective and sensitive quantification of the microscopic features of PCM, deep learning algorithms could assist pathologists in discerning cardiotoxicity-associated changes.
Keywords
Introduction
Progressive cardiomyopathy (PCM) is a common background finding in rodents that typically increases in incidence and severity with age. 1,2 It is particularly common in rats, with a greater incidence in males. 1,3 In some strains, such as Sprague Dawley, PCM can be identified in 100% of rats by 3 to 4 months of age. 1,4 Primary histologic features of PCM in rodents consist of cardiomyocyte degeneration and/or necrosis, inflammatory cell infiltration that is predominantly mononuclear, fibrosis, and mineralization. Progressive cardiomyopathy can first be recognized as small, discrete foci of myocardial degeneration and/or necrosis accompanied by inflammatory cell infiltration. 3,4 –6 In later stages, necrosis and inflammation are replaced by varying degrees of fibrosis. 3,5 Mineralization, as well as cartilaginous or osseous metaplasia, may also be present. 2,3 Different temporal stages may occur simultaneously and any location in the heart may be affected. 4,5
Importantly, cardiotoxicity can result in an increase in the incidence and severity of PCM, and toxicity-related morphologic changes can overlap with or mimic those of PCM. 1,5 Consequently, there is a need for consistent and sensitive detection as well as quantification of PCM-related changes to help differentiate spontaneous from test article-related findings. Recent work by Hailey et al 6,7 has shown that pathologists vary in their diagnostic criteria, terminology, and severity grading approaches with regard to PCM. Application of harmonized diagnostic criteria does increase concordance among pathologists. 7 Yet challenges remain in establishing and consistently applying severity grading criteria. The spectrum of lesions and temporal changes that characterize PCM also presents a challenge for creating a cohesive approach to diagnosing and grading among pathologists. The emergence of advanced image analysis capabilities, facilitated by deep learning approaches, could provide a method to meet the challenges of objectively quantifying the histologic features of PCM in a sensitive and consistent manner across studies.
Deep learning is a form of artificial intelligence (AI) in which raw data are analyzed via multiple layers of artificial neural networks to achieve classified output data from highly complex data sets. The process is highly adaptable to a variety of applications because a human engineer is not required to design every layer of the analysis procedure and the machine self-learns as new data are input. 8 In recent years, deep learning approaches have enabled major advancements in the area of image analysis. 8,9 Multiple studies have demonstrated the utility and advantages of applying deep learning approaches to histologic image analysis in a diagnostic setting. 9 –13 Image analysis algorithms have been designed to classify and grade histologic sections of tumors with an accuracy on par with a trained anatomic pathologist. 14,15 Furthermore, there is evidence that trained experts working in conjunction with such algorithms can achieve greater accuracy than either the expert or the algorithm working alone. 16,17
We hypothesized that automated image analysis, facilitated by deep learning, would provide accurate and precise identification and quantification of PCM histologic features in rats. A supervised deep learning strategy was used to develop an algorithm for detecting and quantifying the major features of PCM: cardiomyocyte degeneration/necrosis, mononuclear cell infiltration (MNC), fibrosis, and mineralization. By providing a method to objectively quantify spontaneous background histologic changes, this algorithm can be an aid to pathologists in discerning cardiotoxicity-associated changes.
Materials and Methods
Case Selection
The National Toxicology Program database 18 was searched for diagnoses of cardiomyopathy in the heart among control and treated, male and female Sprague Dawley (Hsd: Sprague Dawley SD) rats from any length study. Rats in which the heart had been concurrently diagnosed with significant lesions (such as neoplasms) were excluded. In addition, a subset of rats fitting the same criteria but lacking a diagnosis of cardiomyopathy was included. The hematoxylin and eosin (H&E) stained slides were obtained from archival storage.
Whole Slide Imaging
Prior to scanning, slides were checked for quality and defects. Slides with double thickness or insufficient mounting media affecting the tissue were rejected from the scanning process. Whole slide images (WSIs) were captured at 40× magnification on either an Aperio AT Turbo (Leica Biosystems) or a Hamamatsu NanoZoomer S360 (Hamamatsu). White balance and area selection procedures were performed as needed. The WSI files were reviewed for quality (focus and complete capture of heart tissue). Failed scans were removed and recaptured.
Algorithm Training
The performance of the algorithm was evaluated on the WSIs acquired as above. The data set was divided into 2 groups: training and validation. The training data set consisted of 300 WSIs (Supplemental Table 1). An initial set of 20 WSIs was annotated by a board-certified veterinary pathologist for the histological parameters of PCM. The 300 WSIs in the training data set were annotated by an expert marker based on the pathologist’s sample annotations. During training, the WSIs were subdivided into tiles of size 512 × 512 pixels. A deep neural network model was trained on these tiles to segment or identify the histological parameters of cardiomyocyte necrosis, fibrosis, mineralization, and MNC. Different magnifications were used for each parameter, based on its size, context, and appearance. Parameter wise tiles were extracted from WSI at the desired magnification. These tiles were divided into training and validation sets, keeping a 90:10 ratio, respectively. The training set and validation set were mutually exclusive; tiles used for training were not used for validation and vice versa. Table 1 shows the training and validation data sets, with the magnification used for the different parameters. A separate deep learning model was trained to identify blood vessels, red blood cells (RBCs), and the surrounding perivascular tissue region. These regions were subtracted from the prediction of the first model during postprocessing to eliminate false positives. This was followed by morphological operations, such as dilation, to filter outliers. Figure 1 illustrates the algorithm pipeline. During training, output WSIs were reviewed by a board-certified pathologist to identify false positive and false negative segmentation areas. During training, batch normalization and categorical cross-entropy loss function were used.
Training and Validation Data Sets.
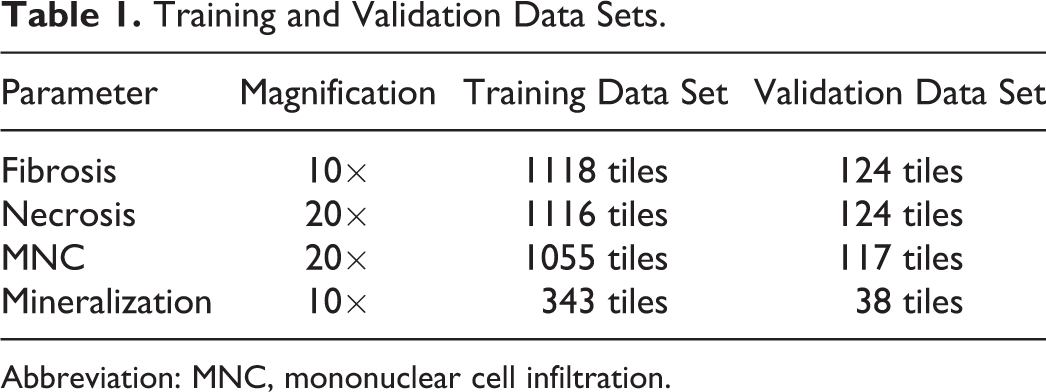
Abbreviation: MNC, mononuclear cell infiltration.
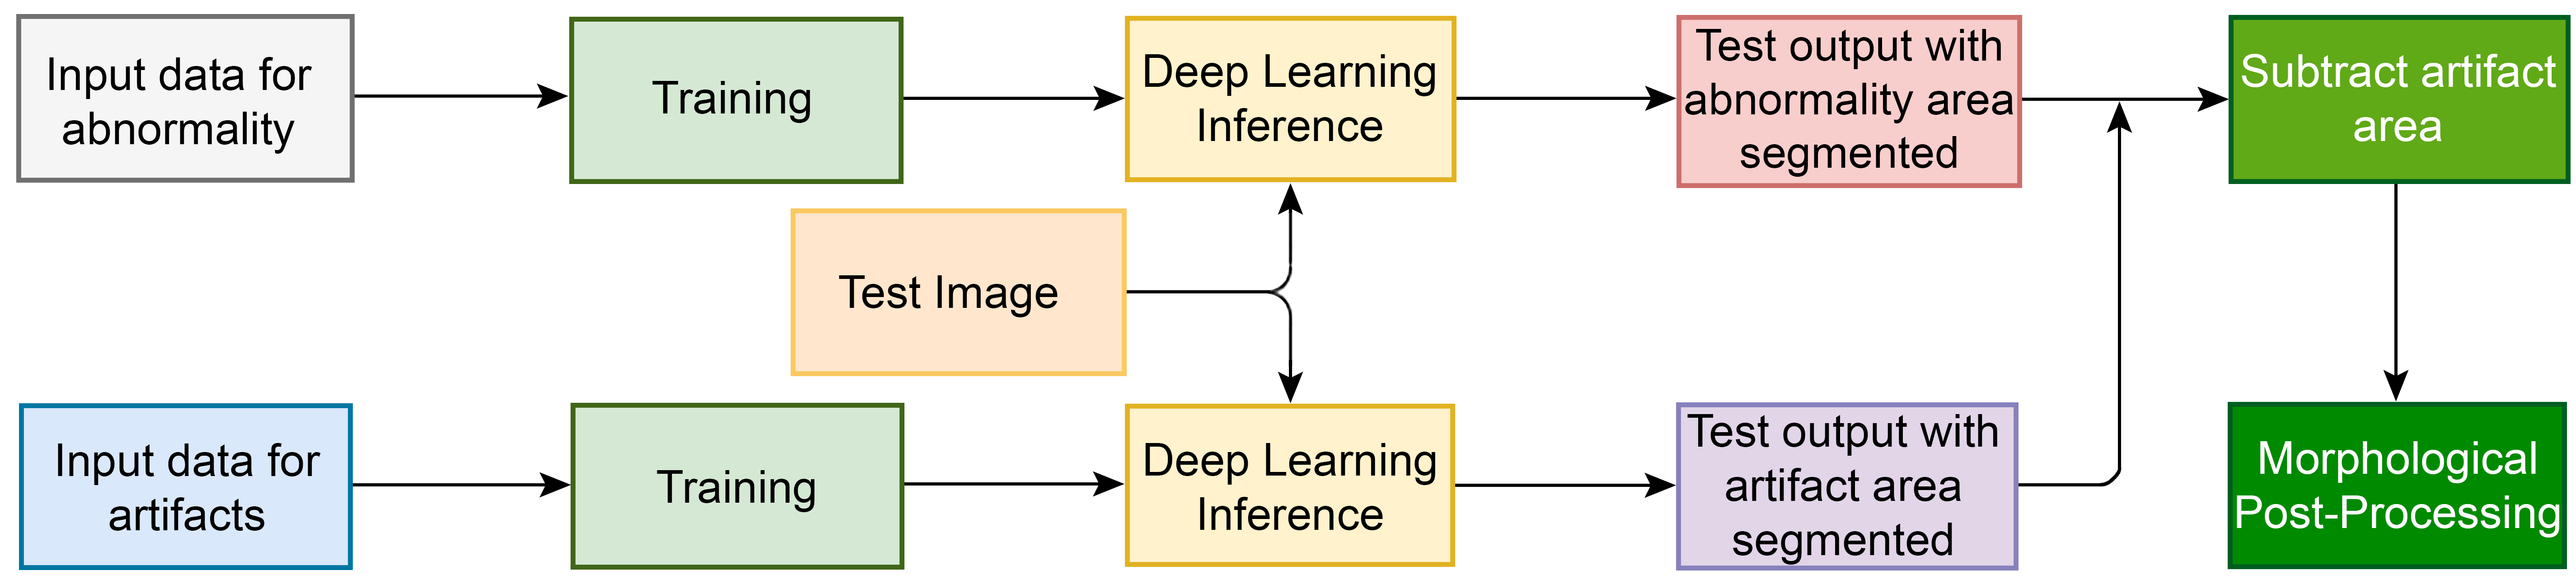
Schematic of the algorithm analysis and output pipelines. Input data consisted of WSI subdivided into tiles. In the upper pipeline (abnormality pipeline), a deep neural network model was trained on the tiles to identify PCM-related abnormalities of necrosis, fibrosis, MNC, and mineralization. In the lower pipeline (artifact pipeline), a separate deep neural network was trained to identify blood vessels, RBCs, and perivascular tissue region. These segmented “artifact” regions were subtracted from the prediction of the upper model during postprocessing to eliminate false positives. MNC indicates mononuclear cell infiltration; PCM, progressive cardiomyopathy; RBCs, red blood cells; WSI, whole slide image.
Network Architecture
This work employed fully convolutional network (FCN) 8s-Residual Net (ResNet) 50 architecture which adopted an FCN deep learning technique, 19 FCN8s with ResNet50 convolution backbone. 20 The network used in this work consisted of 4 stage encoding and 4 stage decoding architecture (Supplemental Figure 1). To implement residual learning, the output of each stage of the encoding branch was added to the input of the analogous stage of the decoding branch and the element wise sum was fed into convolution layers for that decoding branch.
Implementation Details
The segmentation network was implemented using Caffe. 21 Whole slide images were normalized by subtracting their mean and dividing by the standard deviation. While training, Adam optimizer 22 was used with a learning rate of 0.00001 with an NVIDIA Tesla P100 GPU (16 GB V-RAM) for training and inference. A python code was used to generate segmentation metrics for accuracy, intersection over union (IOU), and dice coefficient.
Evaluation of Test Cohort
A set of 300 H&E stained slides containing heart sections meeting the case selection criteria were chosen as a test cohort. Only control rats were used in the test cohort. The chosen sections represented the spectrum of cardiomyopathy-associated histologic changes and a range of severities. Five veterinary pathologists independently evaluated the same set of test cohort glass slides. For each slide, the pathologists were instructed to assign one of the following diagnoses: no abnormalities, PCM, PCM with >80% fibrosis, and other. For diagnoses of PCM/PCM with >80% fibrosis, pathologists were asked to provide a grade using criteria modified from Hailey et al 7 : grade 1, aggregate lesion size <45% field of view (FOV) for 40× objective; grade 2, aggregate lesion size ≥45% FOV for 40× objective and <5% of the heart section; grade 3, aggregate lesion size ≥5% but <25% of the heart section; grade 4, aggregate lesion size ≥25% but <50% of the heart section; and grade 5, aggregate lesion size ≥50% of the heart section. The test cohort glass slides were scanned to WSIs as above and evaluated by the trained image analysis algorithm. For algorithm testing, the WSIs were divided into tiles as above. Inference was performed on each of the tiles using the trained model. The tiles were then stitched back together to form the WSI with abnormality area segmented (Figure 2). For each parameter, output was quantified as a percentage of the total heart section area.
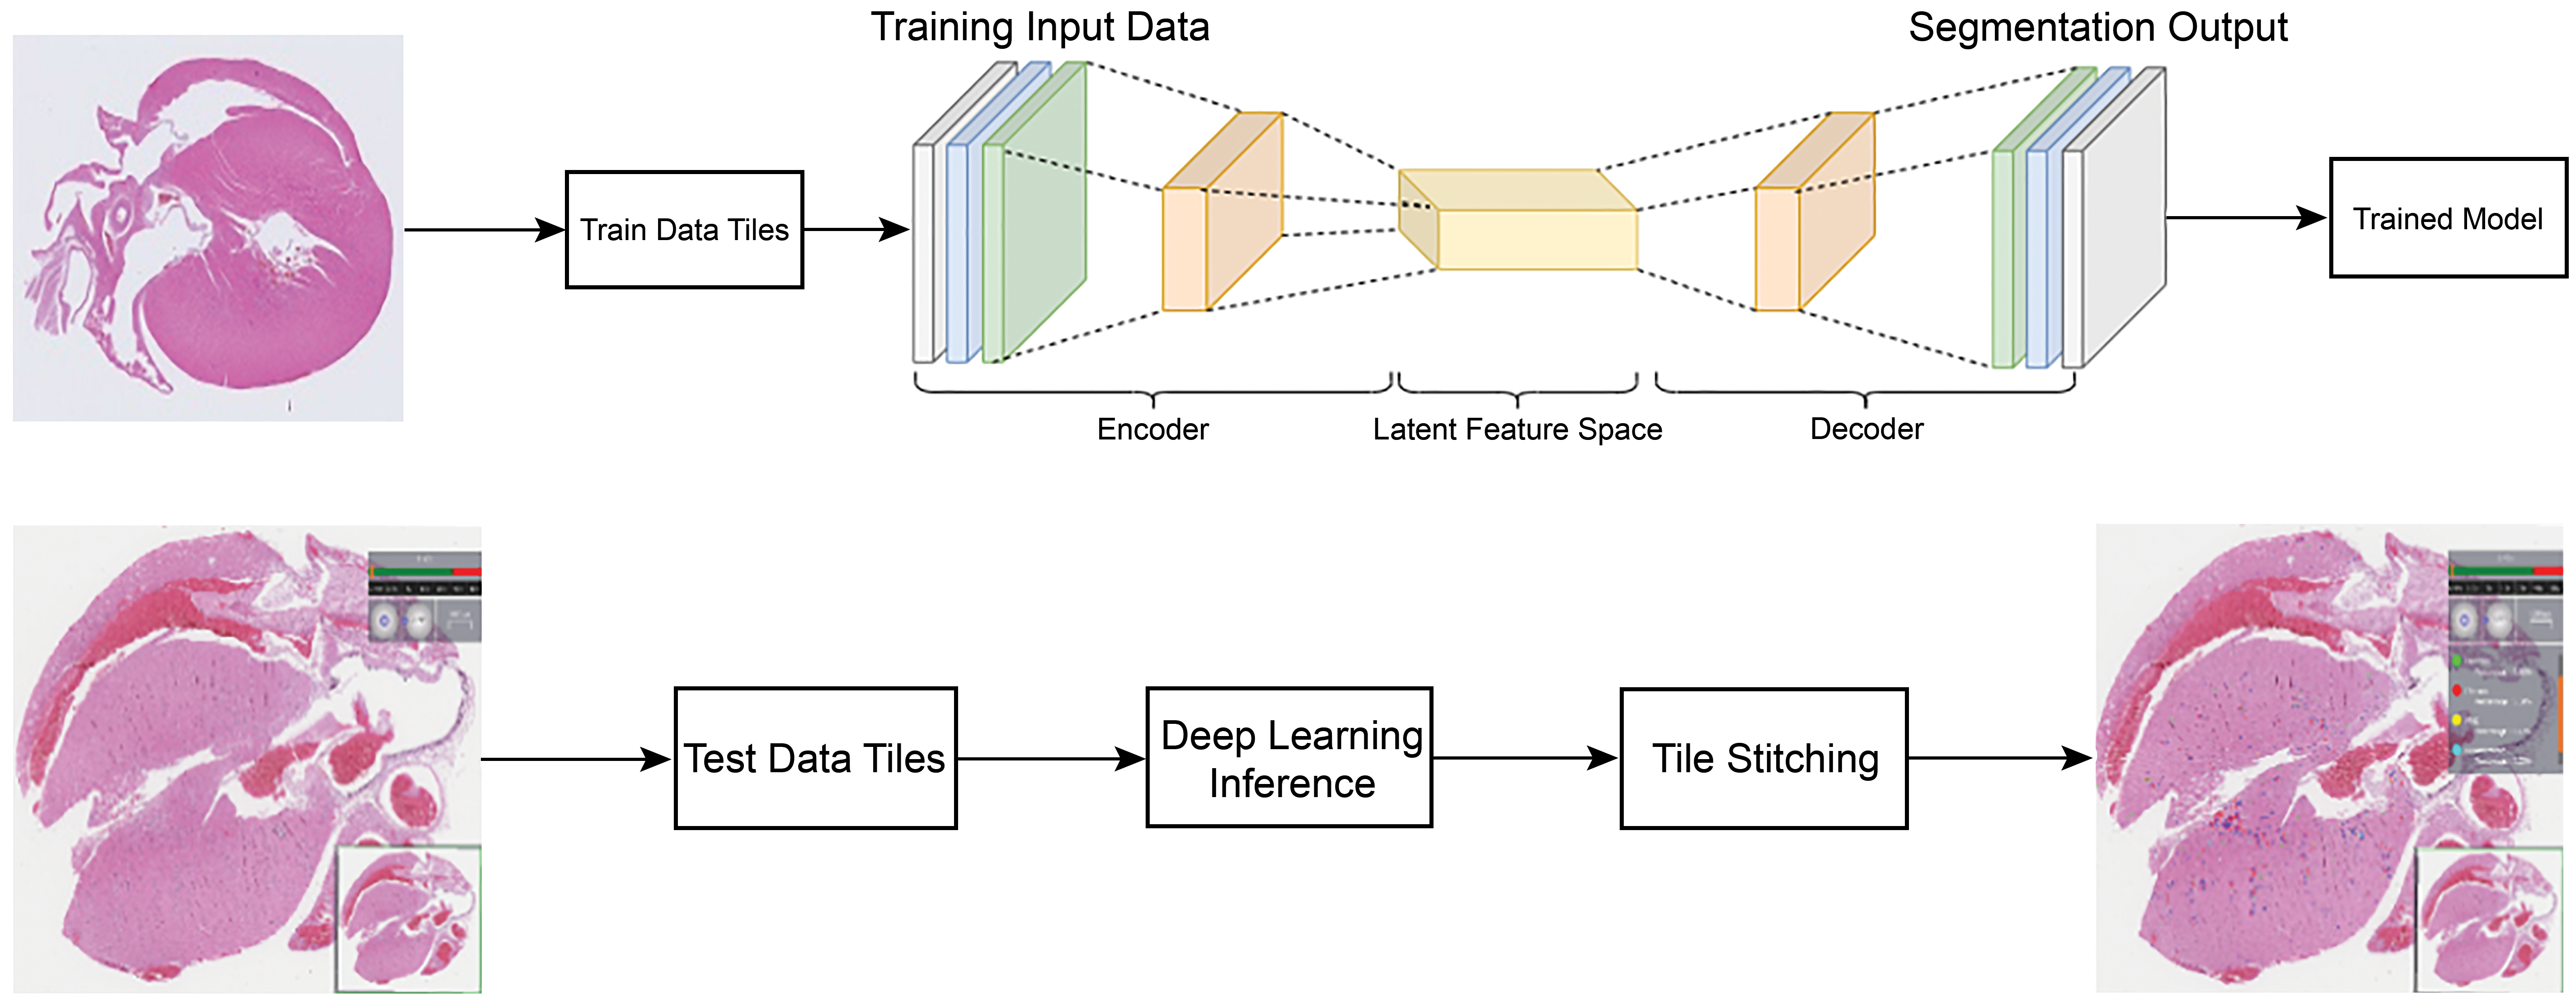
Cardiomyopathy algorithm training and testing pipeline. The WSIs of heart sections from Sprague Dawley rat hearts were divided into tiles of size 512 × 512 pixels. The tiles from the heart WSI were used to generate a trained model by using the encoder–decoder network (see also Supplemental Figure 1). For testing, the WSI was again divided into tiles. Inference was performed on each of the tiles using the trained model. The tiles were then stitched back together to form the WSI with abnormality areas segmented and color coded. WSI indicates whole slide image.
Statistical Analysis
Statistical analyses comparing pathologist raters’ grades with AI scores were done in R (version 3.6.3) 23 with package nnet (version 7.3-14). 24 For the test cohort, AI predicted scores were calculated as the combined percentage area of the heart section affected by each of the 4 parameters (necrosis, fibrosis, MNC, and mineralization) and compared to the pathologists’ median grades. The distribution of AI scores showed a heavy positive tail, with observed scores ranging from 0.02% to 4.50% (median at 0.32%). Due to the skewness of the AI scores, a log (base 10) transformation was applied to the raw AI scores to normalize the distribution. To illustrate the relationship between the pathologists’ ratings and AI scores, local polynomial regression (LOESS) 25 curves were fit to median grade as a function of AI scores (Figure 3) and median grade as a function of log10-transformed AI scores (Figure 4). Local polynomial regression curves are obtained by fitting polynomial regression in localized subsets of the data, with heavier weights given to points that are closest to the point of estimation. The smoothness of the curve is controlled by a span parameter which controls whether the curve follows local fluctuations or more global, smooth trends. A span of 0.75 was chosen to reflect the overall trend of the AI scores with median grade. A multinomial logistic regression model was fit to median grade (treated as categorical) as a function of the log10-transformed AI scores. Due to small counts (n = 3) in the grade 5 category, grades 4 and 5 were combined in this analysis. Grade 0, which refers to a diagnosis of no abnormality, was used as the referent category.
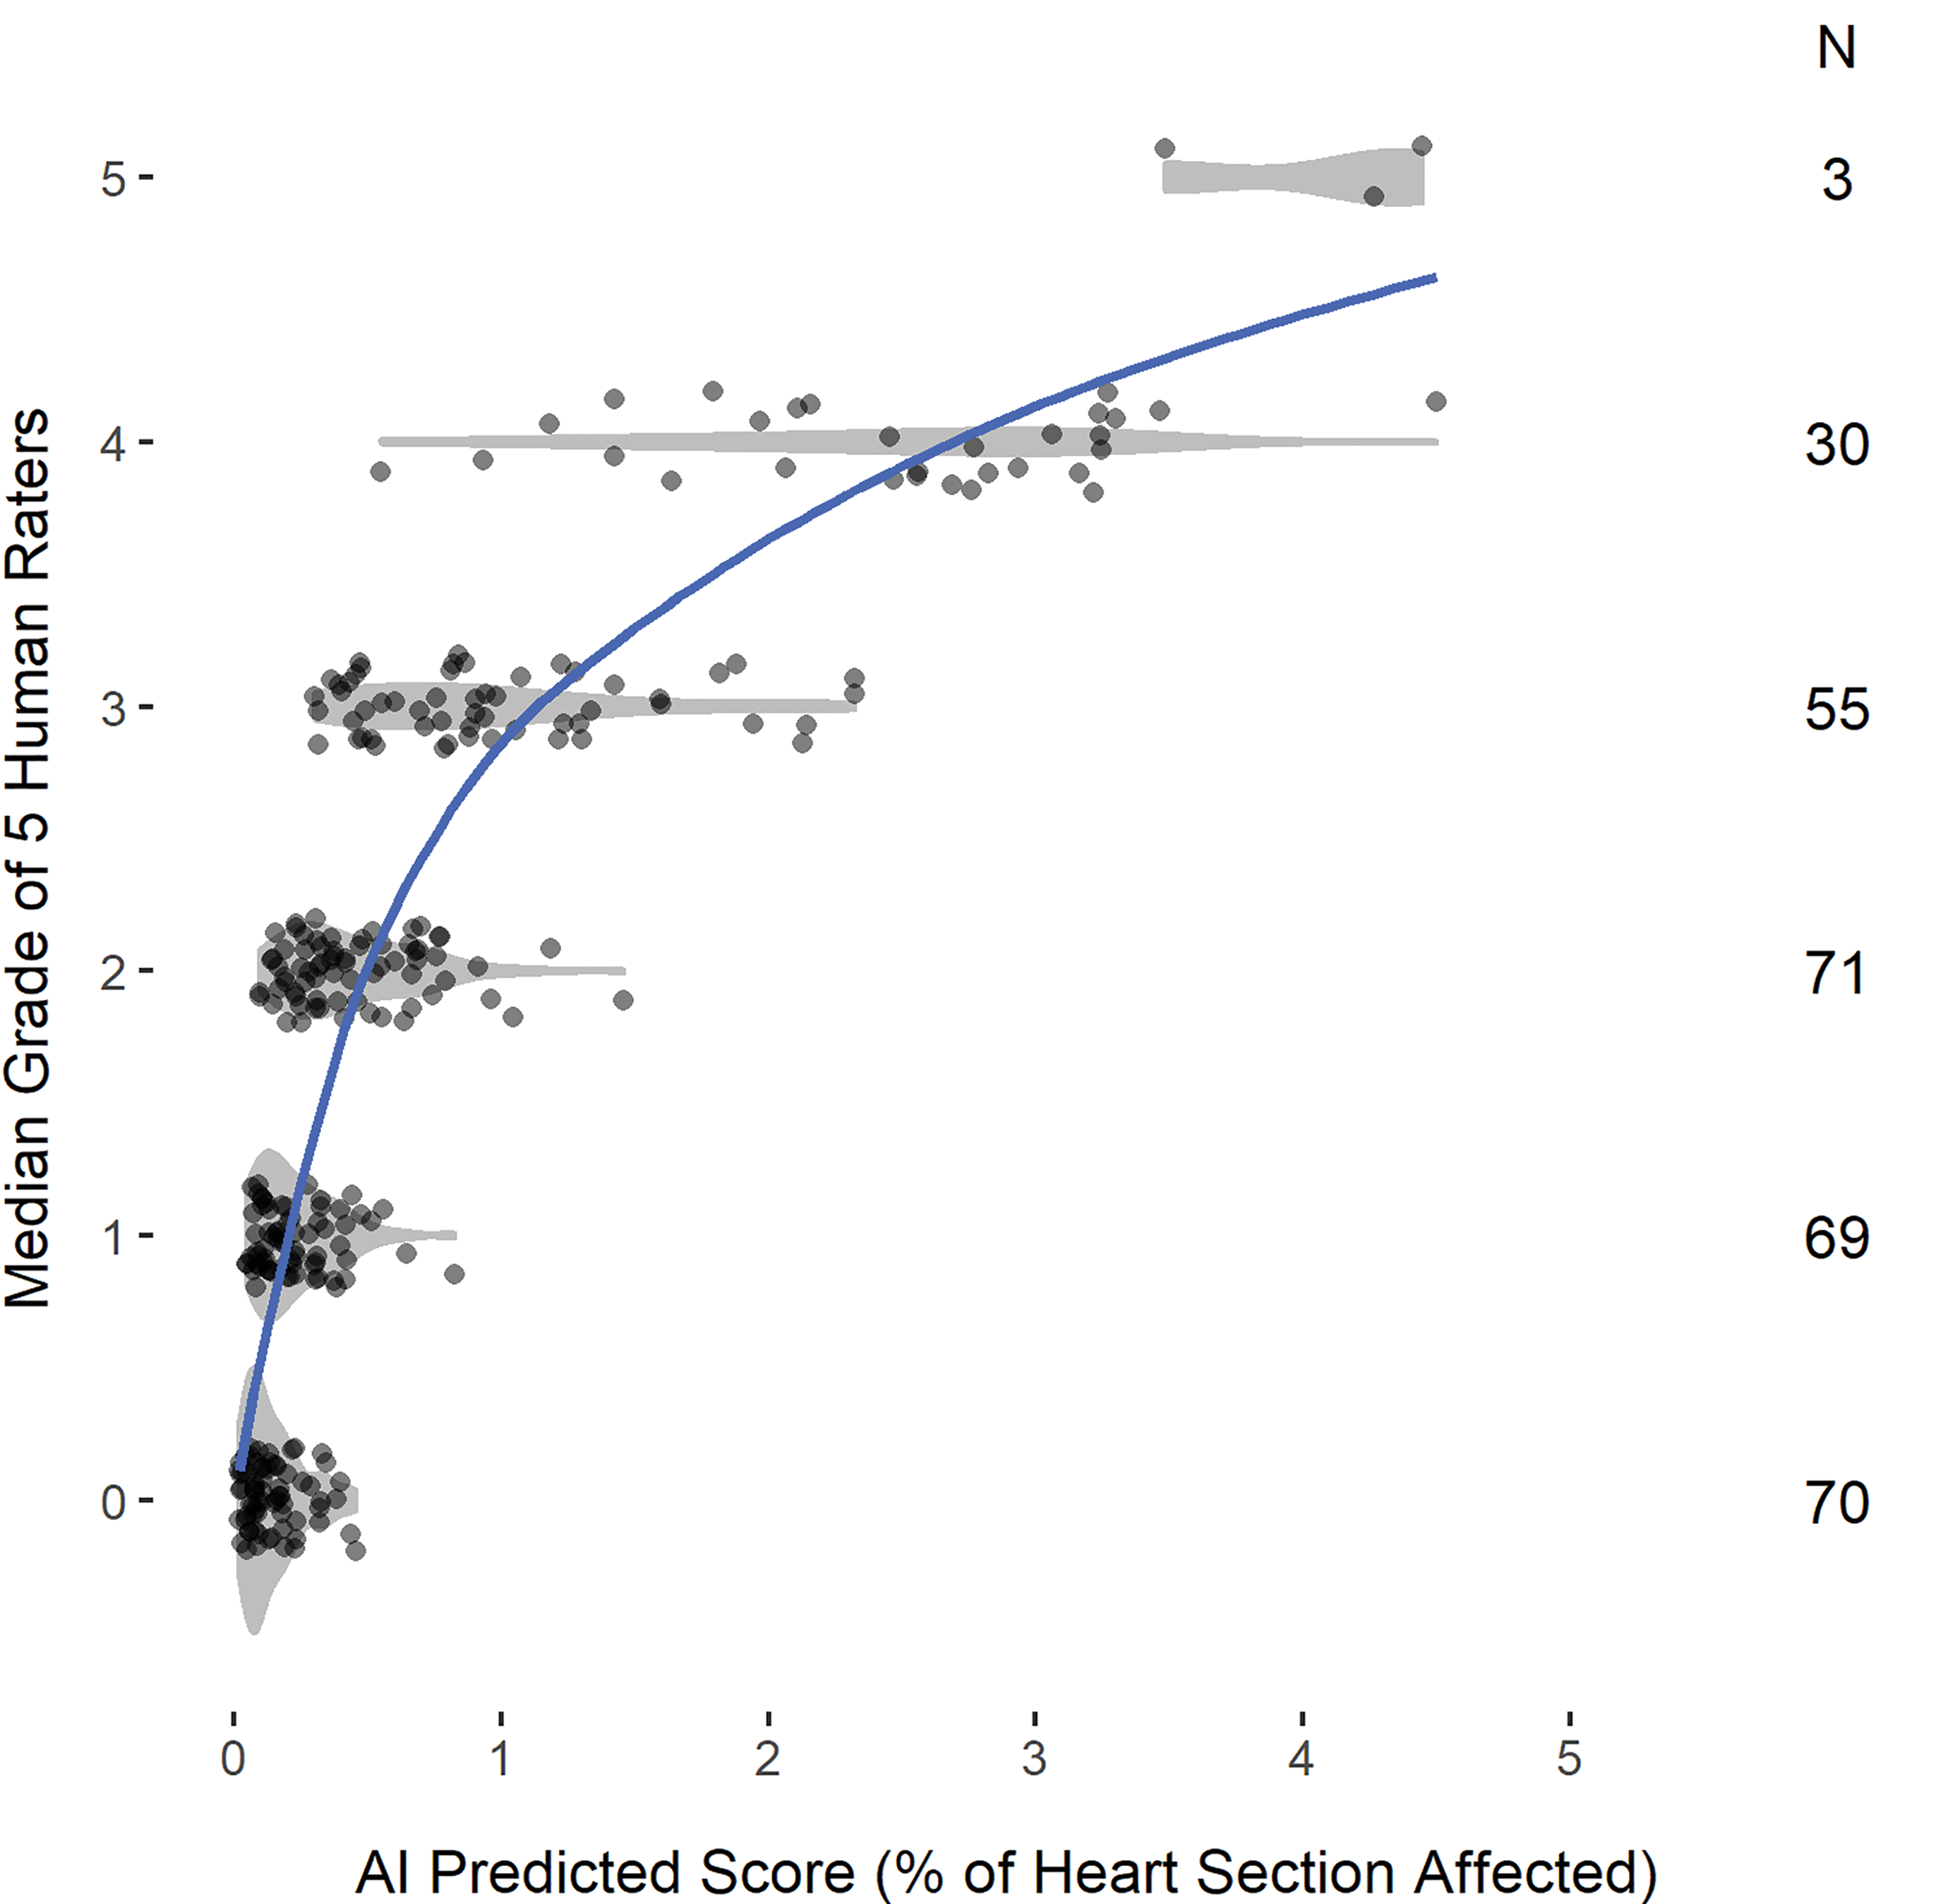
Scatterplot of AI scores by median grade. Violin plots (in gray shaded areas) are overlaid to show the shape of the AI distribution within each grade. A smooth (LOESS) curve (blue solid line) illustrates the nonlinear relationship between the scores predicted by the AI algorithm and the pathologists’ ratings. AI indicates artificial intelligence; LOESS, local polynomial regression.
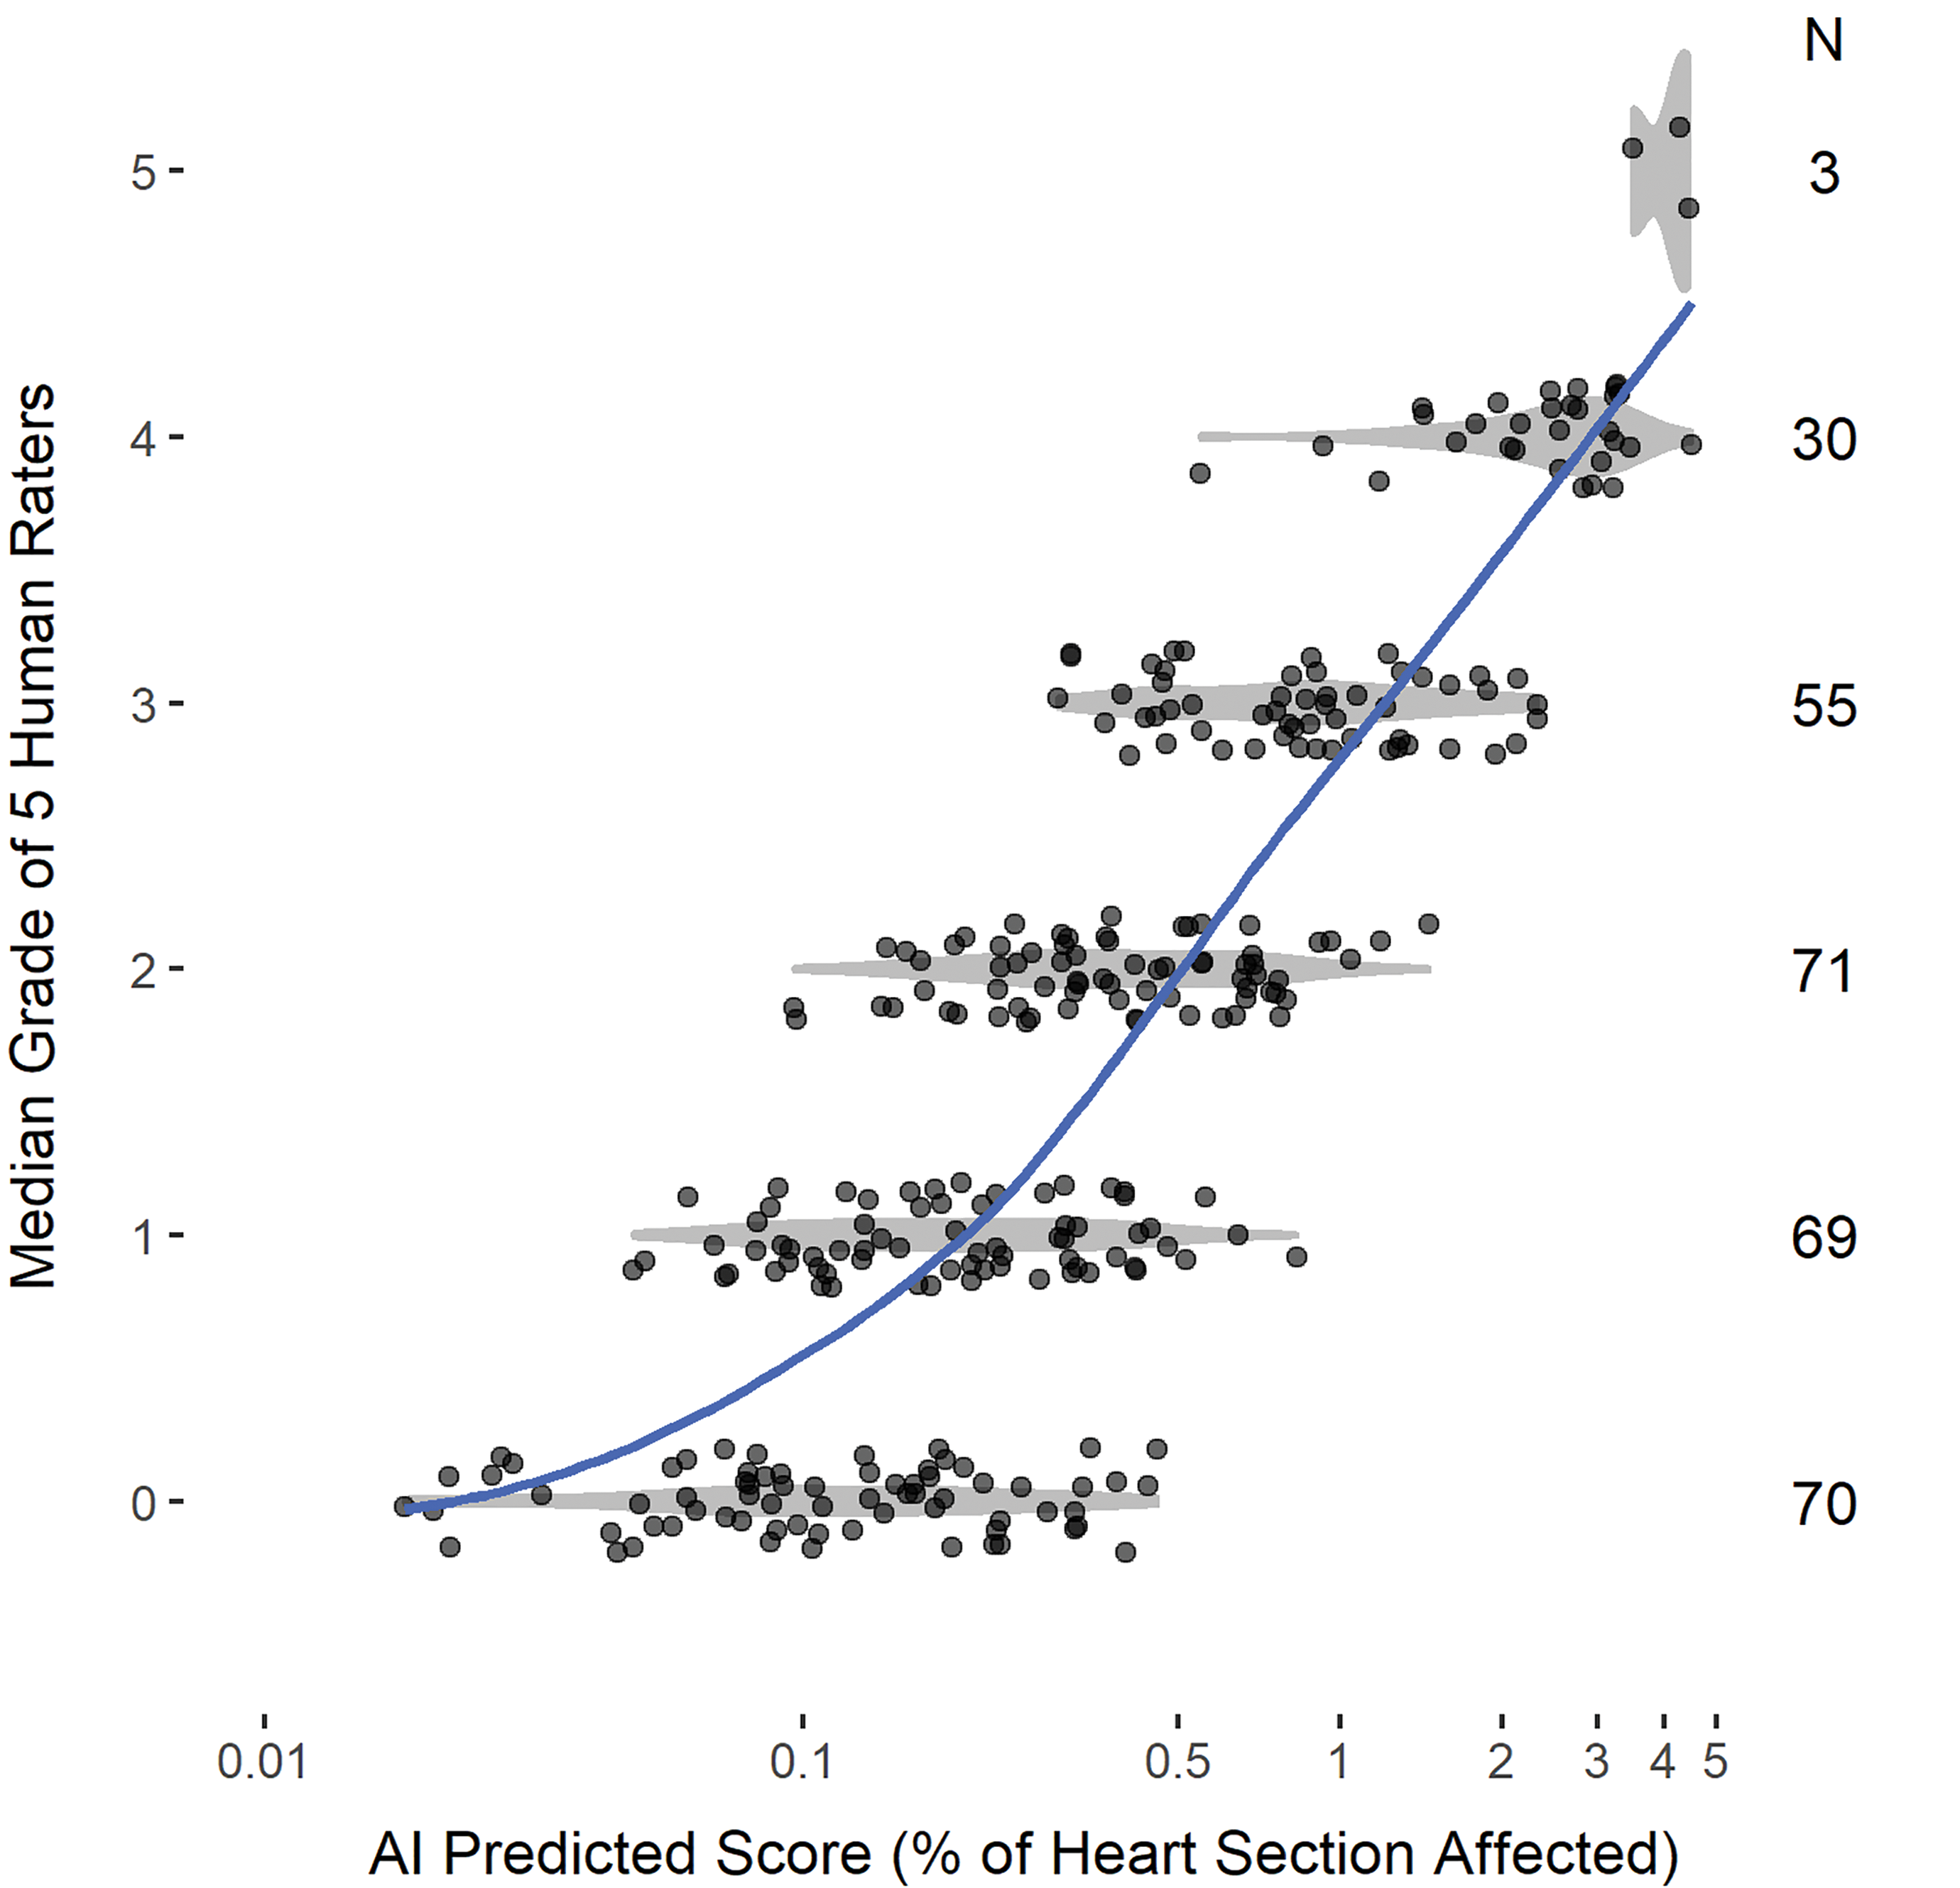
Scatterplot of log10-transformed AI scores at each median grade. Violin plots (in gray shaded areas) are overlaid to show the shape of the AI distribution within each grade. A smooth (LOESS) curve (blue solid line) illustrates the relationship between the log-transformed AI scores and the pathologists’ ratings. AI indicates artificial intelligence; LOESS, local polynomial regression.
Results
Algorithm Training and Testing
Schematic illustrations of the computer algorithm training and testing pipelines are shown in Figures 1 and 2. To confirm the importance of introducing a second pipeline in training for artifacts and background, an ablation study was conducted. In the first study, only test outputs for abnormality (ie, PCM features) were generated with no consideration of artifacts. The result was a significant number of false positives in the blood vessel region, the RBCs, and in the perivascular tissues (eg, mineralization in the vessel wall, MNC in the vessel lumen). Generating a separate pipeline for each of them sharply reduced the number of false positives (Figure 5). Such cases confirmed the necessity of using a separate pipeline for subtraction from the test output, so that accurate predictions of abnormality could be made.
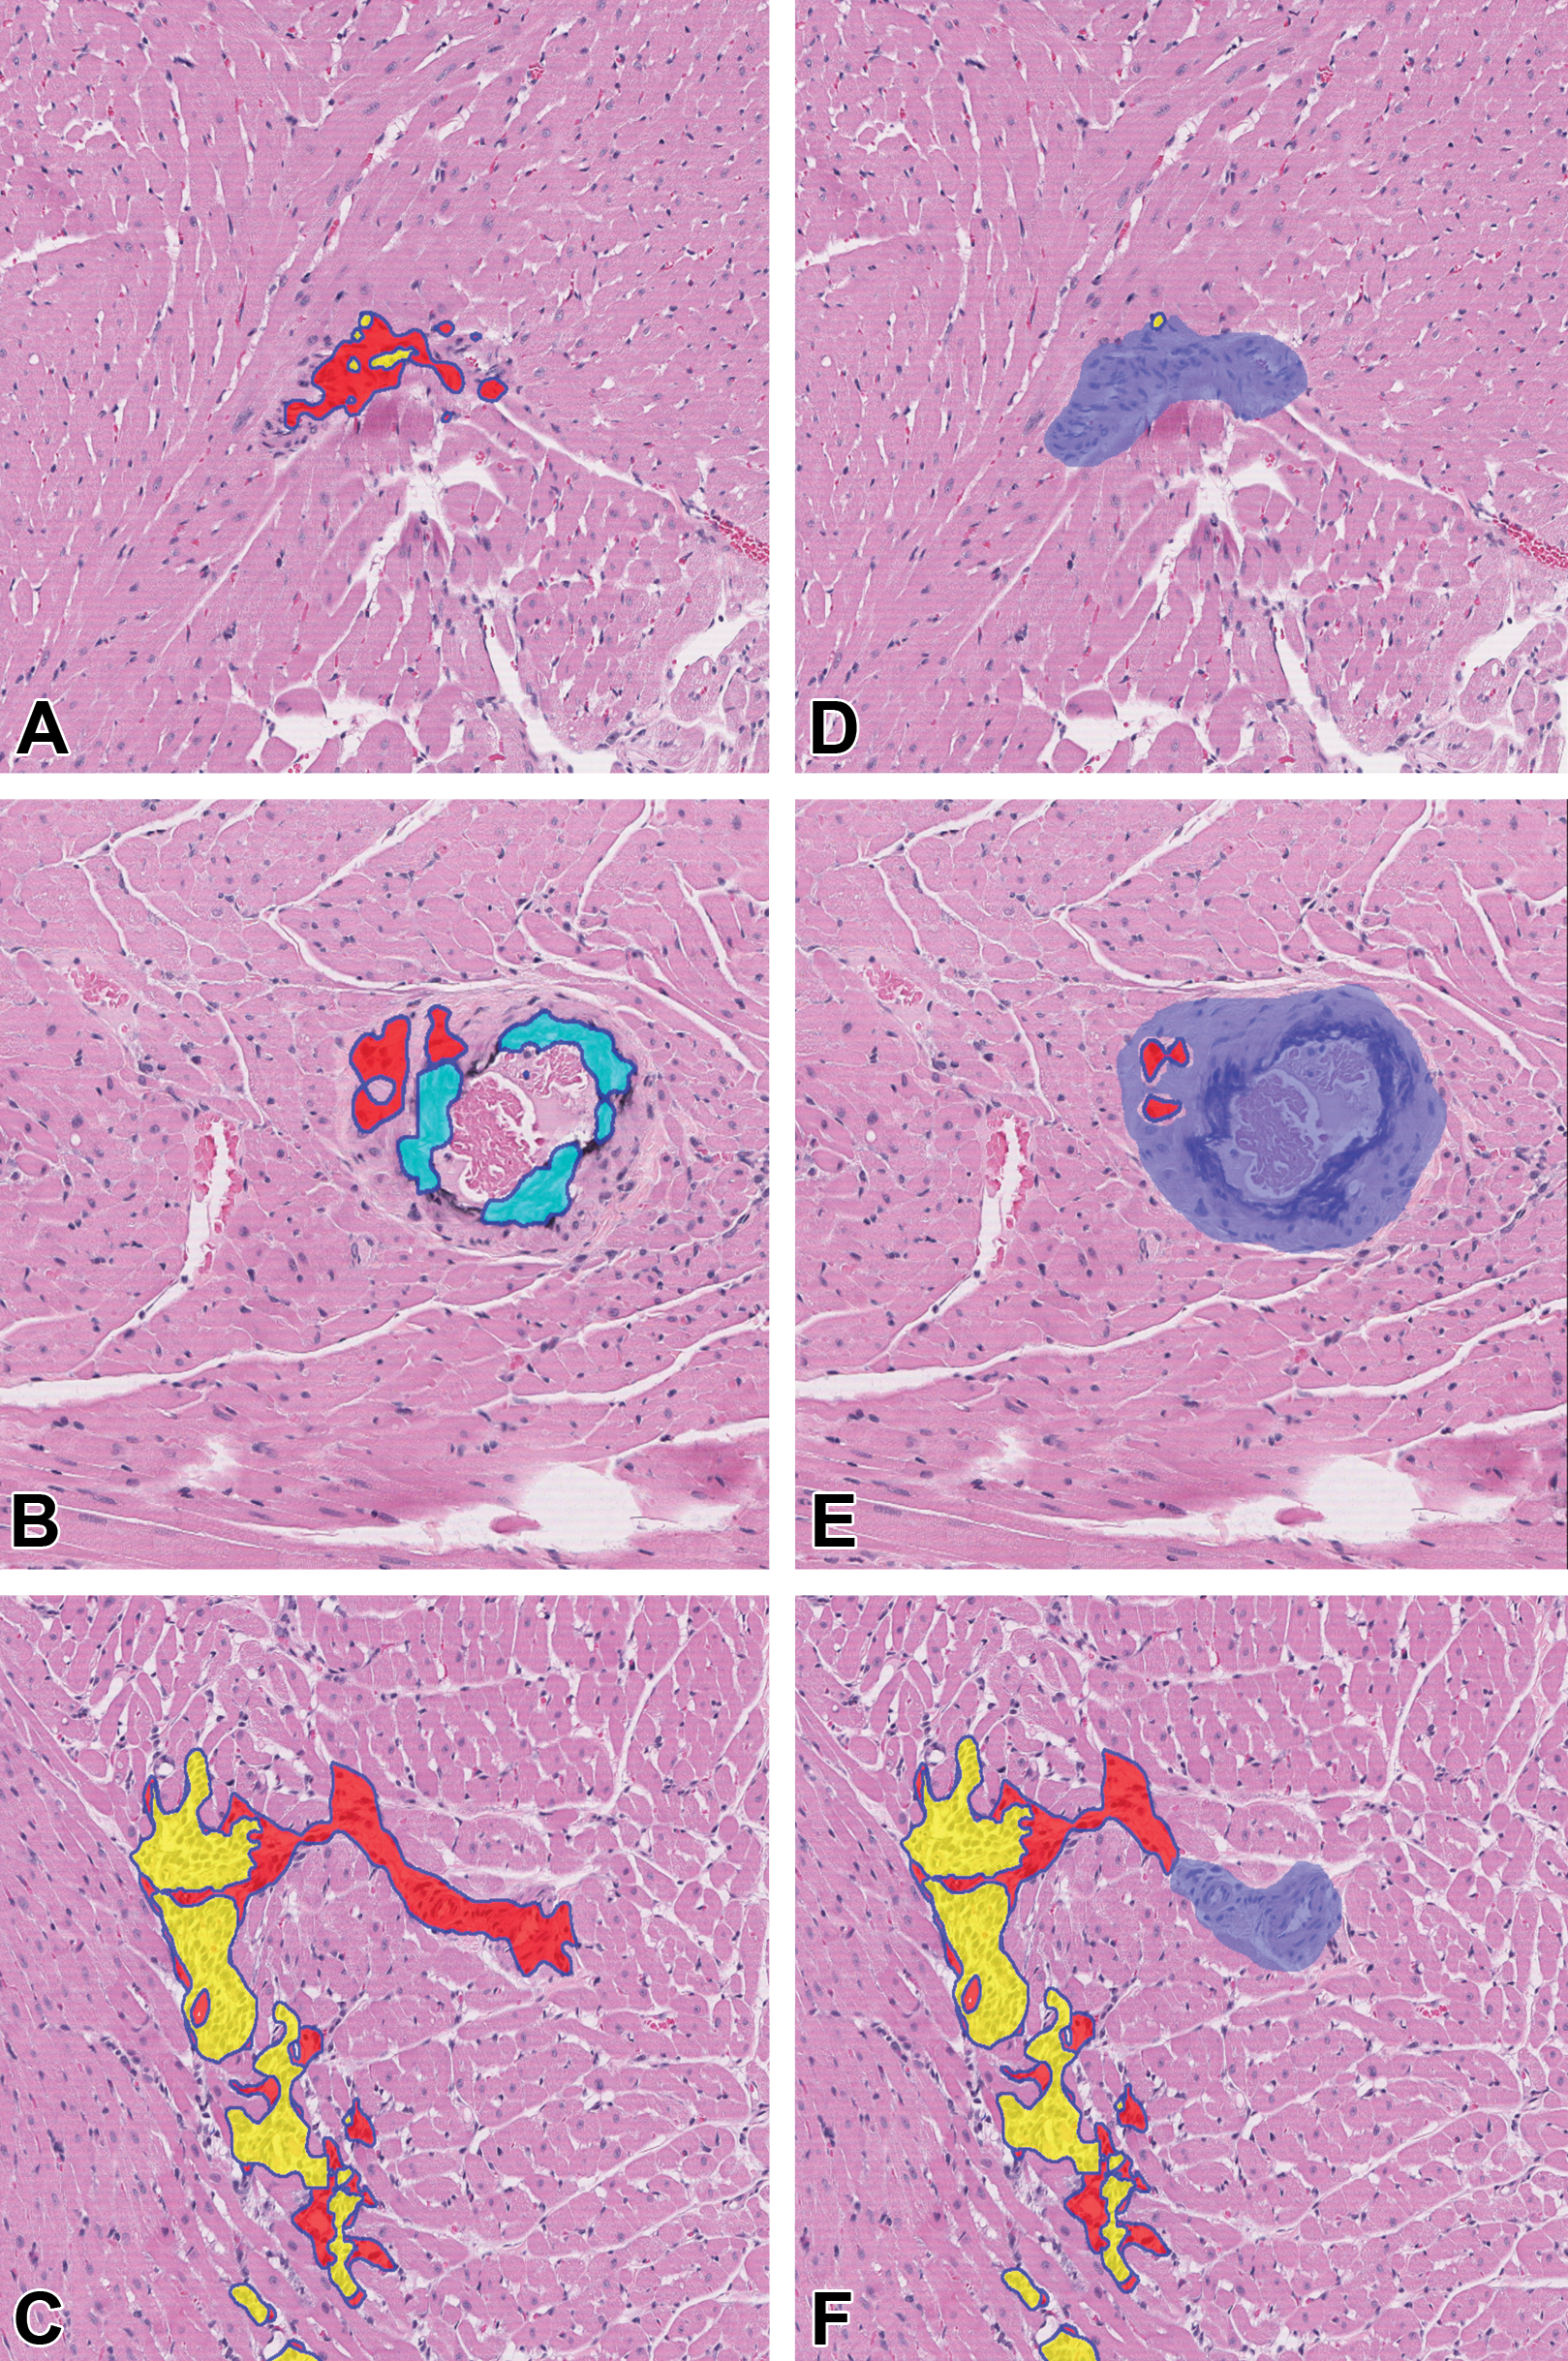
Sprague Dawley rat heart with color-coded segmentation areas. A-C, Algorithm output without the artifact pipeline. Fibrosis (red), mineralization (light blue), and MNC (yellow) were erroneously detected in the blood vessel. D-F, Algorithm output in the same sections with the artifact pipeline applied (after subtraction of blood vessel region, shown in blue). H&E stain, original scan 10×. H&E indicates hematoxylin and eosin; MNC, mononuclear cell infiltration.
The segmentation performance was evaluated on the validation data set. Table 2 shows quantitative performance based on accuracy, IOU, and dice coefficient. It shows that the algorithm was capable of segmenting individual parameters with few false positives. As illustrated in Figure 6, the algorithm could accurately segment all 4 parameters applicable to the diagnosis of cardiomyopathy. These parameters were quantified as percentage of the total area of a given heart section.
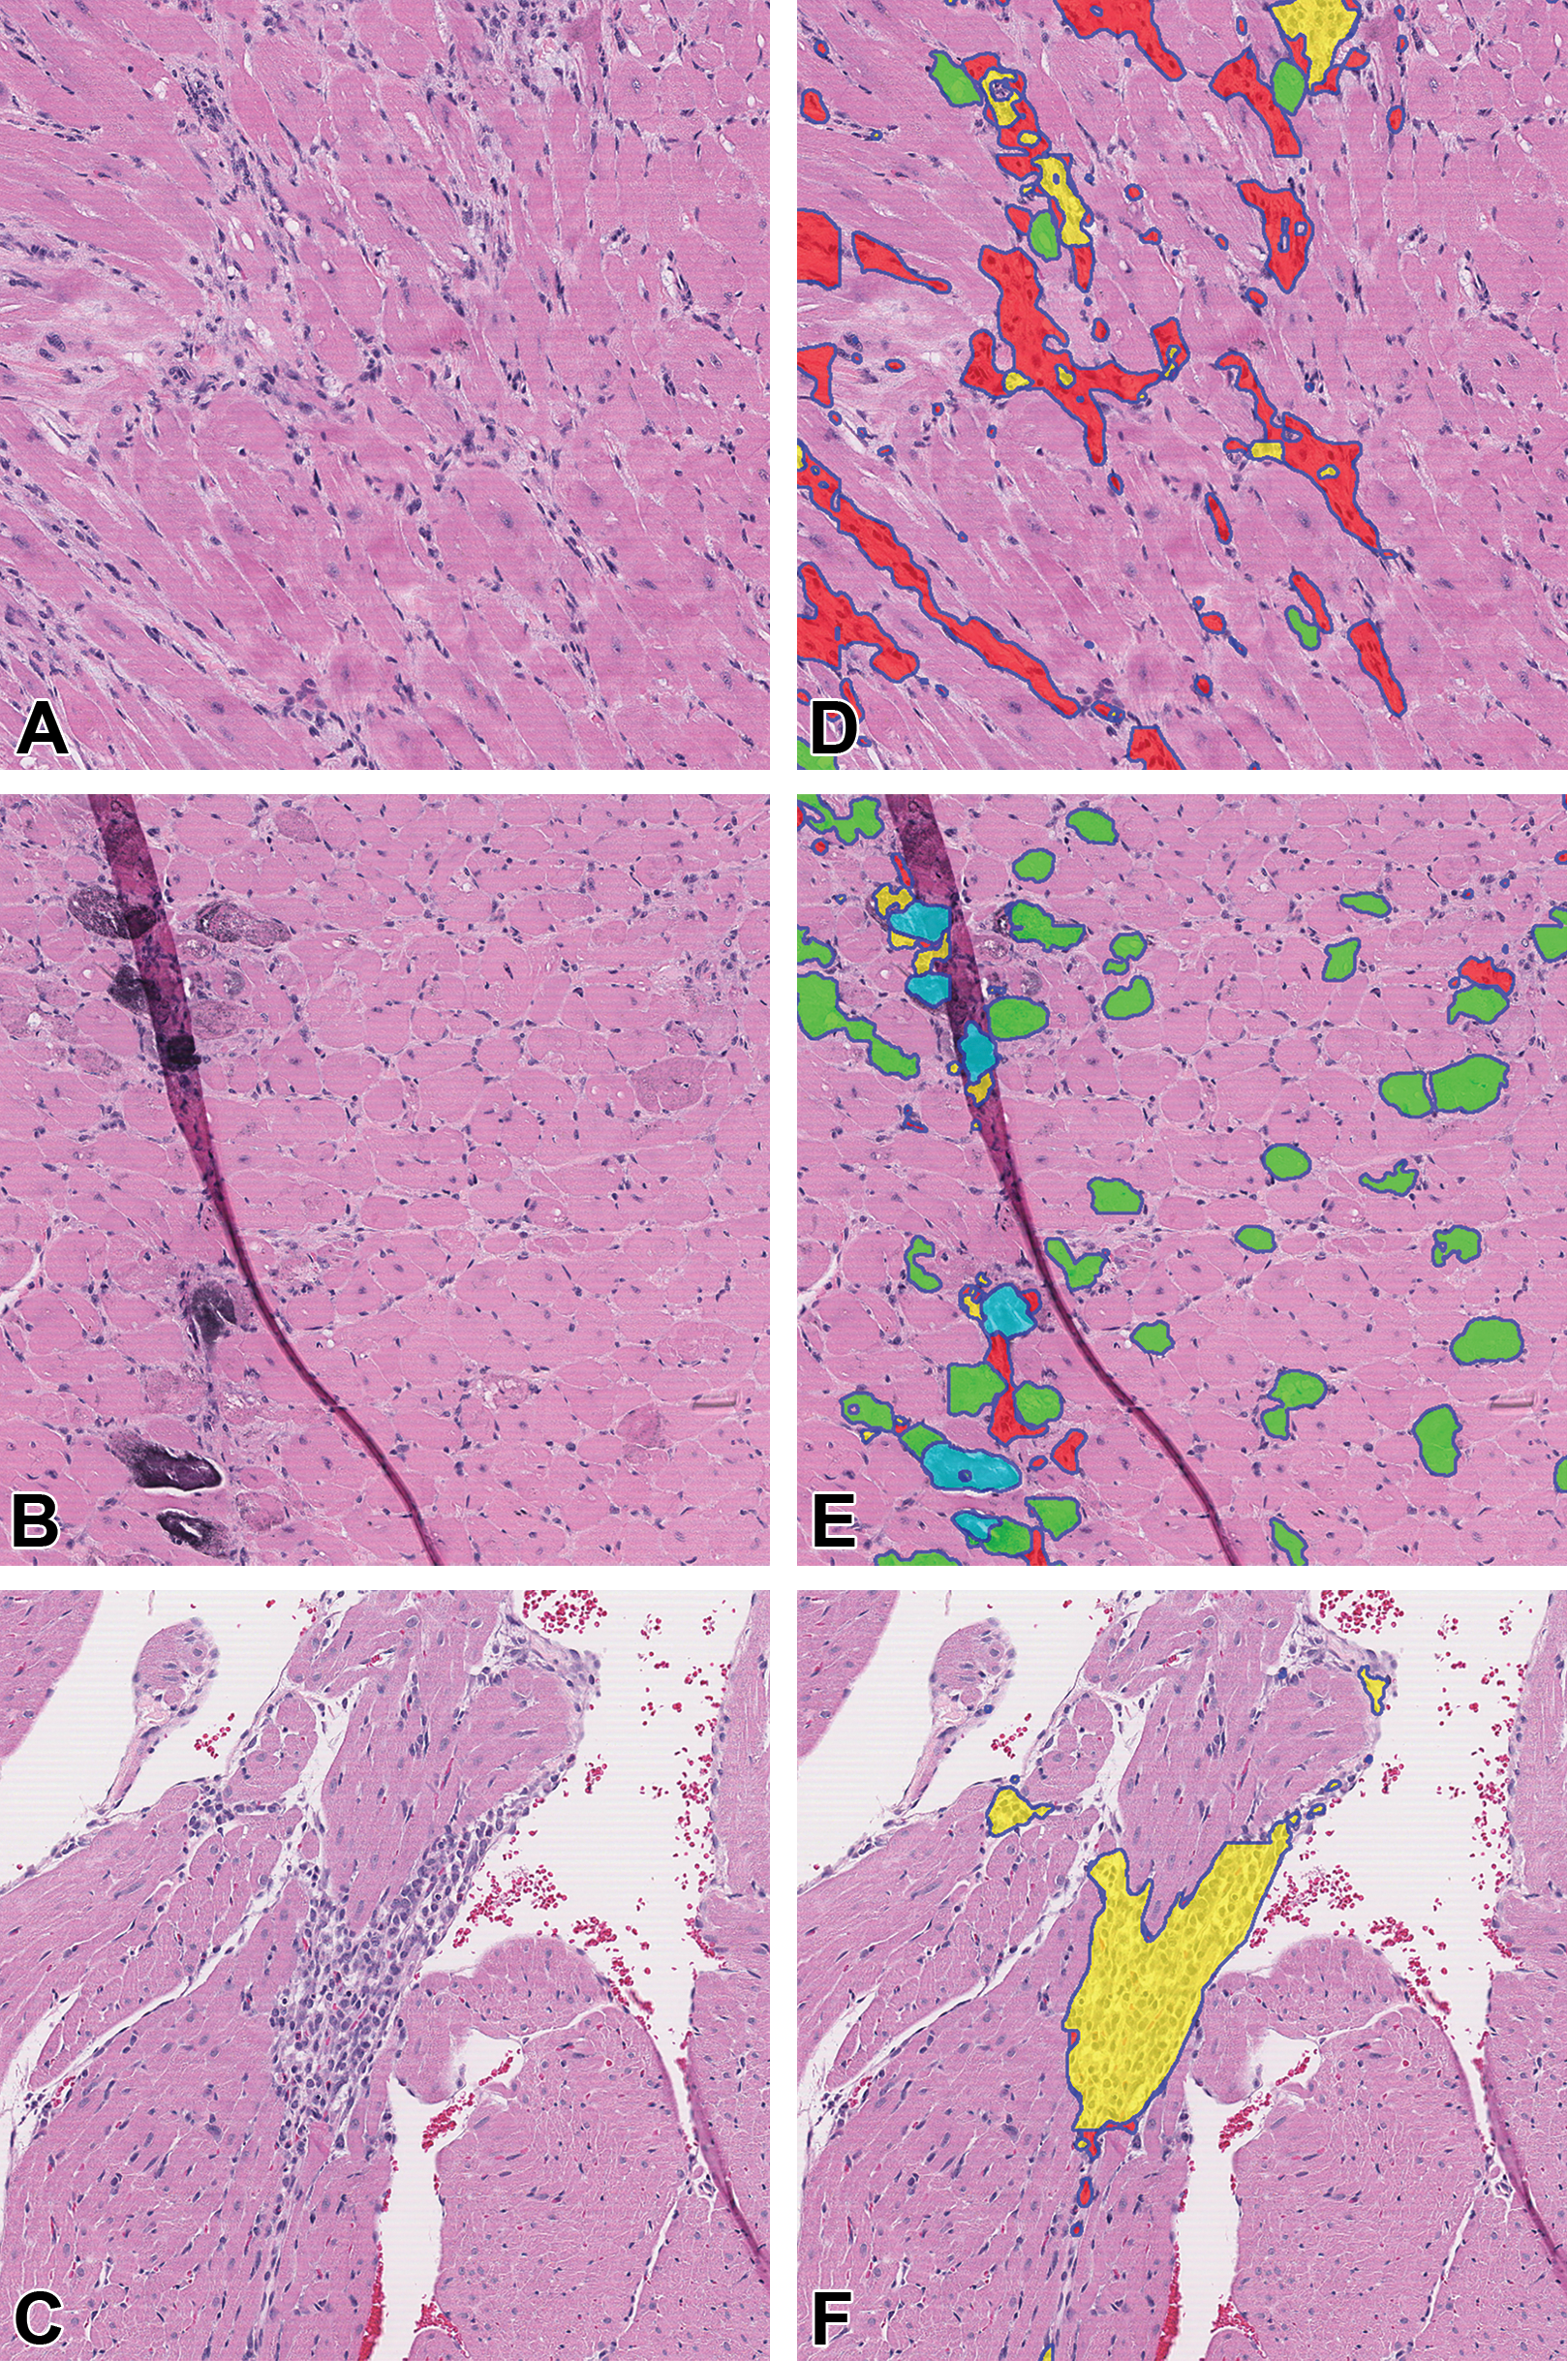
Sprague Dawley rat heart images before and after algorithm segmentation. A-C, Input images demonstrate microscopic features of PCM. D-F, The corresponding images following segmentation by the algorithm. Colored regions indicate areas predicted by the algorithm to have fibrosis (red), necrosis (green), mineralization (light blue), and MNC (yellow). Appropriate segmentation occurred even in areas of tissue fold artifact (E). H&E, original scan 5X. H&E indicates hematoxylin and eosin; MNC, mononuclear cell infiltration; PCM, progressive cardiomyopathy.
Quantitative Performance of Algorithm Segmentation
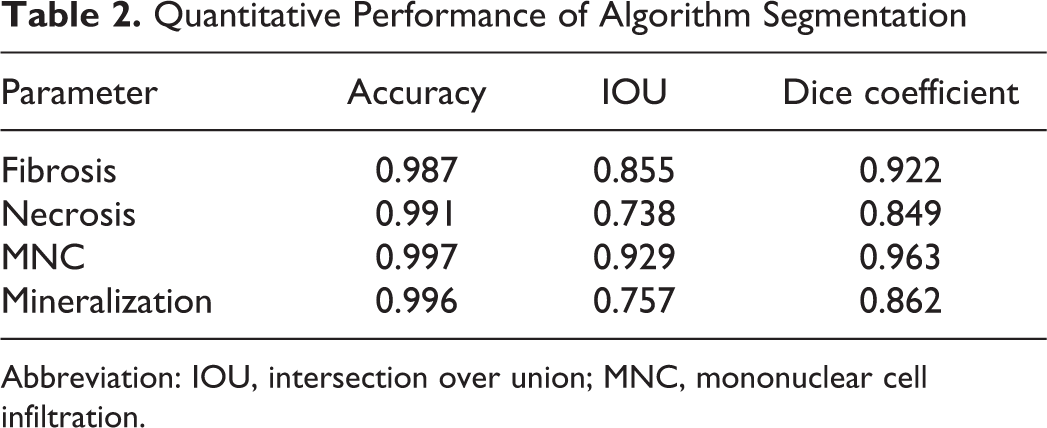
Abbreviation: IOU, intersection over union; MNC, mononuclear cell infiltration.
Pathologist Evaluation of the Test Cohort
Of the 300 test cohort slides, the veterinary pathologists reached consensus on 80% (241 of the 300 slides). Consensus was defined as having at least 3 of the 5 pathologist raters agreeing on the exact grade and PCM diagnosis. Of the remaining 59 samples where no consensus was reached, 81% (48/59) had a range of 2 (that is, all pairwise pathologist ratings were within 2 grades of each other); 14% (8/59) had a range of 3; 3% (2/59) had a range of 4; and 1 sample had a mixed diagnosis (1 rater rated no abnormality, 2 raters diagnosed PCM of varying grades, and the other 2 raters had a non-PCM diagnosis).
Comparison of AI Algorithm Predictions to Pathologist Scores
Of the 300 test cohort slides, 1 sample was excluded due to mixed diagnosis, and 1 sample was removed due to a missing algorithm result. A total of 298 observations was used for further statistical analysis. Figures 3 and 4 show the distribution of the percentage of heart section affected as predicted by the algorithm at each grade. Grades are jittered on the y-axis to show the density of the observations. Violin plots (displayed in gray shaded areas) show the shapes or densities of the distributions, with wider areas representing larger counts and narrower areas indicating fewer counts. The AI scores were associated with a range of median pathologist grades, reflecting variability in grading among individuals. A smooth fitted (LOESS) curve illustrates the relationship between grade and AI score. Figure 3 shows a nonlinear increasing trend of median grade with increasing AI scores. After a log10 transformation on the AI scores, the trend looks more linear (Figure 4). The Spearman rank-order correlation between median grade and AI score was 0.82, suggesting a strong positive relationship between these 2 variables. The results from fitting a multinomial logistic regression model show that the predicted probabilities of each grade retained their ordering across AI scores (Figure 7), with increasing AI scores consistent with larger probabilities of higher severity grades.
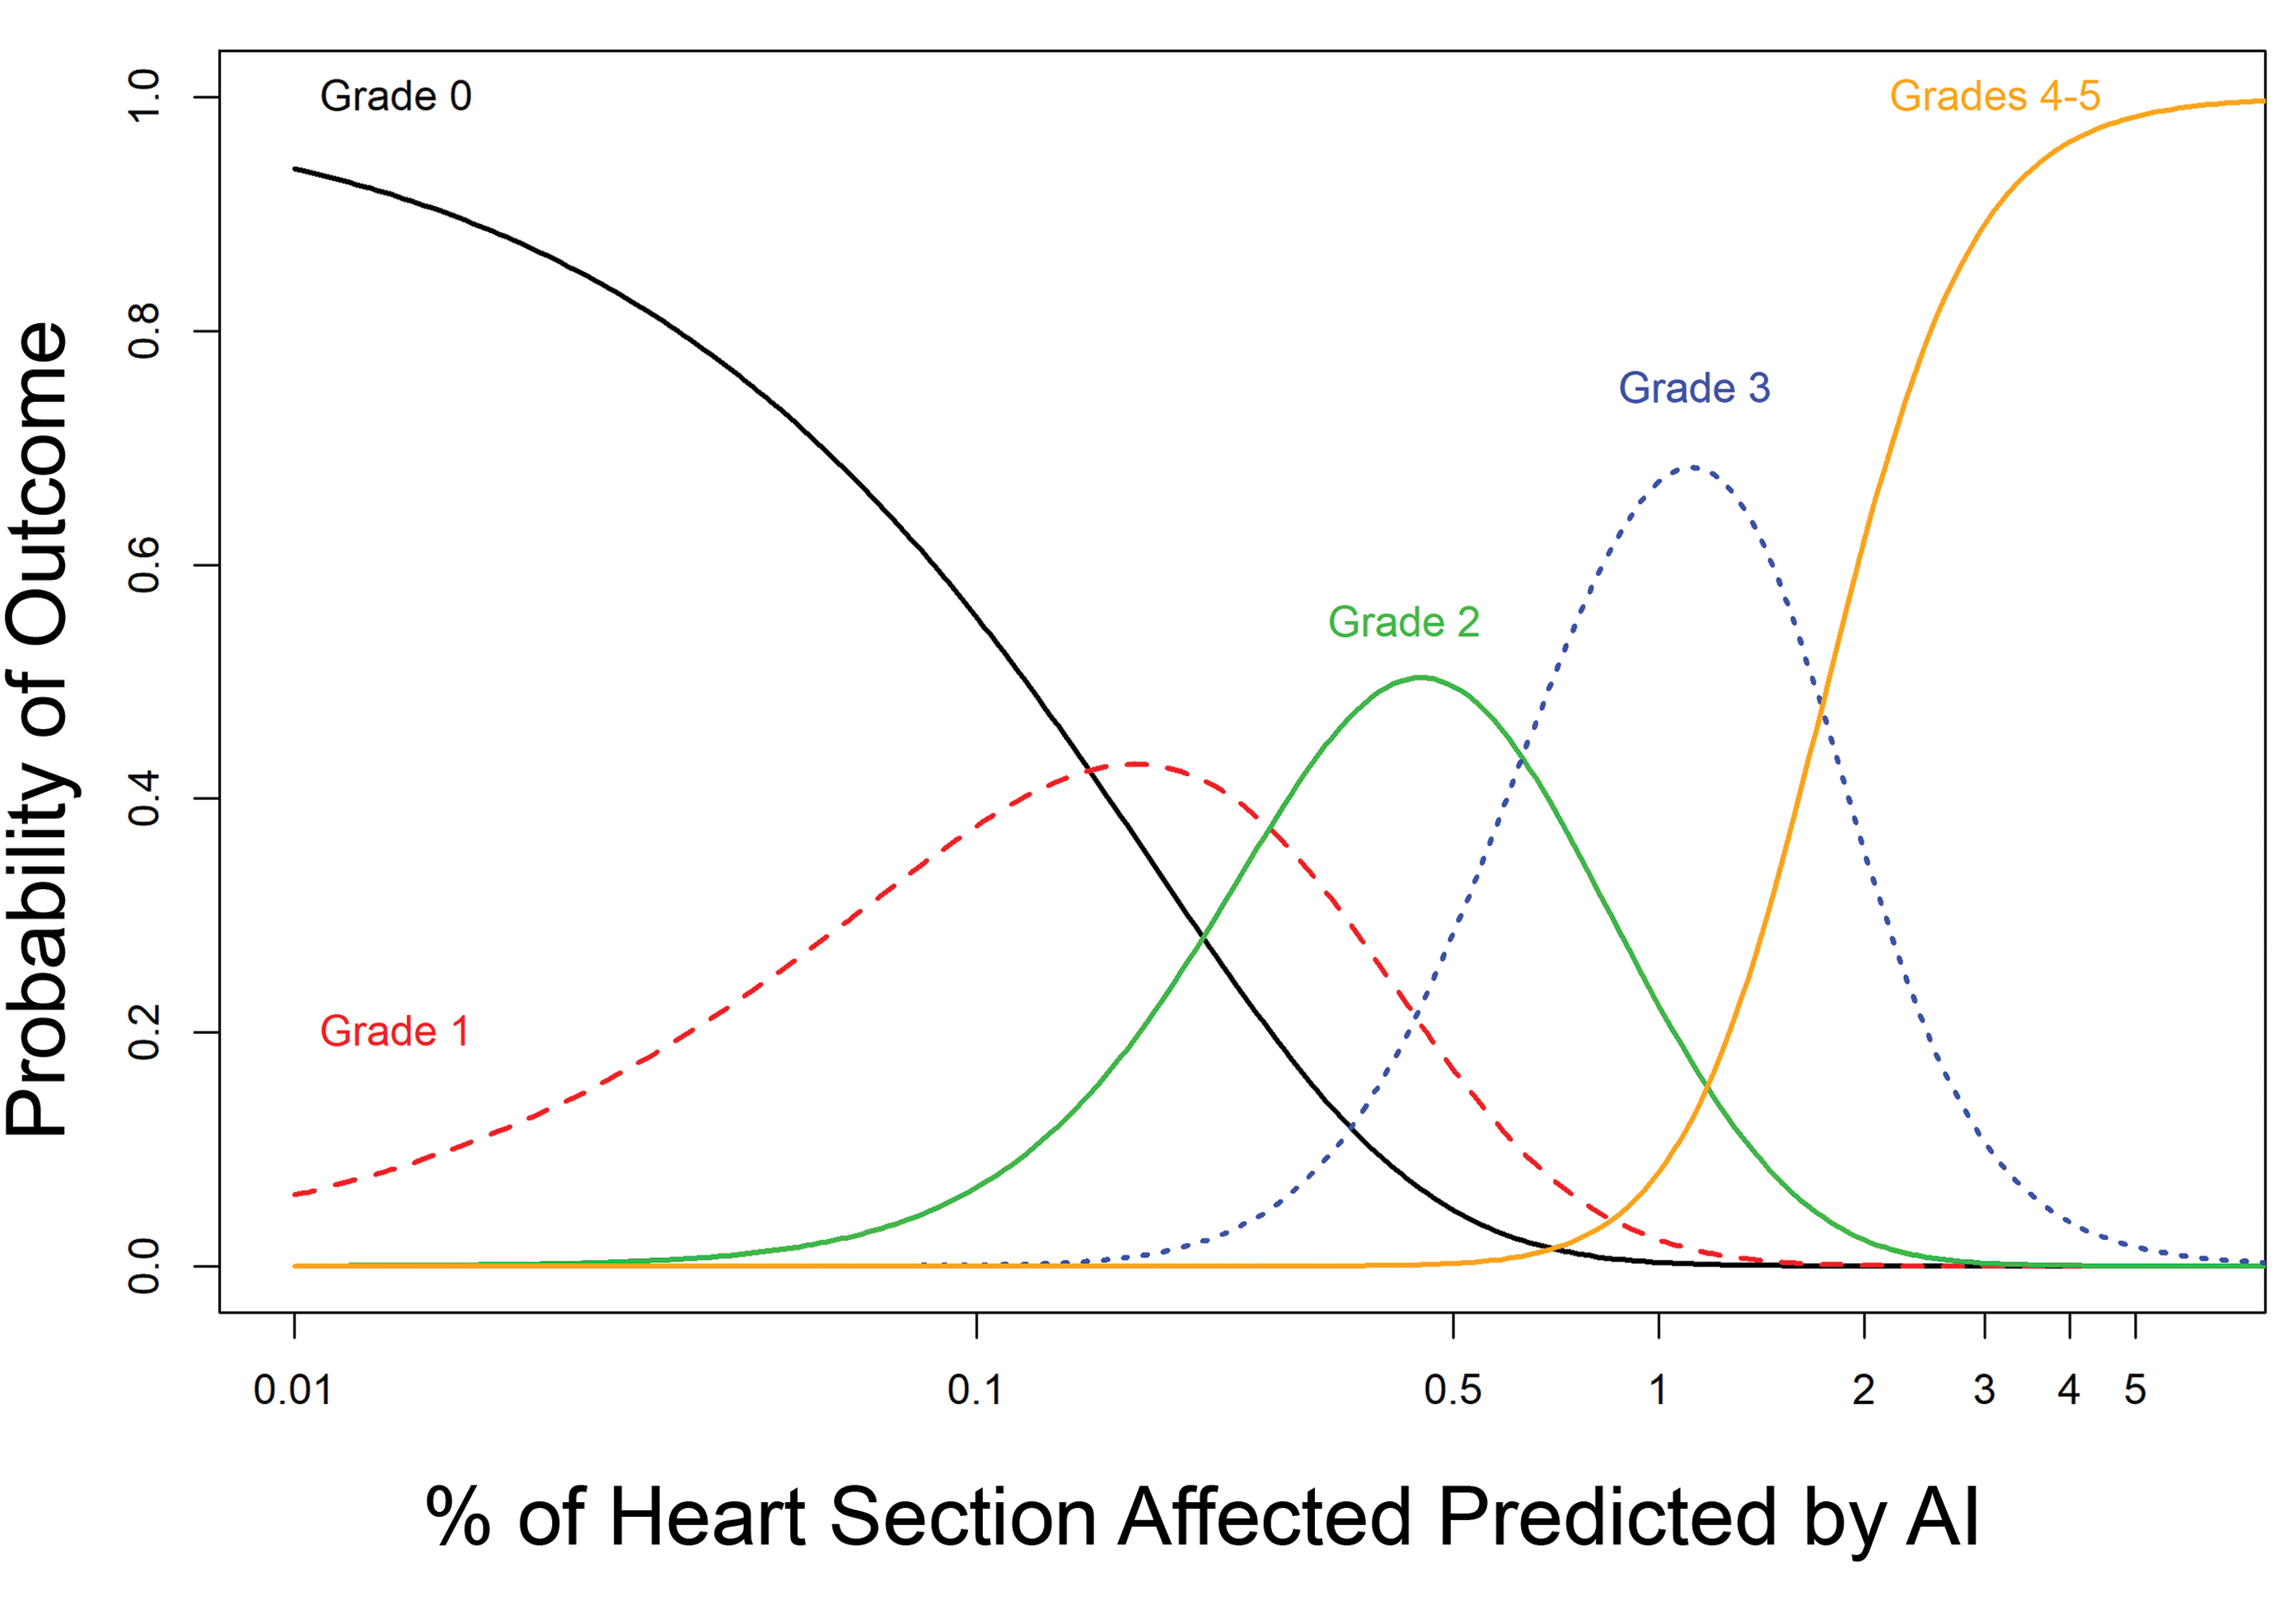
Predicted probabilities of grade outcomes for given AI scores based on a multinomial logistic regression model of median grade as a function of the log10-transformed AI scores. AI indicates artificial intelligence; LOESS, local polynomial regression.
Discussion
Using a deep learning technique, the automated image analysis algorithm was able to detect and quantify histologic features of rodent cardiomyopathy in histologic sections of rat heart. To validate the algorithm function, the predicted AI scores were compared to results from a panel of 5 experienced veterinary toxicologic pathologists. The results support a strong positive correlation between the pathologists and the automated image analysis algorithm for the detection and severity of rodent PCM. Notably, modeling the probability of a pathologist-assigned grade from the AI predicted scores preserved the ordering of median grade, suggesting that increasing AI scores corresponded to larger probabilities of higher grades. The amount of overlap in the predicted probabilities, most notably in the lower grades (grades 0, 1, 2), suggests limitations in this AI algorithm in distinguishing between pathologist-assigned grades at these levels. The AI scores also show considerable variability in this grade range. Concordance between the pathologists’ grades and AI scores improved in the higher severity grades (grades 3 and greater). In practice, exact agreement may be too narrow of a goal for the AI algorithm to achieve since there is inherent subjectivity in how pathologists assign grades. Although outside the scope of this study, investigation of individual cases within the test cohort may reveal potential sources of discrepancy, which could include algorithm function, interpathologist variability, and/or case-specific histologic changes, among others.
Components of PCM were detected in all scans by the algorithm, even in those that the pathologists considered to have no PCM. Previous studies have already demonstrated a 100% prevalence of PCM-related lesions in serial heart sections of young male Sprague Dawley rats. 4 The heart sections in the test cohort were primarily from animals used in chronic studies and PCM increases with age. 1,2 Therefore, a high prevalence for PCM in the test cohort is not surprising. As evident in Figure 7, cases considered to have no abnormalities by the pathologists (grade 0) typically had aggregate lesion areas of <0.1% of the heart section, as detected by the algorithm. This small percentage of the heart, particularly if present as fine fibrosis or individual myocytes, may be easily overlooked. Taken together, the results indicate the algorithm provides a highly sensitive way to detect the histologic changes of PCM and could be useful in establishing quantitative background levels of PCM in toxicity studies.
Given an input image, the goal of the deep learning model was to predict the label of each pixel by assigning a probability value to each pixel. To achieve this, we have employed FCN8s-ResNet50 architecture, a form of convolutional neural network (CNN). Convolutional neural networkss have provided very good results in terms of segmentation. They have also proved fit for segmentation in various medical images. 26 Generally, segmentation using CNNs involves an encoder–decoder network. The encoder extracts the features from the images using CNNs like VGG 27 or ResNet 20 and the decoder performs the dense pixel-level classification. Two networks widely used for segmentation are Regional Convolutional Neural Networks 28 and FCNs. 19 Regional Convolutional Neural Network is a very time-consuming network and often fails to provide a clear boundary. On the other hand, FCN provides benchmark performance in various segmentation tasks and was therefore the network of choice for this application. The ResNet50 is well known due to its depth and the introduction of residual blocks. Residual blocks address the problem of training a really deep architecture by introducing identity skip connections so that layers can copy their inputs to the next layer. 20
To maximize the data available for training and validation, parameter-wise image tiles extracted from training WSI were divided into mutually exclusive training and validation image sets. Deriving training and validation images from the same WSIs could potentially bias the model, however this is balanced against the overall large data set with varying composition (see Supplemental Table 1). We also wanted to avoid a model that was overfit, that is, the resulting model may be very good for the training data set but perform poorly on a new data set. To avoid this and increase generalization of the model, batch normalization was employed. 29 The strong correlation of the AI scores with the pathologists’ grades for the entirely novel WSI test set suggests little or no overfitting from the chosen training methodology.
The AI algorithm successfully delineated and quantified individual components of PCM including cardiomyocyte necrosis, fibrosis, MNC, and mineralization. Although this study used combined scores of all components, future studies employing a similar testing methodology could be used for the individual components. The ability to separately quantify these components could be advantageous in elucidating test article-related effects. For example, a greater component of fibrosis in a treated group compared to controls could reflect earlier onset or altered healing of PCM in the treated group. We envision this as a way for such an algorithm to be incorporated into the pathologist’s histopathologic evaluation and interpretation in toxicity studies, thereby enhancing the sensitivity of detecting differences between treated and control groups.
In this study, heart sections from control and test article-treated rats were used during algorithm training, while the test cohort contained only control rats. The use of both control and treated rats for algorithm training allowed for sufficient numbers of WSIs that captured the range of severities and features of PCM. Because the design of the testing phase in this study was not intended to evaluate test article-related differences, the decision was made to limit the test cohort samples to control rats only. Further studies to validate this algorithm would include applying the algorithm to a case study with test article-related cardiotoxicity to determine the algorithm’s ability to identify group-related differences.
The integration of AI-driven image analysis algorithms into the toxicologic pathology workspace presents a variety of possibilities and challenges. Certainly, further investigation is needed to address how severity grading traditionally employed by pathologists relates to the quantitative output that can be achieved through this technology. This work provides a basis for beginning to refine that relationship in the context of rodent PCM. This study also presents a model for applying automated image analysis algorithms to detect and quantify other spontaneous background findings in rodents, such as chronic progressive nephropathy. On a broader level, the use of AI-driven analysis in toxicity studies offers the potential to integrate histomorphology data with other data sets, such as genomic or metabolic data. 30 Such integration could reveal novel relationships between such data and histomorphology or provide insights into toxicologic mechanisms of action.
Supplemental Material
Supplemental Material, sj-docx-1-tpx-10.1177_0192623320972614 - Using Artificial Intelligence to Detect, Classify, and Objectively Score Severity of Rodent Cardiomyopathy
Supplemental Material, sj-docx-1-tpx-10.1177_0192623320972614 for Using Artificial Intelligence to Detect, Classify, and Objectively Score Severity of Rodent Cardiomyopathy by Debra A. Tokarz, Thomas J. Steinbach, Avinash Lokhande, Gargi Srivastava, Rajesh Ugalmugle, Caroll A. Co, Keith R. Shockley, Emily Singletary, Mark F. Cesta, Heath C. Thomas, Vivian S. Chen, Kristen Hobbie and Torrie A. Crabbs in Toxicologic Pathology
Supplemental Material
Supplemental Material, sj-tif-1-tpx-10.1177_0192623320972614 - Using Artificial Intelligence to Detect, Classify, and Objectively Score Severity of Rodent Cardiomyopathy
Supplemental Material, sj-tif-1-tpx-10.1177_0192623320972614 for Using Artificial Intelligence to Detect, Classify, and Objectively Score Severity of Rodent Cardiomyopathy by Debra A. Tokarz, Thomas J. Steinbach, Avinash Lokhande, Gargi Srivastava, Rajesh Ugalmugle, Caroll A. Co, Keith R. Shockley, Emily Singletary, Mark F. Cesta, Heath C. Thomas, Vivian S. Chen, Kristen Hobbie and Torrie A. Crabbs in Toxicologic Pathology
Supplemental Material
Supplemental Material, sj-xls-1-tpx-10.1177_0192623320972614 - Using Artificial Intelligence to Detect, Classify, and Objectively Score Severity of Rodent Cardiomyopathy
Supplemental Material, sj-xls-1-tpx-10.1177_0192623320972614 for Using Artificial Intelligence to Detect, Classify, and Objectively Score Severity of Rodent Cardiomyopathy by Debra A. Tokarz, Thomas J. Steinbach, Avinash Lokhande, Gargi Srivastava, Rajesh Ugalmugle, Caroll A. Co, Keith R. Shockley, Emily Singletary, Mark F. Cesta, Heath C. Thomas, Vivian S. Chen, Kristen Hobbie and Torrie A. Crabbs in Toxicologic Pathology
Footnotes
Acknowledgments
The authors are grateful to the following people for their excellent technical assistance: Tijo Thomas and Uttara Joshi of AIRA Matrix Private Limited; Sandra McBride and Shawn Harris of Social and Scientific Systems.
Declaration of Conflicting Interests
The author(s) declared no potential conflicts of interest with respect to the research, authorship, and/or publication of this article.
Funding
The author(s) received no financial support for the research, authorship, and/or publication of this article.
Supplemental Material
Supplemental material for this article is available online.
References
Supplementary Material
Please find the following supplemental material available below.
For Open Access articles published under a Creative Commons License, all supplemental material carries the same license as the article it is associated with.
For non-Open Access articles published, all supplemental material carries a non-exclusive license, and permission requests for re-use of supplemental material or any part of supplemental material shall be sent directly to the copyright owner as specified in the copyright notice associated with the article.