
Abstract
Spontaneous rodent progressive cardiomyopathy (PCM) in the Sprague Dawley rat may confound identification and/or interpretation of potential test article (TA)-related cardiotoxicity. Pathologists apply diagnostic term(s) and thresholds for diagnosing and assigning severity grades for PCM and/or PCM-like (PCM/like) lesions consistently within a study, which is necessary to identify and interpret TA-related findings. Due to differences in training and/or experiences, diagnostic terms and thresholds may vary between pathologists. Harmonized terminology and thresholds across studies will generate better historical control data, will likely enhance interpretation of study data, and may further enhance our understanding of the spontaneous change. An assessment of the diagnostic approaches of a group of 37 pathologists identified an approach that is relatively easily applied; and if adopted, it could enhance diagnostic consistency across studies. This approach uses the single “slash” term “necrosis/inflammatory cell infiltrate (NICI)” as the diagnosis for the spectrum of lesions seen in younger rats, uses no threshold for diagnosis (e.g., diagnose all lesions clearly identifiable as PCM/like), and uses aggregate lesion size of approximately ≥45% of the field of view (FOV) using a 10×/22 eyepiece and the 40× objective or approximately ≥100% of the FOV using the 60× objective as the criterion separating minimal from mild severities.
Keywords
The potential for drug-associated cardiotoxicity is a major concern for the pharmaceutical industry, and there are continued efforts to deepen our understanding of animal models used to assess this potential as well as to better predict and prevent cardiotoxic events in patients. Among numerous cardiovascular end points evaluated during drug development, microscopic examination of the heart in nonclinical toxicology studies remains important. Of course, additional factors (e.g., biomarker changes) are also important and are considered as part of the “weight of evidence” for assessing test article (TA) relatedness and/or human relevance, however, are beyond the scope of this article.
This article will focus on rats from short-term studies (approximately 1 month duration; rats up to 4 months old). Histological evaluation of the heart in laboratory rats and mice is complicated by the variable presence of a spontaneous lesion of undetermined etiology often referred to as progressive cardiomyopathy (PCM). It occurs in both genders but is more common in males. In rats, it occurs in young animals (Chanut et al. 2013) and typically increases in incidence with age (Fairweather 1967; Burek 1978). PCM occurs throughout the myocardium with a spectrum of morphologies ranging from individual degenerative/necrotic myofibers to larger areas of myocardial degeneration/necrosis with varying quantities of lymphohistiocytic inflammatory cell infiltrates and fibrosis (Jokinen et al. 2011; Chanut et al. 2013). Because of this broad morphological range, and the fact that the heart has a limited injury response repertoire, subtle TA-related lesions may appear histologically similar to PCM (Greaves 2000; Ruben et al. 2000). This may be due to a compound causing injury via a similar mechanism and/or exacerbation of PCM (Jokinen et al. 2011). Furthermore, dose-dependent TA-related cardiac toxicities that are morphologically distinctive from PCM at higher severities may appear similar to PCM at lower severities. Therefore, separation of potential TA-related cardiotoxicity from PCM requires a comprehensive understanding of the spectrum of PCM and consistent application of an appropriate diagnostic approach. From this point forward, for the purposes of this article, PCM will be used for the spontaneous change and PCM/like for a change that may be spontaneous and/or TA related. “Diagnostic approach” as used in this article refers to the components of a diagnosis (locator, morphologic descriptor, and modifiers [sublocators, distribution, and severity]) used and the criteria necessary for making various parts of a diagnosis. Decisions typically made in diagnosing the spectrum of morphologies comprising PCM include: (a) what morphologic term or terms to use for the various morphologies, and the criteria to insure consistent application of the chosen term(s); (b) whether or not to use a threshold for diagnosing smaller lesions and if a threshold is used, criteria to insure consistent application of the threshold; and (c) which modifiers to use, and the criteria to insure consistent use of modifiers, particularly for separation of different severity lesions, as severity grades are invariably included in diagnoses.
The basic tenet of toxicologic pathology, and therefore the primary objective of any diagnostic approach for findings in any organ from nonclinical toxicology studies, is to accurately identify and properly communicate TA-related findings. Because each study is unique, pathologists must retain the latitude to evaluate an organ and/or study in a manner that accomplishes this objective for each study. During histological evaluation, all pathologists use criteria for diagnosing or not diagnosing (thresholding) lesions and/or separating severity scores, as defined in nomenclature guidelines or self-defined as dictated by study findings and professional experiences. For any given set of lesions (e.g., PCM/like lesions), this is acceptable as long as the pathologist is consistent within the study. However, there are potential advantages to using a harmonized diagnostic approach within an organization and/or across the Toxicologic Pathology community. PCM/like lesions lend themselves to a harmonized diagnostic approach under most circumstances. However, determining a specific approach that would be appropriate under most study conditions, and defining criteria for diagnosis and/or for severity grades that can be applied consistently by pathologists, is challenging.
In this article, we evaluate all aspects of the diagnostic approach for PCM/like lesions, as the pros and cons of the following questions are discussed: (a) would a harmonized diagnostic approach for PCM and PCM-like lesions provide meaningful advantages over varied approaches? (b) does a single diagnostic term or multiple diagnoses covering the spectrum of PCM/like lesions facilitate the most accurate interpretation of study data? (c) which diagnostic term(s) best reflects the spectrum of PCM lesions? (d) at what point in the continuum should PCM/like lesions be considered greater than minimal severity? And (e) should a threshold be used to diagnose PCM/like lesions, and if so, what should the threshold be?
We conclude 1 reasonable approach that reflects the approach of the majority of 1 group of pathologists. It is not intended as prescriptive or as a universal solution rather as a consistent method that may prove useful to others in the Toxicologic Pathology community. The authors recognize that there are numerous variables that may impact the diagnostic approach in individual situations, including animal strain, age, husbandry conditions, time, sectioning approach, group variability, and evolution of the spontaneous disease.
Material and Method
To understand professional preference for applying diagnostic terminology and thresholds, mock studies (studies #1 and #2) were created with digital slide images of rat hearts to simulate a typical result scenario from short-term toxicology studies in Sprague Dawley (SD) rats. Thirty-seven pathologists with varied training and experience, but from a single company, were provided digital slide sets (whole-slide images) of standard heart sections from mock 1-month toxicology studies, a lexicon of cardiac diagnostic terminology developed by GlaxoSmithKline (GSK) pathologists which was available from the pathology data system used to collect histopathology data (2009, before International Harmonization of Nomenclature and Diagnostic Criteria [INHAND] terminology), and a standardized spreadsheet for reporting. The available grading scale included minimal, mild, moderate, marked, and severe; some laboratories use slight synonymously with mild. All slides for the mock studies were obtained from archived study material of prior studies completed at GSK. The original studies were conducted in accordance with the GSK Policy on the Care, Welfare and Treatment of Laboratory Animals and were reviewed by the Institutional Animal Care and Use Committee at GSK. Because lesions from mock study #1 are not necessary for demonstration purposes, and to avoid potential sensitivity, all figures are from control animals from a multisite study conducted by GSK (Chanut et al. 2013).
All participants were anonymized with no knowledge of the origins of the mock slide sets, were instructed to perform the exercise individually as if they were evaluating an actual toxicology study, and were given a feedback form to explain their rationale for terminology and threshold choices.
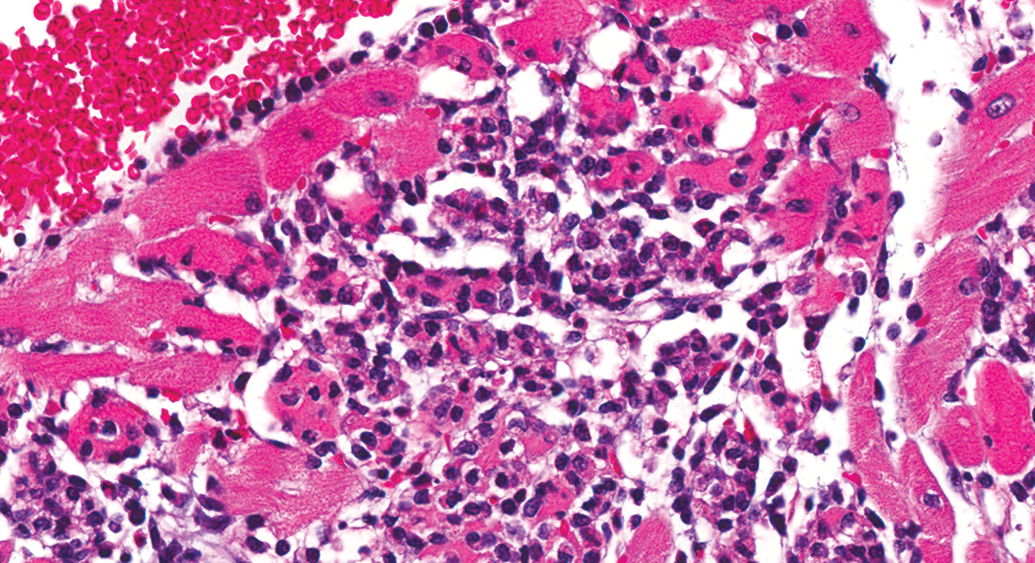
Mock studies #1 and #2 were set up as parts of an overall endeavor to better understand PCM and differentiation of PCM from subtle TA-related effects. Mock study #2 was designed to show no effect across groups, and results are not discussed in this article. For mock study #1, slides containing Hemotoxylin and Eosin (H&E)-stained sections of hearts (prepared by routine methods for standard rodent toxicology studies; Figure 1) were compiled from various prior oral gavage studies of ≤1-month duration in male SD rats. Study #1 had a control and 3 dose groups of 10 rats per group. Hearts were selected to depict a “positive” TA effect in which the incidence and/or severity of heart lesions were greater in the high-dose (HD) group and of lesser clarity (equivocal) in the low-dose (LD) and mid-dose (MD) groups. Participants were asked to assume that there were no other signals of cardiotoxicity (e.g., increased serum troponin) and that systemic exposure levels of TA were proportional to dose. The heart sections were scanned at 20× magnification using an Aperio ScanScope XT (Figure 1 shows scanned image), and each pathologist examined the digital whole-slide heart images from this study using Aperio Spectrum™ and ImageScope™.
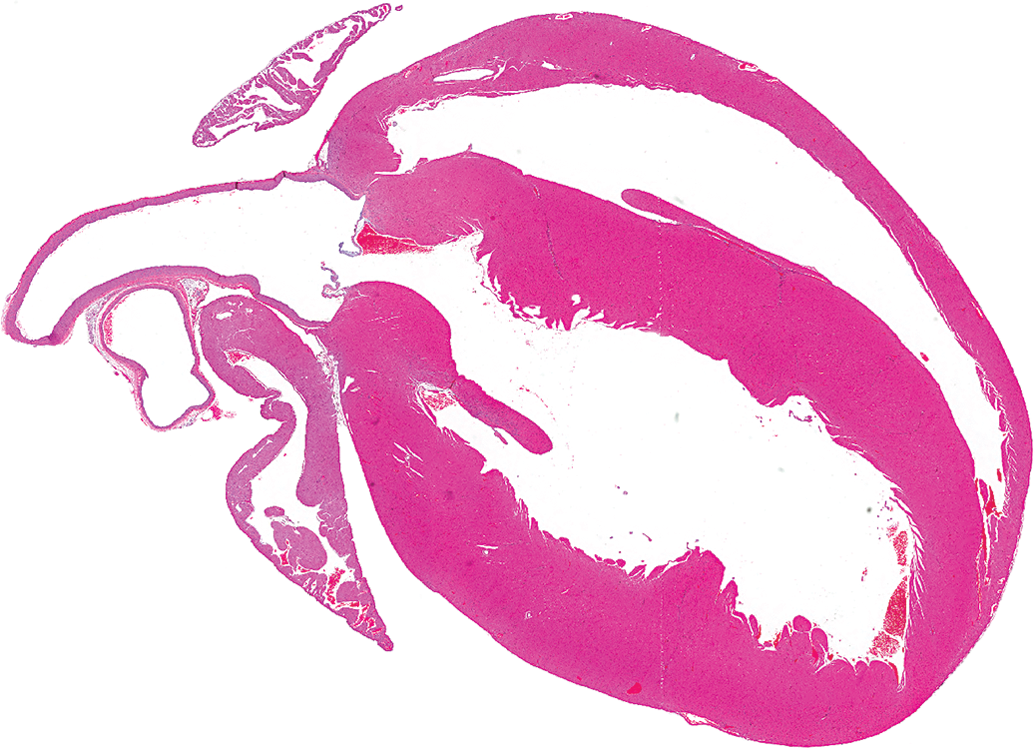
Control male Sprague Dawley rat from a GSK multisite study; this is representative of the sectioning for these studies.
Additionally, participants were asked to respond to the following questions: Was there a TA-related effect, and if so, in which groups? Did you use a threshold for determining which cardiac findings to record, why or why not, and if so, describe your threshold? If you found histologic alterations, why did you use the terminology you did to describe the changes? and If you found a TA-related effect on the heart, how would you describe it in a pathology report?
Participant votes were tallied as if it were a large Pathology Working Group. If the majority of participants made a diagnosis consistent with PCM, the heart from that animal was considered positive. Although most participants used “cardiomyopathy” as their diagnosis for the spectrum of PCM lesions, other diagnoses (e.g., “degeneration/necrosis,” “inflammatory cell infiltrate,” “fibrosis”) consistent with PCM were used by some and therefore constituted a positive vote. Similarly, the severity grade assigned to the diagnosis of the lesion(s) within the heart of an individual animal was based on the majority vote.
To facilitate further analysis of study #1, a separate quantitative evaluation of the hearts from each of the animals from study #1 was conducted by 1 of the authors (Hailey) openly following completion of the exercise. In this quantitative evaluation, all lesions, no matter how minimal in size or character, that could confidently be considered equivalent to PCM were recorded and measured. Confidence to record required the presence of a degenerate/necrotic myofiber with a cellular response or an inflammatory cellular infiltrate or fibrotic change that was clearly a part of the known spectrum of PCM. If there was uncertainty as to whether a morphologic change was PCM, it was not diagnosed. The approximate length and width (ruler tool used) of each lesion were measured (microns; Figure 2), and the approximate dimensional area was calculated for each lesion. Areas for all lesions (aggregate) were totaled for the heart from each animal, and areas for all animals were totaled for the group. Table 1 gives a more detailed account of the quantitative evaluation of the hearts including animal numbers, number of lesions per animal, total lesion area per animal, average lesion area per animal in a group, and total lesion area per group. Whether a lesion was diagnosed by the group majority, and whether minimal or mild, is also included in this table. These majority diagnoses were compared to the calculated areas to determine size thresholds for diagnosing or not diagnosing a lesion and for assigning minimal or mild severity grade.
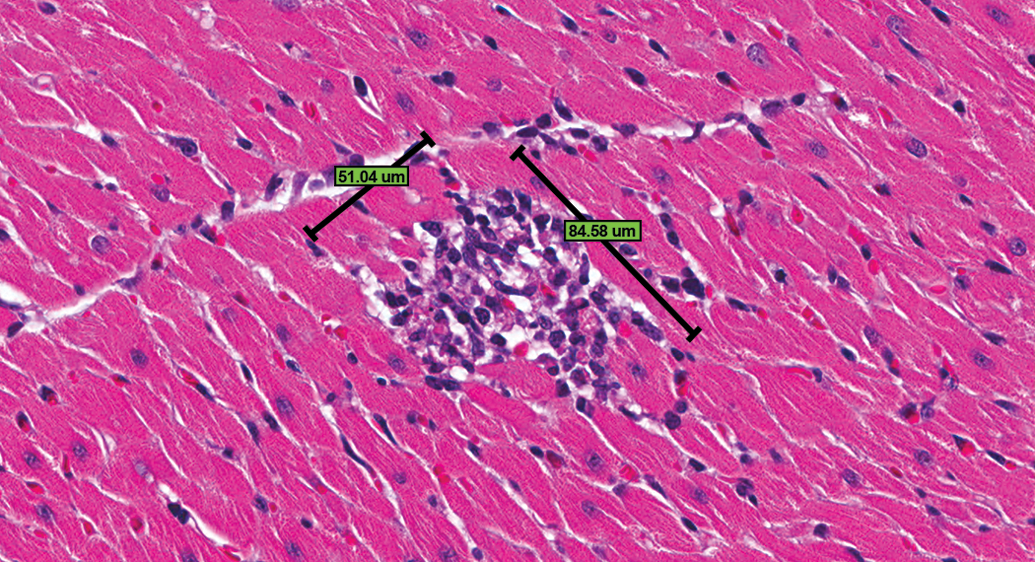
Control male Sprague Dawley rat from a GSK multisite study; note the approximate length and width measurements of a progressive cardiomyopathy lesion using the Spectrum ruler tool (H&E).
Quantitative Assessment of Heart Lesions from Study #1 Reconciled with the Majority Vote (Number of Lesions Established through Quantitative Analysis Only).
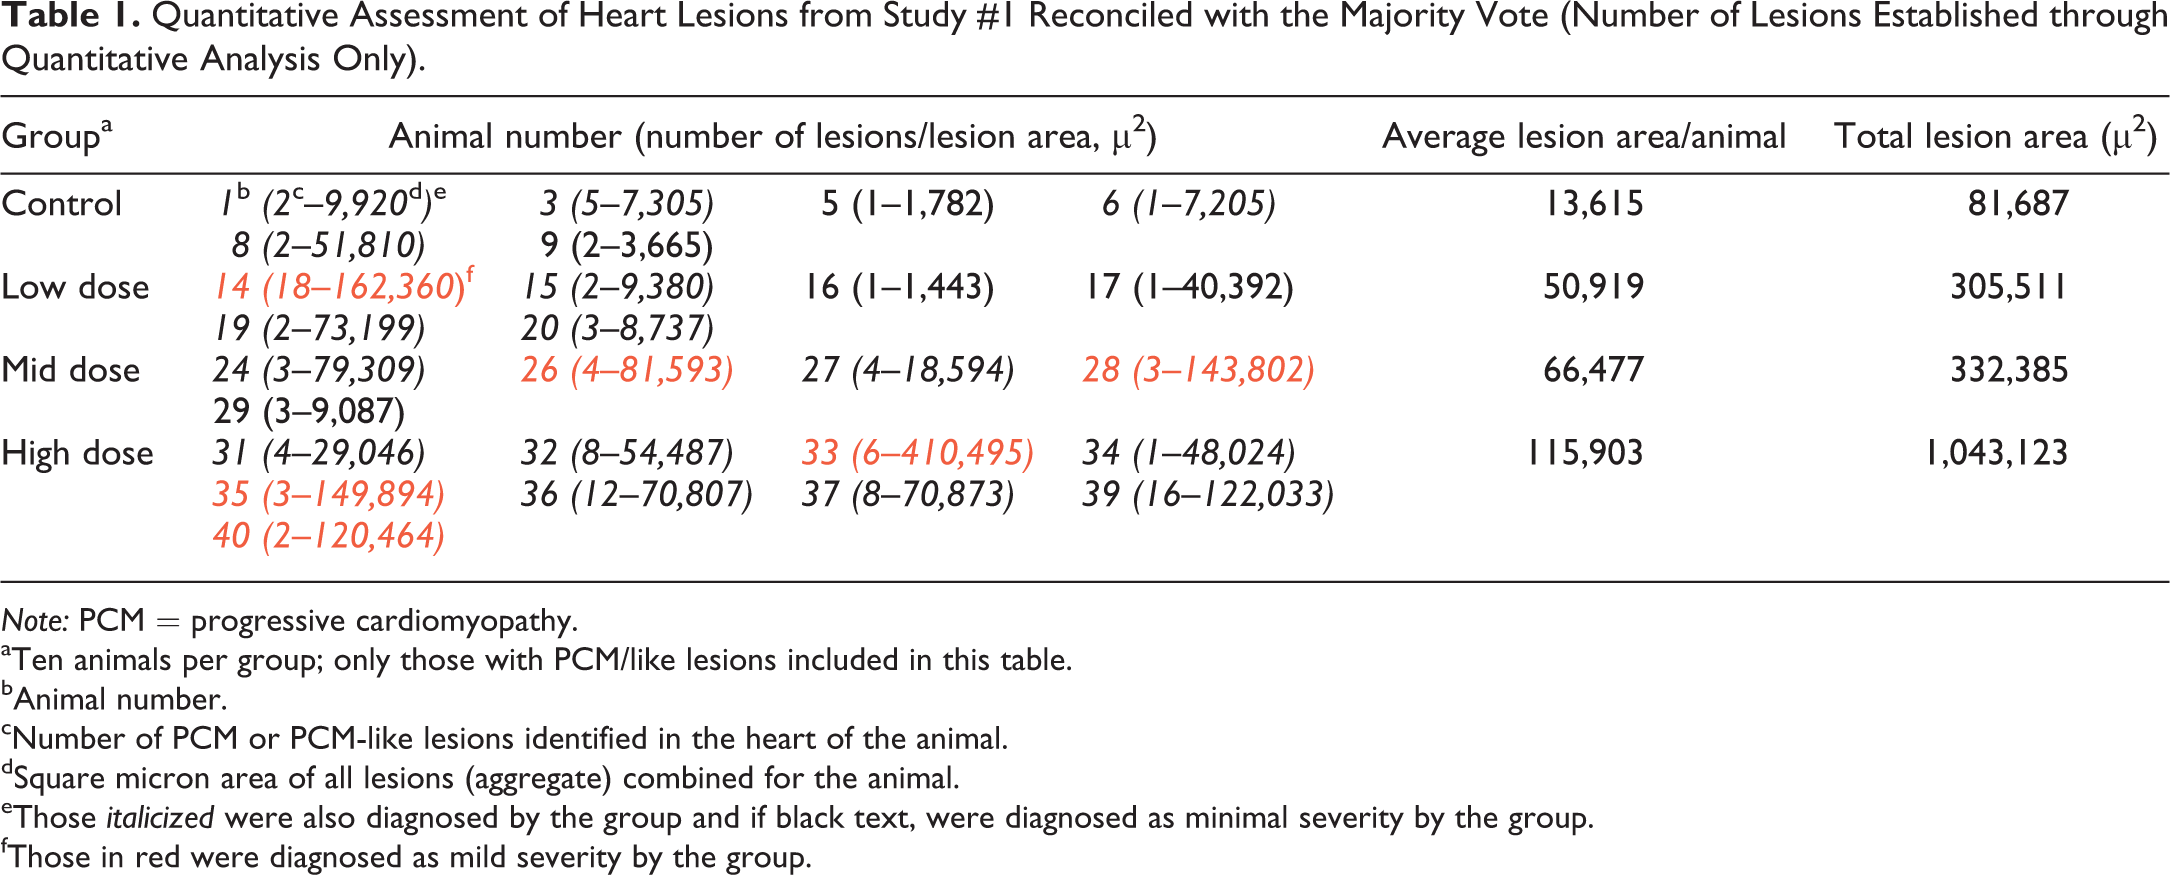
Note: PCM = progressive cardiomyopathy.
aTen animals per group; only those with PCM/like lesions included in this table.
bAnimal number.
cNumber of PCM or PCM-like lesions identified in the heart of the animal.
dSquare micron area of all lesions (aggregate) combined for the animal.
eThose italicized were also diagnosed by the group and if black text, were diagnosed as minimal severity by the group.
fThose in red were diagnosed as mild severity by the group.
The quantitative assessment does not capture the 3-dimensional aspect of a lesion, however, using the 2-dimensional plane of section as a sampling tool allows for a reasonably objective and pragmatic method of comparison between groups and for comparing to the consensus of the group. This quantitative approach has limitations and is not recommended as an investigative method to determine lesion volume nor as a standard practice for toxicologic pathology assessment of routine studies. However, this method allowed a simple analysis of participant threshold for PCM/like lesion diagnosis and distinction of minimal from mild severity based on 2-dimensional area when lesion characteristics were otherwise similar.
Results/Discussion
Would a Harmonized Diagnostic Approach for PCM and PCM-like Lesions Provide Meaningful Advantages over Varied Approaches?
Within the Toxicologic Pathology community, the diagnostic approach for PCM across studies is currently not consistent (Keenan et al. 2010; Elmore et al. 2016), and similarly pathologists’ approaches varied for this mock study #1. Historical control incidence data (HCD) may be helpful in contextualizing study findings, whether TA related in the HD group, or determination of the no observed effect level (NOEL)/no observed adverse effect level (NOAEL) in a lower-dose group. However, mining, interpreting, and communicating HCD are made more difficult when varying diagnoses for PCM have been used (e.g., cardiomyopathy, degeneration/necrosis, or mononuclear cell infiltrate). While most study #1 participants used a single diagnosis (generally cardiomyopathy) for the spectrum of PCM/like lesions, some used a combination of diagnoses. Also, if different thresholds for diagnosing PCM are used by different pathologists within an organization, reliable HCD can only be generated by inclusion of studies from pathologists using the same threshold or by rediagnosing a selection of controls from similar studies by a single pathologist applying uniform threshold criteria. For example, thresholds for diagnosing PCM/like lesions in study #1 ranged from no threshold (all PCM/like lesions diagnosed) to only diagnosing PCM/like lesions when their severity exceeded the greatest severity observed in the concurrent control group.
While HCD (incidence and/or severity) generated from a harmonized diagnostic approach should be more robust than those generated from variable approaches, there are other variables that can affect the reliability and/or utility of HCD, including time, husbandry, and vendor source. Therefore, the most relevant (in-house) and contemporary (reasonable time span) HCD should be used when interpreting potential TA-related findings (Keenan et al. 2009).
As there is a relatively high spontaneous incidence of PCM in male SD rats, severity grades may also be instrumental in assessing TA-related effects, particularly for subtle effects (e.g., determining the dose at which the finding does not occur). The highest severity of PCM/like lesions identified in all groups by the majority in study #1 was mild (some larger lesions were voted as moderate severity by a minority of participants), yet many participants mentioned “severity” as a factor that influenced their interpretation of the data; therefore, for PCM/like lesions, subtle differences in severity can be a distinguishing criterion.
Within study #1, there was excellent agreement among participants relative to identification of a TA-related increased incidence in the HD group, the most important end point (Table 2). As determined by their answers to the questions, and the average severity scores for the majority vote (Table 2), participants varied in identification of the dose in which the finding was not considered TA related (i.e., NOEL) within study #1. The positive outcome in the HD group and less definitive outcome in intermediate groups are generally reflected in the quantitative data (Table 3). The quantitative analysis shows a similar incidence, and although the average lesion area per affected animal is greater in the intermediate dose groups compared to controls, overall, the lesions are small. As per intended design, the very subtle nature of any differences in severity between the 2 intermediate dose groups and the control group clearly contributed to the variability in interpretation, however, varying practices among participants for use of diagnostic thresholds and/or severity grade criteria likely contributed as well. For example, when responding to a query as to how they would address their findings/conclusions within the pathology report, 2 participants responded as follows: participant A: “Increased incidence of cardiomyopathy in group 4. Even though there was 1 lesion graded as mild, the overall severity in group 4 was still within what is seen within historical controls for rats of this age.” Participant B: “In the heart, mild myofiber degeneration/necrosis with inflammatory cell infiltrate was observed in 5/10 animals in group 4, 1/10 in group 3, and 2/10 in group 2. A similar change of minimal severity was observed in all groups including controls. The increased severity of the change is indicative of an exacerbation of a spontaneous background change in this strain of rats.” The different thresholds for severity grades between these 2 pathologists apparently influenced their interpretation of the TA relatedness of the findings.
Majority Vote Results (Study #1): Incidence and Average Severity of Progressive Cardiomyopathy Lesions Within the Heart.
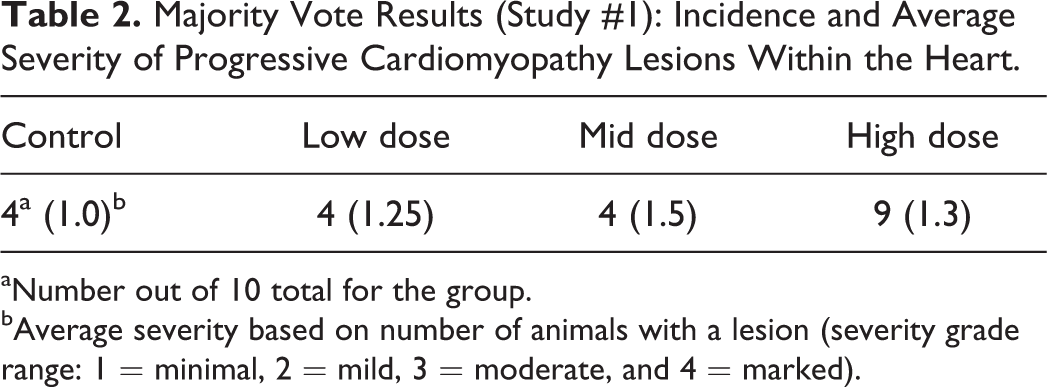
aNumber out of 10 total for the group.
bAverage severity based on number of animals with a lesion (severity grade range: 1 = minimal, 2 = mild, 3 = moderate, and 4 = marked).
Quantitative Assessment (Study #1): Incidence of Progressive Cardiomyopathy and Average Lesion Area per Affected Animal.
aNumber out of 10 total for the group.
bAverage lesion area (µ2) per affected animal.
In 1 sponsor’s HCD from short-term toxicity studies, the vast majority of PCM lesions were diagnosed as minimal severity. PCM of mild severity was identified in approximately 1/50 total animals with moderate severity rarely identified. Therefore, while mild severities do occur, the presence of 2 or more in a treatment group of 10 may arouse suspicion. If diagnostic criteria are more consistently applied for distinguishing minimal from mild lesions, the more useful this information may become in discerning potential TA-related effects.
Consistency of the diagnostic approach for PCM/like lesions within a study is most important for identifying TA-related effects. However, a harmonized diagnostic approach across studies for PCM/like lesions may provide a more reliable HCD that more accurately reflects influence of biologic source of variance distinct from pathologist preference to threshold, greater consistency interpreting subtle effects, and enhanced comparison and communication of data across studies. Use of similar terms and thresholds may further enhance our understanding and/or confidence of the range of PCM, therefore allowing refinement of the diagnostic approach as necessary. A harmonized approach must be pragmatic and relatively simple to apply, offer high sensitivity and specificity to the effects diagnosed, and promote consistency for thresholds that distinguish severity grades. While a harmonized diagnostic approach has advantages, pathologists must have the latitude to deal with TA-related effects on a case-by-case basis and evaluate the study in a manner that most appropriately accounts for and communicates TA-related effects.
Does a Single Diagnostic Term or Multiple Diagnoses Covering the Spectrum of PCM/Like Lesions Facilitate the Most Accurate Interpretation of Study Data?
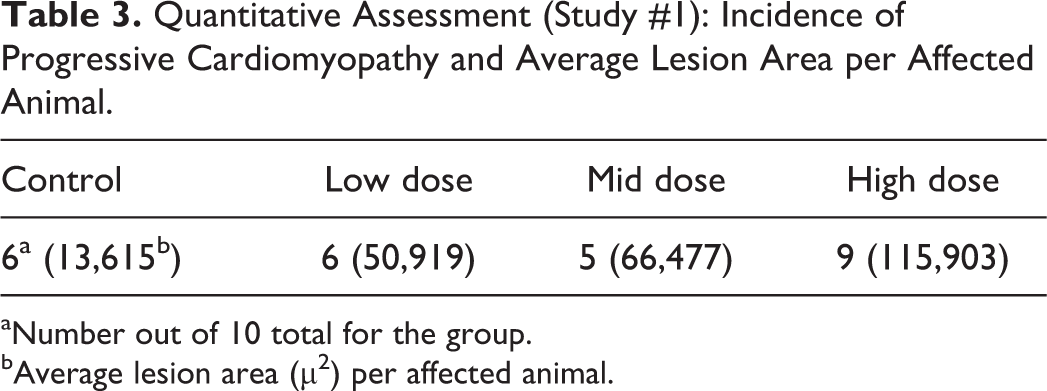
PCM in the rat refers to a spectrum of spontaneously occurring lesions throughout the heart that range from individual degenerative/necrotic myofibers to larger areas of myocardial degeneration/necrosis, lymphohistiocytic inflammatory cell infiltrates, fibrosis, occasional mineralization (Figures 2 –9), and various mixtures of these morphologies (Jokinen et al. 2011; Chanut et al. 2013; Elmore et al. 2016). However, not everyone agrees on the morphologies that comprise PCM, nor the distribution of the spectrum of PCM lesions within the heart (see participant comments below). Particularly, lesions observed in the epicardium/subepicardium of the right ventricle (Figures 6 –8) are considered by some, but not others, to be part of the spectrum of PCM (see part 2 of this article). The earliest event in the process is degeneration/necrosis of myocardial fibers followed by inflammatory cell infiltrate and subsequent fibrosis (Jokinen et al. 2011; Chanut et al. 2013). The most commonly identified morphological change is inflammatory cell infiltrate that can appear in isolation, as degenerate/necrotic myocardiocytes are replaced by the inflammatory cell infiltrate admixed with interstitial cells (Chanut et al. 2013). Although degeneration/necrosis can also occur in isolation of other morphological alterations, this is only true for the most acute lesions and, unless widespread and/or expected, cannot always reliably be separated from artifactual change (eosinophilic fibers; Figure 9) observed commonly in routinely fixed and processed heart tissue. Once inflammatory cells respond to the necrosis, a “degenerate/necrotic” lesion can be reliably separated from artifact.
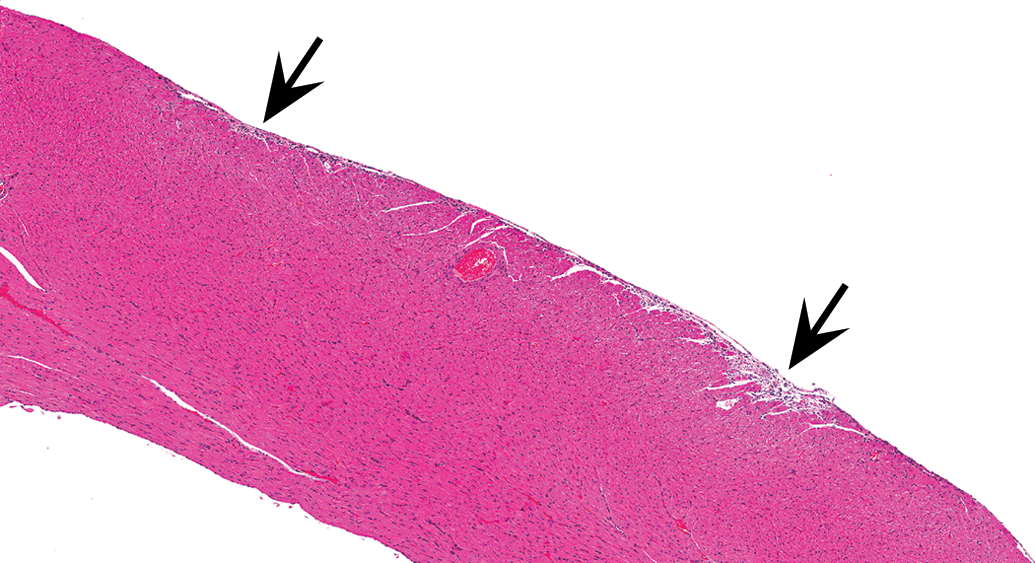
Control male Sprague Dawley rat from a GSK multisite study with a lesion comprised mostly of necrotic cardiomyocytes (arrows) and represents the earliest change identified in the development and progression of progressive cardiomyopathy (H&E).
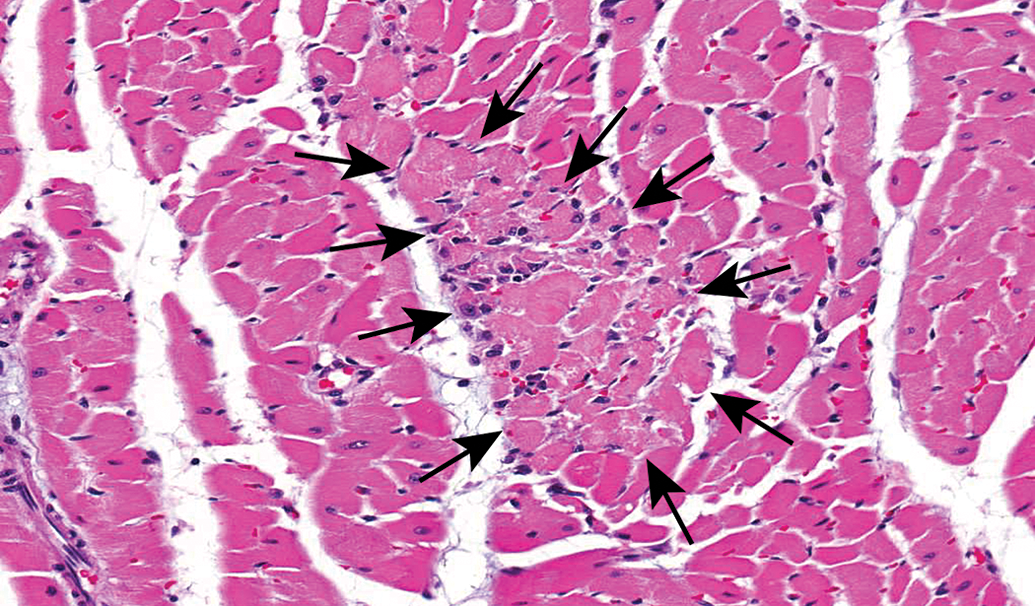
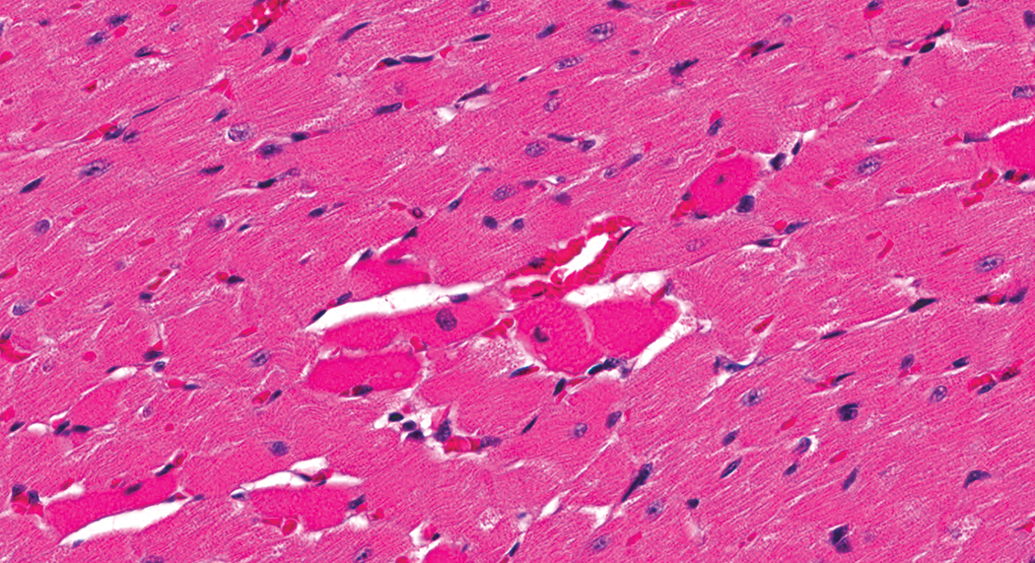
Control male Sprague Dawley rat from a GSK multisite study with a lesion comprised of a mixture of necrotic cardiomyocytes and inflammatory cell infiltrate and represents an intermediate stage in the progression of progressive cardiomyopathy (H&E).
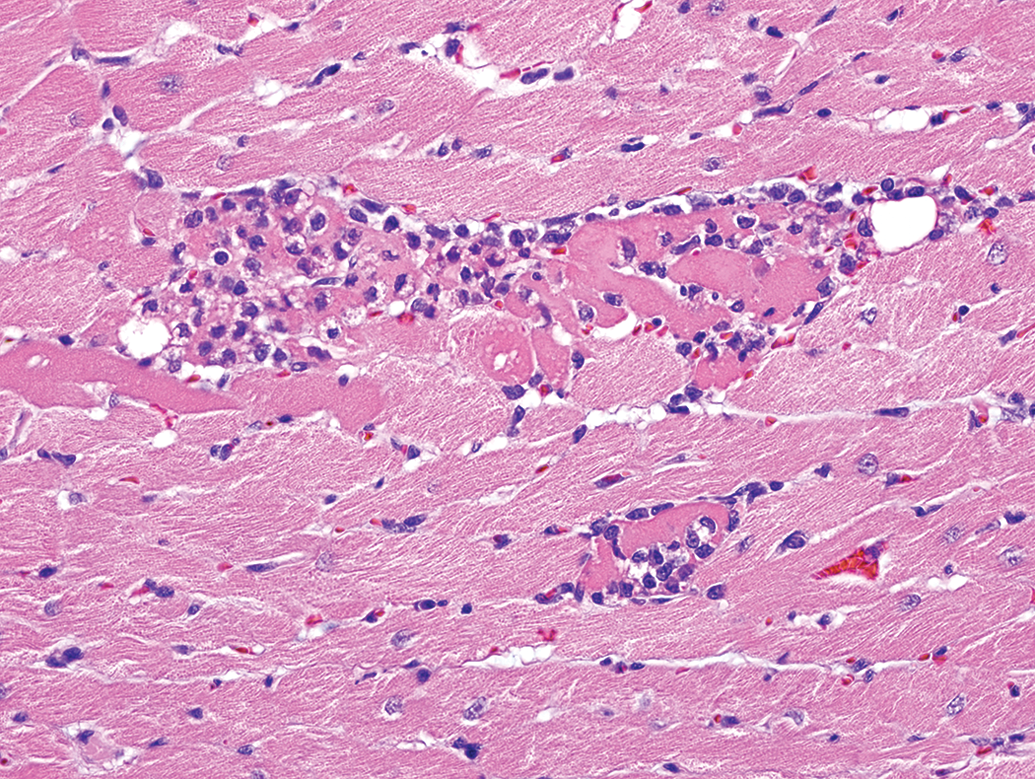
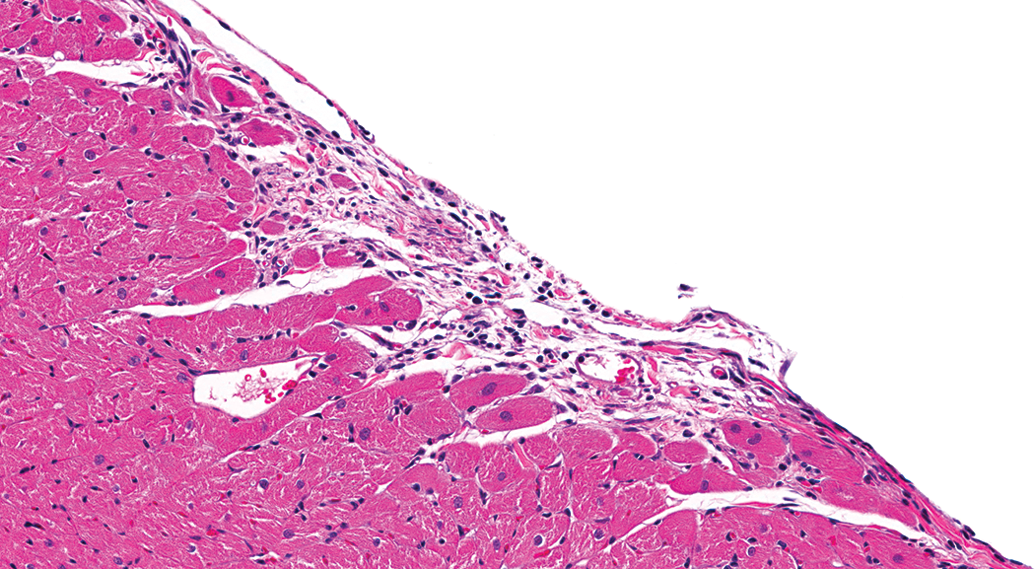
Control male Sprague Dawley rat from a GSK multisite study with a lesion comprised mostly of inflammatory cell infiltrate and represents an intermediate stage in the progression of progressive cardiomyopathy (H&E).
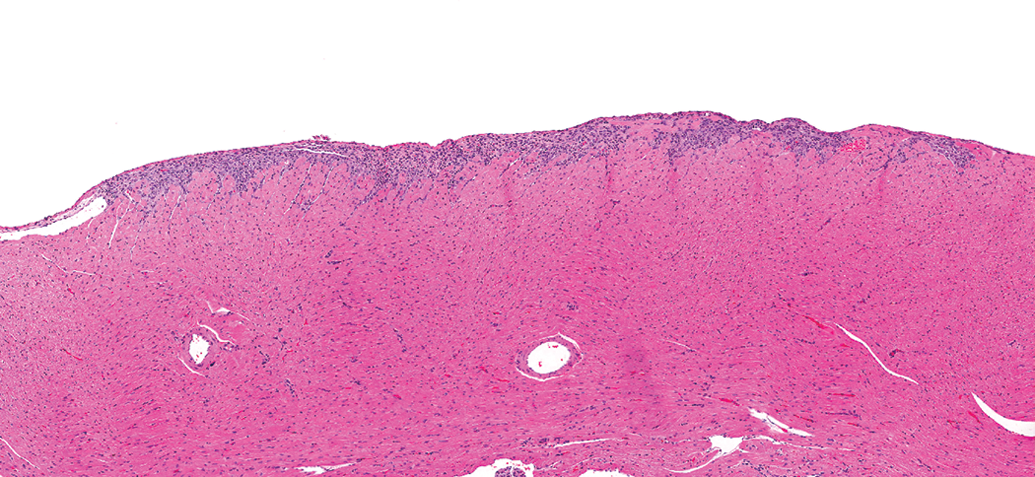
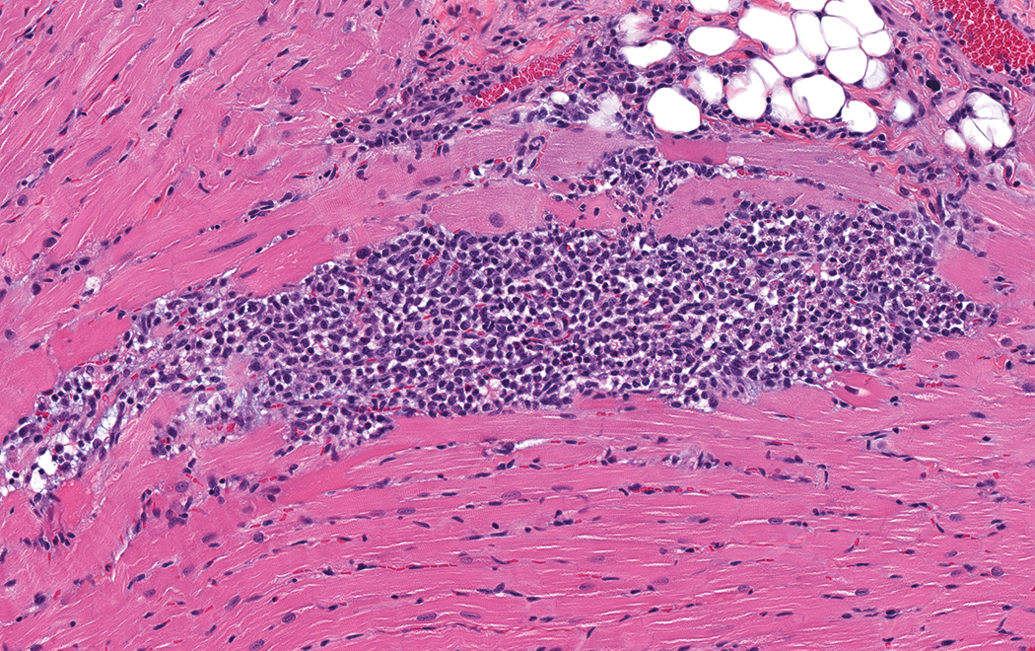
Control male Sprague Dawley rat from a GSK multisite study with a relatively large lesion in the epicardial/subepicardial region of the right ventricle comprised mostly of inflammatory cell infiltrate (H&E).
Control male Sprague Dawley rat from a GSK multisite study with a lesion in the epicardial/subepicardial region of the right ventricle comprised mostly of fibrosis and represents the end stage of a progressive cardiomyopathy lesion in the heart. Note a couple of slight depressions in the epicardial surface (arrows; H&E).
Higher magnification of Figure 6 demonstrating the fibrosis with minimal inflammatory cell infiltrate (H&E).
Control male Sprague Dawley rat from a GSK multisite study with hypereosinophilic myofibers (artifact) that often occur randomly in routinely fixed heart sections and may be difficult to distinguish from acute myofiber degeneration/necrosis (H&E).
Control male Sprague Dawley rat from a GSK multisite study with a lesion composed predominantly of inflammatory cell infiltrate, but with obvious degenerate/necrotic myofibers (H&E).
The following participant comments from study #1 reflect reasons/explanations for their use of term(s) for PCM/like lesions and the diversity of thought around this process: participant C: “Cardiomyopathy included loss of fibers/actual evidence of fiber degeneration/necrosis. Inflammatory cell infiltrate used if no evidence of fiber loss/damage.” Participant D: “Cardiomyopathy—left ventricular/intraventricular septum distribution of myocardial degeneration/necrosis/fibrosis; degeneration/necrosis—in locations not normally consistent with chronic progressive cardiomyopathy (e.g., right ventricle, atria—in the absence of significant LV lesions).” Participant E: “Degeneration/necrosis but only for lesions above/beyond cardiomyopathy: cardiomyopathy (background) thresholded out and those in groups 2, 3, 4 outside that background level diagnosed as degeneration/necrosis.” Participant F: “For degeneration/necrosis: used to describe when myofibers show evidence of vacuolation/myolysis/necrosis along with depletion of myofibers and inflammatory cell infiltrate to differentiate from typical cardiomyopathy lesion in young rats (small foci of inflammatory cell infiltrate which occasionally surround 1 to 3 degenerate/necrotic myofibers).”
Because of the varying morphologies of PCM, it is understandable that many (Keenan et al. 2010; Elmore et al. 2016) prefer and/or recommend (Berridge et al. 2016) use of multiple terms/diagnoses to more accurately characterize what is observed morphologically. However, as PCM is clearly a spectrum of change, while splitting the diagnoses provides a more accurate depiction of the morphological entity, in most instances, it is unlikely to provide biologically meaningful information. Additionally, the more diagnoses used to identify the spectrum, the more difficult it becomes to consistently define and apply diagnostic criteria for each diagnostic term. Interpretation of potential TA-related effects can also be confounded by the multitude of diagnoses, as there is greater potential to create false positive findings or mask true positive findings.
Use of multiple diagnoses requires establishment of more criteria for the process. Degeneration/necrosis, inflammatory cell infiltrate, and fibrosis are examples of 3 diagnoses that portray the 3 major morphologies of the spectrum. Many lesions have mixed morphologies, with degeneration/necrosis and inflammatory cell infiltrate as the most common combination in younger rats. With a mixed lesion in which the predominant change is inflammatory cell infiltrate, but with obvious degenerate/necrotic myofibers (Figure 10), would one use 2 diagnoses or diagnose only the predominate morphology? Also consider the inverse morphology, as in Figure 3, or Figure 4 that is approximately an even combination. With multiple lesions of differing morphology in the same animal, the diagnostic dilemma is more complicated. INHAND (Berridge et al. 2016) addresses these terminology issues with recommendations of 4 defined terms: (a) cardiomyocyte necrosis for pure necrosis and/or minimal cellular infiltrate, (b) necrosis/inflammatory cell infiltrate (NICI) when the infiltrate is prominent and evidence of cardiomyocyte necrosis is present, (c) mononuclear cell infiltrate/fibrosis for lesions in which fibrosis repair has begun, and (d) fibrosis for lesions in which inflammation has largely been resolved. However, “minimal infiltrates,” “prominent infiltrates,” “fibrosis has begun,” and “largely been resolved” are somewhat vague terms with varying meanings to different pathologists and are therefore unlikely to be applied consistently, although they are all part of the spectrum. Also, it remains unclear how the use of multiple diagnoses for the spectrum of change will yield biologically meaningful information. Defining and applying criteria for multiple diagnostic terms are difficult, therefore under most circumstances, a single diagnostic term is likely to result in the most accurate interpretation of study data. It is, however, important for pathologists to take note of anything outside the “normal” range of PCM (e.g., a shift in the morphological spectrum and/or distribution of lesions) and make adjustments to the diagnostic approach as warranted.
Which Diagnostic Term Best Reflects the Spectrum of PCM Lesions?
The diagnostic term “cardiomyopathy” is used by many pathologists, and this and similar terms (rodent PCM [RPCM]) are ingrained in the toxicologic pathology literature and understood by veterinary toxicologic pathologists. However, these terms reflect a spontaneous disease process, are not morphologic descriptors, and therefore are contrary to the INHAND general recommendation of using descriptive morphological terms. In addition, cardiomyopathy conveys a different meaning in human medicine, which may confuse physicians evaluating nonclinical data. Favoring the use of RPCM may help mitigate this confusion. Furthermore, diagnosing TA-related lesions that are morphologically indistinguishable from PCM is problematic. In this instance, should all lesions be diagnosed as PCM? Should all lesions be diagnosed with an alternative diagnostic term(s)? Should lesions that may be TA related be diagnosed differently from spontaneous lesions, and if so, how does one differentiate? RPCM as a collective term does have the advantage of covering the entire spectrum (including fibrosis) of PCM/like lesions and, therefore, may be best utilized in longer-term studies with varied non-TA-related spontaneous morphologies.
Identifying another single descriptive term that captures the spectrum of PCM is problematic, therefore the “slash” (intended as and/or), necrosis/inflammatory cell infiltrate (NICI), has been proposed as an alternative to cardiomyopathy (Chanut et al. 2013; Berridge et al. 2016). The slash term is descriptive and captures the majority of the morphological spectrum observed for PCM and is indicative of the pathogenesis. Although inflammatory cell infiltrate is the most common morphology of PCM, necrosis of cardiomyocytes is the primary event, and it is the precursor to the inflammatory cell infiltrate (Chanut et al. 2013) and subsequent fibrosis. Once necrosis is evident, inclusion of “degeneration” in the diagnosis would not add value.
In all possible short-term study outcomes, the use of NICI for the diagnosis of PCM and for TA-related findings morphologically indistinguishable from PCM is as suitable as the use of cardiomyopathy or “PCM” and arguably superior in some instances. It is descriptive, as recommended by INHAND, and minimizes potential misinterpretation by clinicians. An end-stage PCM fibrotic lesion is not readily captured by “NICI.” While not commonly identified in rats from 7- to 28-day studies, for a lesion approximately ≥80% fibrotic, a separate diagnosis of fibrosis may be used. This appears consistent with the INHAND (Berridge et al. 2016) recommendation. Diagnoses of NICI and fibrosis may be combined to convey incidences of PCM and/or for data analysis purposes.
At What Point in the Continuum Should PCM/Like Lesions Be Considered Greater than Minimal Severity?
For many good reasons, including animal and study variability, there are no published criteria for finite severity grading of most histopathologic end points. Pathologists generally implement standards rooted in the 4- or 5-point grading schematic but guided by study-specific findings coupled with the basic tenet of toxicologic pathology that is to accurately identify and properly communicate TA-related findings. These criteria can be influenced by individual training and/or experiences and may vary slightly between pathologists, as evidenced by participant comments mentioned previously, and severity grades assigned in study #1. At least 1 publication (Jokinen et al. 2011) describes criteria for separation of severities for PCM/like lesions. A calibration of severity grade to field of view (FOV) at select magnifications was feasible using the outcomes of study #1 and quantitative measures applied to the results. Study #1 participants independently reached a consensus view of lesions regarded as mild severity. This criterion can be applied to minimize bias in severity grading and was identified retrospectively (through quantitative measure) as an aggregate lesion size of approximately ≥45% of the FOV using the 40× objective and a 10×/22 eyepiece or approximately ≥100% of the FOV using the 60× objective.
In study #1, except for HD animal #39 (122,033 µ2), all hearts with aggregate PCM lesion sizes greater than 100,000 µ2 were diagnosed as mild severity (identified by red print in Table 1), and except for MD animal #26 (81,593 µ2), all below 100,000 µ2 were diagnosed as minimal (identified by black print in Table 1). This numerical threshold was applied to the quantitative data, therefore allowing determination of a severity score for each animal and an average severity score for the group (Table 4). Similarly, these thresholds were applied to lesions identified by the majority vote, and average group severity scores were determined (Table 4).
Comparison of Average Severity Scores of Progressive Cardiomyopathy for Both the Majority Vote and Quantitative Exercise Using 100,000 µ2, 50,000 µ2, or 150,000 µ2 as the Threshold for Separation of Minimal and Mild Severities.
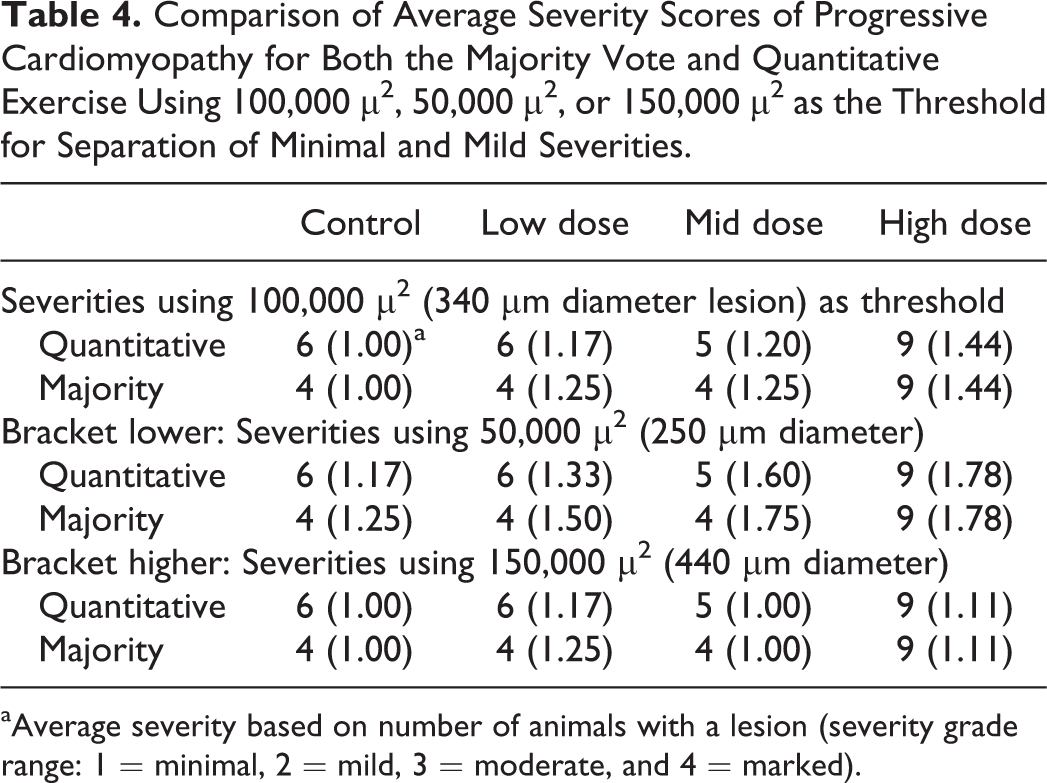
aAverage severity based on number of animals with a lesion (severity grade range: 1 = minimal, 2 = mild, 3 = moderate, and 4 = marked).
While 100,000 µ2 was identified as the threshold used by the majority of pathologists to separate minimal from mild severity, these data allow us to “test” lower (50,000 µm2) or higher (150,000 µm2) thresholds and determine how they potentially impact the study data interpretation (Table 4). Application of 50,000 µ2, a lower threshold, is less reflective of the quantitative and majority vote data, as there is greater separation of severities between groups 2 and 3 than actually exists and less separation in severity between groups 3 and 4. Importantly, aggregate lesions in 1 control animal would be categorized as mild, and the lesions in this heart were either not diagnosed or diagnosed as minimal by most participants. Similarly, in lowering the threshold to 50,000 µ2, some lesions considered minimal by the overwhelming majority of participants moved up into mild severity. With 150,000 µ2 as the threshold between minimal and mild, most lesions would be categorized as minimal with little separation of average severities between groups (Table 4). This is contrary to the quantitative and majority vote data, both of which showed a clear difference between control and the HD group. In contrast, application of 100,000 µ2 as the divide provides an excellent representation of the quantitative and majority vote data, as modest increases in severity were observed in groups 2 and 3 with a more substantive increase in group 4.
Fortuitously, 100,000 µ2 is roughly equivalent to the FOV (approximately 106,000 µ2) using the 60× objective and a 10×/22 eyepiece (ocular; 600× magnification). Because the FOV at 600× provides an objective method of assessing lesion size and use of 106,000 µ2 as the threshold would make no difference in the analysis of the data within these exercises, 106,000 µ2 (FOV using 10×/22 eyepiece and 60× objective) is suggested as the threshold for separation of minimal from mild lesions (Figure 11A). The 106,000 µ2 fills approximately half (45%) of the FOV (approximately 237,000 µ2; Figure 11A), using a 10×/22 eyepiece and the 40× (400× magnification) objective. For perspective, Figure 11B demonstrates approximately 106,000 µ2 using the 10×/22 eyepiece and 4× (40× magnification) objective, the magnification many use for their initial microscopic examination of heart tissue.
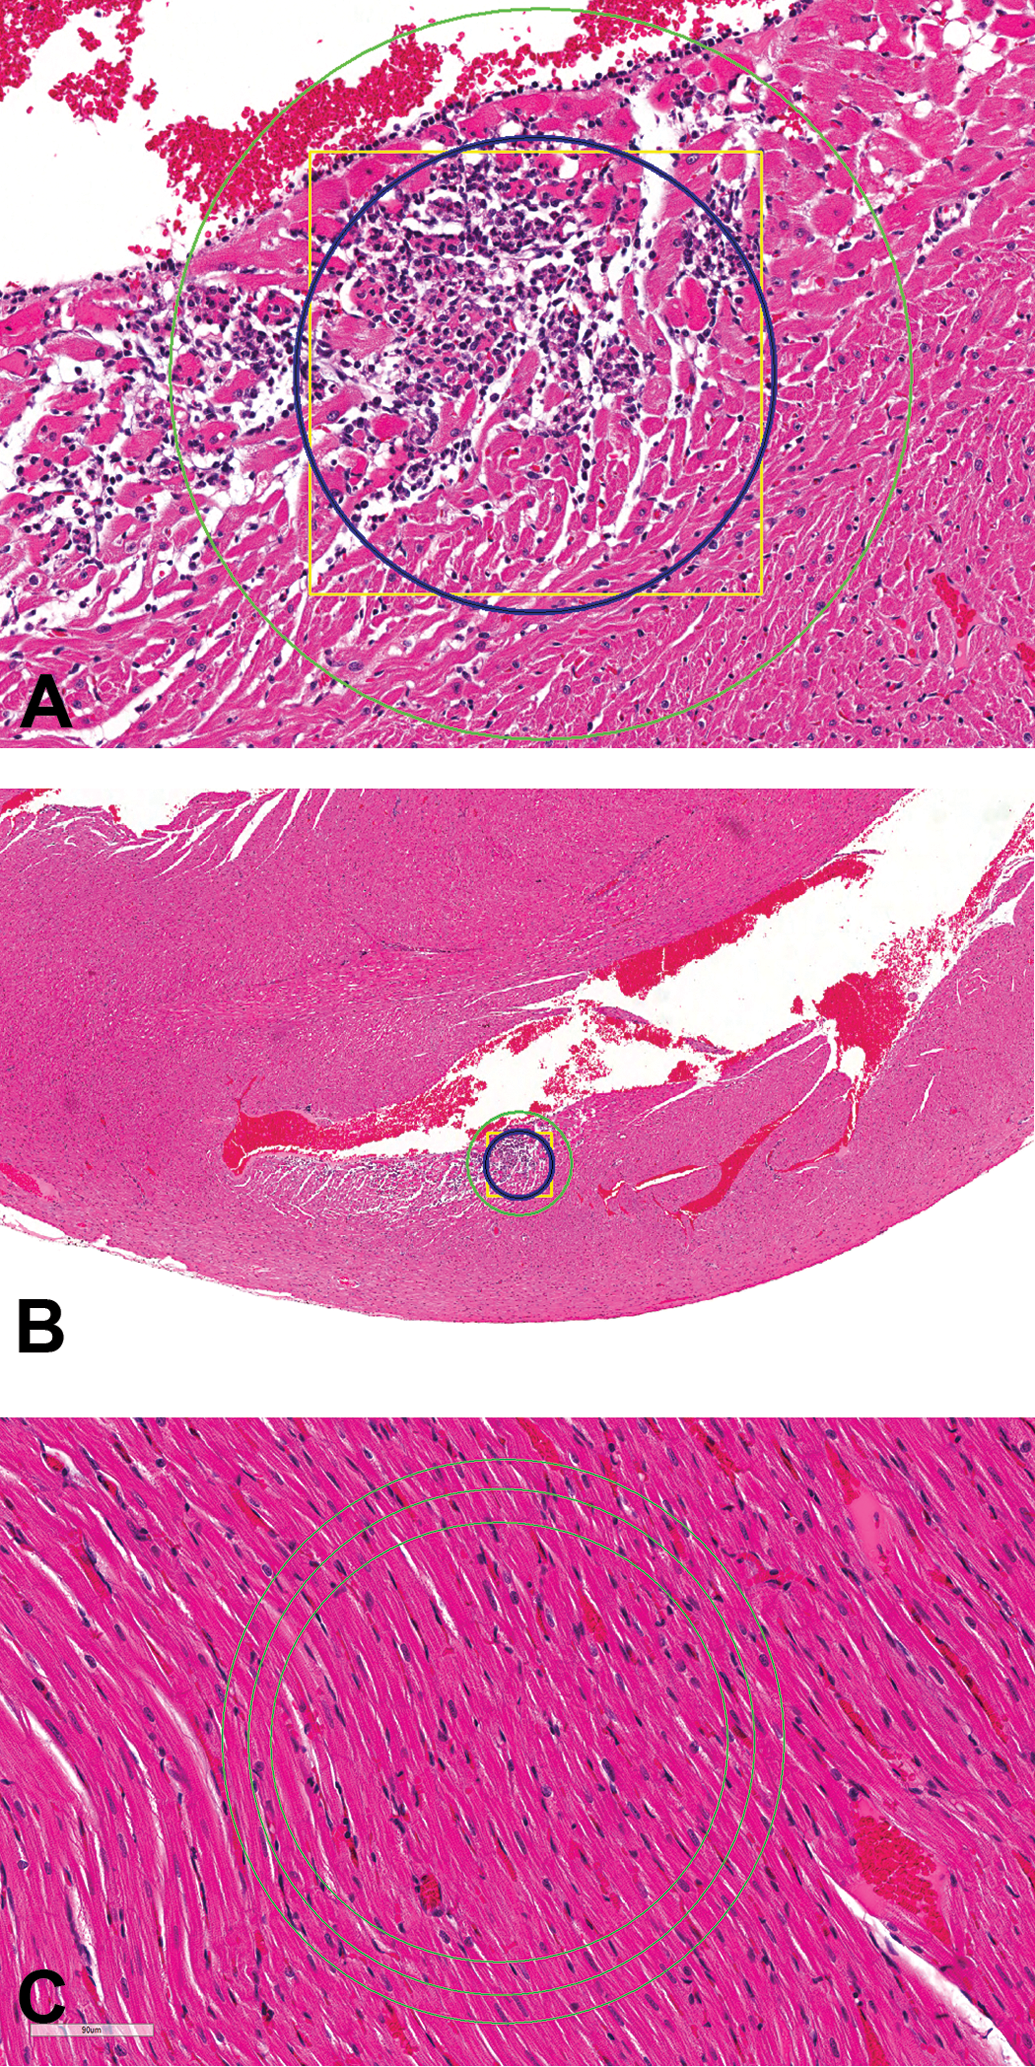
(A) Control male Sprague Dawley rat from a GSK multisite study: the square yellow box (approximately 326 µ × 326 µ) equals approximately 106,000 µ2, the inner blue circle (approximately 106,000 µ2) represents the field of view (FOV) from a microscope with a 10×/22 eyepiece and 60× objective, and the outer green circle represents the FOV (approximately 237,000 µ2) at 40× (H&E, 172×). (B) Control male Sprague Dawley rat from a GSK multisite study: for perspective, (A) is shown at 40×, the magnification many use for initial examination of the heart (H&E, 40×). (C) Control male Sprague Dawley rat from a GSK multisite study demonstrating FOV differences: the middle circle represents the FOV (approximately 106,000 µ2) using a 10×/22 eyepiece and 60× objective. The inner circle represents the FOV (approximately 85,000 µ2) using a 10×/20 eyepiece, and the outer circle represents the FOV (approximately 133,000 µ2) using a 10×/25 eyepiece (H&E).
The most common microscope eyepiece used by pathologists has 10× magnification and a field number of 22. Use of a different magnification is uncommon; however, field numbers may range from 18 to 26.5 with 20, 25, and 26.5 occasionally used. Different magnifications and/or field numbers affect the FOV. With the 60× or 40× objectives, a field number down to 20 or up to 25 reflects approximately 20% (range from 17% to 23%) difference in the FOV, therefore an adjustment must be made. Figure 11C demonstrates the approximately 20% difference in the FOV with a 60× objective and 10× eyepiece with field numbers 20, 22, and 25. The FOV with a 10× eyepiece with a 26.5 field number is approximately 30% greater than a 10× eyepiece with a 22 field number.
Most PCM lesions are small and well below 106,000 µ2 and can therefore readily be diagnosed as minimal. Aggregate lesion size of approximately 100,000 µ2 represents the participant consensus threshold between minimal and mild severity and is consistent with measurements made in the quantitative assessment, and its surrogate (106,000 µ2; FOV at 600× or approximately 45% of the FOV at 400×) requires no measurements. PCM lesions exceeding mild severity grade are less common in short-term toxicity studies, though there were some votes in study #1 for moderate severity as well as in the exercises described in part 2 of this article and in the Elmore et al.’s (2016) article. A criterion for separating mild from greater severity lesions is discussed in part 2.
The proposed threshold of lesion size (106,000 µ2) as a threshold for diagnosis of mild is far lower than the threshold suggested by Jokinen et al. (2011), who stated that mild severity consists of an affected area greater than 10% of the myocardium in section. The strain and age (duration of study) are important variables to consider when determining the most appropriate threshold(s) for severity grades, and Jokinen et al. evaluated hearts from longer duration studies. For younger animals in 28-day toxicity studies, up to 10% area involvement is too broad for minimal severity. While the total area of a “standard” section of heart tissue from a male SD rat examined microscopically is quite variable, an average section from control animals from a 28-day study in SD rats conducted by 1 sponsor was found to be roughly 100,000,000 µ2. If using the threshold proposed by Jokinen et al., 10% would be 10,000,000 µ2, which would mean that all of the lesions identified in study #1 would be considered minimal.
Should a Threshold Be Used to Diagnose PCM/Like Lesions, and if so, What Should the Threshold Be?
It is clear from the study #1 answers and diagnoses, from a previous survey (Keenan et al. 2010), from exercise #1 (part 2 of this article), and Elmore et al. (2016) that some pathologists use a threshold for PCM/like lesions and individual thresholds for diagnosing PCM/like lesions vary. While consistency (including application of threshold criteria) within a study may be all that is required to accurately identify TA-related effects, the use of the same threshold by all pathologists could improve HCD and comparison of PCM/like data across studies. Defining a threshold in a manner that can consistently be applied by all is problematic. Therefore, use of no threshold for diagnosing PCM/like lesions is likely the best way to insure robust and consistent HCD for the incidence of PCM.
Of the varied thresholds used by the participants, several used 1 “small” focus, while others used 2 small foci or a “larger” single focus as the threshold for diagnosing PCM/like lesions. The descriptor small is subjective, as is a single larger focus. Some participants did not diagnose lesions they considered “typical” (defined as small numbers of individual necrotic myofibers) consistent with PCM in young rats but did identify what they considered to be “changes in expected distribution and severity.” Importantly, what constitutes typical cardiomyopathy differs based upon pathologists’ experiences and assumes that there is a typical distribution and severity. PCM, however, can involve all regions of the heart and occur with extensive distribution (Chanut et al. 2013; Greaves et al. 2000). Other participants only diagnosed lesions of greater severity than the most severe PCM lesion in the control group. Because PCM severities of mild or greater occasionally occur in control animals, misuse of this approach could result in not diagnosing lesions of mild severity within a HD (or other treated) group, therefore masking a potential TA-related effect. Defining the “average” threshold used by the majority was viewed as a starting point for identifying an acceptable threshold to potentially be used by all. That threshold was first determined numerically by comparing the size of PCM/like lesions diagnosed by the majority versus the size of those diagnosed in the quantitative analysis (no threshold used) but not by the majority.
With 2 exceptions, all animals with PCM/like lesions of aggregate size larger than 5,000 µ2 were diagnosed by the group, and all below that size were not diagnosed (Table 1). One animal (MD #29) with aggregate lesion size of 9,087 µ2 and 1 obvious outlier with aggregate lesion size of 40,392 µ2 (LD #17) were not diagnosed by the group. The outlier (LD #17) had a fibrotic lesion on the epicardial/subepicardial region of the right ventricle that was included in the quantitative evaluation, but as discussed above, it was not considered by many of the group participants as a PCM lesion (see part 2 of this article). Applying 5,000 µ2 as the threshold for diagnosis of PCM lesions and the already established 100,000 µ2 for the threshold between minimal and mild to both the quantitative and majority vote data resulted in almost identical data, as would be expected (Table 5). “Testing” a higher (10,000 µ2) threshold resulted in significantly lower incidence, particularly in the control group (Table 5). Use of 10,000 µ2 appeared to be a viable approach for distinguishing subtle differences between groups, however, magnified differences between groups that were too subtle and also decreased the number of lesions diagnosed by the overwhelming majority of participants. The lesion in Figure 4 is approximately 12,000 µ2, and most pathologists would diagnose a lesion only slightly smaller than that. Moreover, lesions below 5,000 µ2 are often obvious histologically, as evidenced in the lesion in Figure 2, measuring approximately 4,317 µ2. Therefore, 10,000 µ2 was considered too high as a threshold for diagnosis. A threshold lower than 5,000 µ2 would essentially translate to “no threshold,” as applied in the quantitative assessment, and also provided a good representation of the heart lesions in the study.
Comparison of Incidences of PCM for the Quantitative Exercise and/or Majority Vote Using 10,000 µ2 or 5,000 µ2 as the Threshold for Diagnosis of PCM or Use of No Threshold.
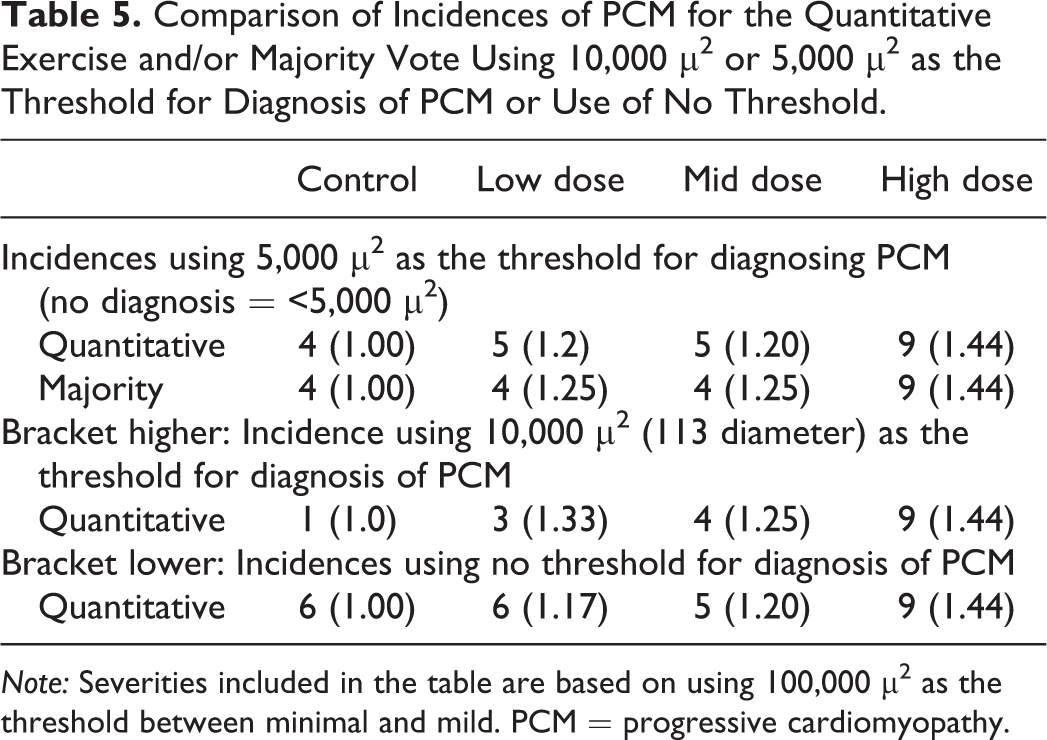
Note: Severities included in the table are based on using 100,000 µ2 as the threshold between minimal and mild. PCM = progressive cardiomyopathy.
Defining 5,000 µ2 as the threshold for diagnosing PCM/like lesions in morphological terms is difficult. The data are similarly robust with the use of a no threshold approach (Table 5), and no threshold is far easier for consistency’s sake. Results from exercise #1 (part 2 of this article) further support use of a no threshold approach. An identified “suspect” morphology may represent very early and/or extremely minimal PCM, but when there is any doubt or concern in convincing other pathologists, suspect characteristics should not be diagnosed. Confidence in the diagnosis requires the minimal presence of a single necrotic myofiber accompanied by a cellular response.
Summary
TA-induced histological lesions in the heart of the rat can have a profound effect on drug development, and interpretation of findings may be confounded by PCM. Therefore, separation of potential TA-related cardiotoxicity from PCM requires a comprehensive understanding of the spectrum of PCM and application of an appropriate diagnostic approach for terminology, thresholds, and severity grading. An ideal diagnostic approach should allow optimal generation and interpretation of study data, better comparison of data across studies, and generation of better HCD.
To understand professional preference for applying diagnostic terminology and thresholds that may contribute to variability of internal data, a mock study #1 was created with digital slide images of rat hearts to simulate a typical result scenario from short-term toxicology studies in SD rats. All participants were instructed to perform the exercise individually, as if they were applying their experience and personal diagnostic preferences to an actual toxicology study, and were given a feedback form to explain their rationale for terminology and threshold choices. To facilitate evaluation of the information generated from study #1, a quantitative evaluation of the hearts from each of the animals from the study was conducted independently.
Recommendations are use of NICI and/or fibrosis (when appropriate) for diagnosis of the spectrum of morphologies comprising PCM/like lesions, no threshold for diagnosis, and a semiquantitative threshold for distinguishing lesions of minimal and mild severity. This semiquantitative threshold is the FOV using the 60× objective or approximately 45% of the FOV using the 40× objective and a 10×/22 eyepiece. While this approach is based on data from young male SD rats in short-term (up to 28 day) toxicology studies, it is likely applicable to other sex/strains of rats, though modifications may be required.
Data must always be interpreted within the context of the individual study and applying a weight of evidence approach. Using the data from study #1 to exemplify this, the context of the HD results changes the open interpretation of LD and MD results. With the recommended diagnostic approach for PCM/like lesions, a TA-related effect would be identified in the HD (based on incidence and severity), even if read blinded to dose group. Weight of evidence is then required to interpret the LD and MD effects, which lack increased incidence and are equivocal at face value. The more obvious effect in the HD suggests the presence of an uncommon mild severity in both the LD and MD groups cannot be completely dismissed, and a TA-related effect remains plausible in these groups. Alternatively, had the HD shown a negative effect (same incidence and severity as controls), the typical toxicologic pathology paradigm would add weight of evidence that indeed, the LD and MD effects were negative as well, basing this conclusion on discounting individual outliers (those with mild severity).
Footnotes
Author Contribution
Authors contributed to conception or design (JRH, HT, JK, PC, BB, CK, DM, JH, ND, DR, AN, JT, RA); data acquisition, analysis, or interpretation (JRH, BM, GP, BB, CK, GAP, DM, SE, JH, ND, DR, JF, ML, KB, BSB, VC, AN, NT, HW, JB, IB, JT, RA); drafting the manuscript (JRH); and critically revising the manuscript (BM, HT, GP, JK, PC, BB, CK, GAP, DM, SE, JH, ND, DR, JF, ML, KB, BSB, VC, AN, NT, HW, JB, IB, JT, RA). All authors gave final approval and agreed to be accountable for all aspects of work in ensuring that questions relating to the accuracy or integrity of any part of the work are appropriately investigated and resolved.
Declaration of Conflicting Interests
The author(s) declared no potential conflicts of interest with respect to the research, authorship, and/or publication of this article.
Funding
The author(s) received no financial support for the research, authorship, and/or publication of this article.