
Abstract
To test the diagnostic approach described in part 1 of this article, 2 exercises were completed by pathologists from multiple companies/agencies. Pathologist’s examination of whole slide image (WSI) heart sections from rats using personal diagnostic approaches (exercise #1) corroborated conclusions from study #1. Using the diagnostic approach described in part 1, these pathologists examined the same WSI heart sections (exercise #2) to determine whether that approach increased consistency of diagnosis of rodent progressive cardiomyopathy (PCM) lesions. In exercise #2, there was improved consistency of categorization of small borderline morphologies and mild lesions, but a decrement in consistency of categorizing minimal lesions. Exercises 1 and 2 suggest the described diagnostic approach is representative of that in use by the majority of toxicologic pathologists across companies/agencies and that application by all may improve diagnostic consistency of PCM/like lesions. Additionally, a criterion of approximately 5% heart section involvement is suggested for separating mild from moderate or greater severity. While evidence is not absolute, until further investigation shows otherwise, microscopic changes resembling PCM, but located in the epicardial and subepicardial region of the right ventricle, may be considered as part of the spectrum of PCM.
Keywords
Introduction
A diagnostic approach was described in part 1 of this article recommending specific diagnostic criteria for characterizing progressive cardiomyopathy (PCM) in the heart of rats and was designed to help differentiate common spontaneous background change (PCM) from test article–related cardiotoxicity (PCM/like). Predefined severity and other diagnostic parameters described in part 1 were developed from a retrospective analysis of a digital slide exercise conducted among 37 pathologists within 1 company (Table 1).
Instructions for Applying a Harmonized Diagnostic Approach for Cardiomyopathy/Like Lesions in Short-term Toxicology Studies in Rats.
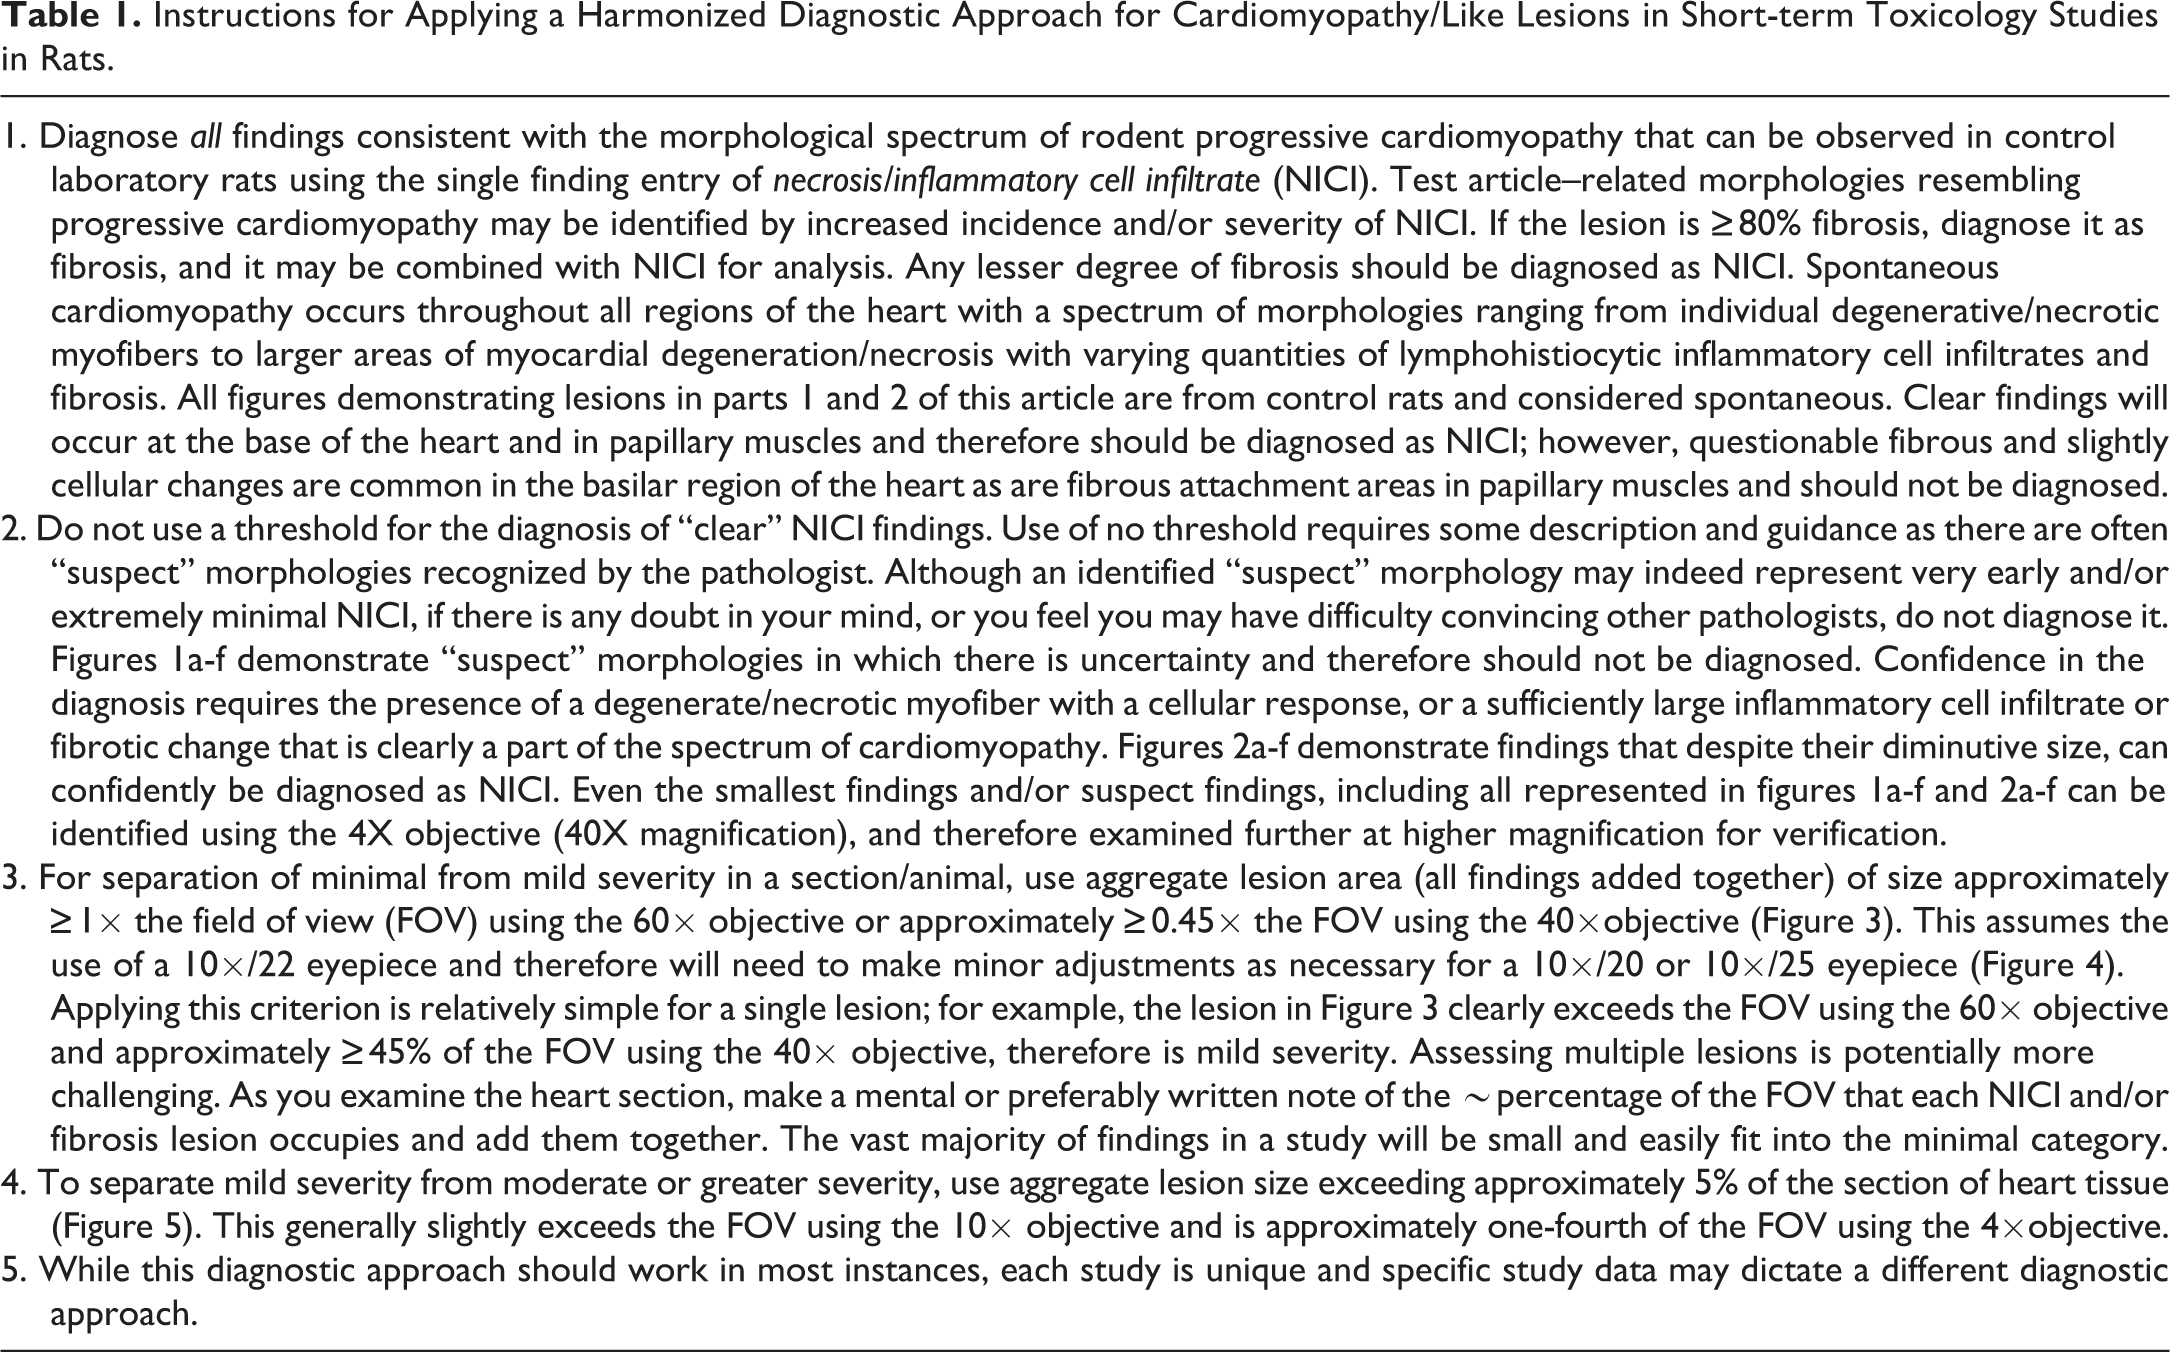
(a–f) Male Sprague Dawley rats from a GSK multisite study with morphologies that may or may not represent progressive cardiomyopathy (PCM) but because of the equivocal nature, should not be diagnosed as PCM (hematoxylin and eosin stain). (a) This area of cellularity is approximately 1,500 µ2 but could represent an area adjacent to vasculature and therefore may not be PCM; (b) although there appears to be a necrotic cell, there is uncertainty; (c) the minimal increase in cellularity is insufficient to be certain this is PCM; (d) although potentially a necrotic cell with a cellular response, there is uncertainty; (e) the minimal increase in cellularity is insufficient to be certain this is PCM; and (f) although this could represent the fibrotic end stage of PCM, this is a common morphology in papillary muscles, therefore there is uncertainty.
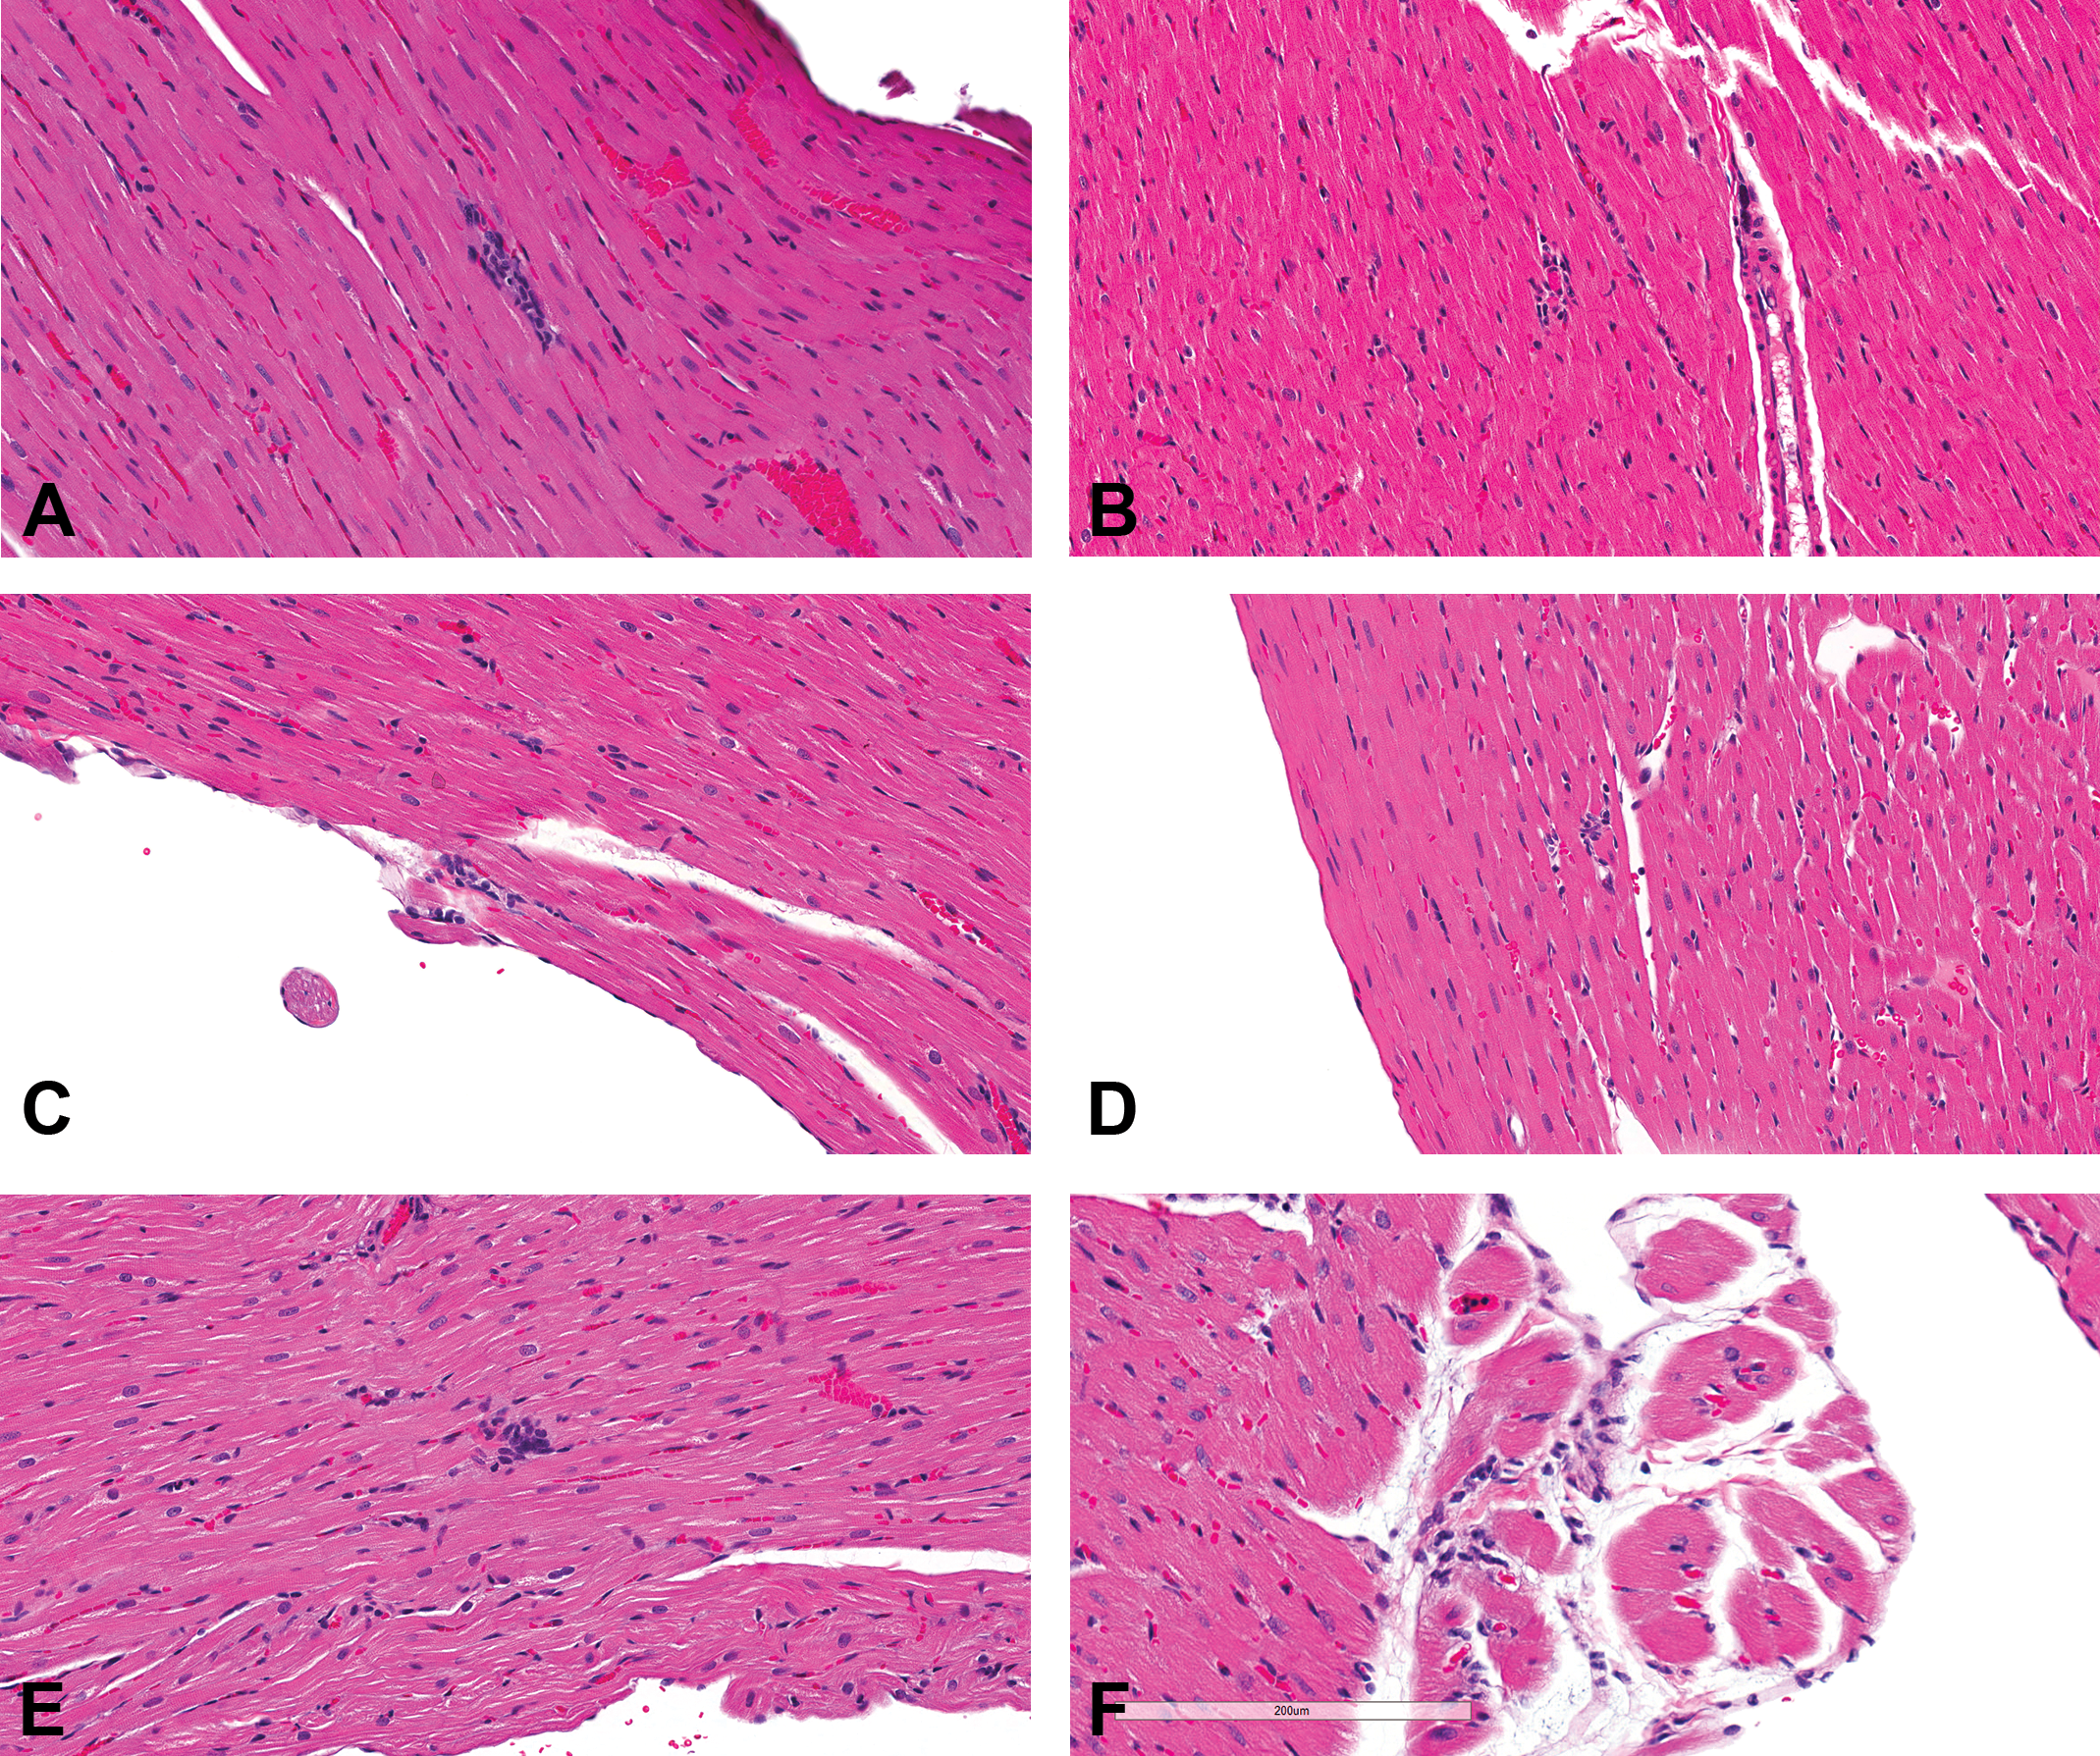
(a–f) Male Sprague Dawley rats from a GSK multisite study with morphologies that despite their diminutive size are consistent with progressive cardiomyopathy (PCM) and therefore should be diagnosed (hematoxylin and eosin stain). (a) Although only approximately 1,500 µ2, there is clear evidence of myofiber debris and a cellular response; (b) although even smaller (approximately 1,000 µ2), a necrotic fiber and cellular response is evident; (c) definite myofiber necrosis with cellular response; (d) although relatively small, these 2 areas of fibrosis and cellular response are clearly indicative of PCM; there is enough cellular component to diagnose as necrosis/inflammatory cell infiltrate and not as fibrosis; (e) although only approximately 2,000 µ2, a necrotic myofiber and cellular response is present; and (f) definite myofiber necrosis with cellular response.
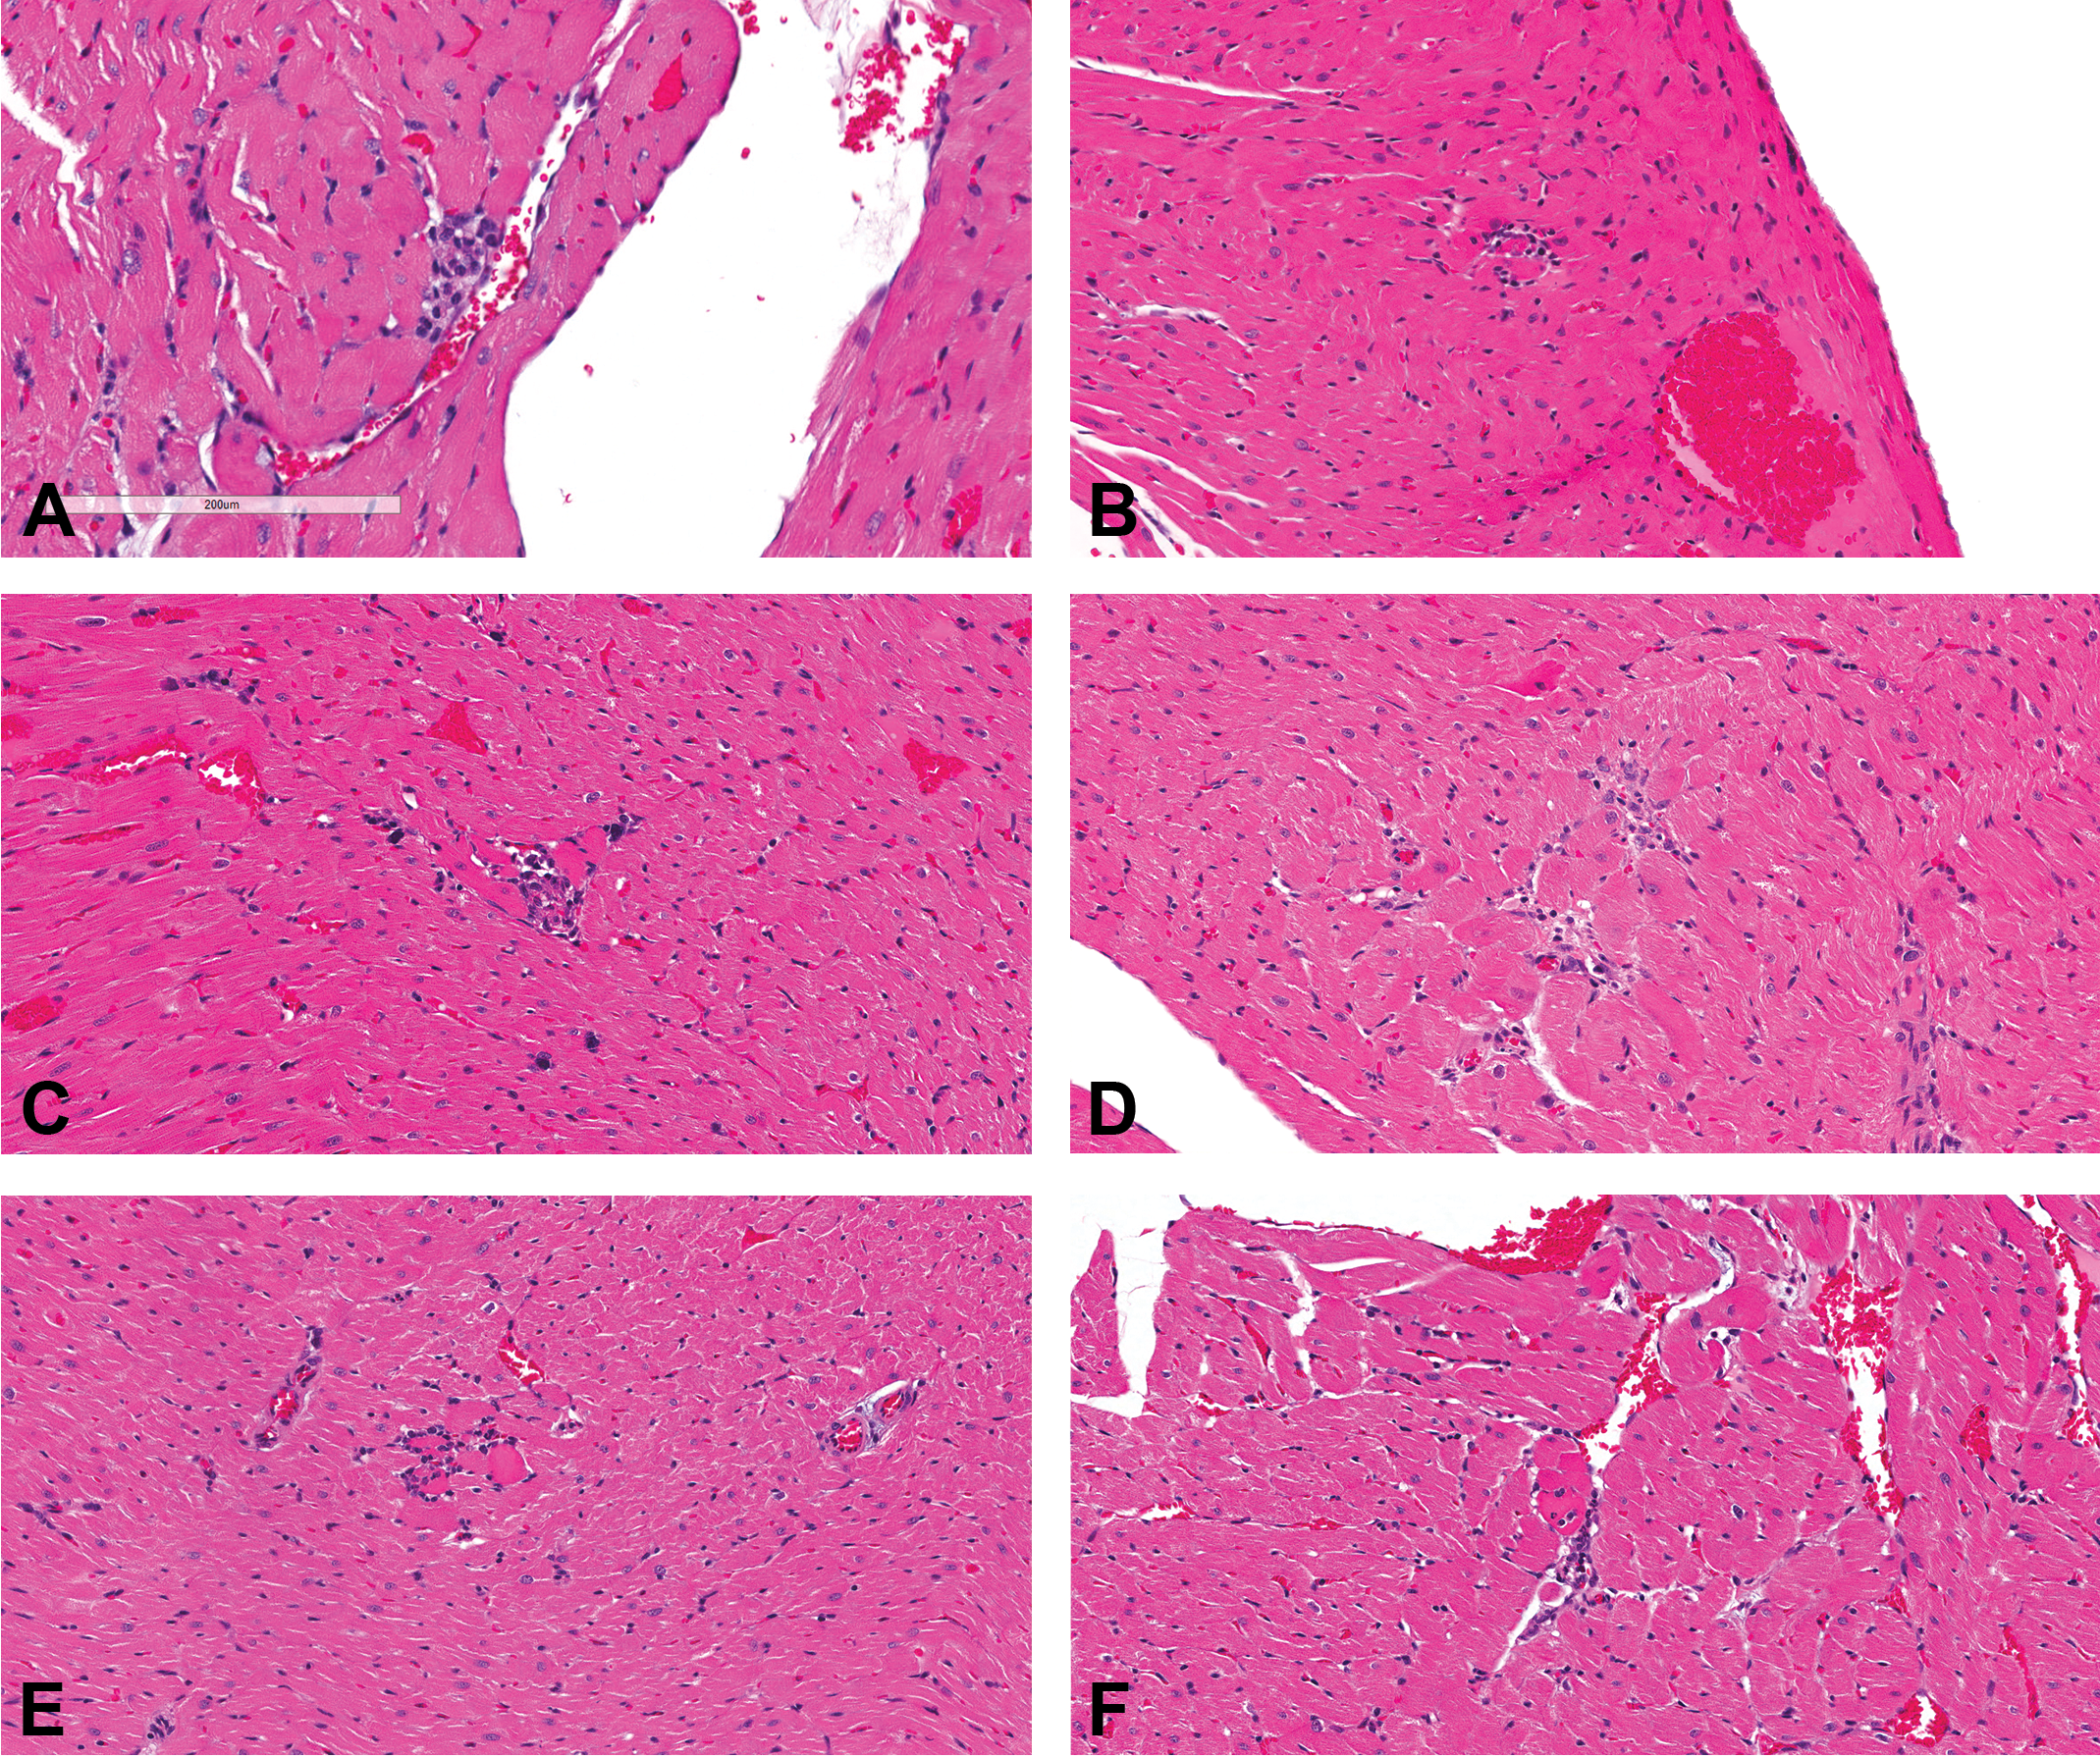
Control male Sprague Dawley rat from a GSK multisite study; the square yellow box (approximately 326 µ × 326 µ) equals approximately 106,000 µ2, the inner blue circle (approximately 106,000 µ2) represents the field of view from a microscope with a 10×/22 eyepiece and 60× objective, and the outer green circle represents the field of view (approximately 237,000 µ2) at 40× (hematoxylin and eosin stain).
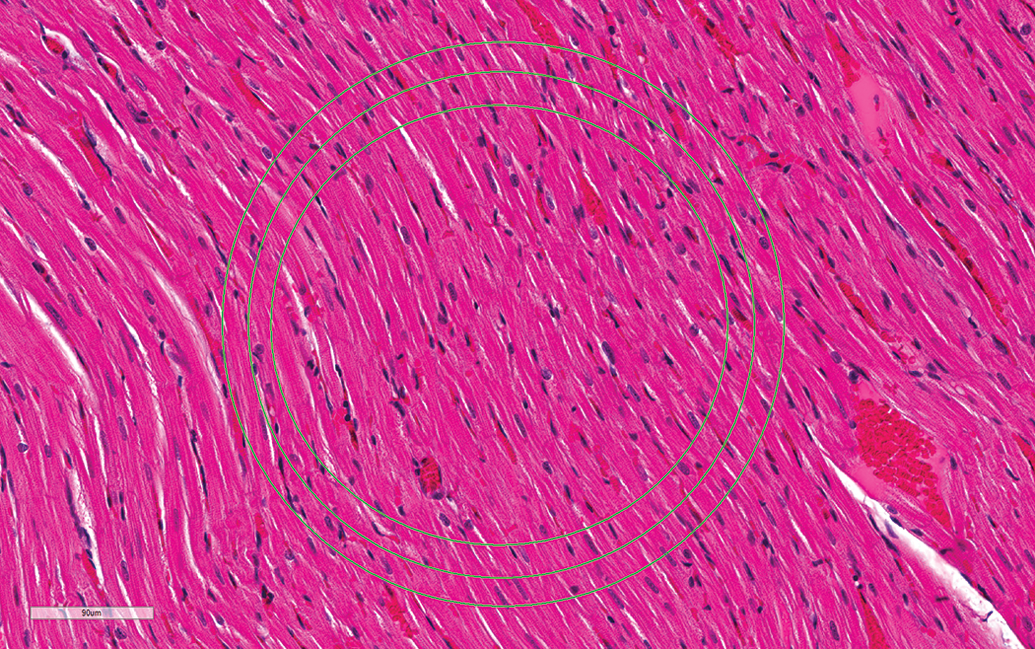
Control male Sprague Dawley rat from a GSK multisite study demonstrating field of view (FOV) differences; the middle circle represents the FOV (approximately 106,000 µ2) using a 10×/22 eyepiece and 60× objective. The inner circle represents the FOV (approximately 85,000 µ2) using a 10×/20 eyepiece and the outer circle represents the FOV (approximately 133,000 µ2) using a 10×/25 eyepiece (hematoxylin and eosin stain).
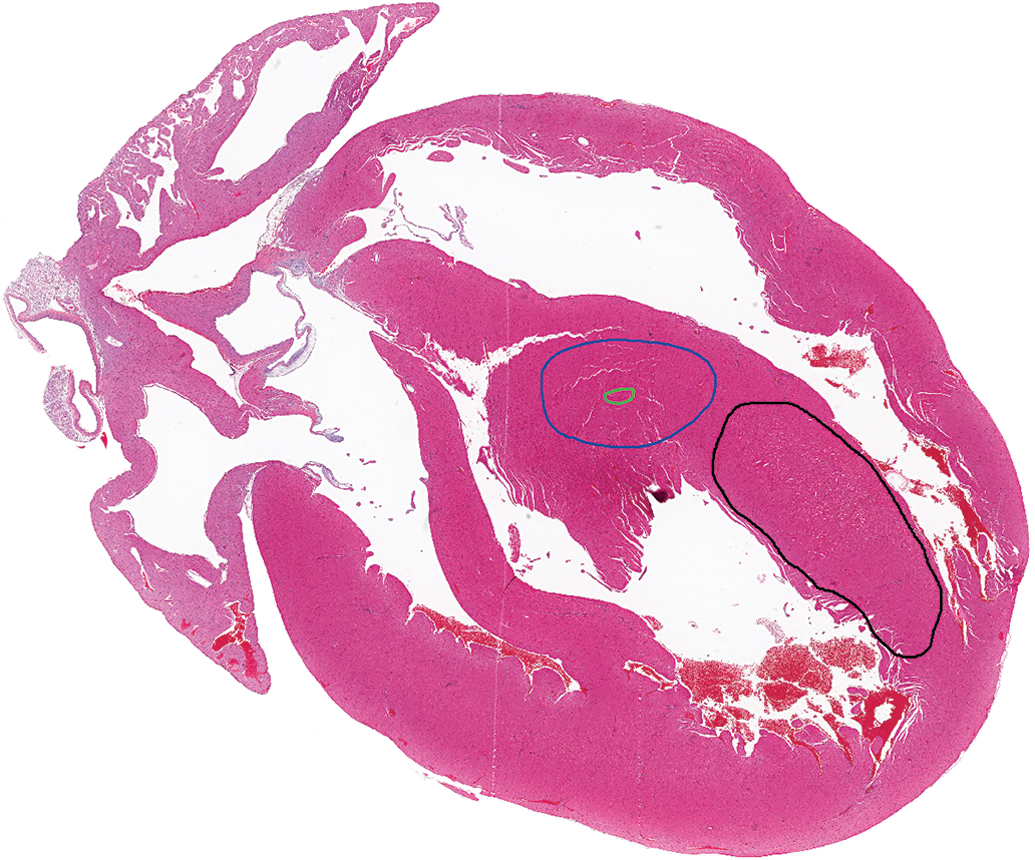
Control male Sprague Dawley rat from a GSK multisite study; this is representative of the sectioning for these studies. The small green outline represents the size criterion (approximately 106,000 µ2) for separation of minimal from mild lesions; the outer blue outline represents approximately 5% of the section of heart and the criterion for separation of mild from moderate or greater severity. For comparison, the black outline represents approximately 10% of the section of heart.
To determine how these criteria for PCM would perform in broader practice among toxicologic pathologists, a consortium was formed for diagnostic evaluation using digital whole slide images (WSIs) of rat heart sections. Participants from varied companies/agencies were asked to evaluate WSI heart sections using personal experience and their own devised criteria in exercise #1 and apply predefined criteria in exercise #2. Here, we examine the results of exercises 1 and 2 to determine whether broader application of the criteria would bring greater consistency in diagnosis and strengthen historical control data (HCD), often essential in the differentiation of spontaneous and drug-induced change. We also examined whether lesions morphologically resembling PCM, but located exclusively in the epicardial and subepicardial region of the right ventricle, are part of the spectrum of PCM and/or are potentially caused or exacerbated by repeated oral gavage tube dosing procedures.
Material and Method
Members of the Society of Toxicologic Pathology, Cardiovascular Toxicologic Pathology Special Interest Group (CVSIG), and others formed a consortium group of 24 volunteer toxicologic pathologists from various companies or agencies to participate in 2 digital slide exercises. Exercise 1 allowed participants to use their routine diagnostic approach for diagnosing PCM/like lesions, including severity criteria. Twenty-two of these pathologists later participated in exercise #2 in which they examined the same WSI heart sections with directions/guidance to use the diagnostic approach described in part 1 of this article. Exercise 1 was conducted to allow comparison with study #1 in an effort to determine whether the diagnostic approach in exercise #1 corroborated conclusions from study #1 that prompted the basis for developing a harmonized diagnostic approach. Specifically, we wanted to explore whether the majority of the diverse group of pathologists approached PCM/like lesions similarly to the majority of participants in study #1 with regard to terminology used for diagnoses, threshold for diagnosing small morphologies, and threshold for separating minimal from mild severities. In comparing exercise #1 to exercise #2, we wanted to determine whether using the described “harmonized” diagnostic approach resulted in greater consistency among pathologists in applying diagnostic terminology, diagnostic recognition of small, “borderline” morphologies, and distinction of lesions with minimal or mild severity (based on field of view [FOV] size criteria).
We could not use the same WSI heart sections for exercises 1 and 2 that were evaluated by participants in study #1; therefore, WSI heart sections used in these exercises were taken from a GSK multisite study designed to evaluate the biological and environmental variability of spontaneous cardiomyopathy in young (up to 15 weeks old) male Sprague Dawley (SD) rats (Chanut et al. 2013). All original in-life study work for this multisite study was conducted in accordance with the Glaxo Smith Kline (GSK) Policy on the Care, Welfare and Treatment of Laboratory Animals and was reviewed by the Institutional Animal Care and Use Committee at GSK. To identify candidate lesions, spreadsheets containing diagnoses and lesion measurements from that multisite study were perused, and 60 WSI heart sections were identified for microscopic examination. Hematoxylin and eosin (H&E)-stained midsagittal sections of hearts (prepared by routine methods for standard rodent toxicology studies; Figure 5) were examined with 45 sections selected to be scanned in at 40× magnification using an Aperio ScanScope XT. These 45 WSI heart sections were further examined using Aperio Spectrum™ and ImageScope™ with the use of the pen tool to outline and quantitate the areas of the lesions.
To compare the diagnostic approach of participants in exercise #1 to those in study #1, WSI heart sections were categorized based on the criteria established from analyses of the participant majority vote in study #1: 5,000 µ2 size criterion as the threshold for diagnosing a PCM/like lesion and 106,000 µ2 as the size criterion for the separation of minimal from mild severity. To accomplish all objectives, we selected lesions that (a) represented the spectrum of PCM, (b) strongly fit into various categories (e.g., negative, minimal, or mild), and/or (c) were borderline and challenged the established thresholds either for being diagnosed, or not, or for proper categorization of severity. Based on lesion morphologies and measurements, 25 WSI heart sections were strategically selected and grouped as indicated below to enable comparison of the diagnostic approach by participants in exercise #1 to that of participants in study #1 and to facilitate comparison of diagnostic consistency between exercises 1 and 2. The groups were two lacking PCM lesions and lacking “suspect” changes (negative); two with PCM lesions of sufficient size to be diagnosed and scored as minimal by the majority of pathologists in study #1; two with PCM lesions of sufficient size to be diagnosed and scored as mild by the majority of pathologists in study #1; six with small but distinct PCM lesions of a size below the average threshold (5,000 µm2) for diagnosis by the majority of pathologists in study #1; two with small PCM lesions barely above the average threshold (5,000 µm2) for diagnosis by the majority of the pathologists in study #1; three with suspect lesions, but not considered clear PCM, and would not have been diagnosed by the majority of pathologists in study #1 (negative); four with PCM lesions under, but relatively close to the 106,000 µm2 threshold between minimal and mild severities, and therefore likely to be diagnosed as minimal by the majority of pathologists in study #1; and four with PCM lesions above, but relatively close to the 106,000 µm2 threshold, and therefore likely to be diagnosed as mild by the majority of pathologists in study #1.
To further assist with accomplishing the above objectives, and/or help interpret responses by participants, 6 questions were included in exercise #1: How many years of experience do you have in the field of toxicologic pathology? Do you consider yourself “familiar” with spontaneous changes in the heart of SD rats? If not, what strain of rat are you most familiar with? Were the findings in this exercise generally similar to those in the strain you are most familiar with? If not similar, please elaborate. Put not applicable (NA) if this question does not apply. Why did you use the diagnosis(es) that you did for findings identified in this exercise? Did you use a threshold for diagnosing findings in the heart (i.e., are there findings that you did not diagnose)? If yes, describe your threshold. Were there any findings that you considered not to be within the spectrum of background findings commonly seen in the hearts of laboratory rats of this age? If yes, please identify which hearts had these findings and specifically what led you to your conclusion (e.g., morphologic characteristics, size, distribution, or any other factors). Only this sixth question was included in exercise #2.
Each of 24 pathologists was informed they would be conducting histological evaluations on 2 sets of approximately 25 WSI heart sections to test a histopathological hypothesis and that their involvement would be anonymized. Participants were not given access to exercise #2 until they had completed exercise #1. The 2 exercises were completed by participants over a period of 5.5 months. The time lapse between the 2 exercises varied between participants and could not be controlled due to their competing priorities. The pathologists were told the age of the SD rats but were blinded otherwise. They conducted the initial examination (exercise #1) of the WSI heart sections in their offices using Aperio Spectrum™ and ImageScope™ or Med Scope™ using their usual diagnostic approach. Twenty-two of the 24 participants examined the second set (exercise #2; same slides, same order) of slides with directions to use the described diagnostic approach. Instructions for exercise #2 were similar to those in Table 1 and included the spectrum of morphologies and distribution of lesions considered consistent with PCM as well as images demonstrating the threshold for diagnosing PCM/like lesions. One notable difference from Table 1 was that participants had to use their computers and ImageScope™ rather than a microscope to examine the hearts. Consequently, the “FOV” varied based on monitor screen size and did not necessarily equate to using the 60× objective on a microscope. Participants were therefore provided instructions on how to determine the appropriate magnification at which their computer screen FOV equaled approximately 106,000 µ2, thus mimicking use of the 600× magnification with a 10×/22 eyepiece and 60× objective.
Electronic answer sheets were provided to participants once they were ready to begin each exercise and, upon completion, were returned (with an anonymized identifier) to the statistician (Kimbrough). The data were collated and analyzed (blinded to participant identity) by 3 authors (Hailey, Kimbrough, and Berridge), with review of analyses and formulation of conclusions by all authors. Collation and analysis in both exercises primarily consisted of quantifying all participant votes for a diagnosis and/or severity grade and determining the majority vote for each heart. Results of terminology used and majority votes for lesions in exercise #1 were then compared to “benchmark” diagnoses based on criteria described in Table 1, thus serving as a surrogate for lesions evaluated in study #1. For comparisons between exercises 1 and 2, the percentage of votes for benchmark diagnoses for the various groupings of lesions were compared between the 2 exercises.
Twenty-two of the 24 pathologists completed exercise #2. Participants in either exercise did not always answer every question and for various reasons, a few answers/diagnoses could not be tallied. Due to the anonymized nature of the exercises, follow-up was not practical.
In addition to exercises 1 and 2, there was an effort to better understand the biology of lesions occurring in the epicardium and/or subepicardium of the right ventricle of control rats. Heart sections from control groups of male Harlan Sprague Dawley (HSD) rats from 1 gavage (total of 10 males) and 4 nongavage 90-day studies (1 inhalation, 3 feeding studies; total of 40 males) were evaluated by a pathologist at Experimental Pathology Laboratories, Research Triangle Park, NC. Similarly, heart sections from control male groups of F344/N rats from 10 gavage (total of 100 males) and 10 nongavage 90-day studies (2 skin application, 2 feeding studies, 3 water administration, and 3 inhalation; total of 104 males) were evaluated by this pathologist. Six males each from1 gavage and 1 nongavage study in F344/N rats were on study for 150 days.
The right ventricle was examined on H&E-stained sections of heart from each animal and only lesions involving the epicardial and/or subepicardial region were diagnosed as cardiomyopathy; findings in other parts of the right ventricle were not diagnosed. They were subjectively graded as minimal when subtle and mild when obvious.
Results/Discussion
Comparison of Exercise 1 to Study #1
Twenty-four pathologists with <1 to 36 (average 13 years) years of experience in toxicologic pathology initially evaluated the 25 WSI heart sections using their own diagnostic approach. Minor differences in diagnostic approach as observed in exercise #1 are not uncommon in toxicologic pathology due to diverse experience and training. Regardless, each pathologist’s consistency with their personal diagnostic approach within a study is the most critical contributor to the successful identification and communication of test article (TA)-related toxicologic pathology findings.
Results from exercise #1 generally corroborated conclusions from study #1, thus providing support for the proposed harmonized diagnostic approach. We compared exercise #1 to study #1 with a focus on (a) the terminology used, (b) the threshold for diagnosis of PCM/like lesions, and (c) the threshold for separation of minimal from mild lesions. Varied diagnostic terms were used in exercise #1 similar to those used in study #1. A single term such as cardiomyopathy or some variation (e.g., PCM) was used exclusively by 11 participants or in combination with another term (2 participants). “Degeneration/necrosis” combined with some form of “infiltrate” or “inflammation” was also applied, as was “infiltrate, mononuclear.” Up to 6 diagnostic terms (necrosis/degeneration; degeneration; infiltration; infiltration, lymphohistiocytic; infiltration, mixed; and fibrosis) were used by at least 1 participant for the spectrum of lesions observed in the exercise. Except for 1, all participants who used multiple terms often had multiple diagnoses for a single lesion; 1 participant used multiple terms, but used only one (degeneration/necrosis) or the other (inflammatory cell infiltrate) diagnosis per lesion.
Unlike in study#1 where the majority (70%) said they used a threshold for diagnosing PCM/like lesions, only 9 participants (38%) said they used a threshold in exercise #1. Only 6 (25%) of the 9 used a threshold whereby legitimate lesions were not diagnosed. One couldn’t be assessed, and the “thresholds” of 2 others were so low as only the “negative” hearts were not diagnosed and therefore not different from many who said they did not use a threshold. As with study #1, there was variation in the descriptions of thresholds used by the 6 pathologists (e.g., did not diagnose smallest lesions, including single focal infiltrate or cluster of degenerate myocytes).
Eight hearts with very small lesions that were below (group d, 6 lesions) or just above (group e, 2 lesions) 5,000 µ2 along with 5 negative hearts (group a, 2 hearts with no lesion; group f, 3 hearts with suspect lesions) were selected to allow comparison of diagnostic thresholding between exercise #1 and study #1. Results from study #1 suggest the majority of the 8 very small lesions would have been below that group’s threshold for diagnosis. However, consistent with the majority of participants in exercise #1 using no threshold, 6 of the 8 very small lesions were diagnosed by the majority in exercise #1. Except for a split vote for 1 suspect lesion, the majority did not diagnose the 5 negative hearts. Although a threshold had been used by the majority of pathologists in study #1, for reasons explained in part 1 of this article, use of “no threshold” was recommended in the described harmonized diagnostic approach. Many of the pathologists representing a cross section of the toxicologic pathology community did not use a threshold in exercise #1, thus further supporting a no threshold approach.
Participants in exercise #1 clearly corroborated the size criterion established from study #1 for separating minimal from mild lesions. The 4 lesions (groups b and c) selected as “strongly” minimal or mild, respectively, were overwhelmingly voted as such by participants in exercise #1. More importantly, all 4 lesions close to, but under the 106,000 µ2 threshold (group g), were voted as minimal by a clear majority of participants in exercise #1. Although votes were more evenly split, 3 of the 4 lesions close to, but over the 106,000 µ2 threshold (group h), were voted as mild by the majority of participants. The only heart not voted to have mild PCM had several lesions with aggregate size within 10% of the 106,000 µ2 threshold, and the largest of the lesions within this heart was elongate (Figure 6) and therefore difficult to assess size using FOV. Appropriately, all of the 6 smaller lesions diagnosed from groups d and e were diagnosed as minimal by the majority.
Control male Sprague Dawley rat from a GSK multisite study; the elongate nature of this largest lesion within this heart makes it difficult to assess the size with “field of view” at higher magnifications (hematoxylin and eosin stain).
Comparison of Exercise 1 with Exercise 2
Overall, there was an increase in diagnostic consistency among participants in exercise #2 compared to exercise #1. We evaluated terminology used and the majority votes for individual WSI heart sections between the 2 exercises. We also assessed the percentage of votes for the various groupings of lesions to determine whether there was increased concordance of diagnosis of small lesions, nondiagnosis in negative hearts, and appropriate severity grade categorization in exercise #2. Some participants in exercise #1 used a diagnostic threshold, potentially affecting concordance between the 2 exercises with some groupings of hearts (e.g., small lesions). In those instances, separate analyses were conducted.
It’s important to note that lesions can have diverse morphologies, making criteria sometimes challenging to apply. This is particularly true for PCM/like morphologies that are borderline with regard to whether they represent a legitimate lesion or borderline between severity grades. Exercise 2 was designed to challenge the proposed harmonized diagnostic approach and 19/25 of the morphologies were purposely borderline and difficult to categorize. It’s practical to assume the vast majority of PCM/like lesions that will occur in short-term toxicity studies will be clear minimal lesions diagnosed similarly by toxicologic pathologists.
All pathologists (100%) used the single “slash” term, necrosis/inflammatory cell infiltrate in exercise #2. Use of a single term (cardiomyopathy or some variation) is commonly used (46% of participants in exercise #1). Twenty of the 25 hearts (80%) were appropriately categorized as per benchmarks diagnoses (e.g., lesion or no lesion or appropriate severity grade) by the majority of participants in exercise #1. Twenty-three and one half (1 split vote) of 25 (94%) were appropriately categorized by the majority of participants in exercise #2. The only lesion not “appropriately” categorized in both exercises was a very small lesion (Figure 7) discussed further below.
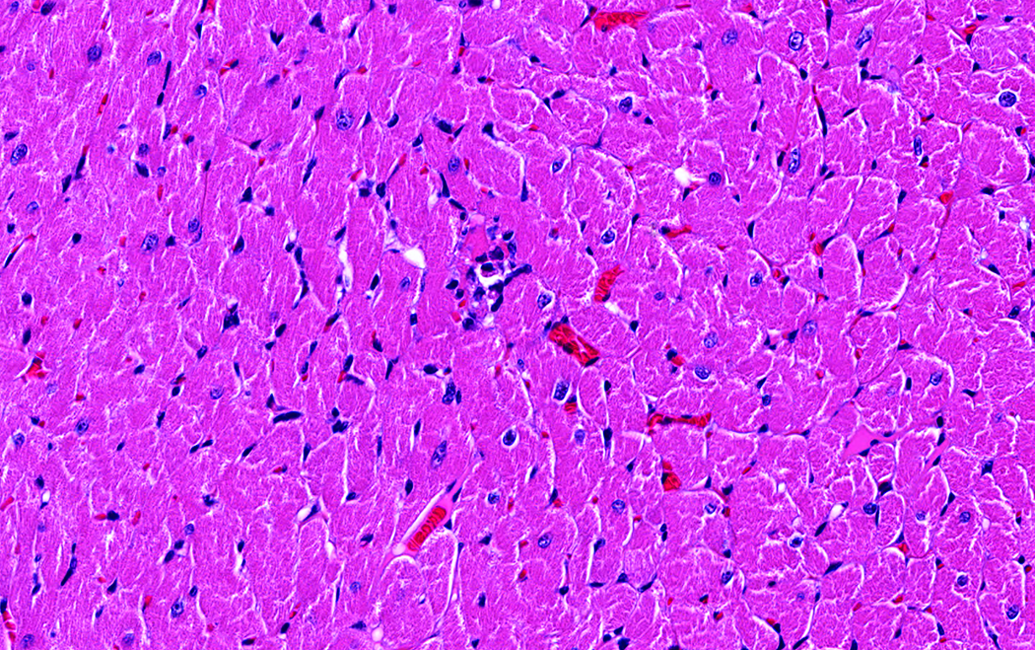
Control male Sprague Dawley rat from a GSK multisite study; although very small, representing the smallest morphology possible for diagnosis, there is a degenerate/necrotic myofiber with a few infiltrating cells, therefore, consistent with criteria for diagnosis of progressive cardiomyopathy (hematoxylin and eosin stain).
Using majority vote, “appropriate” categorization of hearts was very good in exercise #1 and even better in exercise #2. However, routine histological evaluations are not conducted by majority vote, and while some votes were overwhelming for the “appropriate” categorization, others were split more evenly, and the goal of exercise #2 was to minimize the split voting. For the remainder of this evaluation, we compare the percentage of total votes for appropriate categorization (e.g., lesion or no lesion or appropriate severity grade) of various groups of hearts. For these exercises, 19 hearts were selected as “borderline” to expose individual differences in diagnostic thresholds (groups d, e, and f) and to explore threshold differences for separating minimal from mild lesions (groups g and h), therefore increasing the potential to detect increased consistency in exercise #2 where participants were instructed to use similar thresholds.
A gain in concordance for diagnosis of small lesions in exercise #2 was accounted for by the group of 6 participants who used a threshold for diagnosis of small lesions in exercise #1. Lesions in 8 hearts were all very small (groups d and e), but clearly PCM, and were combined for analysis. There was 57% concordance for diagnosis of a lesion in these 8 hearts in exercise #1 and 66% concordance in exercise #2 (Figure 8). If the 6 participants who used a threshold for diagnosis of small lesions were excluded from the analysis, there was 70% concordance for diagnosis of lesions in exercise #1 and 71% in exercise #2; thus, the gain in concordance was due to those using a threshold in exercise #1. One of the eight lesions was comprised of a single degenerate/necrotic myofiber with a few infiltrating mononuclear cells (Figure 7) therefore as small as possible to be considered a “legitimate” lesion by the benchmark criteria. This lesion was not diagnosed by a large majority in exercise #1 and the only lesion not “appropriately” categorized (also by a large majority) in exercise #2. Lesions this small with the components necessary for diagnosis are rare, and this one was selected to challenge the threshold. If removed from consideration in this analysis, concordance for diagnosis of a lesion in the 7 remaining hearts by all participants went up to 61% in exercise #1 and to 75% in exercise #2 (Figure 8). It went up to 79% and 82%, respectively, for participants not using a threshold in exercise #1.
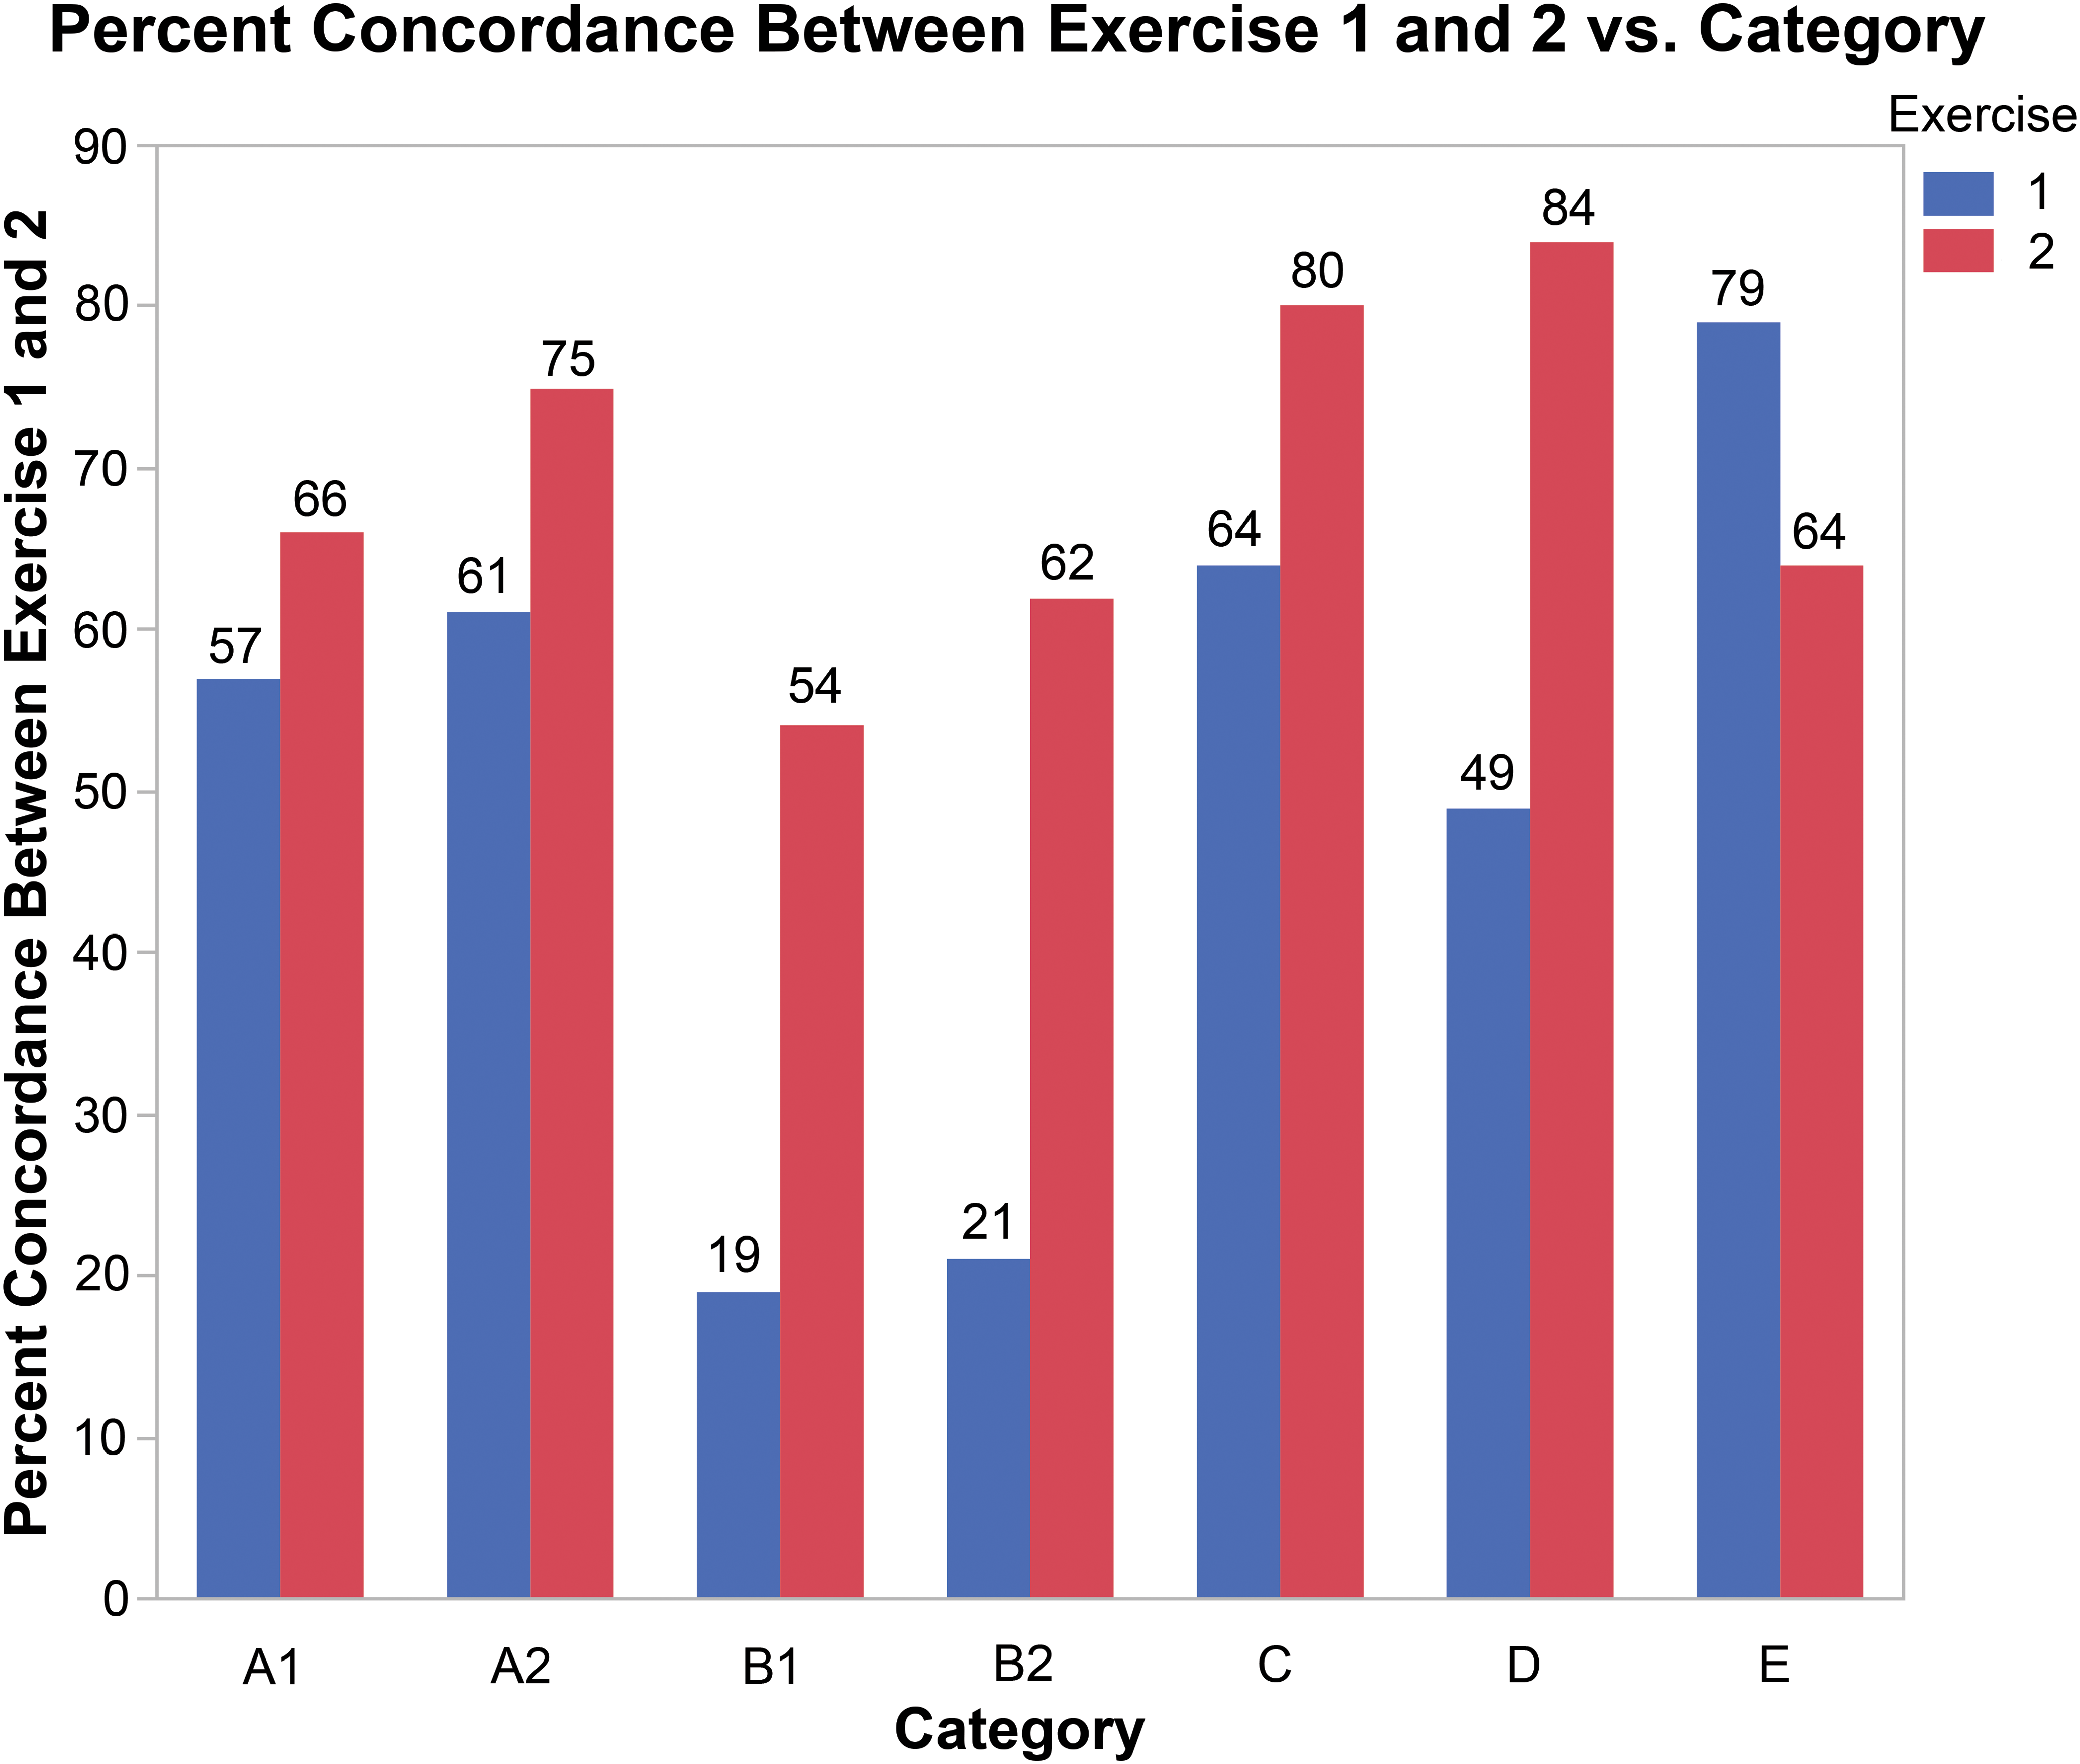
This bar graph shows concordance for various groupings of benchmark diagnoses between exercises 1 and 2. (A1) Comparison for the 8 small lesions among all participants, (A2) comparison for 7 small lesions (outlier removed from the group) among all participants, (B1) comparison for the 8 small lesions among participants using a diagnostic threshold, (B2) comparison for 7 small lesions (outlier removed from the group) among participants using a diagnostic threshold, (C) comparison for the 3 “suspect” lesions (no diagnosis) among all participants, (D) comparison for the 4 borderline mild lesions among all participants, and (E) comparison for the 4 borderline minimal lesions among all participants.
For the 6 participants who used a threshold, there was 19% concordance for diagnosing a small lesion in exercise #1 compared to 54% for that group of 6 participants in exercise #2, a more substantive gain from exercise #1 to exercise #2. However, if the very small lesion mentioned above is removed from consideration, it’s 21% and 62% concordant, respectively (Figure 8).
In contrast to the above small but legitimate lesions, group f was comprised of 3 hearts with morphologies that were suspect lesions. The morphologies were obvious enough to cause one to scrutinize more closely at higher magnification and, while they may actually be PCM lesions, were morphologically of such equivocal nature that one could not be sure. As per the described harmonized diagnostic approach, these were considered negative. There was 64% concordance for negative in exercise #1 and 80% concordance for negative in exercise #2 (Figure 8). For those using a threshold initially, a threshold-free approach for exercise #2 did not translate into a diagnosis in these 3 hearts with suspect morphologies.
Relative to severity grading, exercise #2 resulted in a slight “shift” toward higher severity grading by participants and there were mixed outcomes relative to improvement between exercises 1 and 2. There was a notable increase in concordance in group h with 49% concordance for mild severity for these 4 hearts in exercise #1 compared to 84% in exercise #2 (Figure 8). The “shift,” however, resulted in a decrement in concordance for the 4 hearts in group g, where there was 79% concordance for minimal severity (the appropriate categorization) in exercise #1 and 64% in exercise #2 (Figure 8). Votes for mild severity for this group increased from 20% in exercise #1 to 35% in exercise #2, with a net gain of 9 votes for mild severities. Five of those 9 votes were for 1 heart that contained a single affected area that was borderline and therefore difficult to assess. The affected area was characterized by multiple necrotic foci with mononuclear infiltrates and unclear borders adjacent to intervening more normal appearing areas. Based on the quantitative assessment, the aggregate size of the multiple necrotic foci was approximately 97,000 µ2 (black outlines in Figure 9), barely below the threshold of 106,000 µ2 (green rectangle in Figure 9). The large size and dispersed nature of this borderline lesion made it difficult to categorize, resulting in an even split between participants in exercise #2.
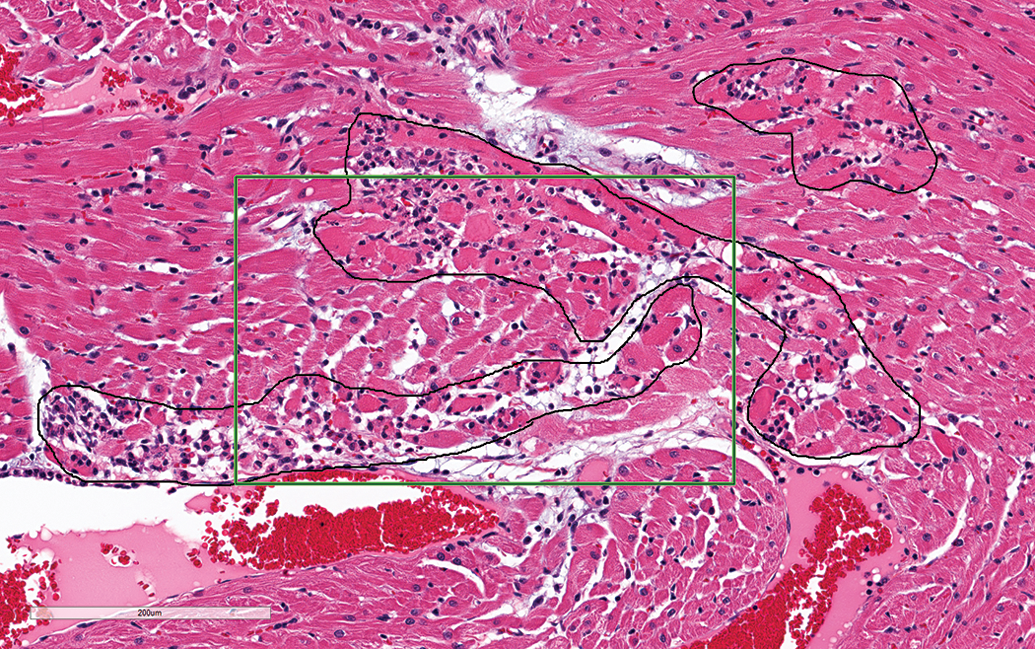
Control male Sprague Dawley rats from a GSK multisite study; a single affected area characterized by multiple (black outlines) necrotic foci with mononuclear infiltrates with intervening normal appearing areas. The aggregate size of the multiple necrotic foci is approximately 97,000 µ2, therefore, barely below the threshold of 106,000 µ2 (green rectangle; hematoxylin and eosin stain).
Six hearts were selected to represent 2 each relatively clear negatives (group a), minimal (group b), and mild (group c) severities. These were expected to have good concordance in exercise #1 with little to no increase in concordance expected in exercise #2. For group a, there was 83% concordance for the lack of a PCM/like lesion in exercise #1 and 93% in exercise #2. For the 2 lesions (group b) expected to be graded as minimal by most, there was 85% concordance in exercise #1 compared to 80% in exercise #2. All other votes were for mild severity, so there was 100% concordance for diagnosis of a lesion in both exercises. For the 2 lesions (group c) expected to be graded as mild by most, there was 71% concordance for mild severity in exercise #1 versus 75% in exercise #2. Nineteen percent voted for minimal in exercise #1, while only 2.5% (1 vote) voted for minimal in exercise #2, so this shift from minimal was a positive outcome and suggests the size criterion worked. Again, there was 100% concordance for diagnosis of a lesion. However, there was a shift to greater severity with 22.5% voting for moderate severity in exercise #2, compared to only 10% for moderate severity in exercise #1. The shift to moderate severity was an unexpected outcome and suggests the need to define a “threshold” for identifying lesions of moderate or greater severity. Use of the below described threshold (approximately 5% heart section involvement) would put all these lesions within the mild category, therefore potentially increasing concordance for mild severity.
Until now, we had focused on minimal and mild severities, as spontaneous lesions that most would consider beyond mild are quite rare in young rats. However, overall, there were 8 (6%) votes for moderate severities in exercise #1 and 9 (8%) votes for moderate in exercise #2. There was no assessment of number of votes for moderate severities in study #1, but votes for moderate did occur. Additionally, some of these same lesions were presented at the 2015 National Toxicology Program Satellite Symposium (Elmore et al. 2016), with several diagnosed as moderate or greater severity. Although low in number, the votes for moderate severity for lesions in these exercises, in study #1 and in Elmore et al. (2016), reflect deviation from the majority, therefore underscoring the need for guidance. The lesion that garnered most of the moderate severity grade votes was approximately 500,000 µ2, therefore approximately 5× the threshold size (106,000 µ2) for mild severity. We did not determine a size threshold whereby the majority would use a moderate or greater severity grade, and it would be difficult to identify enough large spontaneous lesions from short-term studies to make that determination. However, based on a very strong majority for mild (or less) severity for the largest lesion in these 2 exercises, it’s likely well beyond 500,000 µ2. Five percent of the heart section would be approximately 5,000,000 µ2, which is approximately 47× larger than the threshold for mild severity (Figure 5) and approximately 10× the size of the largest lesion in this exercise. While admittedly arbitrary, 5% appears to be a reasonable threshold for separation of mild from moderate and/or above severity grades and is less than the 10% used by Jokinen et al. (2011) for distinguishing between minimal and mild severities. Depending on the field number, the FOV with a 10× eyepiece and 10× objective reflects roughly 3% to 5% of the section of heart tissue, so with the more common 20 or 22 field pieces, 5% would slightly exceed the FOV using the 10× objective. Five percent is roughly one-fourth of the FOV using the 4× objective.
A 4-scale grading system (minimal, mild/slight, moderate, and marked) is used by some and a 5-scale grading system (minimal, mild/slight, moderate, marked, and severe) by others, with the latter recommended by the Food and Drug Administration’s Standard for Exchange for Nonclinical Data. Marked and/or severe spontaneous lesions are extremely uncommon in short-term studies and are therefore not addressed in this article.
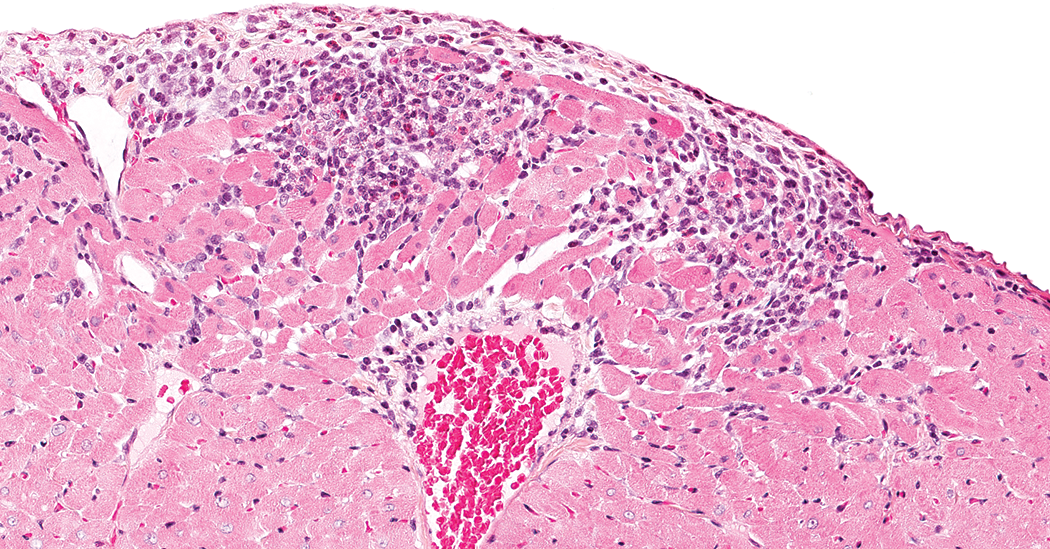
The large lesion above was also included in these exercises because of its location in the epicardial and subepicardial region of the right ventricle (Figure 10). Most considered it within the spectrum of PCM/like lesions, however, 3 participants thought it may not be PCM. This question was not asked in study #1, but based on lack of diagnosis for a fairly apparent epicardial lesion (see part 1), it was obvious that a number of those participants also did not consider this lesion to represent PCM. Discussions among the authors and other toxicologic pathologists provide anecdotal evidence that there are others with doubt. Due to the location in the superficial region of the right ventricle, some hypothesize that it may be a novel finding related to or exacerbated by repeated gavage tube injury, a standard method used to dose rodents in toxicology studies. Because of this hypothesis, heart sections from control male rats from gavage and nongavage 90-day toxicity studies were examined. The right ventricle was examined from 10 HSD and 100 F344/N rats from gavage studies and 40 male HSD and 104 male F344/N rats from nongavage (various routes) studies. Only lesions in the epicardial and/or subepicardial region were diagnosed as minimal or mild cardiomyopathy.
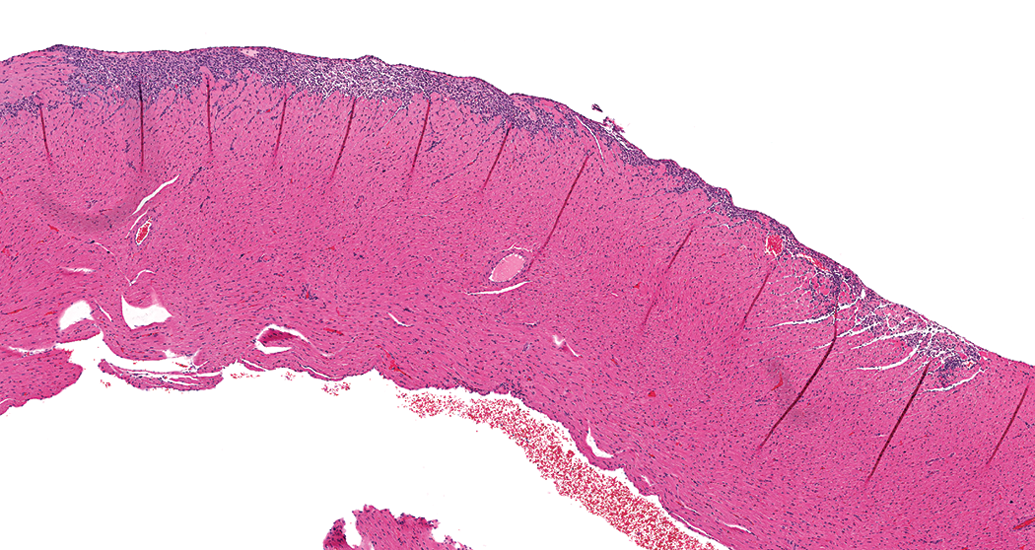
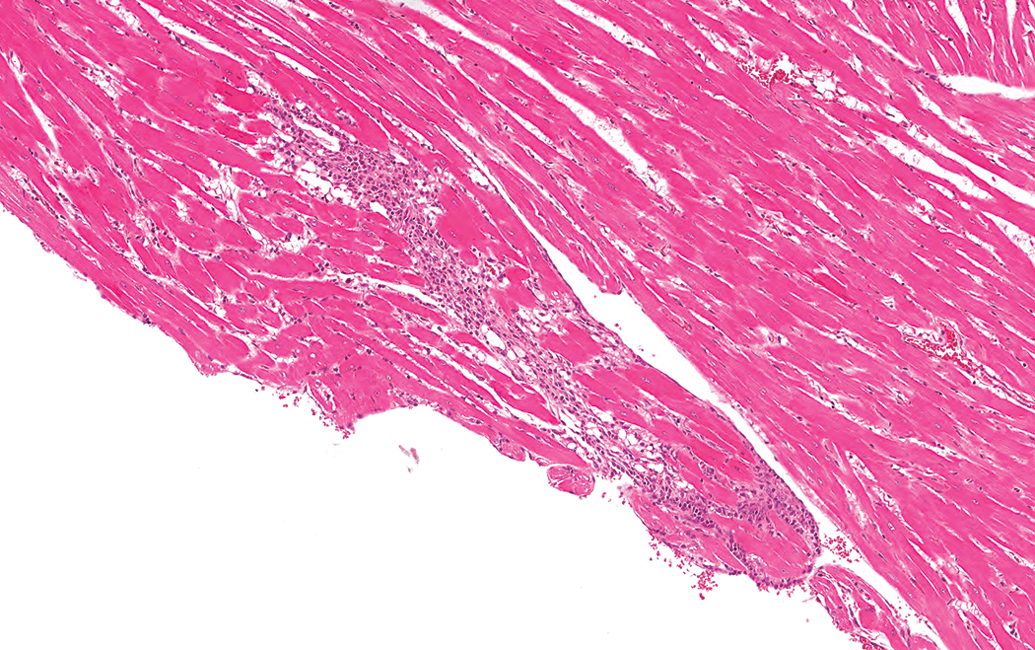
Control male Sprague Dawley rat from a GSK multisite study; a large lesion primarily comprised on inflammatory cell infiltrate within the epicardial and subepicardial region of the right ventricle (hematoxylin and eosin stain).
The gavage HSD rats had an incidence of 20% and a mean severity of 1.5, and the gavage F344/N rats had an incidence of 28% and a mean severity of 1.25. Nongavage HSD rats had an incidence of 25% with a mean severity of 1.2 and nongavage F344/N rats had an incidence of 26% with a mean severity of 1.33. The lesions were morphologically similar between the HSD and F334/N rats (Figures 11 –15) and characterized by a minimal to mild focal or multifocal infiltrates of predominately mononuclear inflammatory cells and variable degrees of necrosis and fibrosis. Occasionally, there was only a scant fibrous connective tissue scaffold with few inflammatory cells along the epicardium. The lesions generally occurred along the dorsal one-half of epicardium of the heart (toward the base) of the right ventricle.
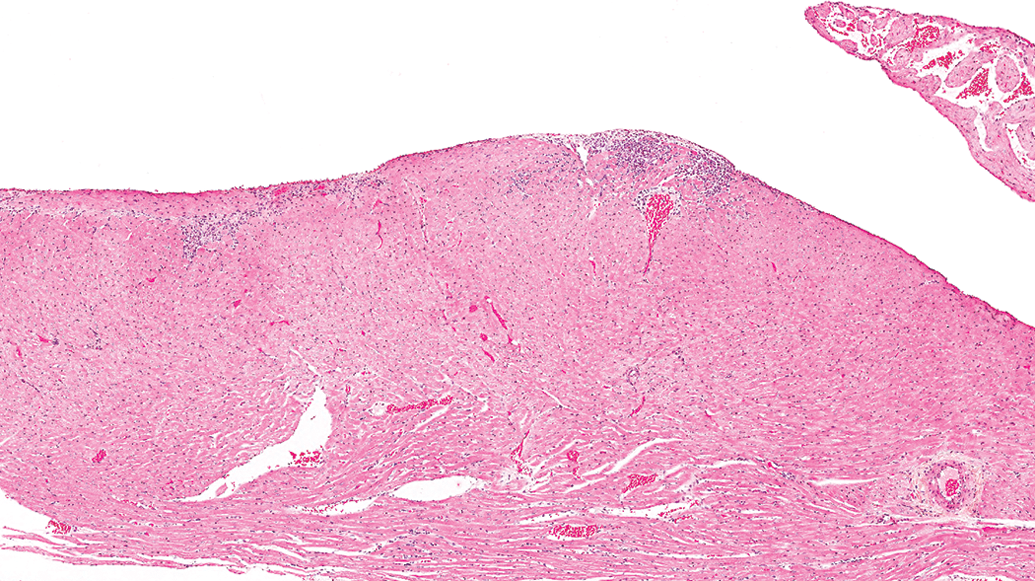
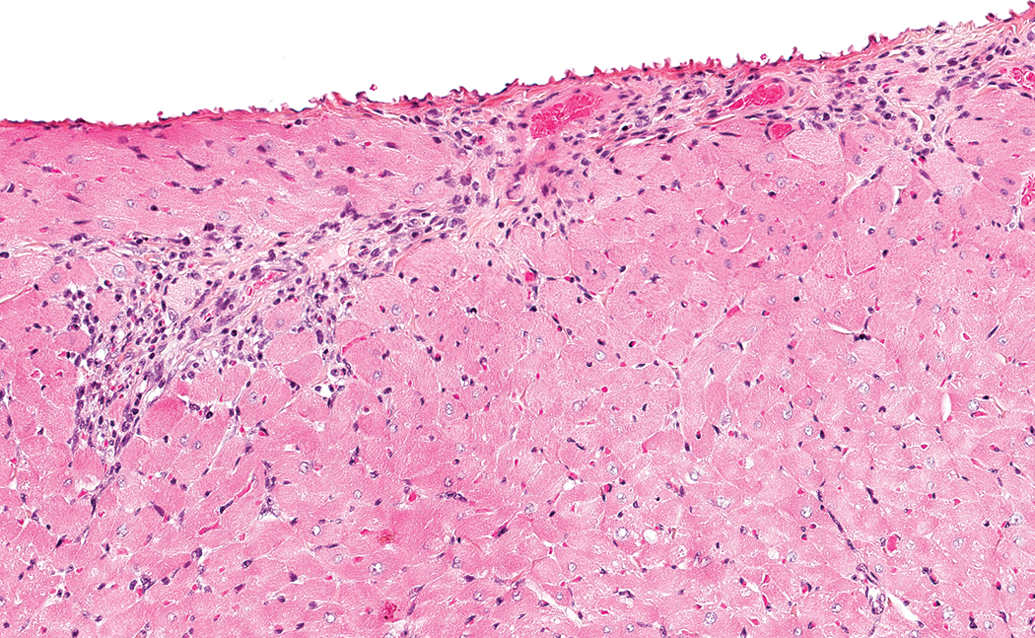
Control male Sprague Dawley rat from a National Toxicology Program 90-day feed study: a lesion in the epicardial and subepicardial region of the right ventricle (hematoxylin and eosin stain).
Control male Sprague Dawley rat from a National Toxicology Program 90-day feed study: a higher magnification of Figure 11 showing the active necrosis and inflammatory cell infiltrate component of the lesion (hematoxylin and eosin stain).
Control male Sprague Dawley rat from a National Toxicology Program 90-day feed study: a higher magnification of Figure 11 showing fibrosis and lesser inflammatory cell infiltrate (hematoxylin and eosin stain).
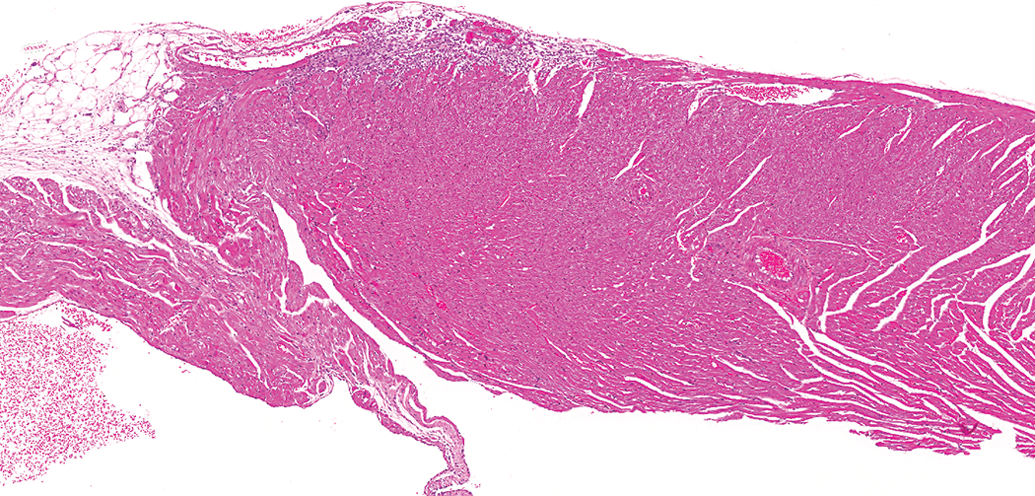
Control male F344/N rat from a National Toxicology Program 90-day feed study: a lesion in the epicardial and subepicardial region of the right ventricle (hematoxylin and eosin stain).
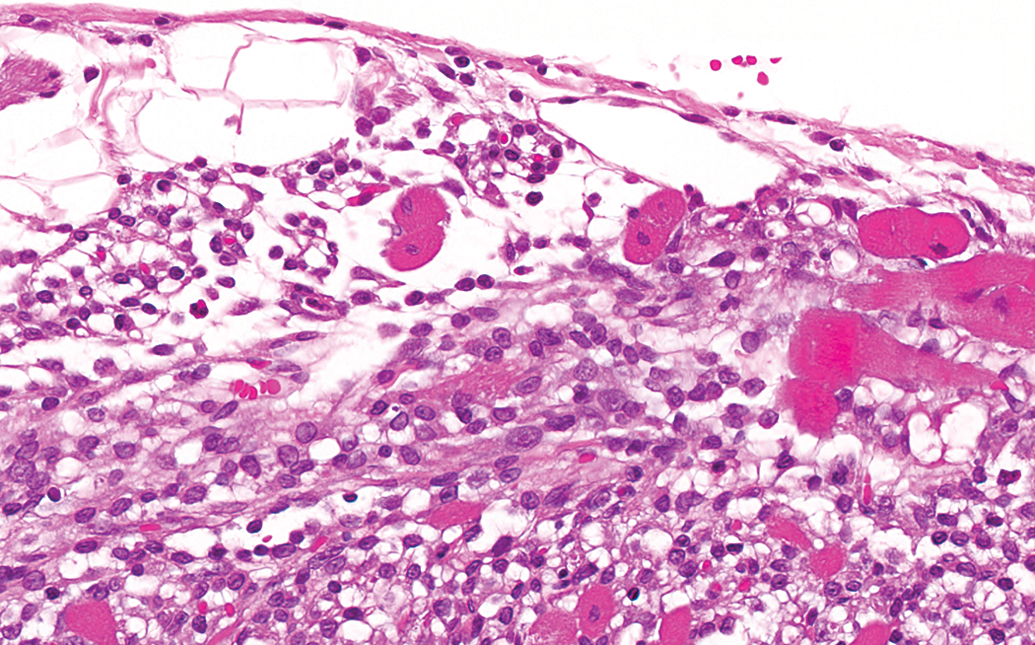
Control male F344/N rat from a National Toxicology Program 90-day feed study: a higher magnification of Figure 14 showing predominately inflammatory cell infiltrate and lesser necrosis and fibrosis (hematoxylin and eosin stain).
In this sample of control male rats, it is apparent that this right ventricular epicardial/subepicardial lesion occurs spontaneously, independent of and not exacerbated by the route of exposure. The incidences of these lesions were similar between the gavage and nongavage groups. The lack of a difference in lesion severity between gavage and nongavage studies also suggests the lesion is not exacerbated by the gavage procedure; however, our sample size is small, particularly for gavage studies in the HSD rat. Whether this lesion is part of the spectrum of PCM or if there is some other etiology remains to be determined. However, in the absence of definitive evidence otherwise, and because the morphologies are consistent with the spectrum of morphologies seen with PCM/like lesions, it seems reasonable to consider it part of the spectrum of PCM until proven otherwise.
Summary
Exercises 1 and 2 were conducted to “test” the described harmonized diagnostic approach identified in part 1 of this article. First, we wanted to determine whether conclusions from study #1 that provided the basis for the 3 main components of the described harmonized diagnostic approach would be corroborated by a group of pathologists representing a broader cross section of our toxicologic pathology community, and those conclusions were corroborated. The second part of the evaluation was to determine whether application of the described harmonized diagnostic approach improved diagnostic consistency of PCM/like lesions among pathologists. Results from exercise #1 in which individualized diagnostic approaches were used were compared to exercise #2, where the proposed harmonized diagnostic approach was implemented. By most measures, use of the described harmonized diagnostic approach did improve diagnostic consistency. While there was notable enhanced diagnostic consistency in exercise #2, the authors feel that with more use and/or familiarity coupled with the use of one’s personal microscope instead of a computer monitor, consistency among pathologists using the proposed diagnostic approach would and will continue to improve. Examining images on the computer screen remains not as efficient nor as familiar as examining slides using a microscope, and despite great advances, differences in technology (video cards, monitor quality, etc.) may impact the quality of images. An additional complication in exercise #2 was determining the magnification in ImageScope™ or WebScope™ that resulted in equivalent fields of view between the monitor and 60× microscope objective.
Two other issues were highlighted by these 2 exercises. A need to define a criterion for separating mild from moderate or greater severity was identified, and we propose approximately ≥5% heart section involvement as a reasonable threshold for diagnosing a lesion of moderate or greater severity. This criterion should minimize use of moderate severity grade for lesions likely graded as mild by a majority of pathologists and further strengthen concordance of diagnoses within the mild category.
Some questioned whether morphologies resembling PCM, but localized within the epicardial and subepicardial region of the right ventricle are part of the spectrum of spontaneous PCM. Some further speculated that these lesions may be caused and/or exacerbated by the gavage procedure. Because of this uncertainty, heart sections from control male rats (HSD and F344/N) from gavage and nongavage 90-day toxicity studies were evaluated for PCM/like lesions only in this area of the right ventricle. In this sample, there were no strain (HSD and F344/N) or dose route differences in the morphology, incidence, and/or severity of lesions diagnosed in this area. Perturbation with a gavage tube is clearly not the sole cause of or the main contributor to this lesion, and though the sample size is small, our findings also suggest it’s not exacerbated by the gavage procedure. Whether this lesion is part of the spectrum of PCM or whether there is some other etiology remains to be determined. However, in the absence of evidence otherwise, and because the morphologies are consistent with the spectrum of morphologies seen with PCM/like lesions, it seems reasonable to consider these lesions part of the spectrum of PCM until evidence of the contrary is available.
One of the most important aims of a harmonized diagnostic approach is to ensure more reliable and robust HCD. To that end, use of a single term for diagnosis of these lesions may provide the largest gain, as it would dramatically increase the efficiency and accuracy of HCD mining and communication of these data. An equally negative impact on current HCD is the variable use of thresholds for diagnosing PCM lesions. A major gain in consistency in exercise #2 was related to diagnosis of small lesions by participants previously using a diagnostic threshold.
As spontaneous mild lesions are uncommonly observed in short-term toxicity studies, and the presence of several in treated groups may be important for identifying subtle test article–related effects or for identifying no observed effect or no observed adverse effect levels, appropriately categorized severity grades are also important in HCD. Although there was a great gain in categorizing lesions of mild severity in exercise #2, it was partially offset by a decrement in categorizing lesions of minimal severity. We believe specific instructions with illustrations (Table 1) will further enhance proper categorization of minimal lesions. Inclusion of a threshold for categorization of moderate lesions as well as instructions on dealing with right ventricular epicardial/subepicardial lesions should further tighten HCD.
Footnotes
Acknowledgment
The authors are grateful to GlaxoSmithKline for overall support of this project and the many materials provided. We thank the Society of Toxicologic Pathology (STP) for supporting the Cardiovascular Toxicologic Pathology Special Interest Group (CVSIG) who by virtue of their dedicated scientific zeal in this area coupled with their multi-company/agency representation, made completion of this project possible. We also thank the National Institute of Environmental Health Sciences (NIEHS) and Experimental Pathology Laboratories (EPL) for hosting and providing access (Emily Singletary) to images for the test exercises in part 2 of this manuscript. We thank Beth Mahler for her work on the images and tables. The authors are extremely indebted to the many participants in Study #1 and exercises #1 and #2 (part 2) as none of this would have been possible without their generous donation of time and effort during a very busy time in our industry.
Author Contribution
Authors contributed to conception or design (JRH, HT, JK, PC, BB, CK, DM, JH, ND, DR, AN, JT, RA); data acquisition, analysis, or interpretation (JRH, BM, GP, BB, CK, GAP, DM, SE, JH, ND, DR, JF, ML, KB, BSB, VC, AN, NT, HW, JB, IB, JT, RA); drafting the manuscript (JRH); and critically revising the manuscript (BM, HT, GP, JK, PC, BB, CK, GAP, DM, SE, JH, ND, DR, JF, ML, KB, BSB, VC, AN, NT, HW, JB, IB, JT, RA). All authors gave final approval and agreed to be accountable for all aspects of work in ensuring that questions relating to the accuracy or integrity of any part of the work are appropriately investigated and resolved.
Declaration of Conflicting Interests
The author(s) declared no potential conflicts of interest with respect to the research, authorship, and/or publication of this article.
Funding
The author(s) received no financial support for the research, authorship, and/or publication of this article.