
Abstract
As ovarian toxicity is often a safety concern for cancer therapeutics, identification of ovarian pathology is important in early stages of preclinical drug development, particularly when the intended patient population include women of child-bearing potential. Microscopic evaluation by pathologists of hematoxylin and eosin (H&E)–stained tissues is the current gold standard for the assessment of organs in toxicity studies. However, digital pathology and advanced image analysis are being explored with greater frequency and broader applicability to tissue evaluations in toxicologic pathology. Our objective in this work was to develop an automated method that rapidly enumerates rat ovarian corpora lutea on standard H&E-stained slides with comparable accuracy to the gold standard assessment by a pathologist. Herein, we describe an algorithm generated by a deep learning network and tested on 5 rat toxicity studies, which included studies that both had and had not previously been diagnosed with effects on number of ovarian corpora lutea. Our algorithm could not only enumerate corpora lutea accurately in all studies but also revealed distinct trends for studies with and without reproductive toxicity. Our method could be a widely applied tool to aid analysis in general toxicity studies.
Introduction
The identification of ovarian pathology in animal toxicity studies is important in the general safety assessment of novel therapeutics. In some patient populations, the tolerability of drug-related ovarian toxicity needs to be carefully considered in terms of patient risk–benefit. Information derived from enhanced characterization of ovarian structures may inform clinical management of reproductive toxicity, such as the potential need for egg preservation and other fertility-sparing procedures.
Histopathologic examination of hematoxylin and eosin (H&E)–stained sections by pathologists has been the gold standard for evaluation of the ovary in general toxicity and fertility studies. Pathologists typically assess the presence, absence, and general numbers of corpora lutea (CLs) as well as the stage and number of follicles and integrate this information with histopathology changes in other reproductive tract organs to ultimately determine the presence or absence of a test article–related ovarian effect. 1 Given the rat’s short estrus cycle of approximately 4 to 6 days, there is considerable structural and physiologic heterogeneity that exists among rodent ovaries in any given toxicity study. This can make it difficult to identify clear test article–related effects using a standard single H&E section when examining across a large number of rodents. In a cross-industry collaborative study comparing adequacy of ovarian histopathology evaluation of single H&E sections from repeat dose and fertility studies, both significant increases and decreases in CL numbers were identified by pathologists as evidence of ovarian toxicity. 2 However, the enumeration of CLs from single tissue sections has been reported to suffer from sampling errors. 3 Moreover, Bucci et al also demonstrated that follicle counts from the 1% sample strategy (selecting 1% of sections randomly for counts) had a larger error term when compared with 5% or higher sample strategy. 4 In addition, the large number of animals included in a single study and the numerous structures assessed on each ovarian tissue section make the histopathologic assessment of these sections time-consuming and error prone. Although the quantification of CLs from studies with a single H&E section could detect ovarian toxicity, limited numbers of studies have investigated the influence of ovary sectioning location or tissue area on CL counts and interpretation of potential test article effects. Given the heterogeneity of tissue sections taken from different sectioning levels of a single ovary, stereology, or a modified stereological approach to quantify CLs or follicles should be performed for thorough characterization of the ovary, but this type of analysis requires time-consuming examination and manual annotations of serial sections by a pathologist.
Recent deep learning algorithms can deliver human-level accuracies in many computer vision tasks such as image classification. 5 Although factors such as limited sample size and annotation make developing deep learning algorithms for pathology applications challenging, 6 several studies have demonstrated strong performances for pathology applications with deep learning algorithms. For instance, Liu et al developed a Lymph Node Assistant algorithm based on the Inception-V3 algorithm for metastatic breast cancer detection in sentinel lymph node biopsies and achieved above 99% in area under the receiver operative characteristic curves for slide-level classification. 7 Ferlaino et al implemented an ensemble deep learning algorithm to localize and classify placental cells with an accuracy of 89%. 8 Moreover, Steiner et al showed that the efficiency of pathologists was improved with the assistance from deep learning algorithms. 9 Therefore, an accurate deep learning algorithm that can identify CLs in ovaries could potentially reduce the workload of CL enumeration for pathologists and reproducibly detect ovarian toxicity.
RetinaNet is an object detection deep learning neural network with great performances in speed and accuracy. 10 Here, we used RetinaNet to train an algorithm to detect CLs in rat ovaries. Our objectives for developing this deep learning algorithm were to create a method for automated digital image analysis of H&E sections to quantify CLs in rat ovaries with accuracy similar to the gold standard pathologist light microscopic assessment. By utilizing H&E-stained sections, we could avoid the need for special stains that would likely add cost and time delays in the routine screening of drug candidate molecules. This deep learning algorithm was tested on digitized ovary images from 5 toxicity studies in which ovarian pathology was or was not identified by at least 2 pathologists. In this article, we show our algorithm can accurately detect CLs, and the overall results of the algorithm agree with the pathologists’ assessment of CL counts in rat ovaries.
Materials and Methods
Study Design
Ovarian tissue sections from 5 repeat dose toxicity studies conducted in support of completed compound development programs were included in this retrospective study. All studies were approved by the Institutional Animal Care and Use Committee. All procedures in the studies were in compliance with the Animal Welfare Act, the Guide for the Care and Use of Laboratory Animals, and the Office of Laboratory Animal Welfare. Female Sprague-Dawley rats were used for all 5 studies. Figure 1 summarizes the study design for this investigation. The detailed study design is as follows. First, an object detection deep learning neural network, RetinaNet, 10 was trained with all tissue sections from study 1 to identify CLs. The RetinaNet was trained with the annotations from pathologists A and B on the training set comprising ∼90% of all sections from study 1. The remaining tissue sections from study 1, ∼10% of study 1 sections, were also annotated by both pathologists A and B and served as part of the validation set (study 1 subset). Within this subset, pathologists A and B were blinded to each other’s annotations and the variations were computed. Next, in a subset of sections in study 2, CLs were counted by pathologists A and C and used as the gold standard test set. The trained RetinaNet was applied to this same test set to evaluate the accuracy of the RetinaNet in CL counting compared to the gold standard. The accuracy of the CL counts from RetinaNet in the test set was compared to the interpathologist variation calculated in study 1. In the final step of validation, the RetinaNet was applied to studies with and without ovarian pathology findings to investigate whether our deep learning method results in observations similar to those from pathologists. The RetinaNet CL counts between treated and control groups were compared for studies 3 to 5. The relation between the tissue area and CL counts was also investigated in study 3. Table 1 summarizes the 5 toxicity studies and whether ovarian pathology was observed by the pathologists for each study or not. The details of the tissue sectioning, manual annotation, image processing, model training, and statistical analyses are described in the following sections. The details of the protocols for the individual toxicity studies are described in the supplementary document.
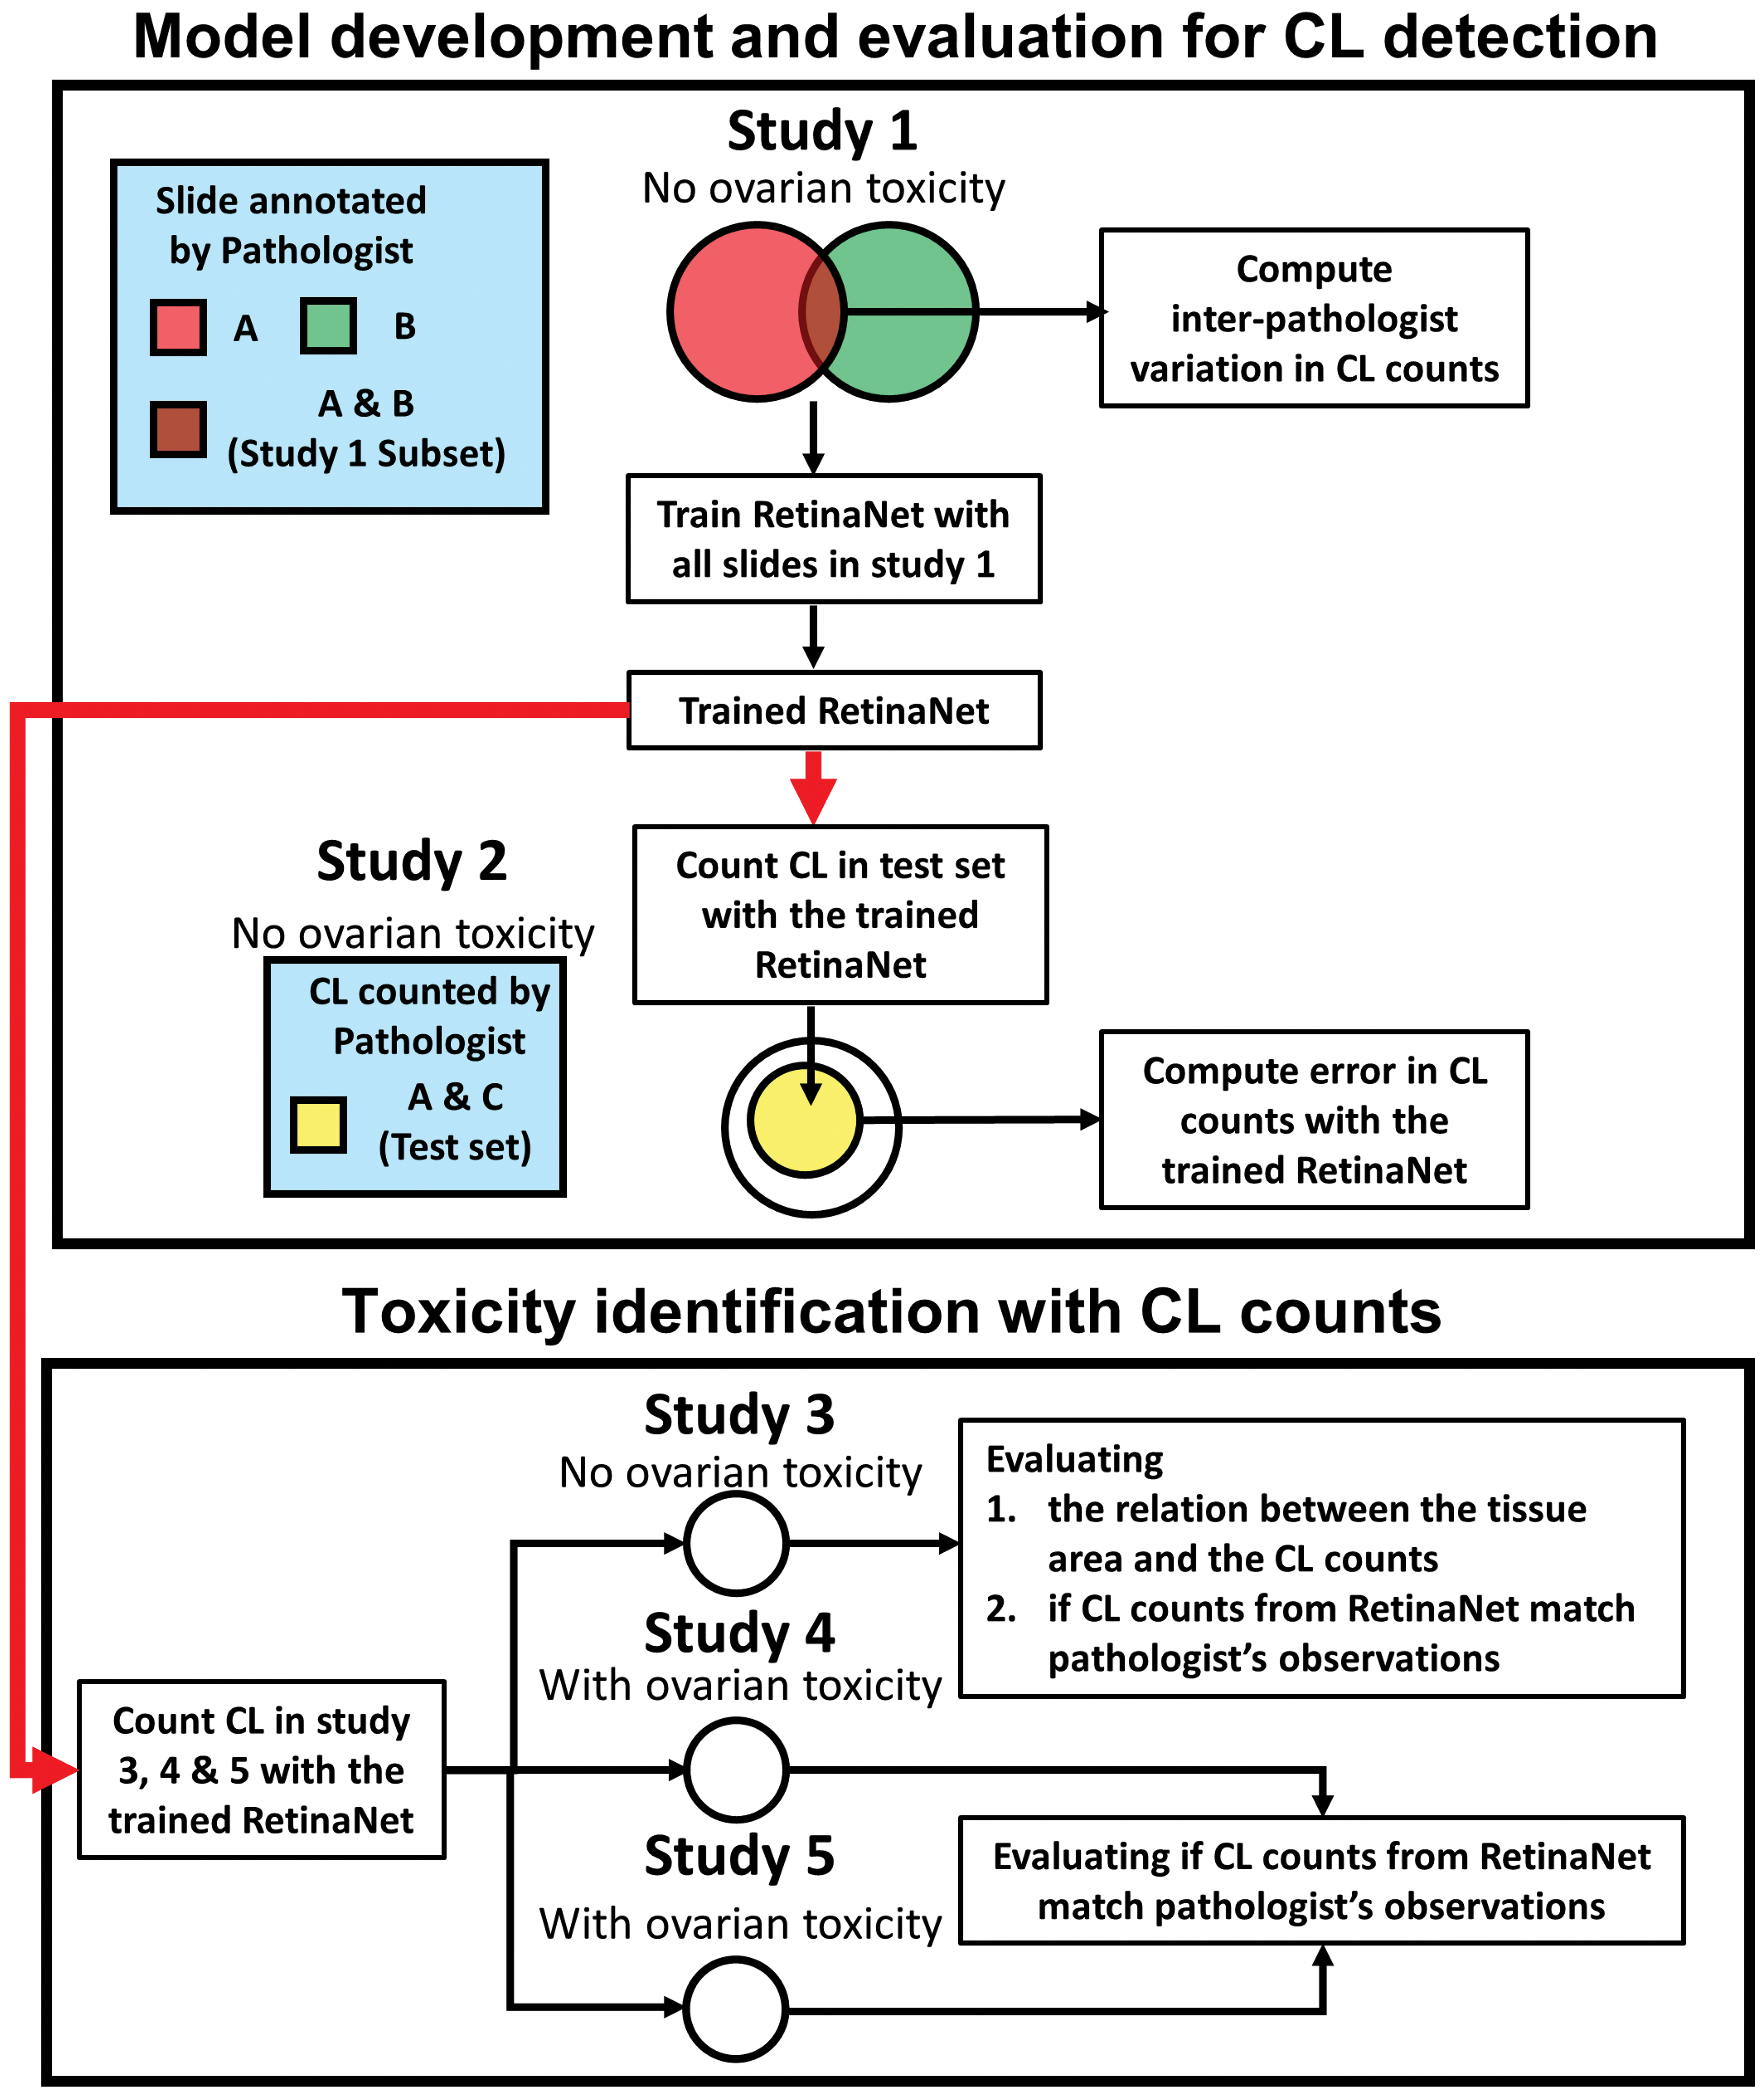
Flow chart to develop and validate the algorithm for detecting ovarian toxicity. Five retrospective toxicity studies were used in this article. Studies 1 and 2 were used for the development of the algorithm to quantify corpora lutea (CLs) using an object detection deep learning network, RetinaNet. Studies 3 to 5 were used to evaluate whether our method can identify similar ovarian pathology as that from the gold standard pathologist assessment. The RetinaNet was first trained with all slides in study 1 and tested in the test subset of study 2. The errors between the RetinaNet and pathologists’ assessment in the test set were compared to the interpathologist variation computed from the study 1 subset. Next, CLs were counted by the algorithm in studies 3 to 5. The relation between the tissue area and the CL counts were investigated in study 3. The CL counts in the treated group and the control group were compared within studies 3 to 5 to determine whether our algorithm could recapitulate the gold standard pathologist assessment in each of these studies.
Summary of the Study Designs.a
Abbreviations: CL, corpus luteum; Tox, toxicity.
a Study 1 was annotated by 2 pathologists and was used for training and validating the RetinaNet. Study 2 was used for evaluating the agreement between the RetinaNet and the pathologists. CL counts for studies 3 to 5 were obtained from RetinaNet.
b Fifty rats underwent 15 weeks of recovery period after the 26 weeks of dosing.
c Only 79 of the 100 animals had manual CL counts from the pathologists.
Histology Sections and Digitalization
In all studies used in this article, Sprague Dawley Crl: CD (SD) rats were necropsied, and tissues were examined macroscopically and processed for routine histologic examination. Although we anticipated that a single H&E section would be adequate for our analyses, we wanted to investigate whether step sections would potentially change the general conclusion of the individual study outcome. Therefore, for each ovary examined, we analyzed six, 5-µm thick sections, cut 150-µm apart. Sections were labeled as L1 (as defined by the first step section), L2, L3, L4, L5, and L6 (the last step section, and likely to contain the least amount of tissue in the block), respectively. Individual 150-µm step sections were chosen based on the size of CLs 11 to detect most individual CLs while limiting the likelihood of capturing the same CL in multiple sections. Based on our findings from analyzing the step sections, we proceeded with using a single 5-µm thick H&E section from each ovary for studies 2, 4, and 5. All H&E sections were digitized using whole-slide bright-field scanners. Sections from studies 1 to 3 were scanned with a Hamamatsu Nanozoomer scanner at ×20, and sections from studies 4 and 5 were scanned with an Leica Aperio scanner at ×20 magnification.
Manual Annotation From Pathologists
All H&E sections in study 1 were manually annotated by pathologists A and B to identify CLs. Bounding boxes were drawn around all CLs present in the tissue section for identification purposes using Leica Aperio ImageScope. The total CL counts were computed by counting the number of bounding boxes in each ovary section. To evaluate the interpathologist variation, 224 ovary H&E sections from all levels were randomly selected and annotated by both pathologists. These 224 sections were defined as study 1 subset, as described previously. The remaining ovary sections were split in half and annotated by either pathologist A or B. For study 2, only the total CL counts from the test set (155 ovary sections) were reported from pathologists A and C. The total CL counts were not reported for the remaining ovary sections in study 2. Corpora lutea were not manually annotated by pathologists in studies 3 to 5.
Image Processing, Model Training, and Inference
Images at ×5 magnification were extracted from the ×20 scans for all studies. Ovarian tissue was identified using Otsu’s method 12 after the images were converted to grayscale. Ostus’s method is used to automatically determine the threshold value to turn grayscale images into binary images (area of the tissue and area of the background for the images of the ovary) based on the histogram of the images. Next, the images were cropped so that each image only contained a single ovary. The area of the ovary was computed by summing the number of positive pixels after Otsu’s threshold value was applied.
RetinaNet, 10 with deep residual neural network (50-layer version) as a backbone, was used for CL detection. The pretrained deep residual neural network from ImageNet was used for transfer learning. The cropped ovary images and the annotations from study 1 were used to train the RetinaNet. For study 1 subset, which was annotated by both pathologists A and B, bounding boxes from both pathologists were used. When the same CL was identified by both pathologists, individual annotations were combined into a single bounding box. The smaller bounding boxes were replaced with the larger bounding boxes.
The sections in study 1 were randomly split into training (90%) and validation sets (10%). The cropped images were resized with a minimum side (width or height) of 2500 pixels or with a maximum side (width or height) of 3000 pixels and kept with the original aspect ratio. Random erasing, shifting, brightness, rotation, Gaussian blurring, and elastic transformation were used for data augmentation. Since the color of the H&E staining could vary among studies, the differences in image mean between study 1 and other studies were multiplied with random factors (range from −20 to −40) and added to the original training images for additional data augmentation. Model training was performed with a step size of 3000 for 30 epochs using a batch size of 1. The Smooth L1 loss (σ = 3) was used for regression loss, and the Focal loss (α = .4 and γ = 2) 10 was used for classification loss. Adam optimizer 13 was used (learning rate = 1 × 10⁻⁵) for optimization.
The trained RetinaNet was applied to the cropped ovary images in studies 2 to 5. During the inference, the cropped ovary images were first resized using the same methods as described above and then fed to the trained RetinaNet. Bounding boxes with probability scores of a CL were generated after the application of the trained RetinaNet to the cropped ovary images. Bounding boxes with less than 0.5 in probability scores were ignored. Total number of RetinaNet identified CLs were counted for each ovary. Similarly, the average CL counts from both left and right ovaries were also computed.
Statistical Analyses
Nonparametric statistical analyses were used throughout the article due to the limited sample size. Normality tests 14,15 were also performed to confirm the distribution (data not shown). To evaluate the accuracy of RetinaNet in total CL counts, the trained RetinaNet was tested in study 2, which had a different experimental protocol, and was validated against a coevaluation from the pathologists A and C in the test set. Since this was count data and not categorical data, Bland-Altman method and Spearman rank correlation coefficients were used to assess the agreement in total CL count per ovary between pathologists A and B in the study 1 subset as well as the agreement between the coevaluation from pathologists A and C and the trained RetinaNet in the test set.
We expected the tissue area to linearly correlate with the CL count. The normality test was performed to determine whether the CL counts were normally distributed in study 3. To evaluate the relationship between the tissue area and CL count in association with the sectioning level, Spearman rank correlation coefficients were computed between the tissue area and the CL count from all levels as well as at each level in study 3. Since tissues with a smaller area are likely to have fewer CLs, the CL count was divided by the ovary tissue area for normalization. The Kruskal-Wallis tests were performed among the normalized CL counts from all levels and among the normalized CL counts from all treated and control groups in study 3. Next, the average CL counts normalized to tissue area from all levels were computed per rat. The average CL counts normalized to tissue area in the treated groups (low, mid, and high dose), and the control group in studies 3 to 5 were compared using Wilcoxon rank-sum test, respectively.
Computational Tools
Image analyses and statistical analyses were performed in Python (Python 3—Python Software foundation; https://www.python.org/), a general purpose, high-level programming language. The training and inferring of the RetinaNet 10 in this article were performed in Keras/Tensorflow, 16 2 freely available and easy-to-use deep learning frameworks. The training and inferring were performed using a single GPU (Nvidia, P6000, quadro).
Results
Errors in CL Counts From Retinanet in the Test Set Were Similar to the Interpathologist Variation in the Training Set
Our initial step in developing and testing our algorithm was to train RetinaNet to accurately identify CLs in tissues. Figures 2 and 3 show representative images that contained multiple or no CLs from studies 2 to 5. The presence of CLs was confirmed by the pathologists in the representative images. Bounding boxes were drawn in the area that had >50% probability of containing a CL. Next, to quantify the accuracy of the RetinaNet in CL counting, the trained RetinaNet was applied to study 2, and the results were compared to the interpathologist variation in study 1 subset. Figure 4A and B shows the Bland-Altman plots for the CL counts between pathologists A and B in study 1 subset as well as the CL counts between the pathologists (reviewed by pathologists A and C) and the trained RetinaNet in the test set, respectively. The mean absolute difference in CL count was 0.64 ± 0.088 (mean and standard error) between pathologists A and B for study 1 subset, and the mean absolute difference in CL count was 0.57 ± 0.096 between the pathologists and the trained RetinaNet for the test set. Figure 4C and D shows the scatter plots for the CL counts from pathologists A and B in study 1 subset and from the pathologists and the trained RetinaNet in the test set, respectively. The CL counts were divided by the maximum CL count from pathologists A and B for study 1 subset and by the maximum CL count from the pathologists and RetinaNet in the test set for visualization purposes. The CL counts between pathologists A and B were strongly correlated (R = 0.99, P < .01), and the CL counts between the pathologists and the trained RetinaNet were strongly correlated as well (R = 0.97, P < .01). In summary, the trained RetinaNet occasionally made mistakes as can be seen in Figures 3A, 4B, and 4D. However, the error rate was low and was similar to the interpathologist variation. Further increase in the training sample size could potentially improve the model accuracy.
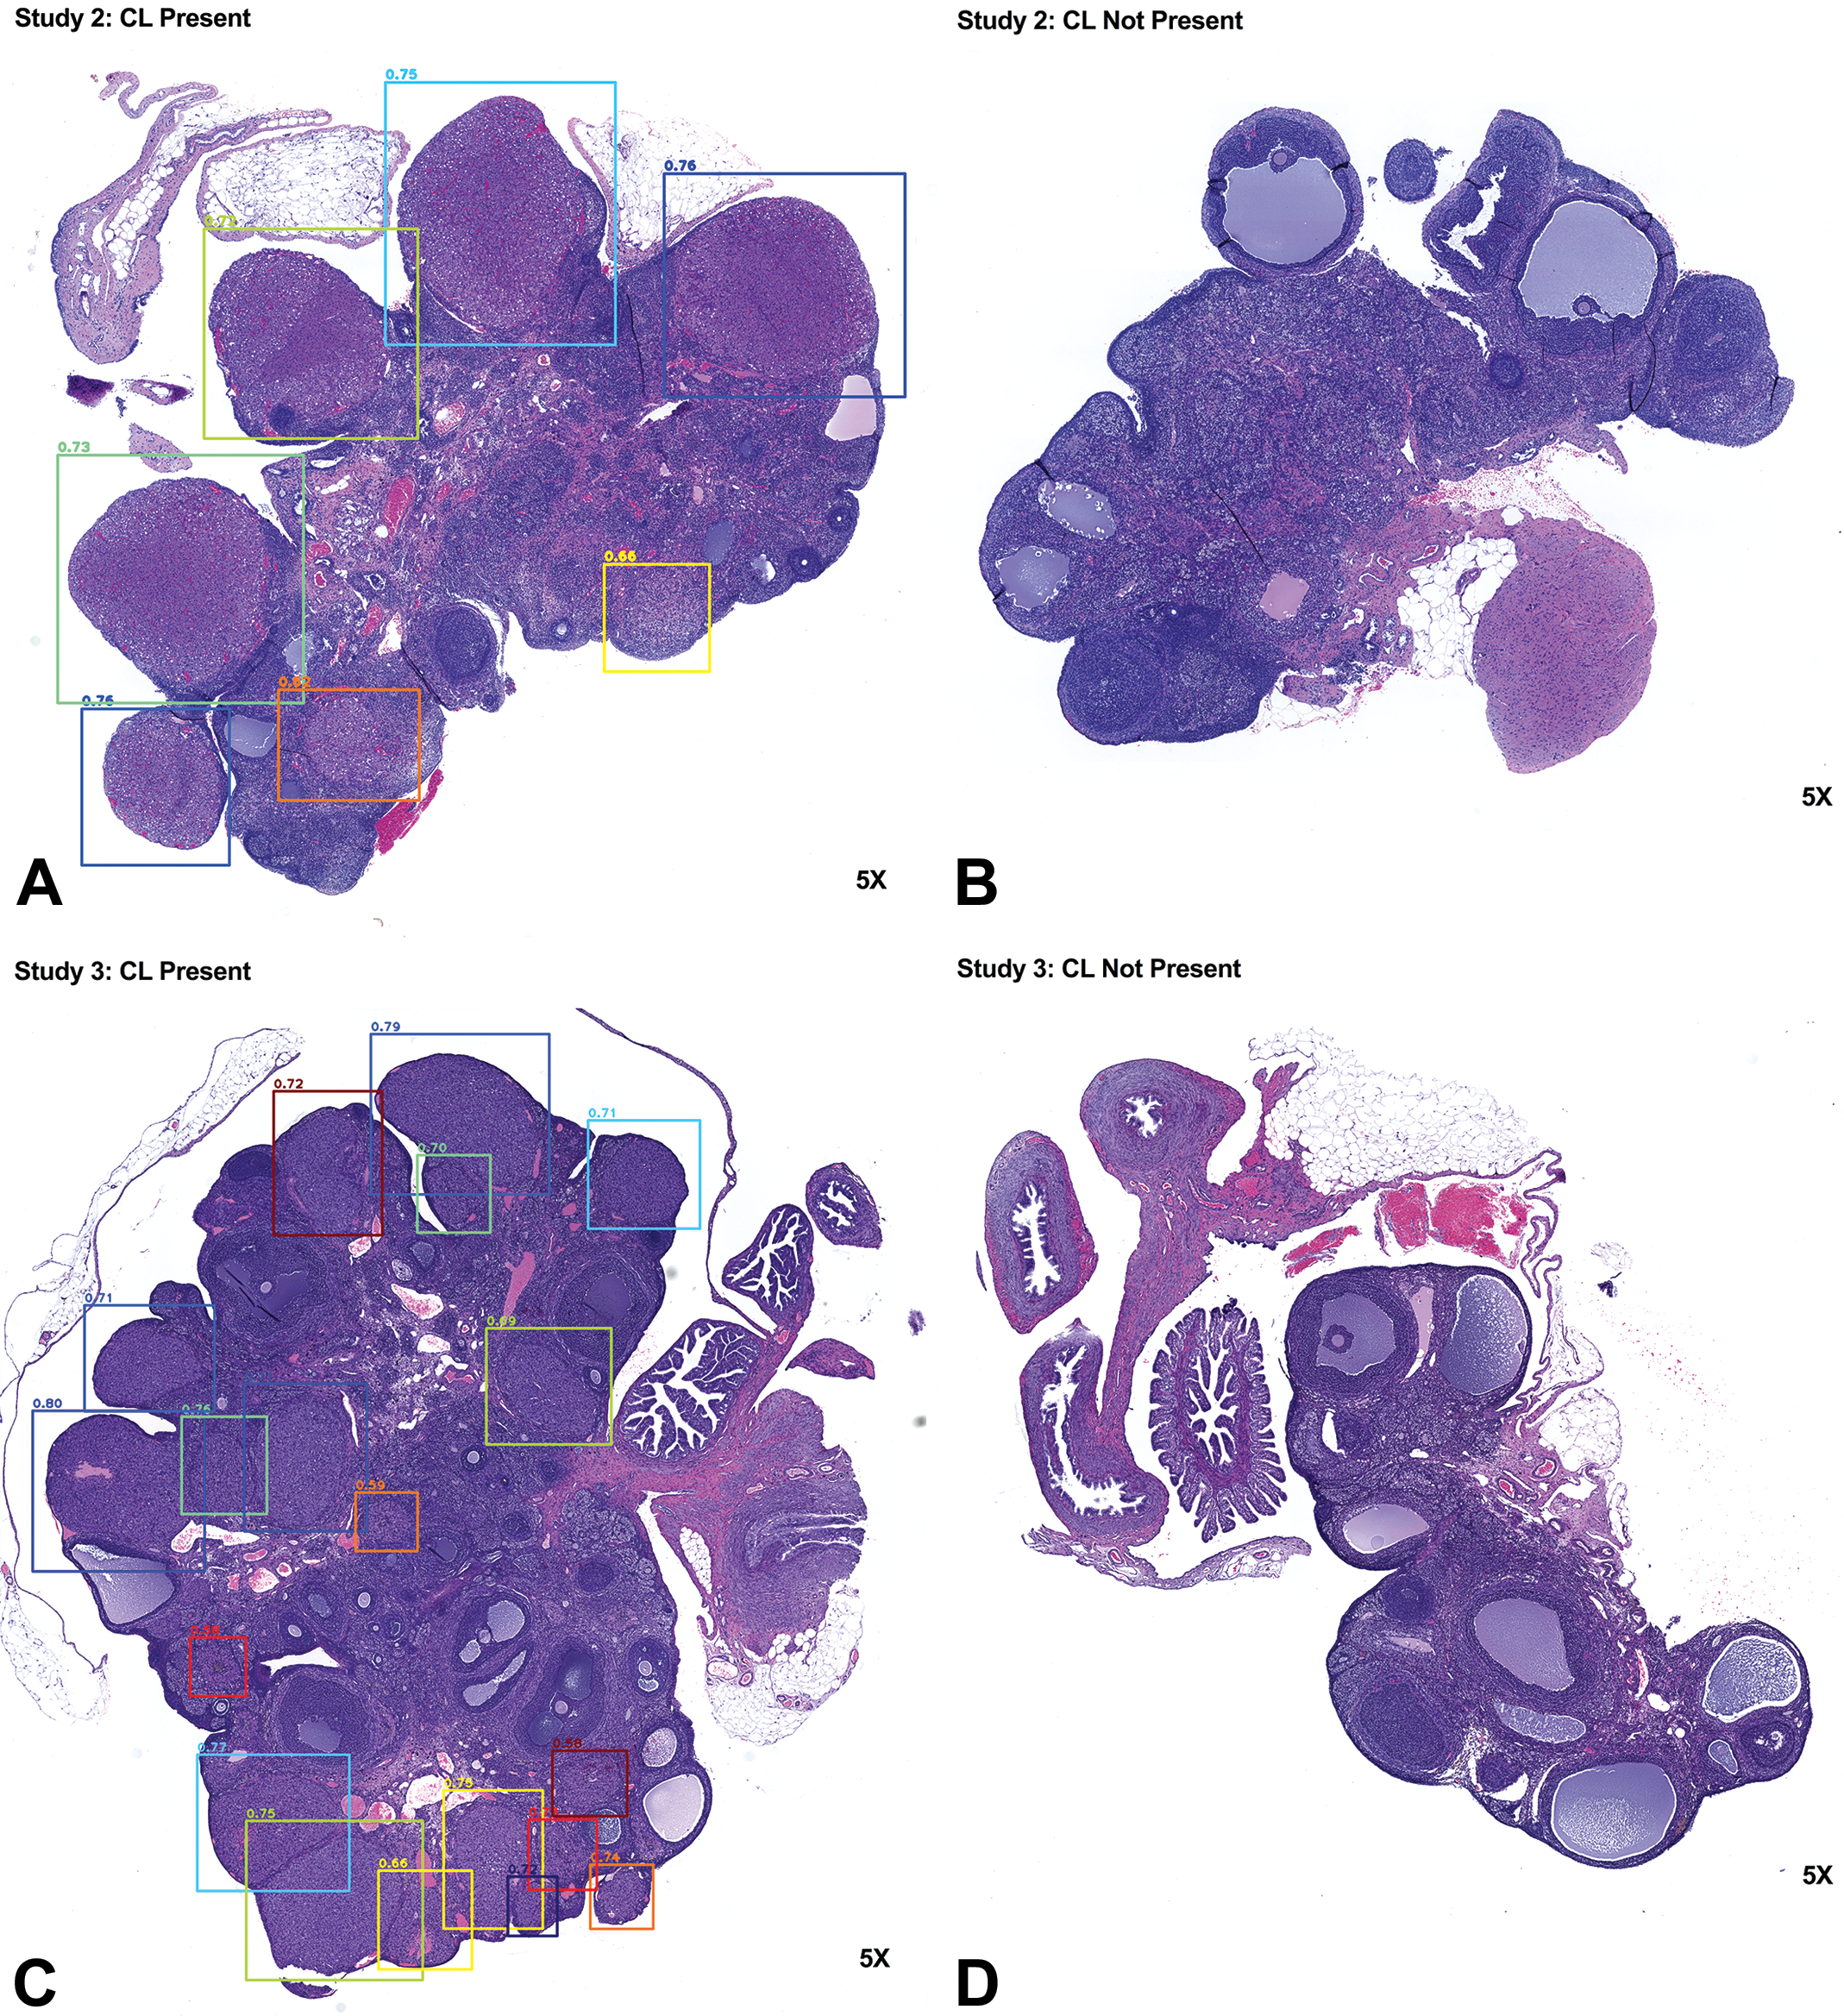
The trained RetinaNet can accurately detect corpora lutea in studies 2 and 3. A to D show representative results for studies 2 and 3 from the trained RetinaNet. Corpora lutea were accurately identified when present in hematoxylin and eosin (H&E)–stained ovarian tissues and vice versa. The number above the bounding box shows the probability score of a corpus luteum present in the box.
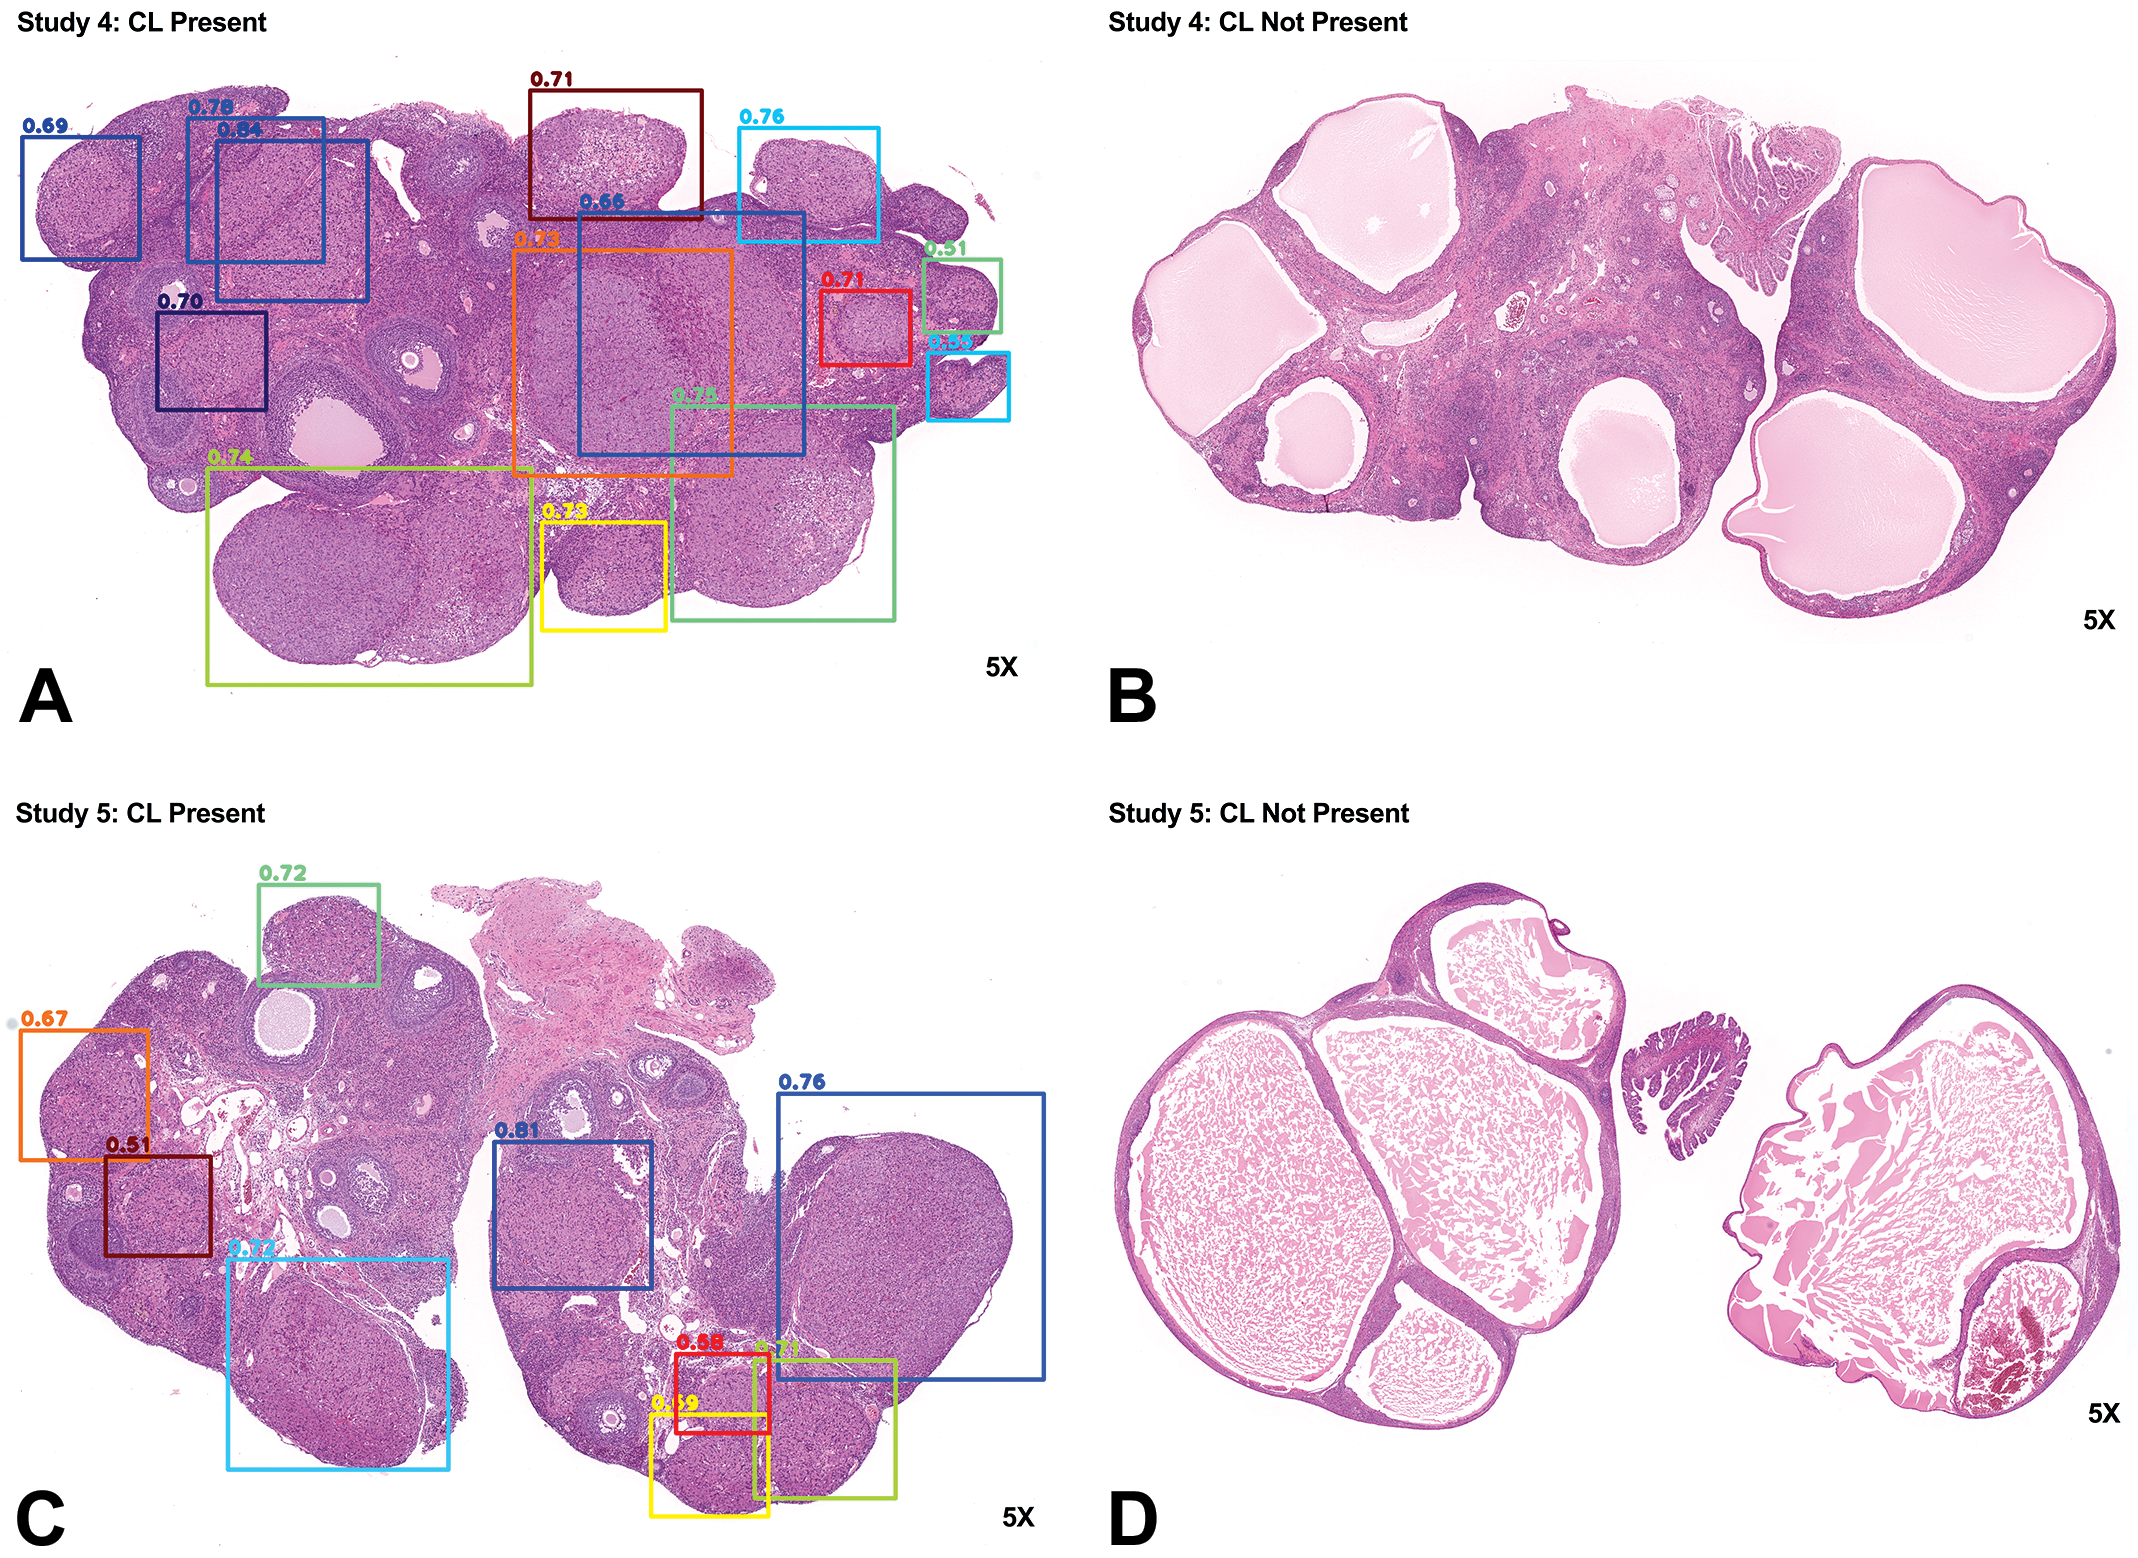
The trained RetinaNet can accurately detect corpora lutea in studies 4 and 5. A to D show representative results for studies 4 and 5 from the trained RetinaNet. Corpora lutea were accurately identified when present in hematoxylin and eosin (H&E)–stained ovarian tissues and vice versa. The number above the bounding box shows the probability score of a corpus luteum present in the box.
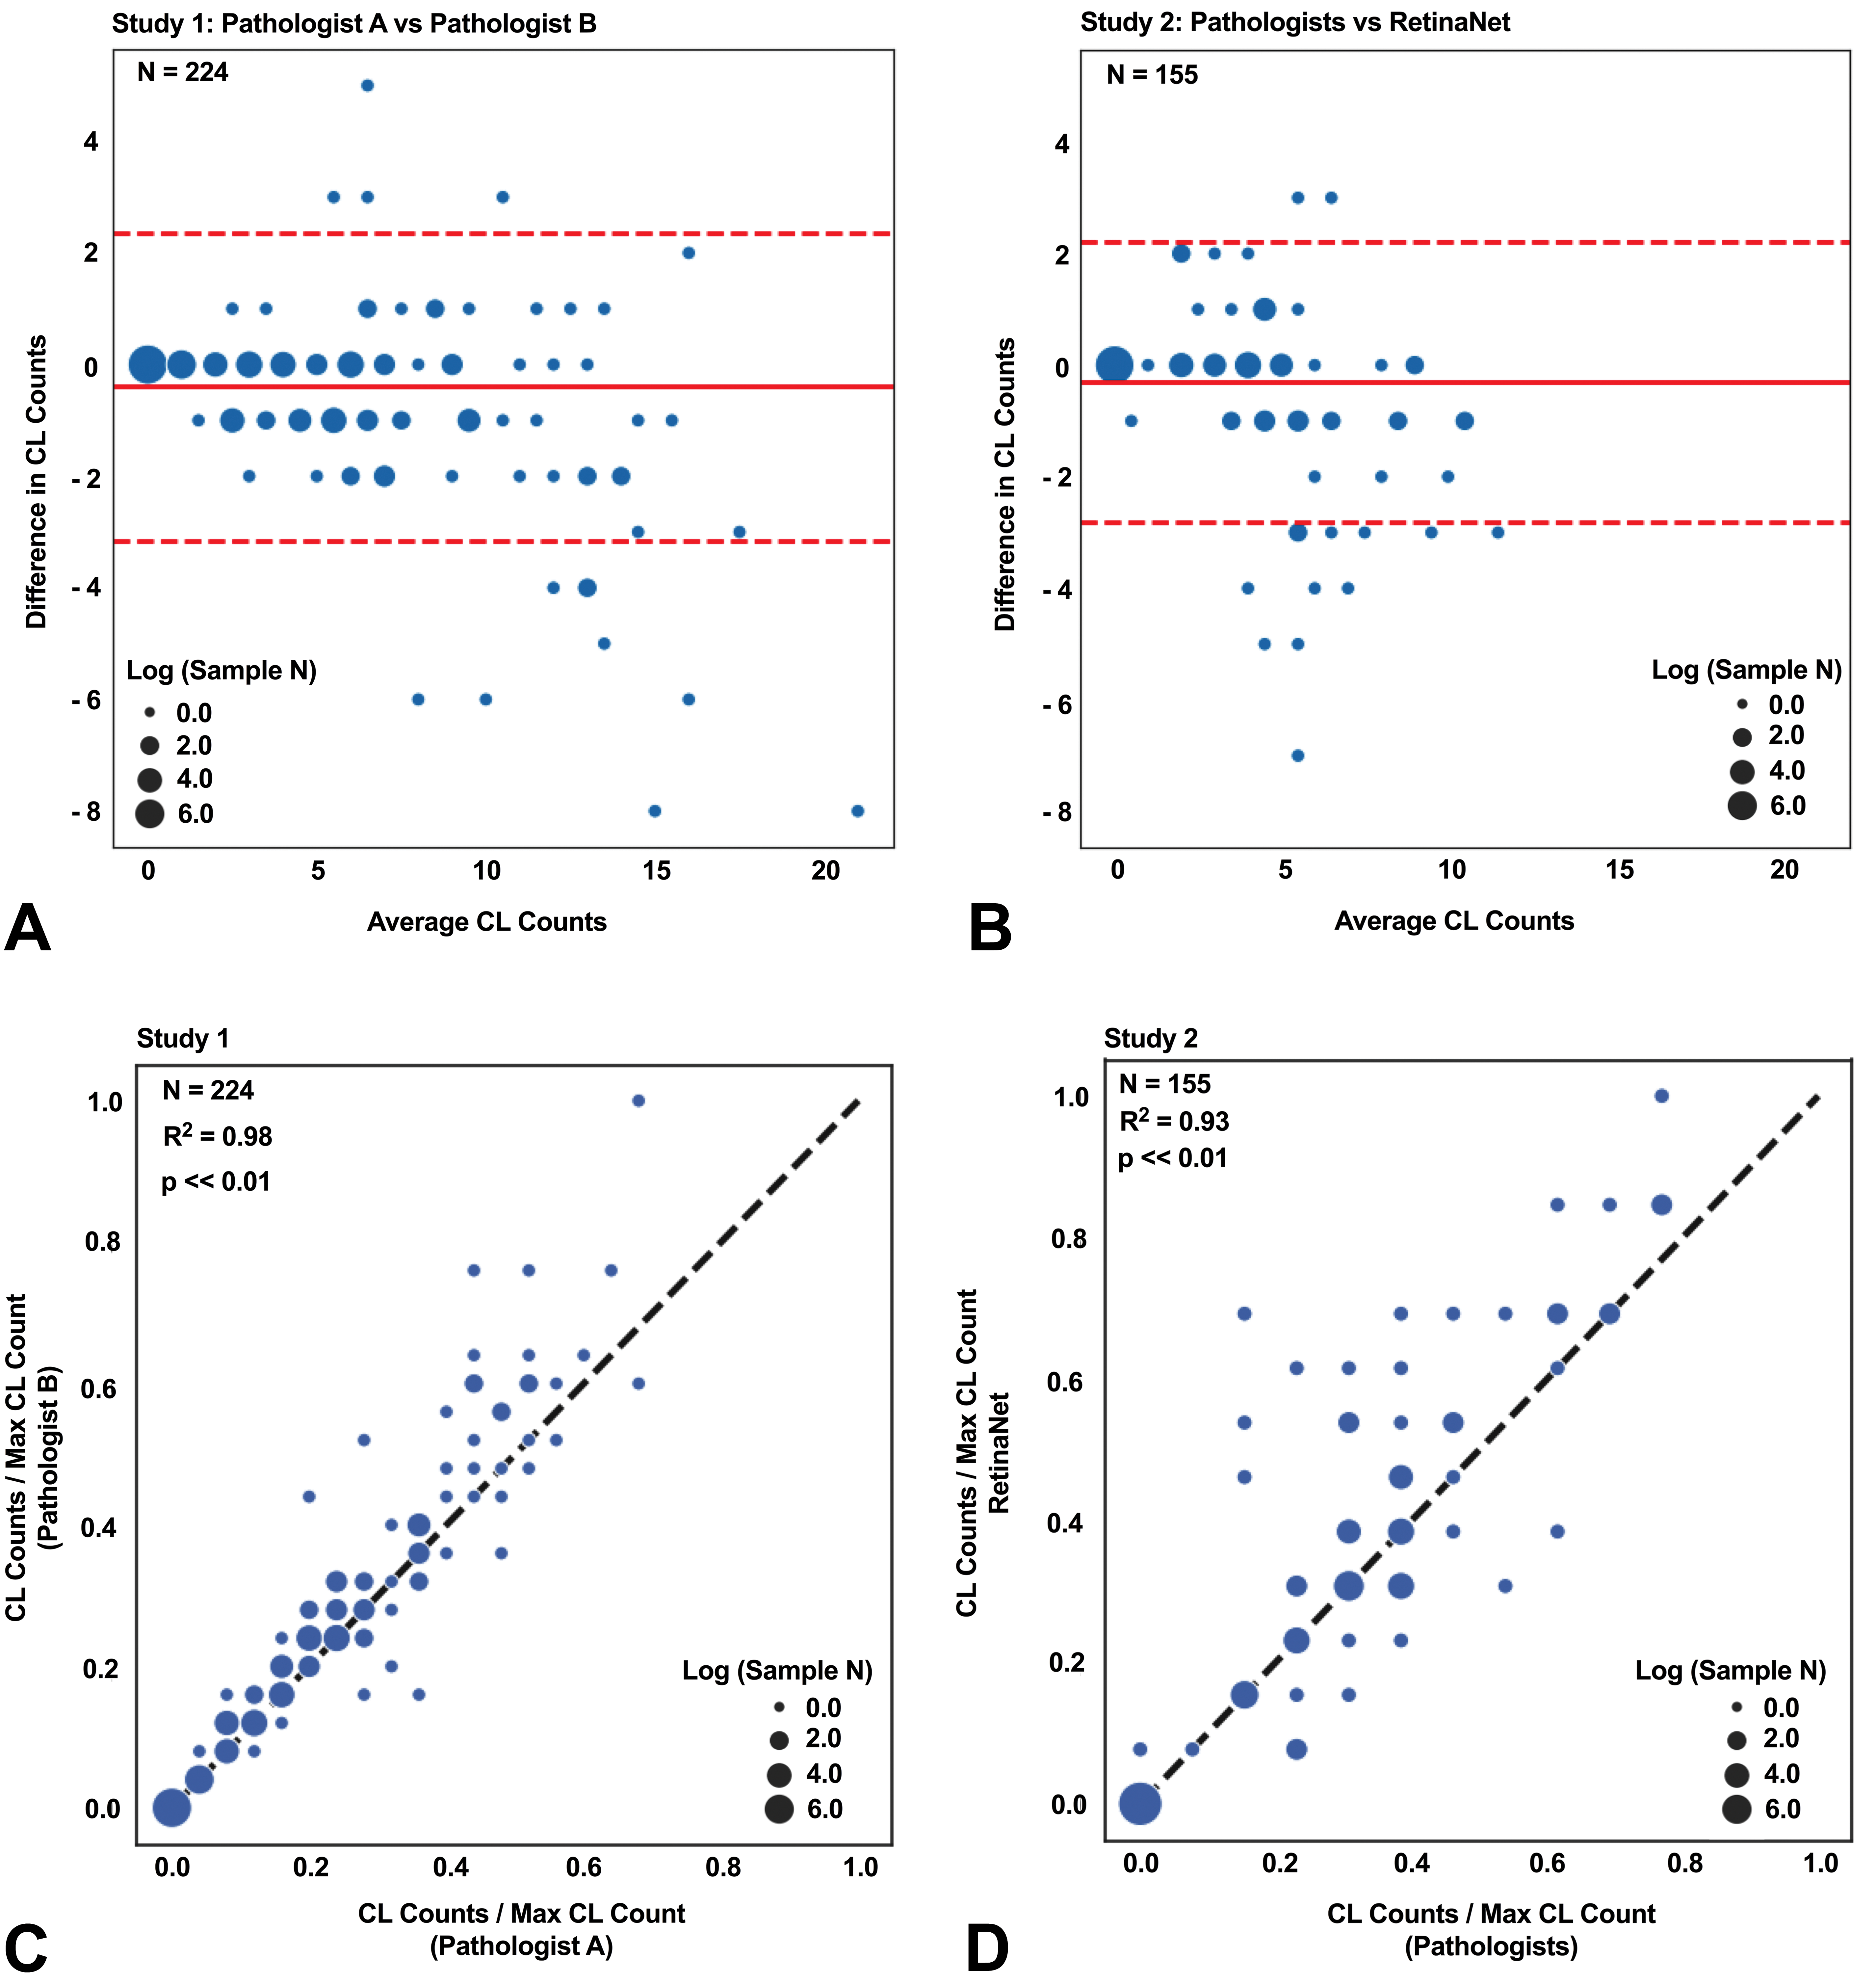
Errors in corpora lutea counts from the trained RetinaNet were similar to interpathologist variations and the corpora lutea counts from RetinaNet highly correlated with the pathologist’s results. A, The Bland-Altman plot assessing the interpathologist variation of the corpus luteum (CL) counts from 224 ovarian tissues in study 1. B, The Bland-Altman plot assessing the agreement between the pathologists and the trained RetinaNet in CL counts in study 3 for 155 ovarian tissues. Study 2 was blinded to the RetinaNet in the training process. C, The CL counts in study 1 between the pathologists (A and B) were strongly correlated. D, The CL counts in study 3 between the pathologists (A and C) and the trained RetinaNet were strongly correlated. The dashed red lines indicate 95% limits of agreement. The solid red lines indicate the mean difference for the CL counts of the pathologist A versus pathologist B or pathologists (A and C) versus RetinaNet. The dot size represents the number of same CL count in log scale. The black dashed lines show the perfect agreement in CL counts.
Overall Tissue Area Analyzed Impacts the Number of CL Present in a Tissue Section
To address our questions as to whether additional sectioning of the ovary would impact the numbers of CLs enumerated and overall interpretation of the study findings (as compared to the standard single slide), we used 6 step sections, 150 µm apart, for evaluation. Figure 5A shows the scatter plot for ovary tissue area versus CL count from all levels in study 3. When using all CL counts at all levels, a strong correlation (R = 0.73, P < .01) between the CL count and the ovary tissue area was observed indicating that with less tissue area evaluated, there is a smaller number of CLs observed. At each level, the CL count and the ovary tissue area significantly correlated as well (R = 0.57, 0.52, 0.64, 0.73, 0.75, and 0.73 for L1, L2, L3, L4, L5, and L6, respectively, and all P < .01). Since the CL count was significantly correlated with the tissue area at each level, normalizing the CL count by the tissue area could mitigate that effect. The mean and standard error of the CL count and the tissue area as well as the normalized CL count at each level are summarized in Table 2. Both CL count and the tissue area decreased when the level increased (ie, a deeper cut into the block). However, the normalized CL counts were relatively stable across levels. Figure 5B shows the CL count normalized to tissue area at different levels of sectioning. No significant differences in the normalized CL count to the tissue area among all levels were observed from the Kruskal-Wallis test. To investigate the relationship between the CL count and the tissue area in each level and each dose group in the study 3, the mean and standard error of the CL count and the tissue area as well as the normalized CL count at each level for all dose groups were computed (Table 3). Both CL count and the tissue area decreased for each dose group when the level increased. Although the CL count and the tissue area among all dose groups were in a similar range within each level, normalization could still reduce the impact of tissue area to the CL count and was thus recommended. In Figure 5C, the CL count normalized to tissue area for all dose groups shows that the CL counts were not significantly different. The CL count normalized to the tissue area was relatively stable across different levels and dose groups compared to the raw CL count.
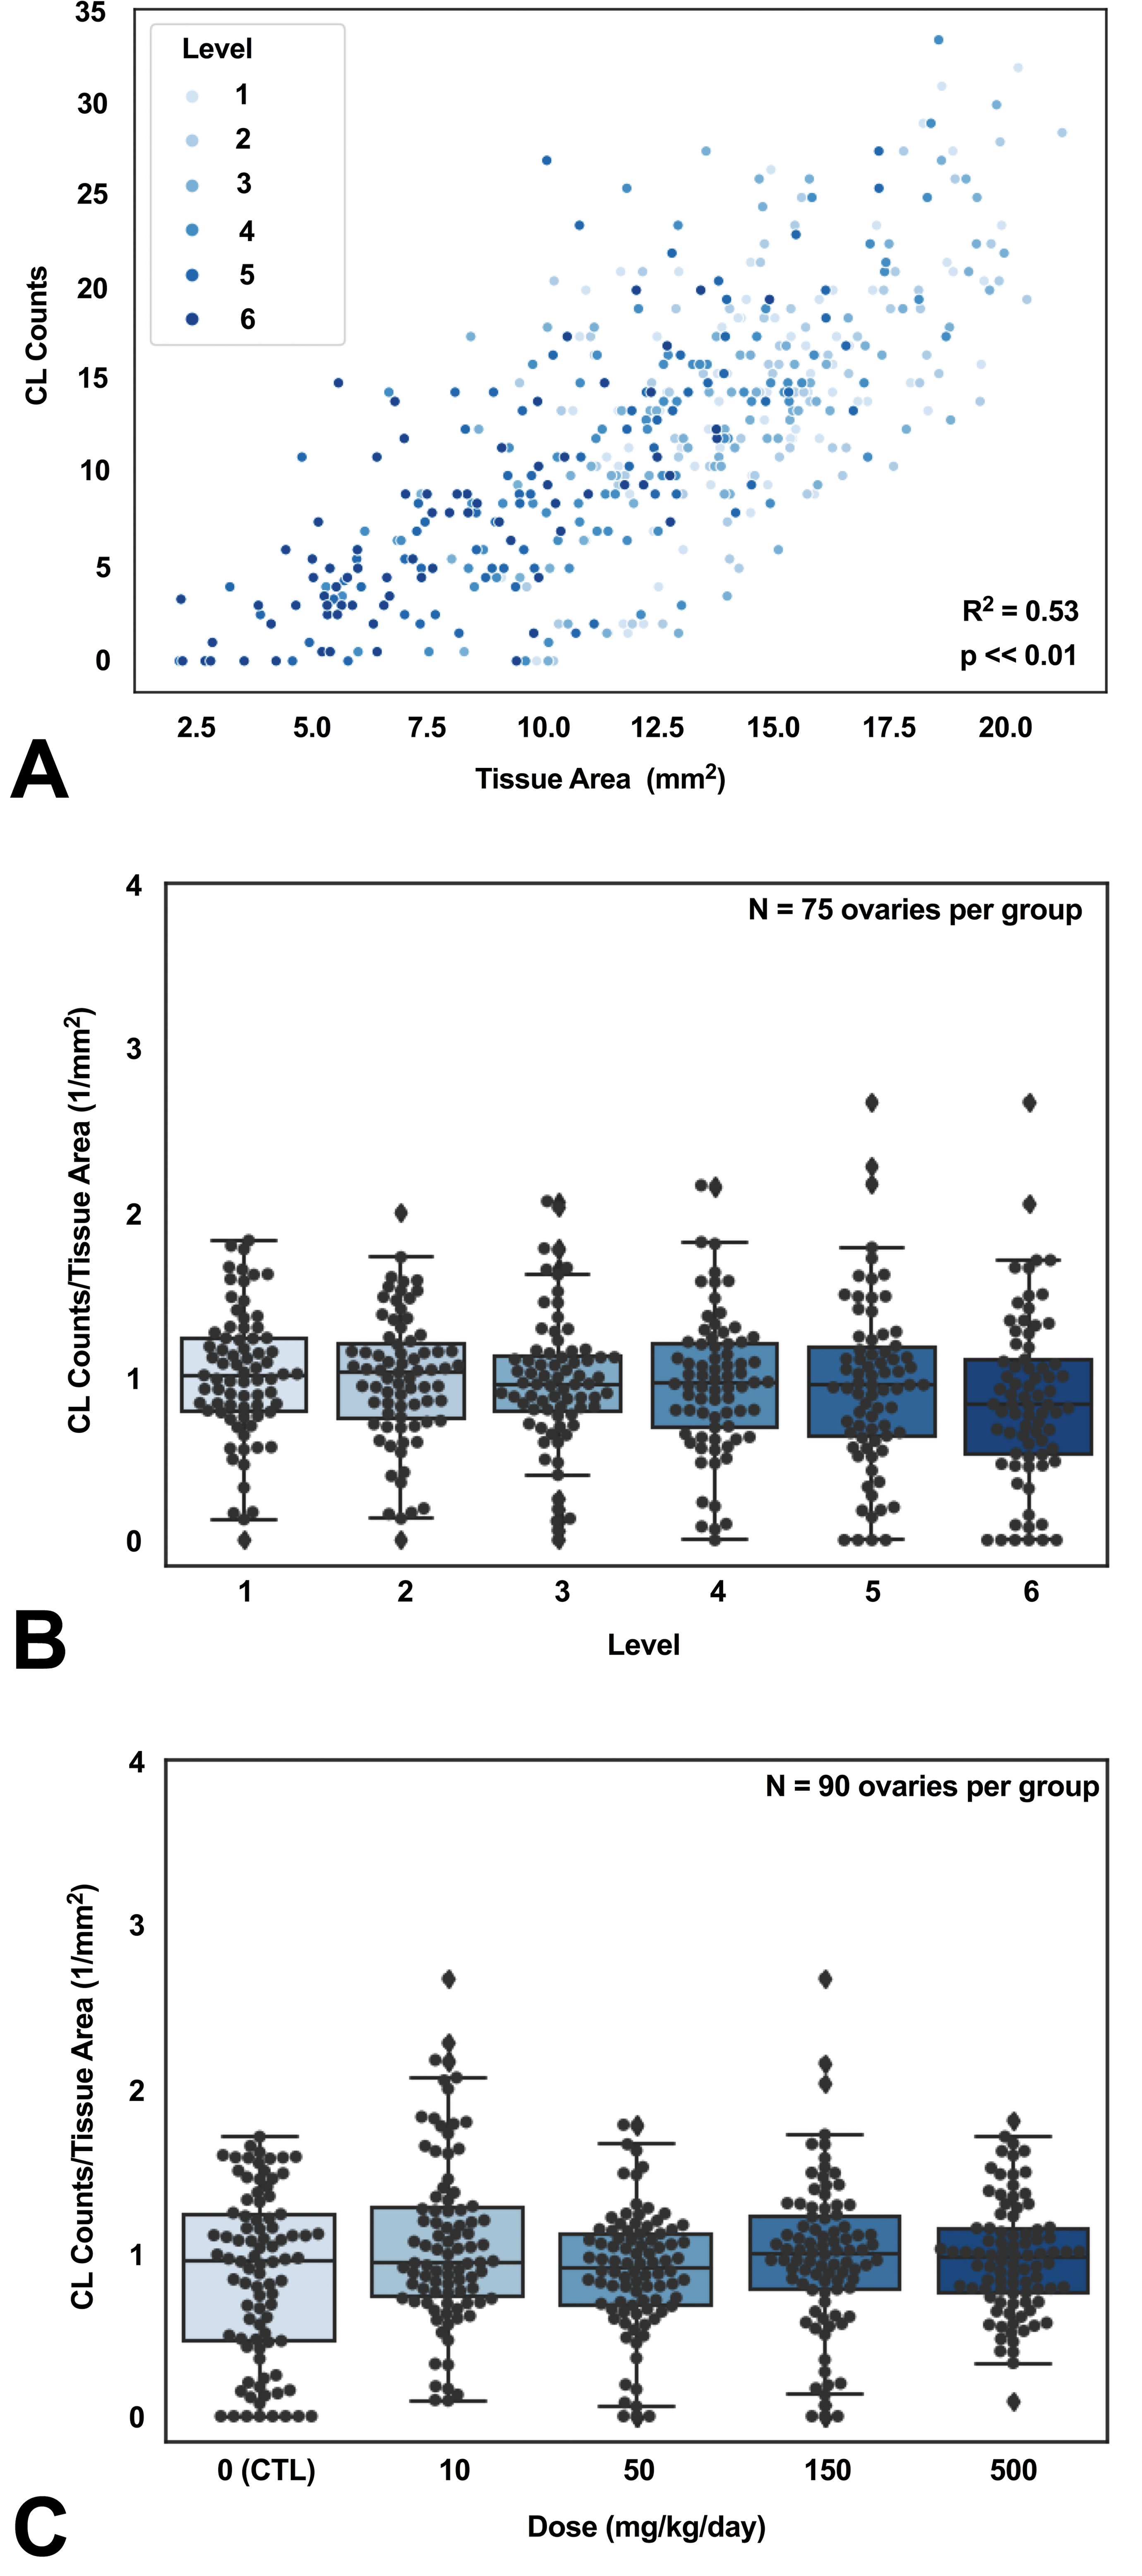
Corpus luteum count is impacted by ovarian tissue area and level of step sectioning. A, Corpus luteum (CL) count is strongly correlated with the tissue area. B, No significant difference in the normalized CL count was found among different levels. C, No significant difference in the normalized CL count was found among different treatment groups when pathologists reported that no treatment effects were observed in ovaries. The CL count in all panels were obtained from RetinaNet.
Summary of the Corpus Luteum Count and the Tissue Area at Each Level in the Study 3.a
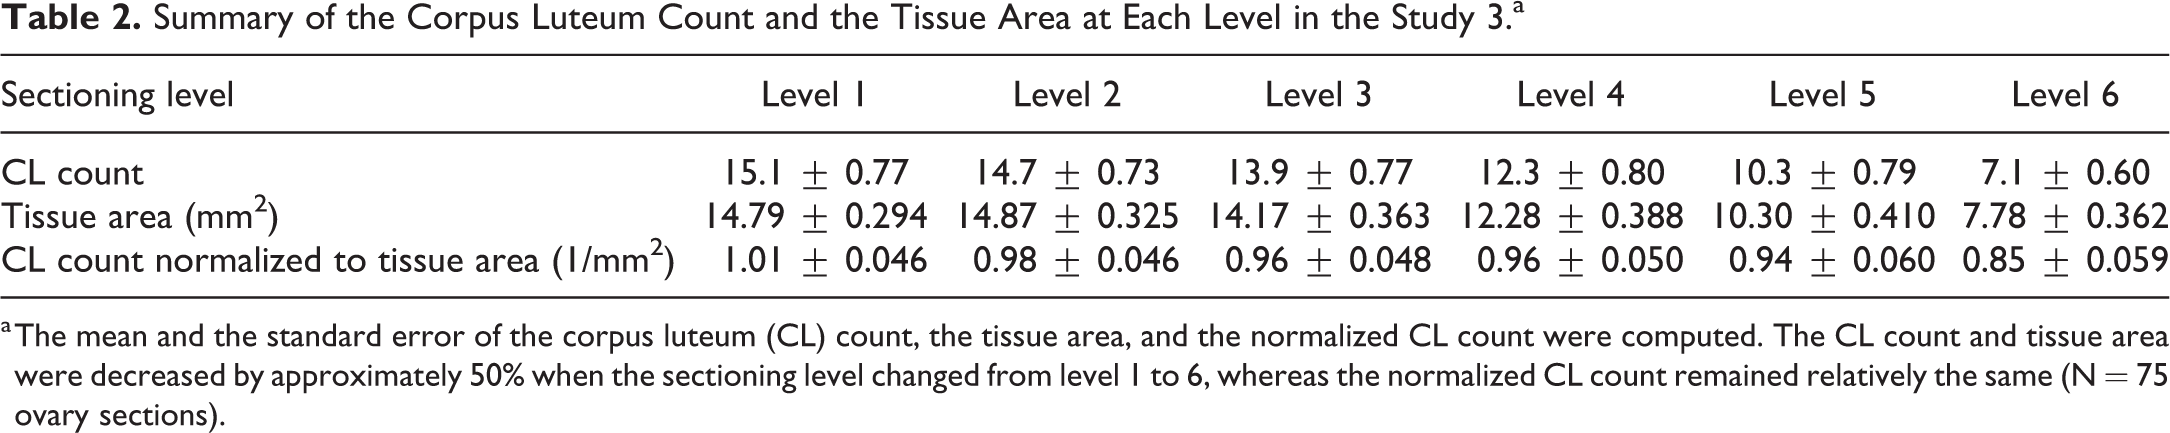
a The mean and the standard error of the corpus luteum (CL) count, the tissue area, and the normalized CL count were computed. The CL count and tissue area were decreased by approximately 50% when the sectioning level changed from level 1 to 6, whereas the normalized CL count remained relatively the same (N = 75 ovary sections).
Summary of the Corpus Luteum End Points at Each Level for Each Dose Group in the Study 3.a
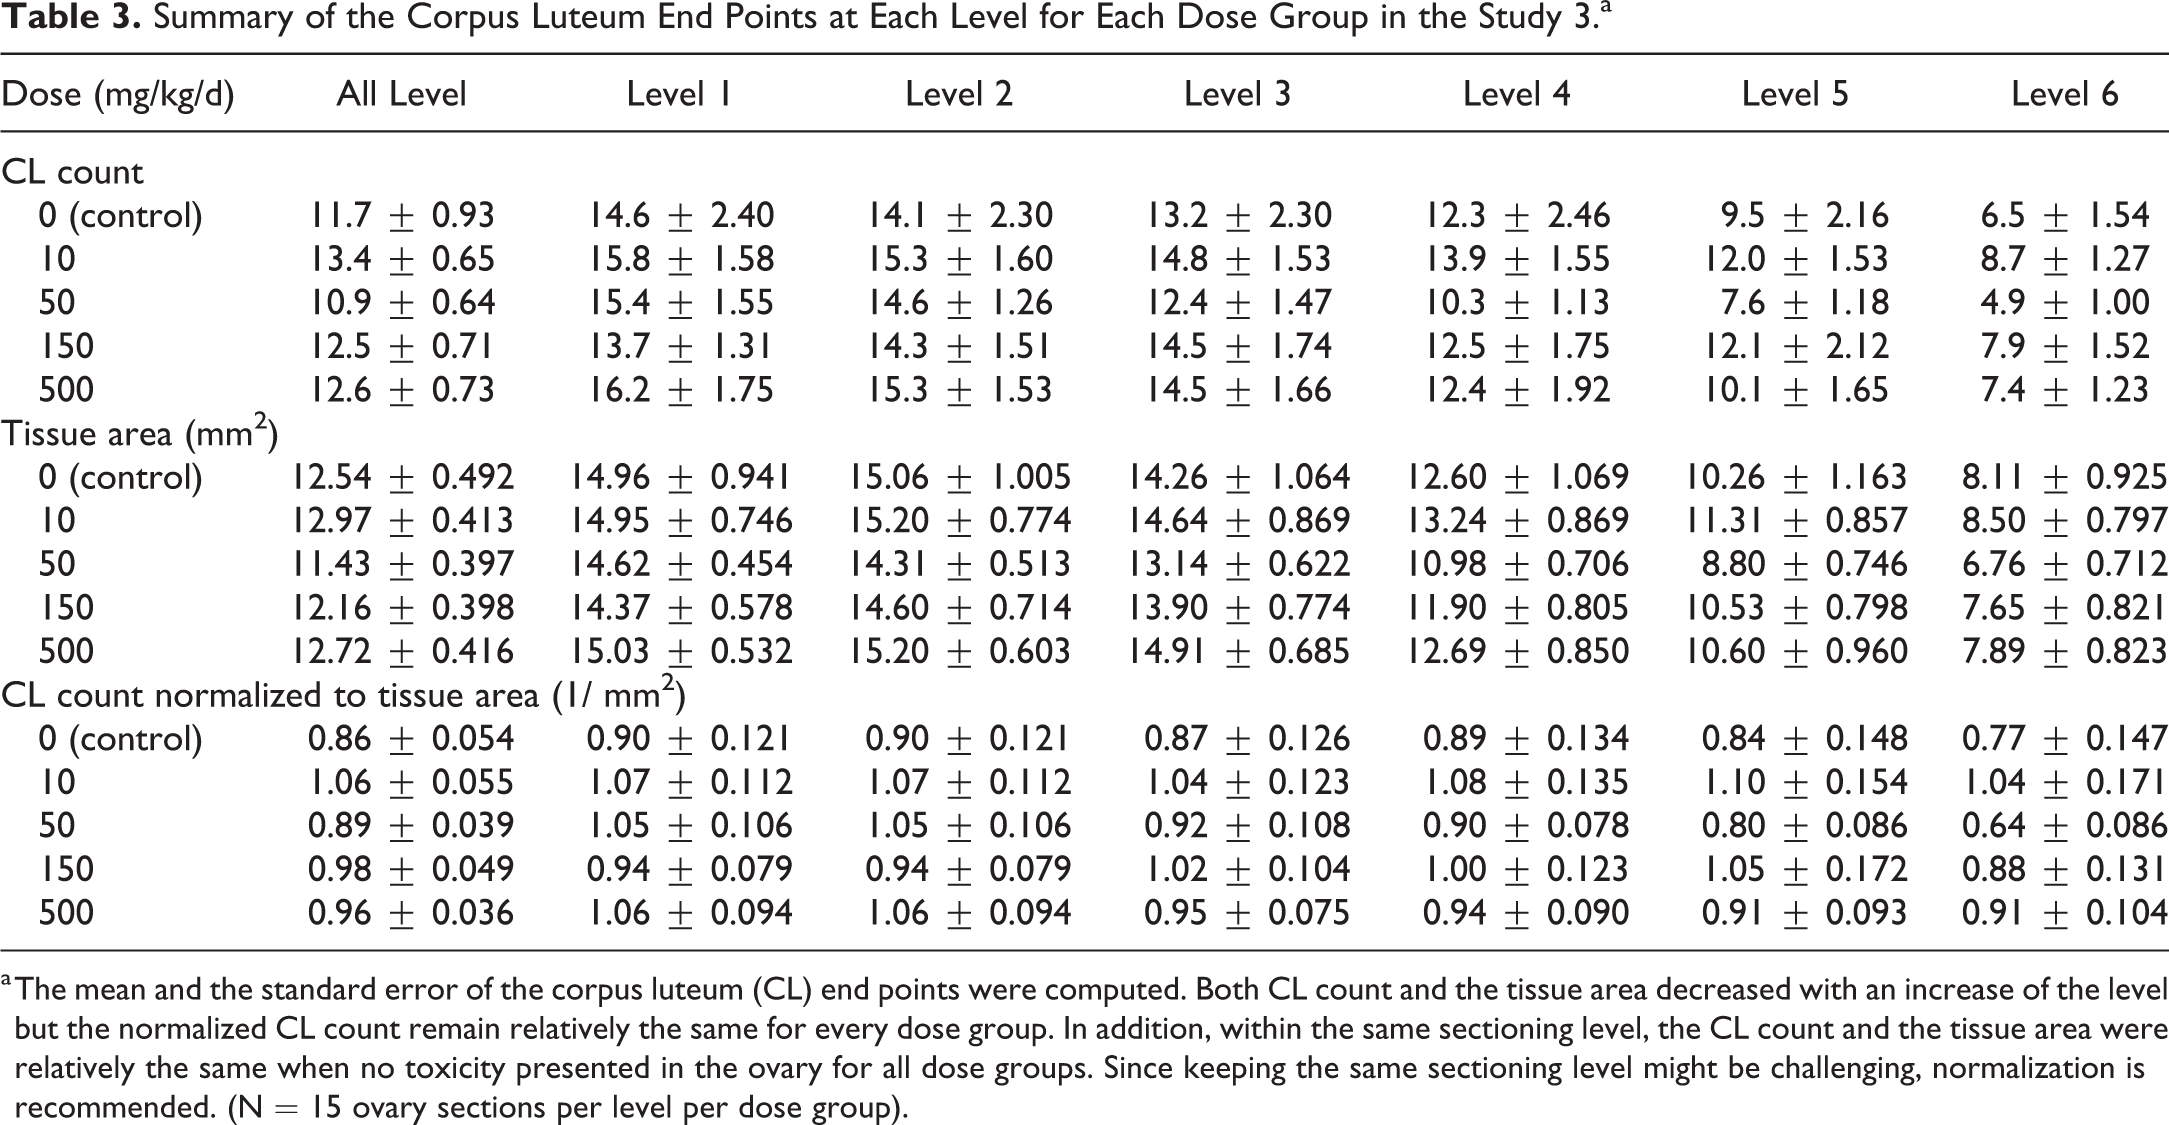
a The mean and the standard error of the corpus luteum (CL) end points were computed. Both CL count and the tissue area decreased with an increase of the level but the normalized CL count remain relatively the same for every dose group. In addition, within the same sectioning level, the CL count and the tissue area were relatively the same when no toxicity presented in the ovary for all dose groups. Since keeping the same sectioning level might be challenging, normalization is recommended. (N = 15 ovary sections per level per dose group).
When Normalized to Tissue Area, RetinaNet-Generated CL Counts Are Consistent With Pathologists’ Study Interpretation
To test our algorithm against the pathologists’ overall interpretation of the images and study conclusions, sections from 2 studies in which dose-dependent changes in CL counts were observed by pathologists were used in addition to the study 3, which had ovarian toxicity findings. Figure 6A to C shows the mean CL count normalized to tissue area in the control and treated groups for studies 3 to 5. Corpora luteum counts normalized to tissue area in control groups from both studies 4 and 5 were significantly higher than every treated group in both studies (P < .01 when comparing the control group to any treated group). No significant difference in the normalized CL count was observed in study 3 (P = .27). Interestingly, in Figure 6C, the CL count normalized to tissue area was significantly lower in the low-dose group when compared with the high-dose group in study 5 (P < .05).
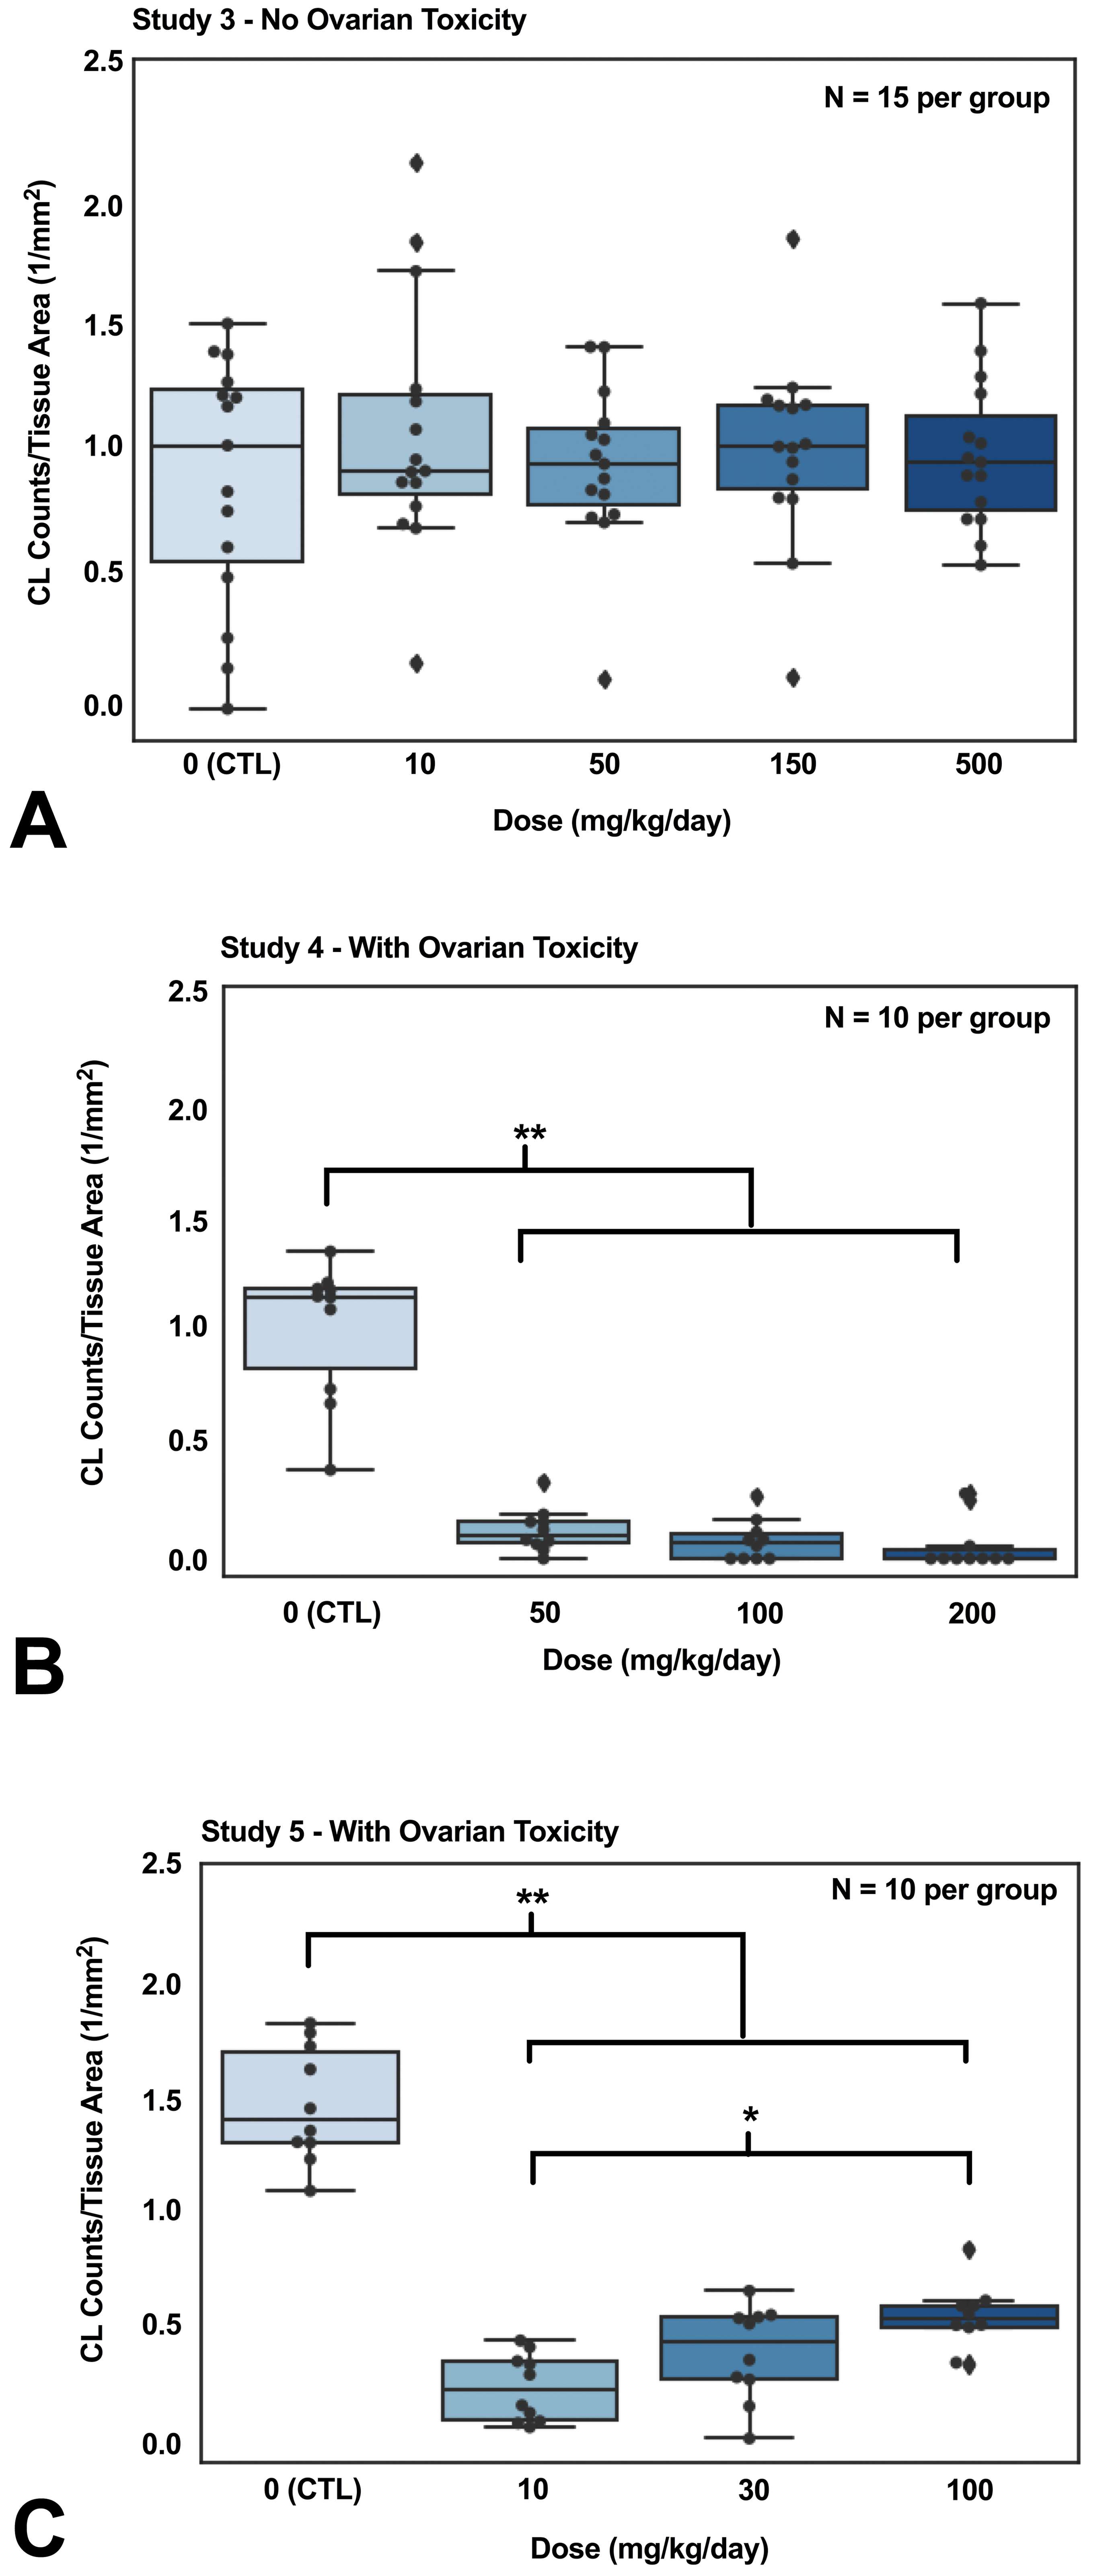
Tissues with ovarian toxicity exhibited significantly lower corpus luteum counts when normalized to tissue area. No ovarian toxicity was identified for rats with compound A in study 3 (A). Ovarian toxicity was identified for rats treated with compound C in study 4 (B) and compound D in study 5 (C). The corpus luteum (CL) counts in all panels were obtained from RetinaNet. The control rats demonstrated significantly higher CL counts normalized to tissue area than the treated rats in both study 4 and 5, whereas the CL count normalized to tissue area in the control rats and the treated rats were similar in study 3. Moreover, rats in 100 mg/kg/d dose group showed significantly higher CL counts normalized to tissue area than the 10 mg/kg/d dose group in study 5. P values were computed from Wilcoxon rank-sum test (*P < .05, **P < .01).
Discussion
Toxicological assessment of the ovary in rodents is a routine and essential part of target organ identification in the overall process of drug development. The rodent ovary, due in part to a short estrus cycle, is a dynamic organ with significant structural heterogeneity that results in multiple CLs and follicles of various developmental stages in an individual section. This structural variability, along with the additional variability introduced by tissue sectioning and the large number of animals in a study, can make histopathological evaluation of the ovary in toxicity studies particularly challenging and time-consuming. Several studies have demonstrated that changes in the number of ovarian structures, such as CLs and follicles, reflect ovarian toxicity. 2 Manual quantification of CLs by pathologists is time-consuming, labor-intensive, and subject to interpathologist variation. An automated approach to enumerate CLs could potentially reduce the workload for pathologists since the algorithm can count the CLs prior to a pathologist’s review of the slides and provide quantitative data to support their overall assessment. In this study, an accurate and reproducible deep learning model, object detection RetinaNet, was trained to identify CLs for automated quantification. The model not only enhanced the evaluation of the ovarian histology but also provided valuable end points for toxicologic pathology.
Our trained RetinaNet accurately identified CLs from studies with different H&E staining protocols. Different H&E staining protocols and the choice of image scanners could result in color variation affecting the performance of digital image analyses of tissue sections. Several studies have reported mitigation of color variation effects by applying color normalization algorithms. 17,18 For example, the color distributions of the H&E-stained structures could be extracted from the sections of interest and be mapped to the desired distributions for standardization. However, these approaches have usually relied on color deconvolution algorithms to separate the H&E-stained structures. Thus, the normalization would struggle if the color deconvolution algorithm failed to identify the correct tissue structures. In our investigation, the H&E sections in studies 4 and 5 were much more eosinophilic compared to the sections in studies 1 to 3. Since the color tone of the H&E sections from studies 1 to 3 was drastically different from the H&E sections in studies 4 and 5, it was difficult for a color deconvolution technique to identify the corresponding structures. Therefore, instead of applying normalization techniques, we computed the mean red, green, and blue value differences in the images among the studies and utilized this information for data augmentation so that the RetinaNet recognized the CLs under various color tones during the training process and thus successfully detected CLs in studies 4 and 5. Without the data augmentation, our RetinaNet could not identify CLs correctly in studies 4 and 5. Annotating studies with distinct staining colors such as studies 4 and 5 and adding them to the training data set could be another way to reduce the impact of color variation for future algorithms.
Although the identification of CLs is highly reproducible, interpathologist variation is inevitable. 19 For instance, the CL counts from pathologists A and B in study 1 were strongly correlated (R = 0.99 and with 0.64 absolute errors in counts). However, 100% agreement between the 2 pathologists was only achieved when CLs were absent. Nevertheless, in study 1, only 67.9% of the ovaries had the exact same CL counts from the 2 pathologists. When ovaries with no CLs present were excluded in study 1, only 40.5% of the ovaries had the same CL counts, and the maximum difference in counts was 8. Conversely, in study 2, the CL counts from the pathologists and the trained RetinaNet were strongly correlated (R = 0.97). Within the 88 ovaries that both pathologists reported no CLs present, the algorithm only reported 1 ovary with 1 false-positive CL count (99% agreement). From all 155 ovaries in the study 2 subset, 72.2% of the ovaries had the same CL counts from the pathologists and the RetinaNet. When excluding the ovaries with no CLs present as reported by both pathologists, 37.3% of the ovaries had the same CL counts and the maximum difference in counts was 7. These results suggested that the RetinaNet CL counts were reliable and the errors were similar to the interpathologist variation.
The CL counts were significantly correlated with the ovarian tissue area present (Figure 5A), and the tissue area significantly correlated with the level of sectioning (R = −0.60, P < .01). Therefore, CL counts in ovaries should be normalized by both factors when investigating drug effects. In study 3, after CL counts were normalized by the tissue area, no significant difference in CL counts was identified among the groups (Figure 5C), consistent with the results from the pathologists’ qualitative assessment of the sections. Having multiple step sections or having a consistent sectioning location is a potential way to normalize the impact on CL counts due to sampling (Table 3). Although multiple step sections can provide better sampling, their manual evaluation for every study is impractical, time-consuming, and expensive. Regardless, irrespective of sampling strategy, automated review via deep learning algorithms offers a practical option for achieving CL counts that can be confidently attributed to the test article, thus reducing the chance of misinterpretation.
Multiple morphological features have been identified as markers of ovarian toxicity. 1 Several studies have demonstrated that CL counts in treated rats can be significantly different than CL counts in control rats when ovarian toxicity is identified. 2,20 In a collaborative work in which 17 substances were tested for ovarian toxicity in rats, a total of 9 and 1 substances were associated with a decrease and increase in CL counts in general toxicity studies, respectively. 2 For instance, Shirai et al observed a drug-related decrease and/or depletion of CLs in rats treated with high dose of anastrozole, 20 and Kumazawa et al observed an increase in CL numbers with the administration of bromocriptine. 21 In our studies 4 and 5, in which the pathologists reported ovarian-related findings, the CL counts normalized to tissue area were significantly higher in the control groups compared to the treated groups (Figure 6B and C). Interestingly, significant positive trend of the CL counts normalized to tissue area in the treated groups was observed (Figure 6C). Although the mechanisms behind the observed trends were under investigation, our quantitative end points from RetinaNet matched pathologists’ observations. Overall, our results were consistent with the results of previous studies indicating that CL number is often affected in ovarian toxicity, and thus is a good surrogate marker for understanding ovary biology in relationship to test articles. The trained RetinaNet CL count was accurate, and in agreement with pathologist findings, the enumeration revealed distinct trends for ovary with and without toxicity under multiple general toxicity studies.
Deep learning techniques provide a rapid way for developing reliable models and applications. Our trained RetinaNet enabled a scalable and accurate quantification of CLs from studies with various study protocols and drugs. We envision this method to have wide applicability to a variety of general toxicity and fertility studies, as well as investigative/mechanistic work. Although our current method has been developed for the enumeration of CLs only, further refinement of the model could include analyses of CL size, shape, and color (potential indicators of CL age); unovulated ova enumeration and subcategorization of follicles; and interstitium. This method could also be optimized for use in mouse ovaries. Further, with increasing availability of knockout or knock-in rats and genetically modified mice, our approach could be useful in phenotyping studies in basic and translational research settings.
Supplemental Material
Supplemental Material, DS1_TPX_10.1177_0192623319877871 - Ovarian Toxicity Assessment in Histopathological Images Using Deep Learning
Supplemental Material, DS1_TPX_10.1177_0192623319877871 for Ovarian Toxicity Assessment in Histopathological Images Using Deep Learning by Fangyao Hu, Leah Schutt, Cleopatra Kozlowski, Karen Regan, Noel Dybdal and Melissa M. Schutten in Toxicologic Pathology
Footnotes
Acknowledgments
The authors thank Dr Reina Fuji and Dr Ruth Sullivan from the Department of Safety Assessment as well as Dr Jochen Brumm from the Department of Nonclinical Biostatistics in Genentech for reviewing the manuscript and providing their feedback.
Declaration of Conflicting Interests
The author(s) declared no potential conflicts of interest with respect to the research, authorship, and/or publication of this article.
Funding
The author(s) received no financial support for the research, authorship, and/or publication of this article.
Supplemental Material
Supplemental material for this article is available online.
References
Supplementary Material
Please find the following supplemental material available below.
For Open Access articles published under a Creative Commons License, all supplemental material carries the same license as the article it is associated with.
For non-Open Access articles published, all supplemental material carries a non-exclusive license, and permission requests for re-use of supplemental material or any part of supplemental material shall be sent directly to the copyright owner as specified in the copyright notice associated with the article.