
Abstract
Qualitative histopathology has been the gold standard for evaluation of morphological tissue changes in all organ systems, including the peripheral nervous system. However, the human eye is not sensitive enough to detect small changes in quantity or size. Peripheral nervous system toxicity can manifest as subtle changes in neuron size, neuron number, axon size, number of myelinated or unmyelinated axons, or number of nerve fibers. Detection of these changes may be beyond the sensitivity of the human eye alone, necessitating quantitative approaches in some cases. Although 2-dimensional (2D) histomorphometry can provide additional information and is more sensitive than qualitative evaluation alone, the results are not always representative of the entire tissue and assumptions about the tissue can lead to bias, or inaccuracies, in the data. Design-based stereology provides 3D estimates of number, volume, surface area, or length, and stereological principles can be applied to peripheral nervous system tissues to obtain accurate and precise estimates, such as neuron number and size, axon number, and total intraepidermal nerve fiber length. This review describes practical stereological approaches to 3 compartments of the peripheral nervous system: ganglia, peripheral nerves, and intraepidermal nerve fibers.
Introduction
Unbiased evaluation of any tissue comes down to the sampling strategy that is implemented. Two-dimensional (2D) morphometry is frequently model based and assumption based, where the sampling strategy relies on previous knowledge and assumptions. 1 This results in data that may be unreliable and often not representative of the tissue as a whole. In contrast, modern stereological procedures are design based, in which objects within a sampling space have an equal chance or known probability of being sampled; therefore, the results are representative of the entire tissue and sampling bias is minimized. 2 2D morphometry is also influenced by the size, shape, and orientation of particles within the tissue, potentially leading to profound geometrical bias. The degree and direction of bias are usually unknown and cannot be reduced by increasing the amount of sampling; this only increases the precision.
Bias results in data that cannot be trusted. For example, studies utilizing 2D methods for neuron number estimates in the rat dorsal root ganglion (DRG) have produced considerably variable results, ranging from 2000 total neurons up to 15,000. 3 Although stereological estimates can also produce somewhat varied results, the error of the estimate is known; therefore, any repetition of the analysis will lead to results that are within the known range of error. In contrast, error cannot be estimated for 2D analyses. Other studies have illustrated a disagreement between total neuron or other cell number when obtained by 2D profile counting (as with morphometric analysis) and the actual cell number (obtained through 3D reconstruction or exhaustive counting), with the 2D estimates resulting in overestimations or even results that are in the opposite direction of the truth. 4 Therefore, it is of utmost importance to implement unbiased sampling strategies to ensure data accuracy, as we often do not know the true value of the end point of interest within the study population.
Peripheral nervous system toxicity can manifest as subtle alterations in neuron number or size, axon number or size, or intraepidermal nerve fiber density (IENFD). These alterations are often beyond the limit of detection by the naked eye alone and require more sensitive quantitative techniques. This article summarizes examples of unbiased sampling strategies for quantitative evaluation of sensory and sympathetic ganglia, peripheral nerves, and intraepidermal nerve fibers.
Basic Principles of Unbiased Stereology and Application to Peripheral Nervous System Evaluation
Stereology of the peripheral nervous system can be useful during early drug development as well as to evaluate toxicity during safety assessment. In nerve regeneration research, stereological analysis of peripheral nerves can be helpful for determining the utility of a disease model (such as nerve crush) as well as the efficacy of regenerative treatments. Stereological analysis of intraepidermal nerve fibers can be helpful for characterizing animal models of peripheral neuropathies and for testing the efficacy of drugs developed to treat those disorders. During the safety assessment process, stereological analysis of ganglia can be utilized as a sensitive and accurate technique for detecting sympathetic or sensory nervous system toxicity (such as with antinerve growth factor compounds), and stereology of peripheral nerves or intraepidermal nerve fibers can be conducted to evaluate for peripheral neuropathy after treatment with chemotherapeutics or antiretroviral drugs.
As with any organ system, if quantitative analysis of peripheral nervous system tissues is a known desired end point, this must be kept in mind from the very beginning of the study design. In particular, attention needs to be paid to how the tissues are collected and subsequently fixed, processed, embedded, and sectioned. Perfusion fixation is ideal for optimal tissue fixation.
The most common unbiased sampling principal utilized in stereology is termed systematic uniform random sampling, or SURS. This strategy ensures that all objects of interest within the tissue have an equal chance of being sampled. The first section through the tissue is captured randomly, and subsequent sections are captured at regular intervals throughout the tissue or region of interest. The application of SURS is tailored to each study depending on the tissue being sampled and the desired end point(s). Examples of SURS strategies for peripheral nervous system tissues are detailed below. The reader is directed to other references for additional examples if desired. 5,6 The type of embedding medium used (paraffin, soft plastic, hard plastic, or frozen) also depends on the tissue type and desired end point(s). Although paraffin is the classical tissue embedding medium, it can lead to underestimation of dimensional geometric features such as volume due to a high degree of shrinkage. 7,8 If number is the desired end point, the effects of tissue shrinkage can be avoided using the fractionator technique, where the fraction of the organ sampled at each sampling step is kept track of and used in the final estimate. 2 However, if volume or size estimation is desired, other embedding media may need to be used or calculation of 3D global shrinkage may need to be performed. 5 Correction for 3D shrinkage does not necessarily remove all bias, but can partially correct for it. Additionally, shrinkage correction should only be performed if there are no visible histopathologic changes. 5
The most common stereology end points are number, volume, surface area, and length, many of which are described in detail in the following examples. More than 1 end point can be estimated in a single sampling, as illustrated in some of the examples below, which increases the efficiency of the analysis. These estimates can be made at the gross, microscopic, or ultrastructural level. In addition, the estimates can be applied to in vivo imaging techniques such as computed tomography and magnetic resonance imaging. 9
If neuron number is a desired estimate, then the disector principle must be employed during sectioning. The disector is a 3D stereological probe that ensures that objects are sampled according to their number rather than their size, shape, or orientation, as would be the case with single sections obtained for 2D morphometric analysis. 10 There are 2 types of disectors: physical disectors and optical disectors. Physical disectors involve capturing consecutive sections at each sampling interval and evaluating matching high-magnification microscopic fields from both sections, counting objects if they appear in one field but not the other (Figure 1). Optical disectors are single thick sections (typically 30 µm thick or greater) captured at each sampling interval and viewed under a high-magnification oil objective; counting objects as a unique feature (such as the nucleus or nucleolus) comes into focus. Physical disectors are commonly used for object number and can be employed for counting neurons in ganglia. 11 Disector slides can be scanned and imported into the stereology software for analysis. However, if neuron size is an important end point, as it often is, it is recommended to use optical disectors, as the center of the neurons will be more easily captured for cell size estimation. Unlike physical disectors, optical disectors require the use of a live microscope outfitted with a camera, motorized stage, and length gauge (Figure 2).
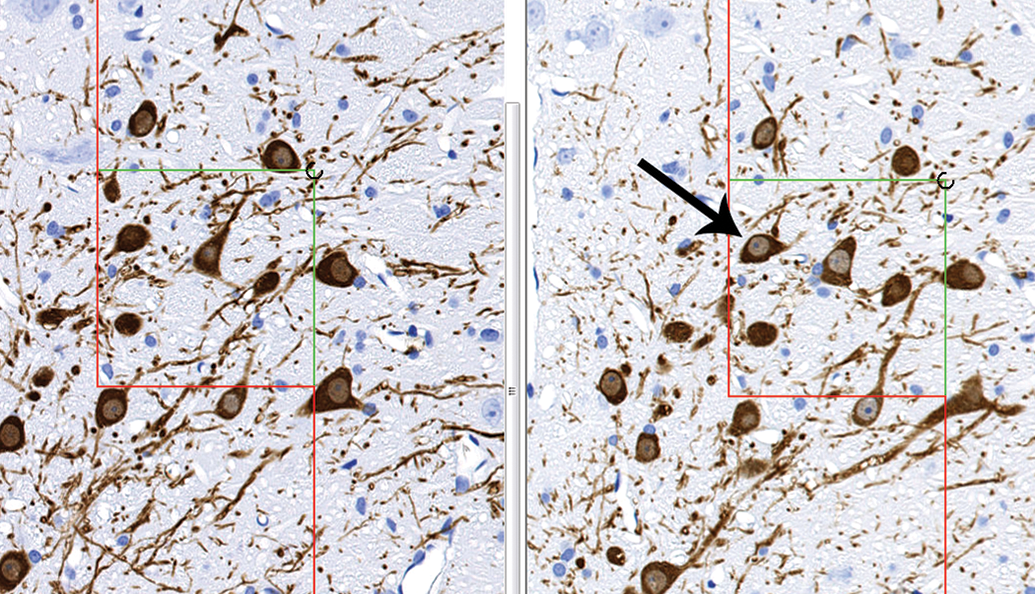
Counting in a physical disector. The software captures matching fields from the consecutive sections and displays them side by side. An unbiased counting frame is applied and a unique counting feature is chosen (ie, the nucleus). The cell is counted if it is present within the counting frame or touching the inclusion lines (green) but not the exclusion lines (red), and the unique counting feature is present in one field but not the other (arrow). Tyrosine hydroxylase immunohistochemical stain, rat substantia nigra.
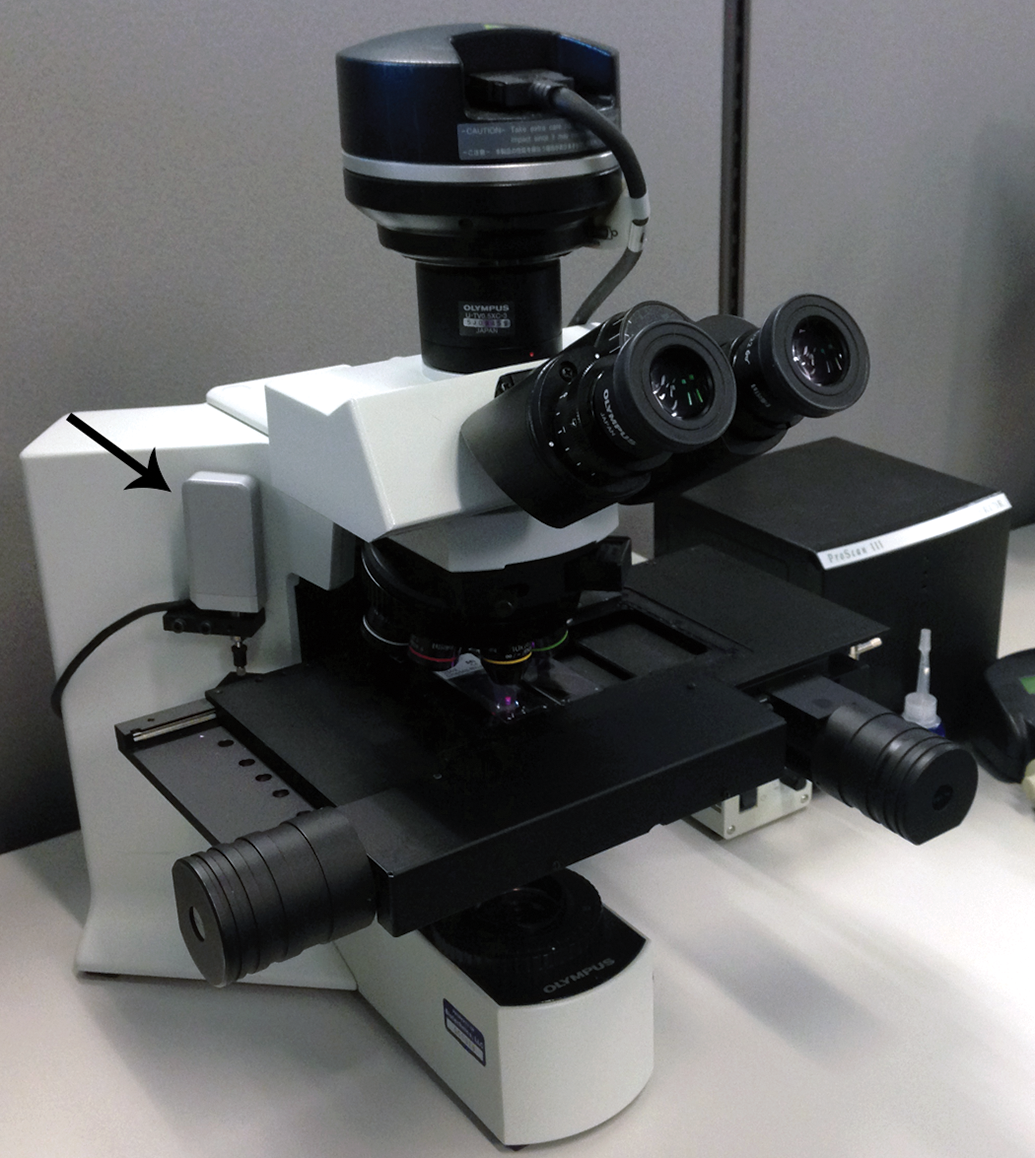
Microscope system for live stereological analysis. A microscope outfitted with a motorized stage, camera, and a length gauge (arrow). The length gauge produces an output on movement in the z-axis to determine local section thickness.
Stereology of Sensory and Sympathetic Ganglia
Common stereological end points for ganglia are total volume, neuron number, and neuron size. These end points can be estimated for both sensory and sympathetic ganglia and are commonly estimated in toxicology studies for antinerve growth factor compounds or in efficacy studies following nerve transection or crush. 12 –17
A common sensory ganglion utilized for stereological analysis is the L5 DRG. This ganglion receives impulses from the caudal limb and lateral paw in the rat. 18 A common sympathetic ganglion for stereological analysis is the cranial cervical ganglion (CCG), also referred to as the superior cervical ganglion, due to its size and relative ease of collection. The recommended embedding medium for stereological analysis of ganglia is glycol methacrylate (GMA), as it causes less shrinkage (generally less than 10%) and tissue deformation compared with paraffin (40% or more). 8 It is important to note that some shrinkage still occurs with GMA embedding, and it is recommended to weigh the tissue pre- and postprocessing to calculate the global shrinkage in any case where volume (or estimates that need to be corrected for volume, such as surface area or length) is estimated. 5 Frozen sections may also be used for this analysis. 14 However, frozen sections can result in artifacts, suboptimal architectural detail, and considerable (up to 70%) shrinkage in the z-axis (section thickness); therefore, it is the authors’ preference to embed the ganglia in GMA.
Dorsal root ganglions are fairly easy to collect in many species, and our laboratory has experience with stereological analysis of the L5 DRG from rats, dogs, and monkeys. Perfusion fixation (with 4% paraformaldehyde) is preferred, followed by removal of the entire spinal column (rodents) or a section of the lumbar spinal column (large animals), excision of the dorsal laminae, and immersion fixation of the entire region in the perfusate. After approximately 24 to 48 hours of fixation, the DRGs can be isolated and dissected free of excess tissue through the use of a dissecting microscope (Figure 3). It is recommended to process both left and right ganglia, being careful to maintain the identity of the left and right sides, and to alternate which side is utilized for stereology by randomizing the animal order and employing a counterbalanced design. This can be employed through a simple coin-flip to determine which side will be used for the first animal, then alternating between left and right for subsequent animals. The opposite side is taken to the block stage and kept as a backup. Previous references are inconsistent as to whether there are differences between the left and right sides. 19,20 Typically, only 1 ganglion level is utilized for stereology and the level needs to be consistent among animals, as results differ greatly between the total neuron number and composition of A and B neurons between ganglion levels in the authors’ experience.
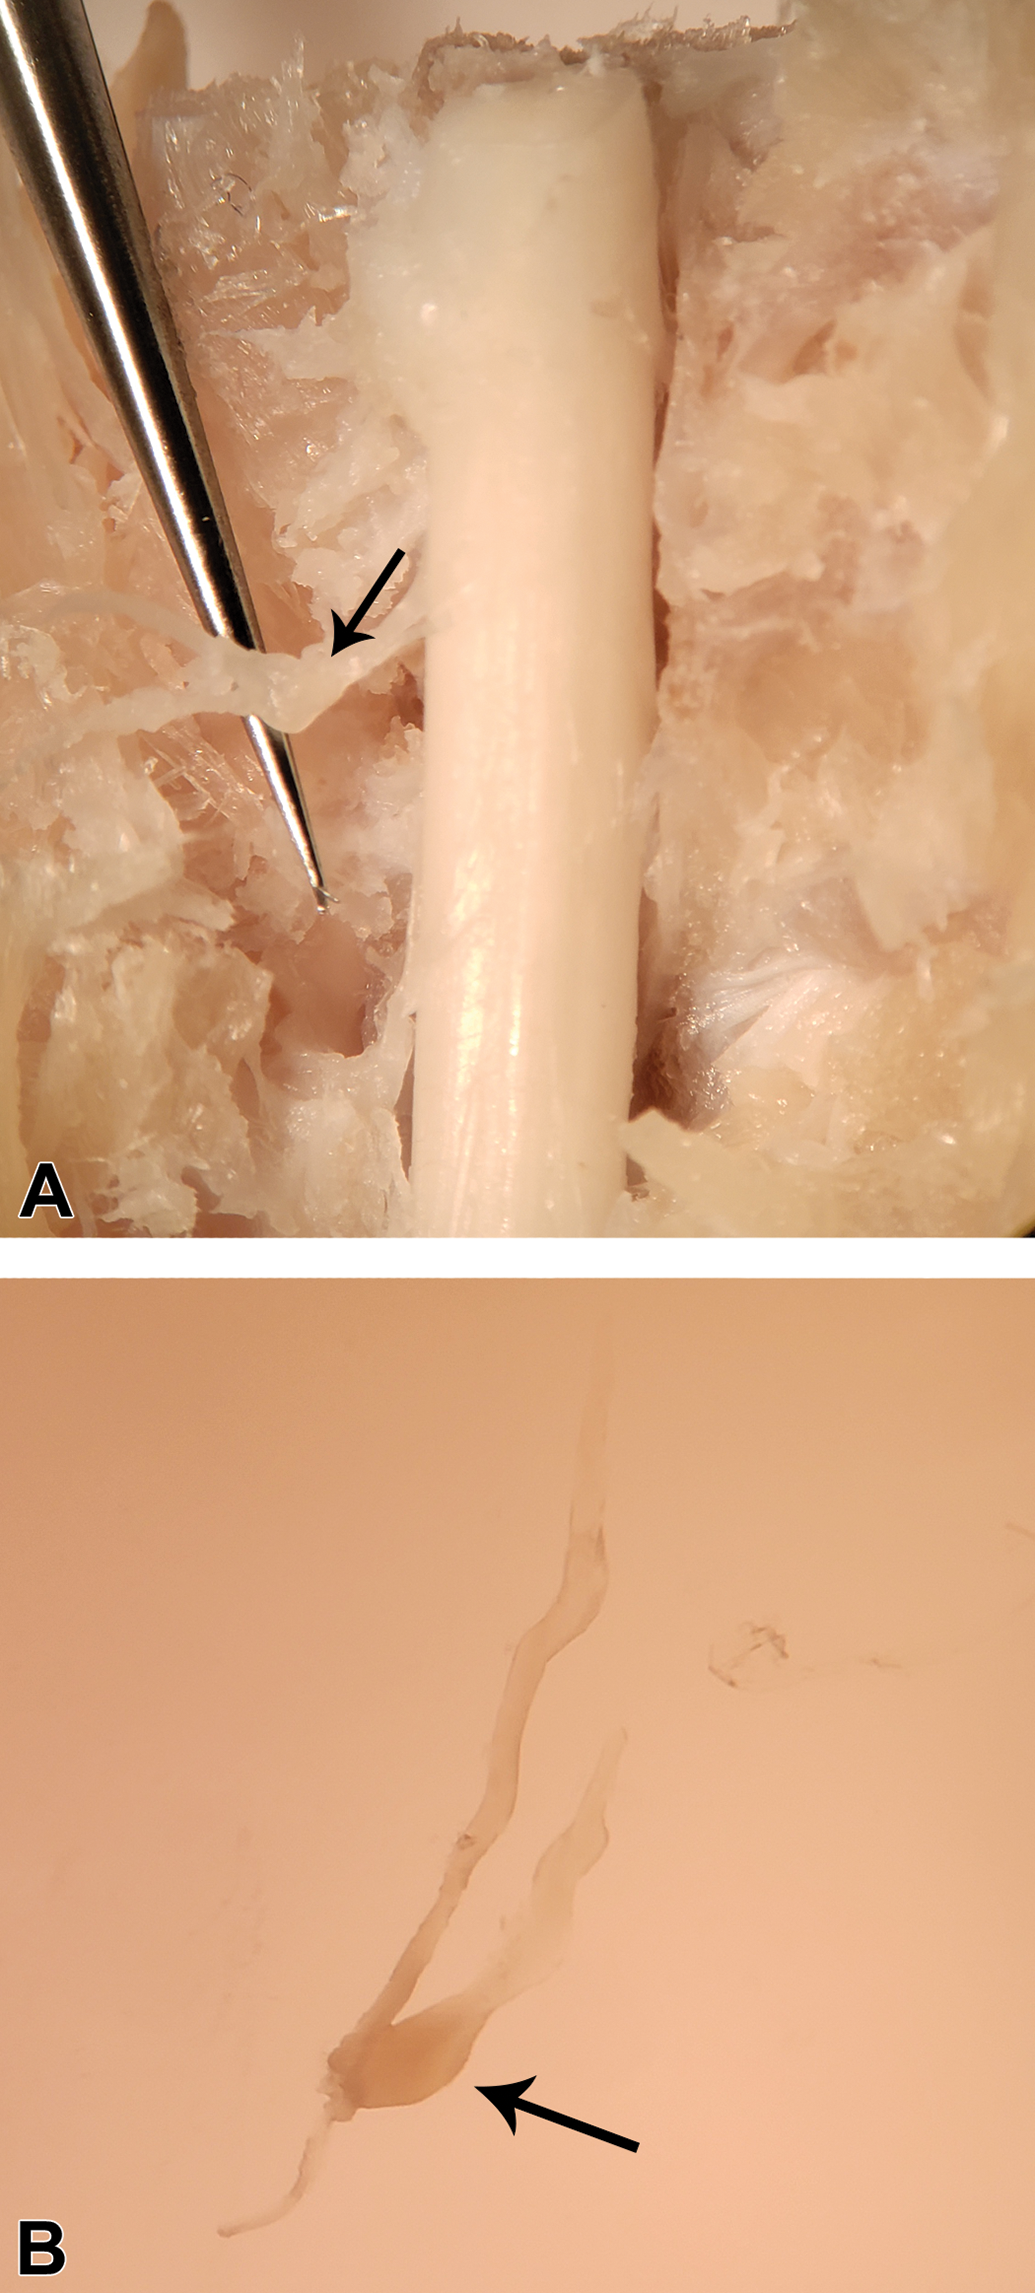
Dissection of dorsal root ganglia (DRGs) for stereological analysis. A, The spinal column, with the dorsal laminae removed, is visualized under a dissecting microscope. The DRGs and associated nerve roots can be isolated and dissected free for analysis. The DRG is denoted by an arrow. B, Image of the DRG and associated nerve roots postdissection. The ganglion is seen as a bulge at the end of the dorsal (sensory) nerve root (arrow).
CCGs can be isolated at necropsy (particularly for large animals) or the head and neck can be immersion fixed after perfusion and removal of the skin and excess muscle, and the ganglia can be isolated and dissected through the help of a dissecting microscope. 21 As with the DRGs, it is recommended to both collect CCGs and employ a counterbalanced design, saving one side per animal as a backup.
After dissection and fixation, ganglia are weighed to determine the preprocessing weight and are then dehydrated and processed in GMA. Prior to the final GMA hardening step, it is important to measure the largest diameter perpendicular to the long axis with a caliper, blot the tissue of excess GMA and weigh it to obtain the postprocessing weight, and randomly rotate the ganglion around its longitudinal axis within the embedding mold to obtain vertical uniform random (VUR) sections (Figure 4). Vertical sections can be used as a more practical alternative to isotropic uniform random (IUR) sections for the estimation of neuron cell volume. 19,22 IUR sections require several sampling steps to ensure the sections are randomly oriented in all 3 dimensions, whereas VUR sections only require random orientation around one fixed axial direction. 22 The caveat of VUR sections is that the vertical axis needs to be identified by the user in order for the system to accurately orient the stereological test system onto the sampled fields of view. These sections are still captured through SURS; however, the tissue needs to be oriented specifically prior to sampling in order to capture the sections appropriately. The pre- and postprocessing weights are required to estimate 3D global shrinkage and correct the ganglion volume and neuron size estimates accordingly. 5,6 Although this estimate does not capture all causes of shrinkage, it will take into account any treatment-related differences in processing-induced shrinkage, which is the main contributor to tissue shrinkage.
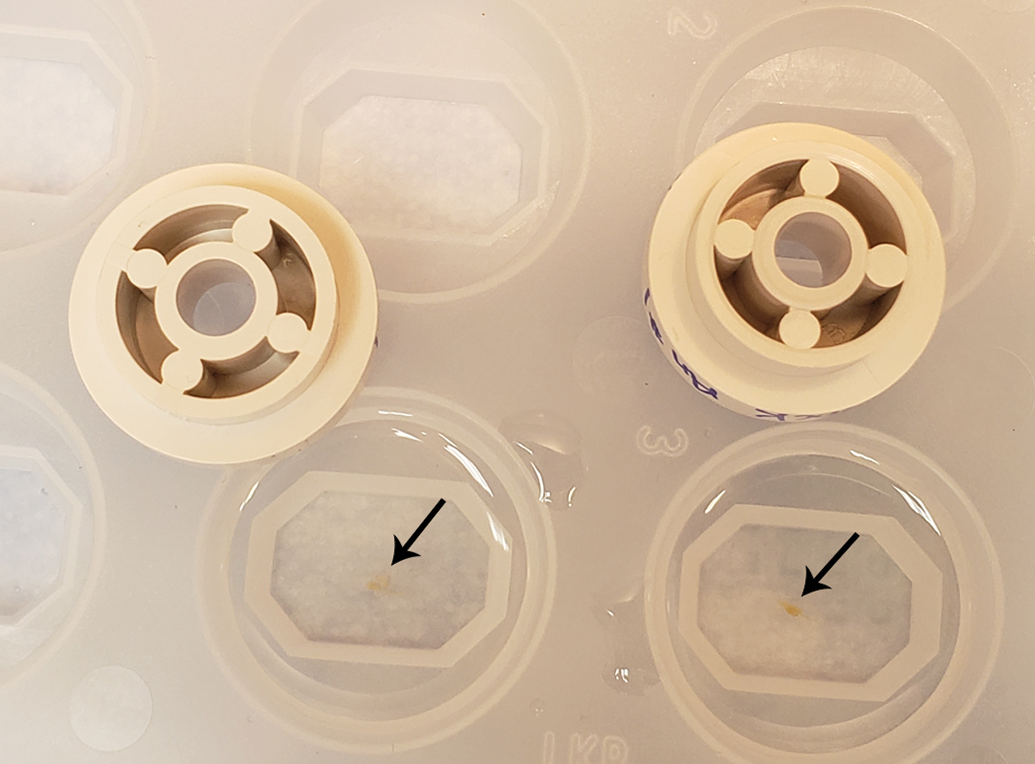
Embedding of ganglia in glycol methacrylate (GMA). The ganglia (arrows) are placed into appropriate molds and processed. At the final infiltration step, the ganglia are taken out and blotted, weighed and measured, and placed back in the mold. Once in the mold, the ganglia are rotated randomly along the longitudinal axis to produce vertical uniform random (VUR) sections.
The largest diameter measurement is used to calculate the ideal sampling interval (T) for SURS. Briefly, the average tissue diameter for all tissues in the study is divided by 10 to calculate the interval required to obtain 10 sections through the tissue, as the general guidance in stereology is to evaluate approximately 8 to 10 sections per tissue. Of course, this can vary depending on the heterogeneity of the tissue and the distribution and density of the object of interest. Therefore, it is highly recommended to determine the sampling interval in a small pilot study of 3 to 5 animals. Because ganglia are small enough to be embedded whole, SURS is performed at microtomy. The first section is captured randomly between 0 and T, and subsequent sections are captured at regular intervals (T) until the tissue block has been exhausted. Because stereology of tissue blocks is often exhaustive, it is imperative that additional backup sections (at least 2 disector pairs) are captured at each sampling interval, as well as any additional sections needed for other stains or analyses. It is also important for technical staff to be properly trained in collecting sections for stereology and to take utmost care in obtaining the highest quality sections, as artifacts may lead to unusable sections. It may be possible to compensate for occasional, small artifacts, however.
The most useful stain for GMA-embedded ganglia is cresyl violet acetate, which stains the Nissl substance within the neuronal cell bodies. 3 For paraffin-embedded or frozen ganglia sections, immunohistochemistry can be performed using a neuron-specific marker such as neuN. Given the inherent section thickness, it is important to ensure adequate stain penetration if optical disectors are used, which can be determined by creating a Z-distribution graph, where the depth of each positive counting event within the section (z-axis location) is plotted. 6,23 This is usually performed in a pilot study while optimizing the staining technique. Special stains often penetrate well (up to full thickness) in both paraffin- and GMA-embedded sections. However, immunohistochemical (IHC) stains often require extensive method development and possibly free-floating staining methods to achieve full-thickness penetration of the stain in paraffin-embedded tissue. IHC staining of GMA-embedded sections is extremely difficult and not usually recommended. Multiple optical disectors can be placed onto the same slide for increased efficiency during analysis (Figure 5).
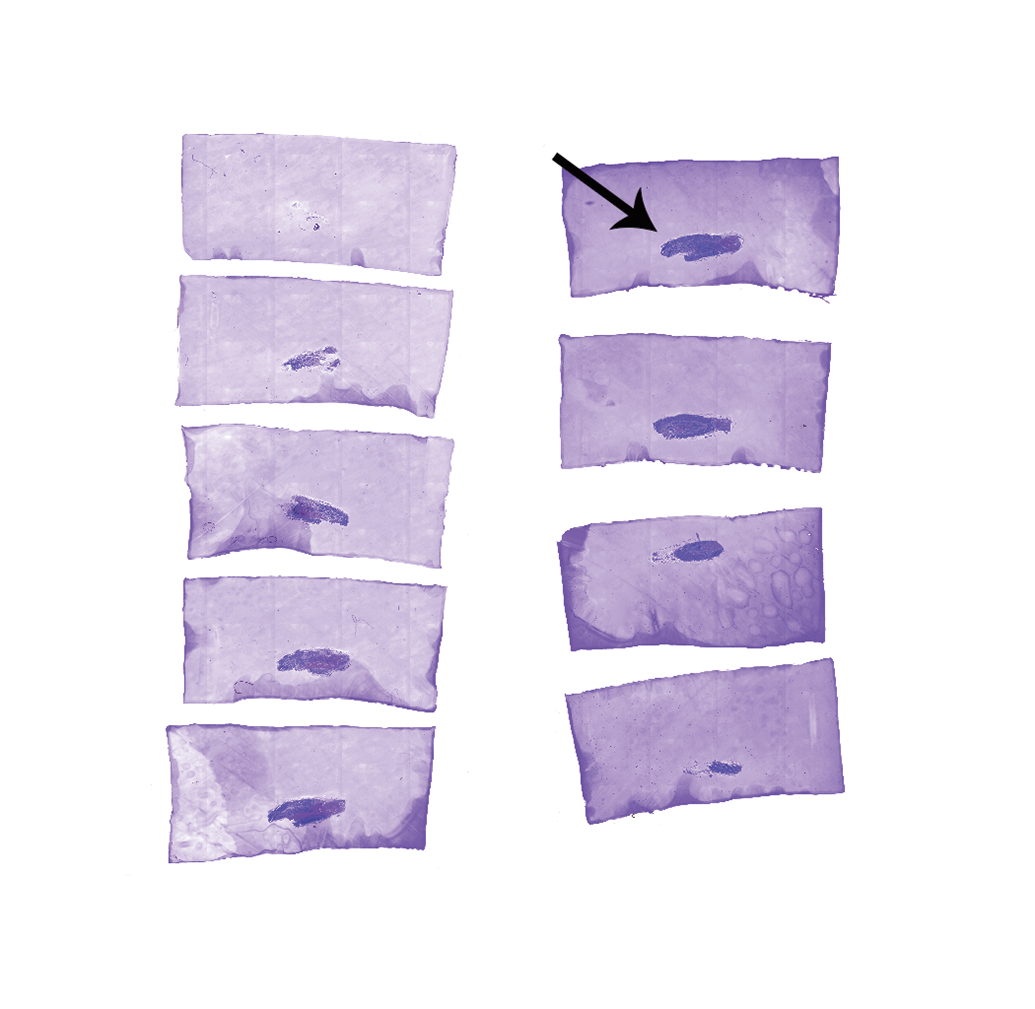
Example of glycol methacrylate–embedded optical disectors (30-µm thick) of dorsal root ganglia placed onto 2 microscope slides. Multiple sections containing ganglia (arrow) can be placed onto the same slide for cost and time efficiency. These sections were captured every 90 µm (ie, every third section was taken). Note that the background of the sections is tinted purple, due to the extended staining time in cresyl violet acetate required to obtain adequate stain penetration.
For estimation of ganglion volume, the entire ganglion is sampled at a low magnification (typically ×4 to ×10), and points are placed over the fields of view (Figure 6). The density of the points is determined in a pilot study, with a goal of 100 to 200 intersections between the points and the tissue. Any points that intersect the ganglion proper are tagged and summed, and the total ganglion volume is estimated by the Cavalieri method, in which the volume equals the sum of all cross-sectional areas (the sum of all points multiplied by the cross-sectional area per point) multiplied by the distance between the sections, which is the sampling interval or T. 23,24 The volume is then corrected for shrinkage using the 3D global shrinkage estimate for each animal. 5,6
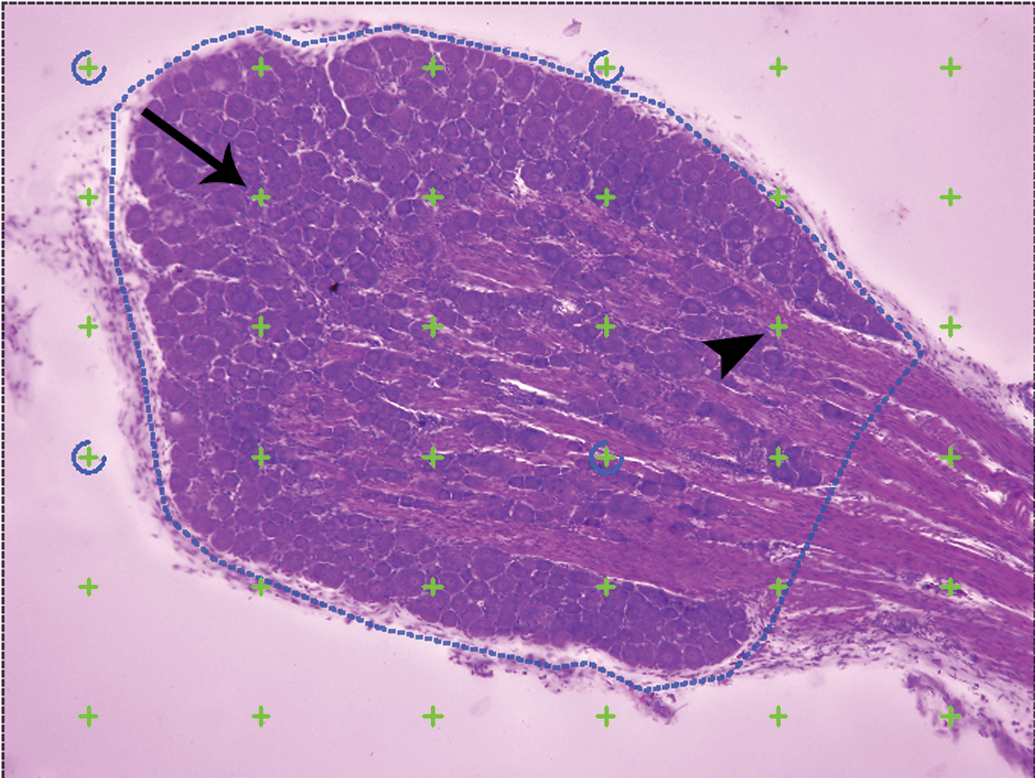
Estimation of total ganglion volume. A section of dorsal root ganglion is visualized under low magnification (×10 objective, in this case), a region of interest is drawn around the ganglion (blue dotted line), and a point probe is overlaid (green crosses). Points that intersect the ganglion proper are tagged (arrow), while those intersecting the nerve fibers are not (arrowhead). All intersections are summed and volume is estimated by the Cavalieri method.
For estimation of neuron number and size, a percentage of the tissue is chosen for sampling (the areal sampling fraction, or asf), with a goal of obtaining 100 to 200 counting events per sample, and the software captures fields of view through SURS (the first field is randomized and subsequent fields are placed at regular intervals throughout the tissue section). The optimal asf is typically determined during a pilot study. The software will display each field of view and an unbiased counting frame is placed over it, which contains 2 green inclusion lines and 2 red exclusion lines.
For neuron number estimates in the DRG, a double counting frame is used, one half the size of the other, for independent estimates of 2 neuronal populations, termed A and B neurons (Figure 7). A neurons are typically larger and contain well-defined “islands” of Nissl granules that stain heavily with the cresyl violet acetate and a lightly stained nucleus with a single central, intensely stained nucleolus. 3,19 The neuronal perikarya of A cells project myelinated fibers and carry signals related to proprioception, touch, and pressure. 19 B neurons are typically smaller and darker, with the Nissl substance often concentrated along the periphery of the cell, and they contain a large nucleus with multiple nucleoli, often distributed along the periphery of the nucleus as well as multiple smaller clumps of condensed chromatin. 3,19 The neuronal perikarya of B cells project unmyelinated fibers and carry signals related to pain and temperature. 19 B neurons are smaller and are approximately twice as numerous as A neurons; therefore, B neurons are counted within a smaller counting frame and A neurons are counted within a larger counting frame. 3,12,19 It is important to count the 2 neuronal populations separately, as some treatments affect unmyelinated and myelinated fibers to differing degrees. 12 For the CCG or other sympathetic ganglia, a single unbiased counting frame can be applied, as only one neuronal population is counted (Figure 8). The final calculation for total neuron number using the optical fractionator technique is equal to the sum of the counts multiplied by the inverse of the sampling fractions, which include the section sampling fraction (ssf), the asf, and the height sampling fraction (hsf). 2,6 The ssf is the section thickness divided by the sampling interval, the asf is the percentage of tissue that is sampled, and the hsf is the height of the disector (excluding the guard zones) divided by the weighted section thickness (average thickness of the sampling fields, weighted by the number of counts in the field). 25 These complex calculations can often be performed automatically by the stereology software.
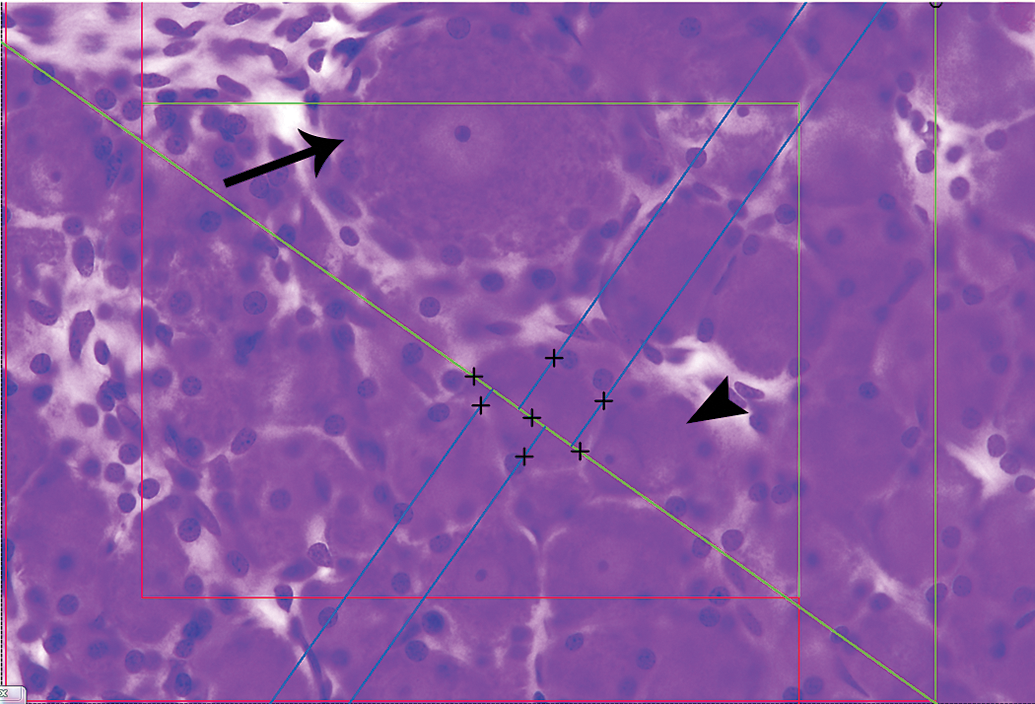
Estimation of neuron number and size in the dorsal root ganglion. A double counting frame is applied, with larger A neurons (arrow) counted within the larger frame and smaller B neurons (arrowhead) counted within the smaller frame. Neurons are counted when the nucleolus comes into crisp focus. Neuron size is estimated by the rotator probe. The center of the cell is tagged and a line is placed through the vertical axis (diagonal green line) by the software. The intersections between the line and boundary of the cell are tagged (“+”) and perpendicular half-lines (blue lines) are applied by the software. The intersections between these lines and the cell boundaries are then tagged (“+”). This produces a cell size estimate, which is then logged by the software.
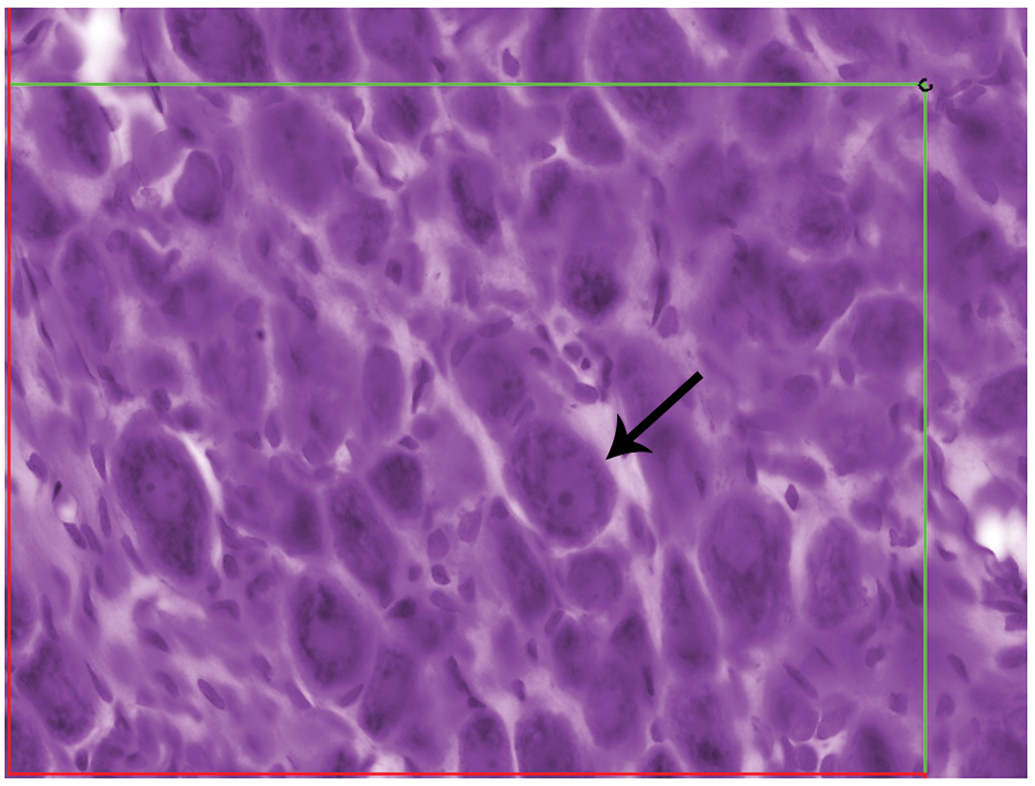
Estimation of neuron number in the cranial (superior) cervical ganglion. Sympathetic ganglia contain a single neuronal population, and these neurons can be counted using one unbiased counting frame. As with dorsal root ganglia, cells are counted when their unique counting feature (nucleolus, in this case) comes into crisp focus (arrow).
At each sampling field, the section thickness is measured by the software through the use of the length gauge attached to the microscope (see Figure 4). This length gauge measures the z-axis by tracking up and down movements of the microscope stage. Within the software, the user typically focuses on the top of the section and zeroes the Z-thickness measurement, then focuses down through the section until everything is out of focus, indicating the bottom of the section. This distance is logged for each sampling field and used to determine the hsf, which is a part of the final calculation for neuron number using the fractionator technique and is described in detail elsewhere. 6,25 Cells are counted as the chosen unique counting feature (typically the top of the cell, nucleus, or nucleolus) comes into crisp focus, as long as they are within the unbiased counting frame (not touching the red exclusion lines) and are not within the guard zones. Guard zones are the upper and lower boundaries of the section in which loss of cell nuclei, artifacts, or profound tissue shrinkage may occur. 25 The size of the upper and lower guard zones is unique to each study and must be determined during a pilot study, typically through the use of Z-distribution graphs (also used for confirming adequate stain penetration). 23
For estimation of neuron size, a local volume probe such as the nucleator or rotator is used. 26,27 Both techniques require the use of IUR or VUR sections. For ganglia, it is most practical to utilize the rotator on VUR sections. 19 The vertical axis must be indicated within the software by the user, which in this case is the longitudinal axis through the ganglion. When the center of the cell (the nucleolus) comes into crisp focus, the rotator is applied and the software creates a line parallel to the vertical axis through the core of the cell. The user indicates the boundaries of the neuronal cell body and the line, and the software creates additional half-lines that are perpendicular to the first line. The user again indicates the boundaries of the cell body and the half-lines, and the resulting size estimate is logged (see Figure 7). 28 In the DRG, average A neuron size is typically 4 to 5 times larger than average B neuron size. 3,12,19 The other local volume probe is the nucleator, which is also applied when the center of the cell comes into crisp focus. However, a line is not drawn through the vertical axis and thus, using the nucleator principle on vertical sections, requires the second and subsequent lines to be sine-weighted to the vertical axis rather than simply perpendicular to the vertical axis like the rotator. 19 Stereological analysis can also be applied to other ganglia, such as celiac, spiral, and vestibular ganglia. 28,29 These evaluations may be conducted when a drug has a known mode of action that may affect the peripheral nervous system, when clinical signs are observed (eg, analysis of vestibular ganglia for a drug that causes vertigo-like symptoms), or when evaluating underlying pathophysiology of disease (eg, analysis of celiac ganglia after a protein-deficient diet is administered long term).
Stereology of Peripheral Nerves
Stereological analysis of peripheral nerves can be useful for determining the degree of neural information being conveyed by estimation of nerve fiber number as well as the speed of impulse conduction by estimation of nerve fiber size. 30 These end points can be useful for nerve regeneration research and in the evaluation of peripheral neurotoxicity. 2D analysis of peripheral nerves typically involves determining the number of profiles per square millimeter (density) in a limited number of nerve cross-sectional areas. This is likely biased and inaccurate, as the sampled areas may not be representative, fiber distribution within the nerve may not be uniform, not all fibers have an equal chance of being sampled, and the variability in nerve fiber size related to their location in the nerve can lead to an overestimation of larger profiles. 31
Stereological estimation of myelinated nerve fiber number and size can be estimated at the light microscopic level on resin-embedded cross sections of peripheral nerves. An entire nerve segment (from one branching point to the next, preserved among animals) is isolated and fixed, usually using a glutaraldehyde-based fixative. It is important to keep the nerves straight for the first 10 to 15 minutes of fixation to allow for the best cross sections to be captured. 32 Post fixation, the nerve is divided into equal segments (each 0.5-1 cm long), with the first cut made using a random start (SURS). Each segment is osmicated to preserve the myelin sheath and embedded in resin. A fraction of the blocks is chosen by SURS for sectioning and analysis (ie, every third segment is chosen, with the first segment being chosen randomly between 1 and 3). These blocks are sectioned into 1- to 2-µm-thick sections with an ultramicrotome, and the sections are stained with toluidine blue.
The slides are scanned at 40× objective magnification and imported into the stereology software for estimation of myelinated nerve fiber number by the 2D fractionator as well as nerve fiber size by the 2D nucleator. The probes are termed “2D” because the disector cannot be applied to nerve fiber cross sections, as peripheral nerve fibers are cylindrical tubes of a length that is much longer than the diameter and thickness of sections, and each fiber runs the entire length of the nerve. 32 The 2D disector for myelinated nerve fiber number has been verified by comparing to true estimates achieved through extensive counting and has been shown to be unbiased and efficient. 32 A region of interest is drawn around the entire nerve fiber and a fraction of the tissue is chosen for sampling, with a goal of counting 150 to 200 fiber profiles per nerve. 31,32 An unbiased counting frame is applied to avoid bias toward small or large profiles, with nerve fibers counted if they are within the counting frame or touching the inclusion lines, but not when they are touching the exclusion lines (Figure 9). Previous studies have shown that it is more optimal to sample several fields (ie, >15) with smaller counting frames than relatively few fields with larger counting frames and that it is generally best to count 5 or less profiles per sampling field. 33,34 The total number of myelinated axons per cross section is calculated as the number of counts multiplied by the inverse of the sampling fraction (inverse of the percentage of tissue sampled by SURS). 33 If number is estimated in several cross sections, it can be averaged to obtain a mean number of myelinated axons per nerve cross section. If damaged nerves are being evaluated, it may be helpful to categorize the axons based on morphology as normal, demyelinated, degenerating, or regenerating. 35
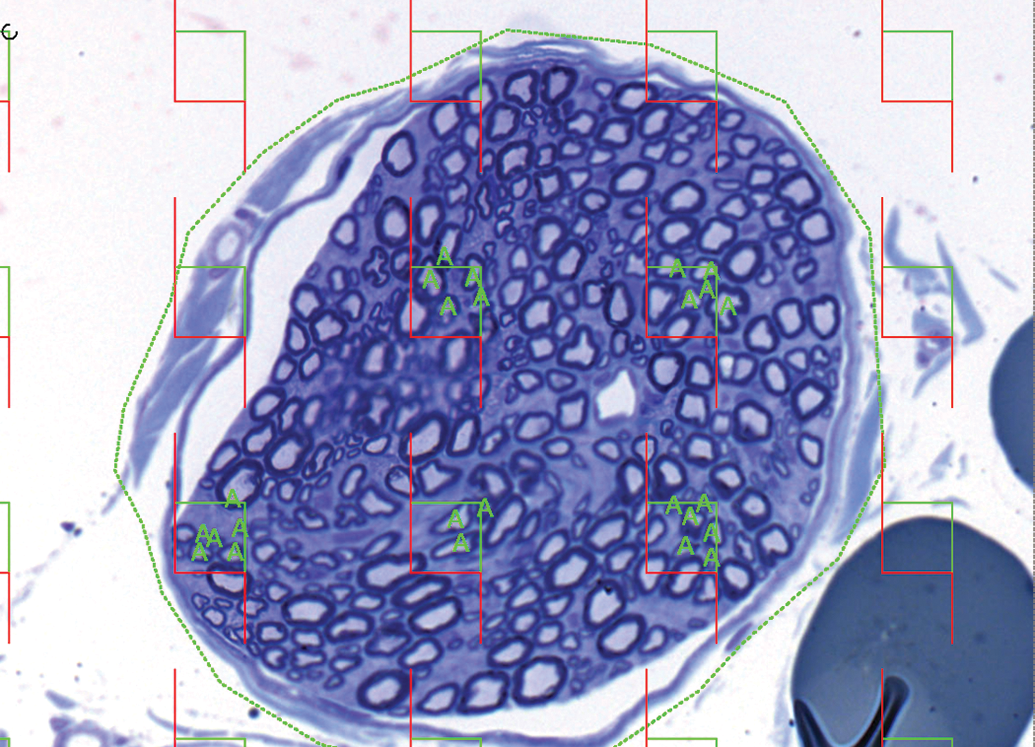
Estimation of myelinated nerve fiber number in resin-embedded peripheral nerve cross sections. A region of interest is drawn around the entire nerve cross section and unbiased counting frames are placed over the section at regular intervals (with the first positioned randomly) using systematic uniform random sampling (SURS). Myelinated fibers are counted if they are within the unbiased counting frame or touching the green inclusion lines, but not if they are touching the red exclusion lines (“A”).
For estimation of myelinated nerve fiber size, the 2D nucleator is utilized. 33 For each myelinated nerve fiber that is sampled, the center of the axon is indicated by the investigator and the software creates test lines through application of the nucleator probe (Figure 10). The boundaries of the test lines and the nerve fiber boundary are tagged, and the resulting size estimate is logged by the software. Other estimates can be made by stereological analysis of the nerve cross sections under light microscopy and include axon and myelinated nerve fiber perimeter and myelin sheath thickness. 33
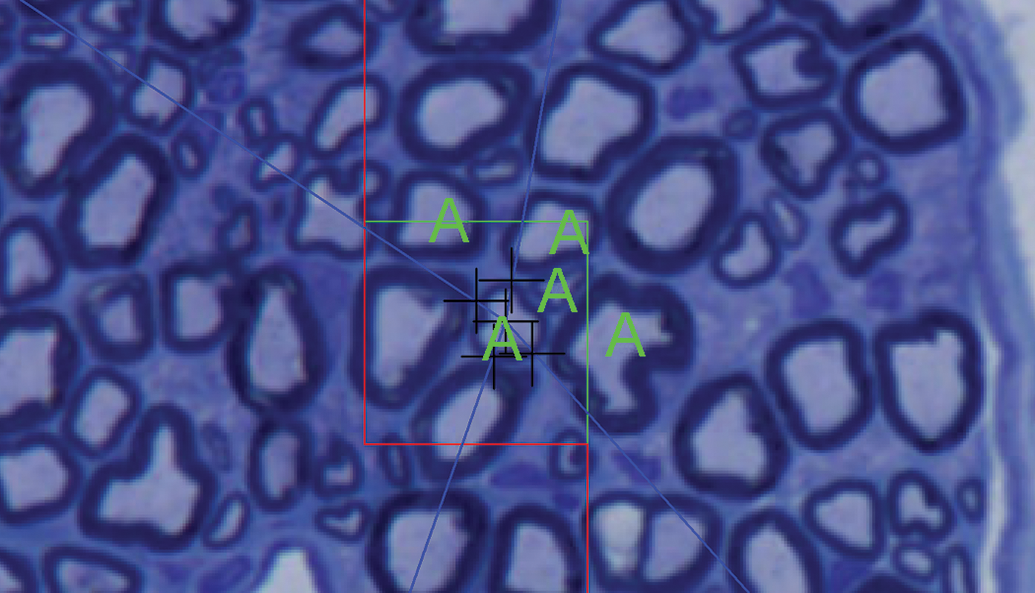
Application of the nucleator probe to peripheral nerve cross sections for estimation of myelinated nerve fiber size. The center of the axon is indicated (central cross), and the software produces 2 or more lines through the center of the fiber. The intersections between the fiber boundary and the lines are tagged (additional crosses), and the resulting cell size estimate is logged by the software. Note nerve fibers that have been tagged (“A”) for estimation of nerve fiber number.
Evaluation of unmyelinated nerve fibers requires the use of electron microscopy. Ultrathin sections are captured from selected resin-embedded sections and sampling fields are chosen by SURS using an electron microscope. Electron micrographs are captured and uploaded into the stereology software for analysis. The system is calibrated and unbiased counting frames are applied to each electron micrograph, in a fixed position and regularly spaced apart (Figure 11), in order to reduce the impact of nerve fiber clusters. 33 The goal is to count approximately 250 to 300 unmyelinated axons across 60 to 80 photomicrographs per nerve cross section. 33 Unmyelinated nerve fiber area can be estimated by placing a point grid over each sampled photomicrograph and counting the intersections between the points and the unmyelinated axons (Figure 12). 33
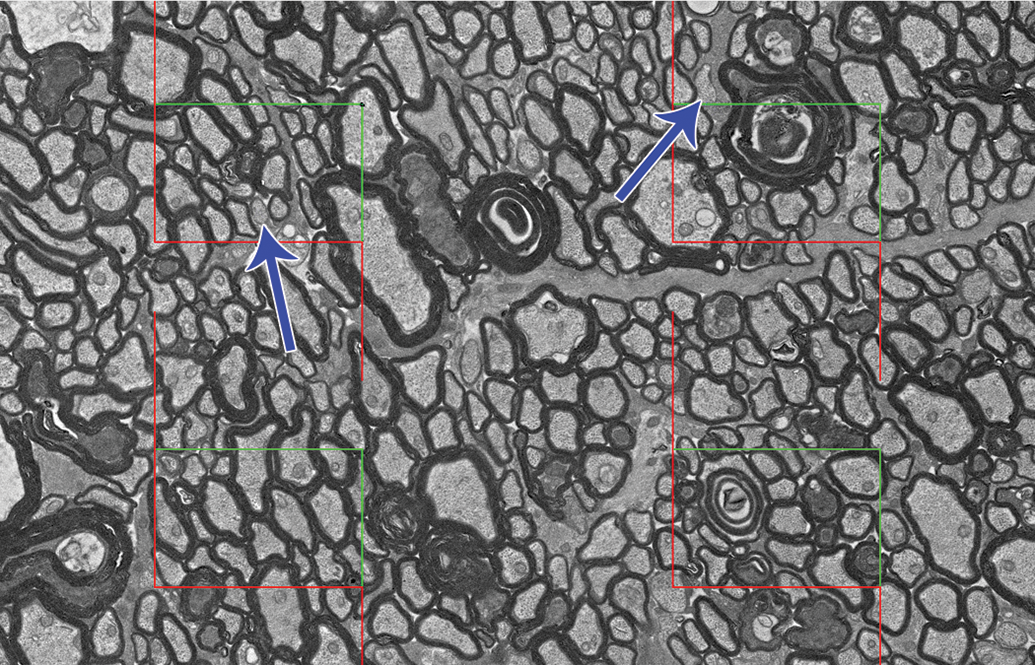
Estimation of unmyelinated nerve fiber number on electron micrographs of peripheral nerve cross sections. Four unbiased counting frames are placed over the electron micrograph at regular intervals and the unmyelinated fibers are tagged (arrows).
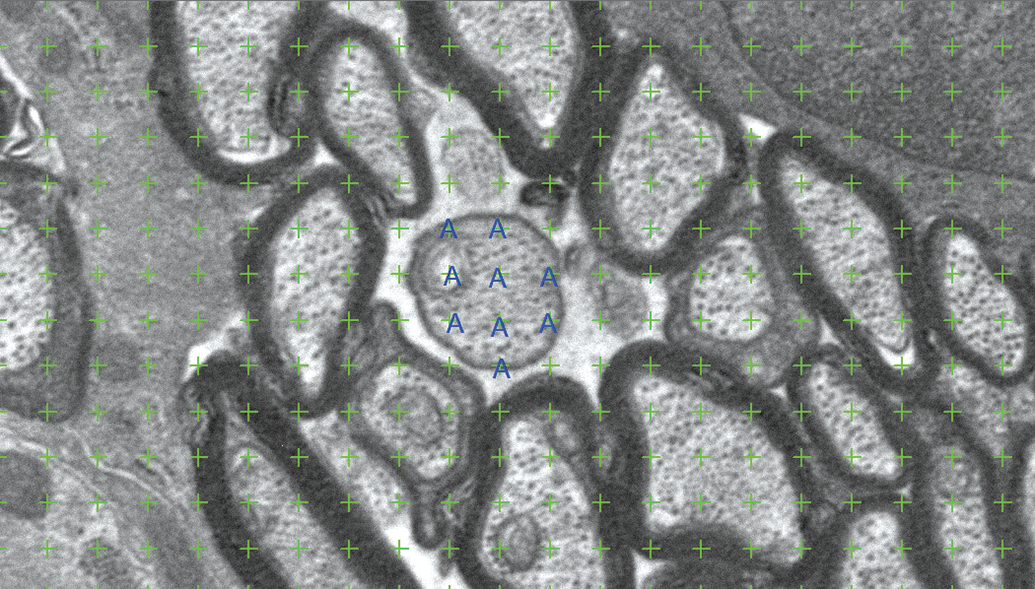
Estimation of unmyelinated nerve fiber area on electron micrographs of peripheral nerve cross sections. A point probe is laid over the electron micrograph (green crosses) and intersections between unmyelinated axons and points are tagged (blue “A”).
If electron microscopy is unavailable to the investigator, the nerve choice becomes particularly important, as some nerves may have few myelinated fibers and be more difficult to count. 31 Rat tibial nerve is considered to be a good choice for this, as it contains approximately 3000 myelinated fibers. 31 It can also be difficult to differentiate unmyelinating Schwann cell nuclei from small myelinated axons by light microscopy. 35 Another potential caveat is that size estimates are affected by processing-induced shrinkage. 31 This effect can be minimized by estimating 3D global shrinkage and correcting size estimates accordingly. 5,6 Size can also be affected by any axons that are cut at a nonideal angle; however, if the nerve is cut in a way that appears to be perpendicular to the long axis when evaluated by the naked eye, the bias is considered to be below 4%. 33
Stereology of Intraepidermal Nerve Fibers
Peripheral sensory neuropathies are a relatively common sequela of several disease states, such as diabetes mellitus, or drug toxicities, most notably associated with chemotherapeutics for cancer. The hallmark of many of these disorders is the loss of small nerve fibers in the epidermis, and the gold standard for detection has traditionally been IENFD assessment. 36,37 However, stereological techniques can also be applied to unbiasedly estimate total epidermal nerve fiber length. 37 –39 Although IENFD is routinely used, it is technically inaccurate to simply count nerve fiber profiles in 2 dimensions, as branching points cause overestimation and free ends cause underestimation. 40 It is also assumption based (which is inherently biased), in that it assumes that nerve fibers are arranged isotropically (which we know is not the case, as they have a defined orientation) and that each nerve fiber is only sampled once by the microtome blade. 39 In addition, IENFD, like any 2D technique, results in a density estimate. This is in contrast to the absolute estimate obtained by stereology. Absolute estimates are preferable to densities or ratios because they take into account any changes in the total tissue (reference space) that may be due to treatment. For example, soft tissue swelling of the footpad may lead to lower IENFD estimates because the space between the nerve fibers (the total epidermal area) may be expanded.
In humans, the distal limb is most often utilized for skin biopsy and subsequent determination of nerve fiber length or density. However, this area is haired in animals. Thus, the metatarsal footpad is a useful location for analysis in rodents and larger laboratory animals. Additionally, the entire footpad can be isolated for SURS, allowing for an absolute estimate rather than a density assessment. The footpad, particularly in monkeys, is very richly innervated, making manual counting of every nerve fiber incredibly labor intensive. 40 Thus, stereological evaluation of total nerve fiber length through fractionator sampling allows for increased efficiency over traditional IENFD assessment.
The entire hindlimb can be fixed in rodents, or the foot can be isolated prior to fixation. For large animals, the foot is isolated at necropsy and fixed. Ten percent neutral-buffered formalin fixation and paraffin embedding is the preferred method of choice for our laboratory; however, some references utilize Zamboni’s fixative and frozen sectioning. 40 GMA embedding is not preferred, as IHC staining is required and is extremely difficult to perform on plastic-embedded sections.
After the footpad is isolated, it is weighed to determine the preprocessing weight and processed in filtered paraffin. After processing, the postprocessing weight is captured so that the 3D global shrinkage can be calculated. 5 Additionally, the widest thickness perpendicular to the vertical axis (the axis extending from the epidermal surface to the deepest aspect of the tissue) is measured by calipers and used to determine the optimal sampling interval (for additional details, see section on ganglia). The processed footpad is placed on an equiangular cutting guide and bisected parallel to the vertical axis at a random angle to create vertical sections (Figure 13). Both halves are placed side by side in the embedding mold cut-side down. Alternatively, if the footpad is too small to bisect, it can be randomly rotated along the vertical axis and placed into the embedding mold whole. If this is performed, the embedding technician needs to be careful to embed the footpad so that sections parallel to the vertical axis will be captured at microtomy. This is more feasible if a flat cut-side is placed down into the embedding mold.
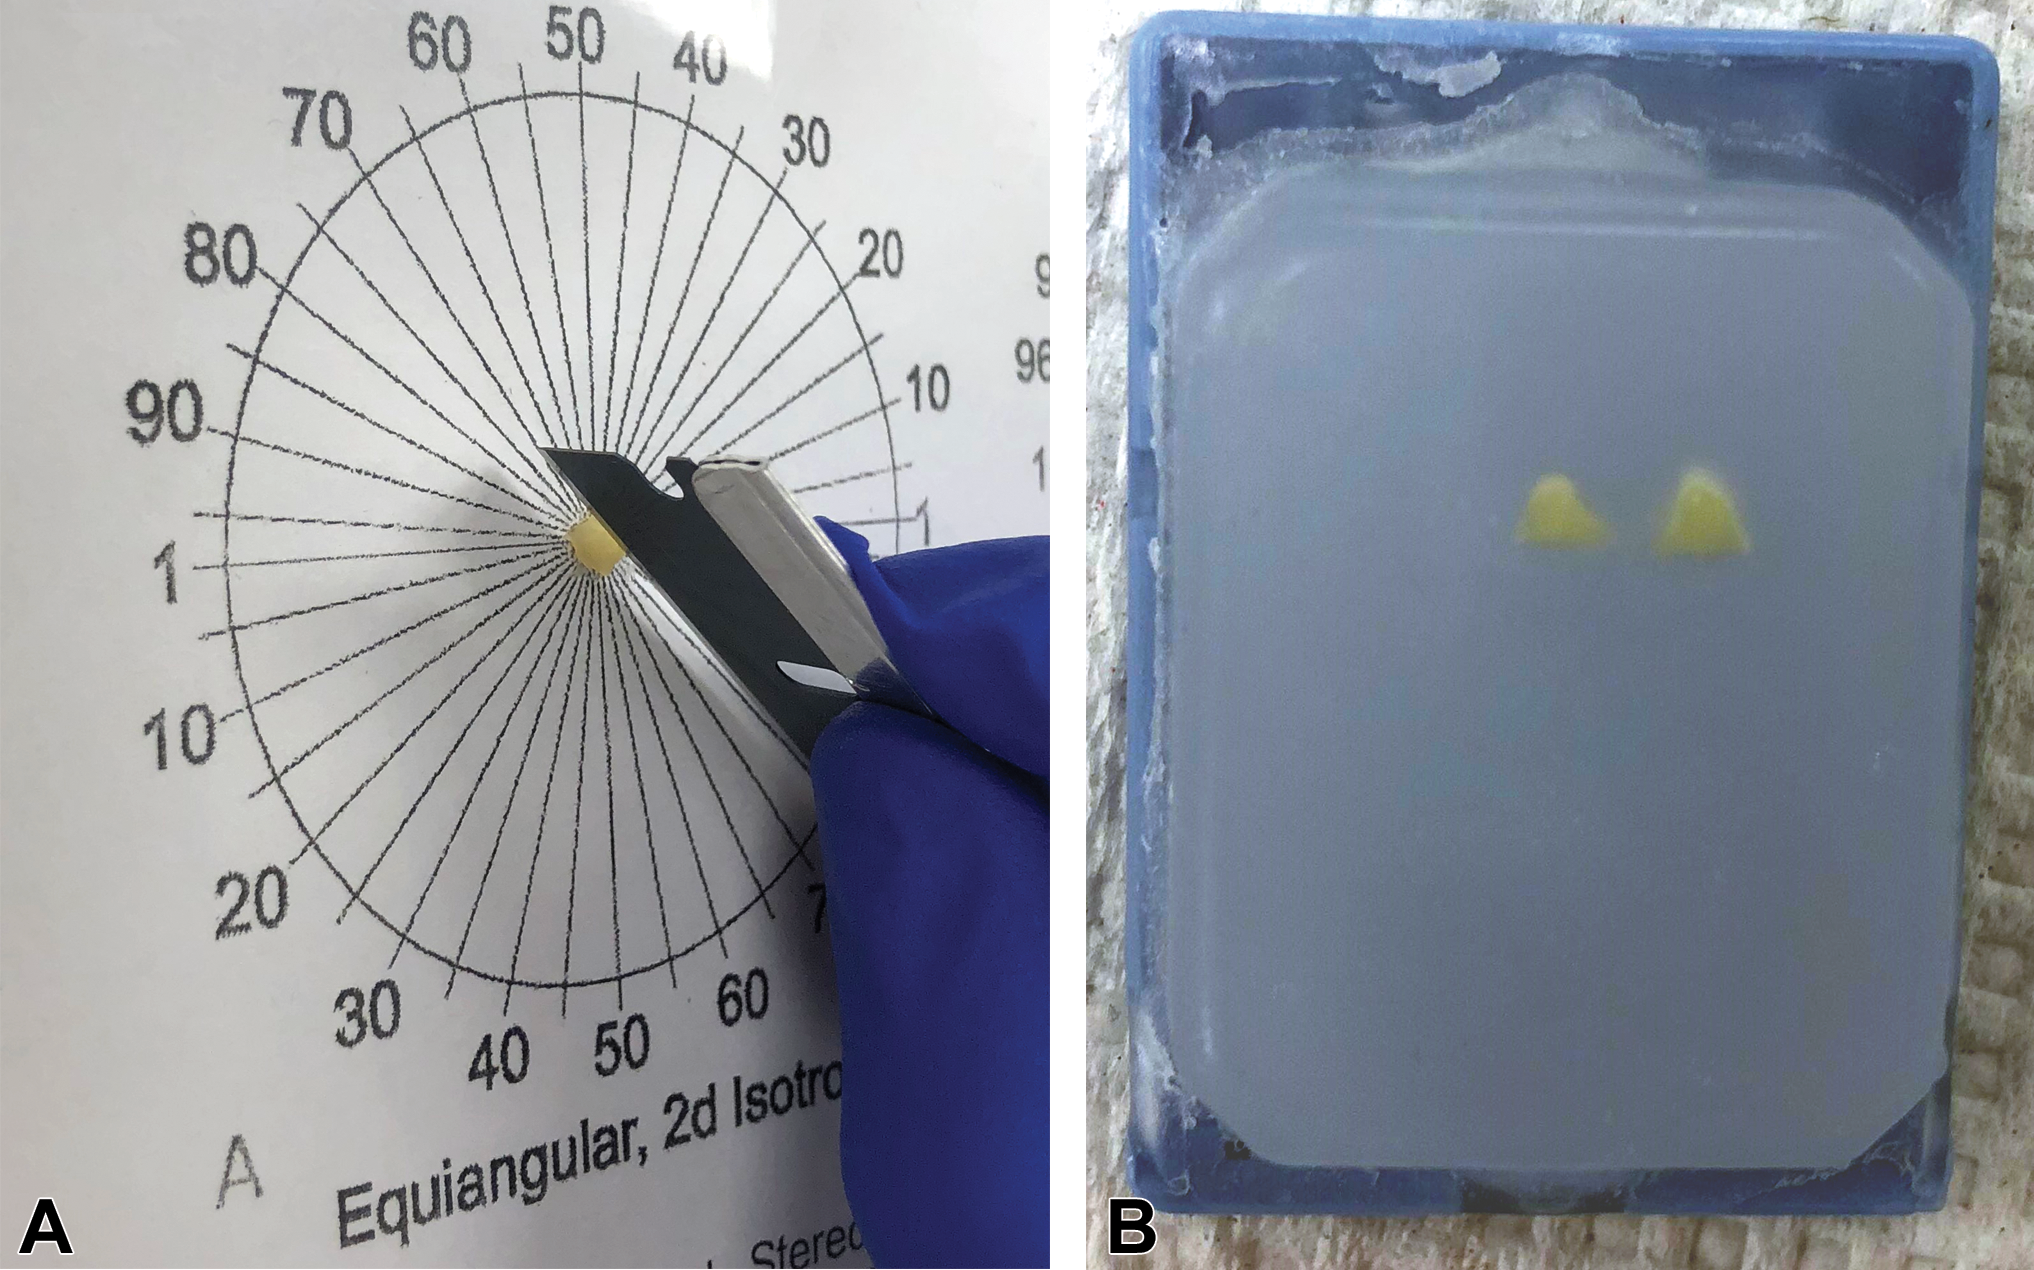
Unbiased sampling of a rat footpad. The footpad is bisected to create vertical uniform random (VUR) sections for estimation of intraepidermal nerve fiber length. A, After tissue processing, the footpad is placed onto an equiangular cutting guide, with the epidermal surface facing up. A random angle is chosen and the footpad is bisected. B, Both halves are placed cut-side down into the embedding mold. The sections are embedded parallel to one another to keep the vertical axis constant.
The footpad is embedded in filtered paraffin and exhaustively sectioned at microtomy by SURS, utilizing the optimal sampling interval determined during a pilot study. At each sampling interval, 30-µm-thick optical disector sections are captured, along with several backups. Multiple sections can be placed onto the same slide to reduce costs and increase efficiency. Sections are IHC stained for protein gene product 9.5, which is a soluble cytoplasmic protein that is abundant in nerves. 41 As with any study utilizing thick sections, it is important to ensure adequate stain penetration when optimizing the staining technique, which can be determined through Z-distribution graphs. 6
Determining the length of tubular structures (such as nerve fibers) requires viewing the complete projection (full thickness) of the object in a plane that is perpendicular to the vertical axis of the section. 41,42 This can be achieved through the evaluation of thick vertical sections (optical disectors) using a high-magnification oil objective (×60 to ×100) with thin focal planes. As with evaluation of neuron number in ganglia using the optical disector, this requires a microscope equipped with a camera, motorized stage, and length gauge.
For estimation of total nerve fiber length by the fractionator design, the slide is placed onto the microscope stage and viewed within the stereology software system and a fraction of the epidermis (outlined as a region of interest by the user) is chosen for sampling. Within each sampling field, an unbiased counting frame is applied along with a set of test lines. Depending on the stereology software used and orientation of the tissue, the test lines can be cosine-weighted (line length is proportional to the sine of the angle between line and the vertical axis) or cycloids (curved lines where the minor axis of the curve is parallel to the vertical axis, or sine-weighted). 22,41,43,44 The user focuses through the section and counts the intersections between the test lines/cycloids and epidermal nerve fibers when the fibers first come into crisp focus, are within the unbiased counting frame (not touching the exclusion lines), and are not within the guard zones at the top and bottom of the section (Figure 14). 41 In addition, the section thickness is measured at each sampling field where an intersection is counted. The total length of fibers in the footpad by the fractionator technique is equal to:
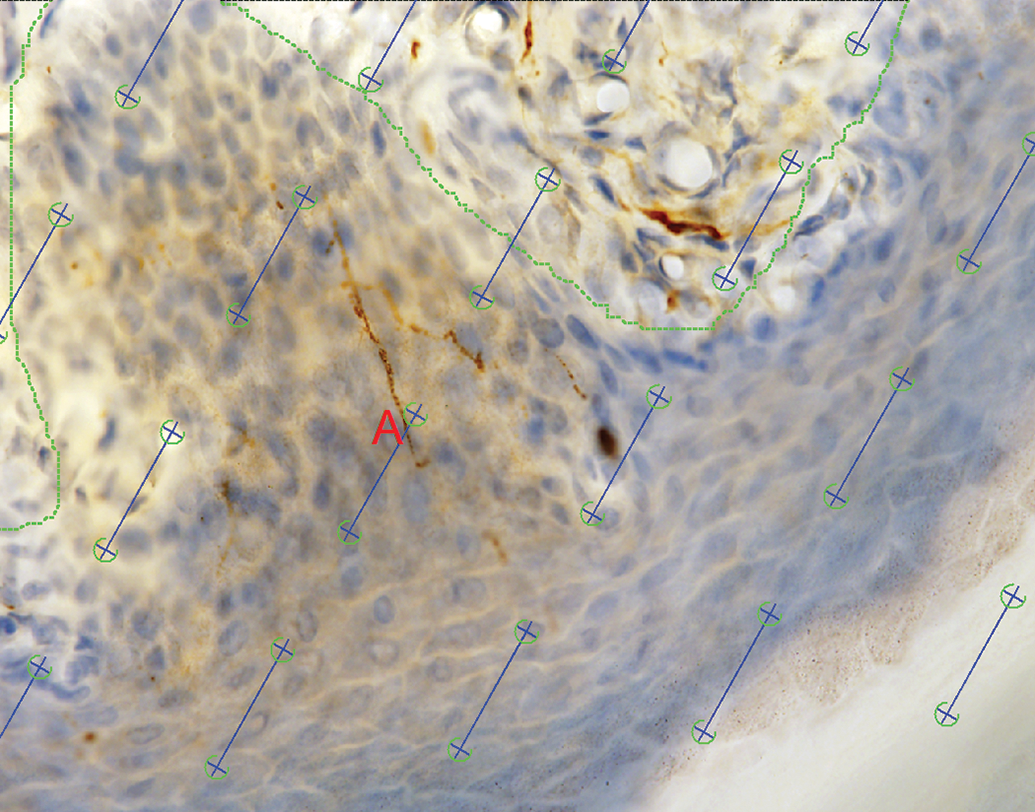
Estimation of intraepidermal nerve fiber length. The skin section is stained for protein gene product (PGP) 9.5 and visualized within the stereology software at ×60 objective magnification. The epidermis is outlined (the dermal–epidermal junction is denoted by green dotted lines) and sampling fields are selected by the software. Cosine-weighted lines (blue lines with encircled ends) are applied to each sampling field and intersections between the lines and the PGP 9.5-positive nerve fibers are tagged (red “A”).
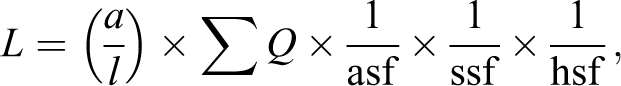
where
Additionally or alternatively, the final estimate can be expressed as length per surface area of the footpad, which may be a more useful estimate. For this to be done, the total epidermal surface area needs to be estimated by sampling 100% of the epidermis at low magnification (×4 to ×10) and applying sine-weighted test lines to the fields of view (Figure 15). The intersections between the lines and the epidermal surface are tagged and summed, and the total epidermal surface area is calculated as:
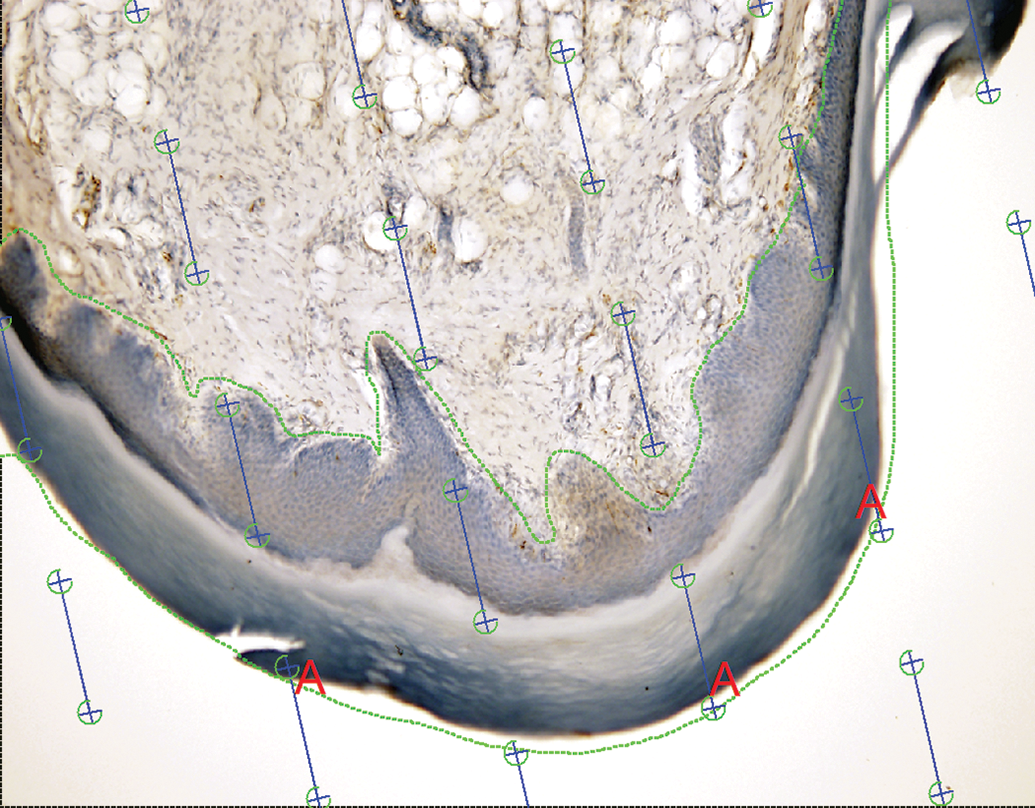
Estimation of epidermal surface area. The section from Figure 14 is visualized under lower magnification and the epidermis, including the stratum corneum, is outlined. A line probe is applied to the section and intersections between the lines and the outer surface of the epidermis are tagged (red “A”).
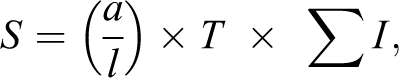
where T is the sampling interval and ΣI is the sum of the intersections. 22 Length of nerve fibers per surface area is then calculated by dividing the total length by the total surface area.
If the fractionator design is not utilized (ie, if the fractions are not kept track of and included in the estimate), the result will be the length density. The number of upper corners of the counting frame hitting the reference space (epidermis) will need to be tracked and summed in order to calculate the length density, and the density will need to be multiplied by the total epidermal volume (estimated through the Cavalieri principle) to determine the absolute total length. 45 This is more cumbersome; thus, the fractionator design is preferred.
There are other stereological test systems or probes that can be applied to the sampled fields of view to calculate total length. These include isotropic virtual planes or isotropic spherical probes. The details of these estimators are beyond the scope of this article and have been reviewed in detail elsewhere. 44,46
Importance of Pilot Studies
As mentioned several times throughout the preceding examples, it is imperative to include a pilot study for all studies utilizing stereology. There are many facets to the study design that need to be determined prior to the often exhaustive sectioning that occurs with the precious study tissue. The first aspects that need to be determined are the most optimal way to fix, sample, and embed the tissue. Perfusion fixation may be required and usually recommended for these studies. However, if there are other desired end points such as electron microscopy or molecular assays, perfusion with 4% paraformaldehyde (the typical fixative utilized for perfusion in our laboratory) may be prohibitive. Tissue sampling is one of the most important aspects to any stereology study and requires the use of several pilot samples to optimize. Sampling in an unbiased manner requires knowledge about the size, shape, and other geometrical features of the tissue as well as the desired end points; for example, are IUR or VUR sections required? There are several manuscripts and book chapters that outline sampling strategies for different tissues. The embedding medium is also important. If volume is an end point, processing-induced shrinkage needs to be taken into account and plastic (such as GMA) may be the best embedding medium. However, it is extremely difficult to perform IHC staining on plastic-embedded tissue.
Once the optimal sampling strategy has been determined, any IHC staining needs to be optimized. If optical disectors are being used, it is imperative to evaluate for adequate stain penetration in the sections as previously described. Additional optimization includes the percentage of the tissue to sample, size of unbiased counting frames to use, and density of any stereological test systems or probes that will be used. These steps were detailed in each of the preceding examples.
Once all aspects of the study design have been optimized, a small pilot cohort (3-5 animals) can be analyzed and the observed biological variability can be determined through calculating the coefficient of variation of the results. This can be compared with the coefficient of error of the estimate, which is determined by a calculation that is unique for each end point (ie, volume, number, etc) to determine whether the precision of the estimate is adequate. 5 The sampling rigor can be increased as required to obtain adequate precision.
Discussion
Evaluation of peripheral nervous system toxicity or efficacy of treatments in nerve regeneration models may require highly sensitive techniques to detect subtle changes in neuron number or size, myelinated axon number or size, or IENFD. 2D morphometry is often utilized to quantify these changes and results in increased sensitivity of detection to beyond what the naked eye can achieve alone. However, the results of these analyses may be highly biased due to sampling strategies that are not representative, result in some objects having a higher chance of being sampled than others, and are influenced by the size, shape, or orientation of the objects being counted or measured.
Stereological analysis provides absolute estimates of number, volume, surface area, and length based on unbiased sampling strategies and methods that are free from assumptions about size, shape, or orientation. Stereological sampling and analysis can easily be applied to peripheral nervous system tissues such as ganglia, peripheral nerves, and intraepidermal nerve fibers to produce accurate estimates of neuron number, neuron size, myelinated axon number, and length of intraepidermal nerve fibers, among others. These estimates provide sensitive, accurate results that aid the researcher in detecting subtle changes in peripheral nervous system tissues.
Footnotes
Acknowledgments
The authors would like to acknowledge David Hill, Kellie Jones, and Jane Goad for their assistance with the figures used in this article.
Declaration of Conflicting Interests
The author(s) declared no potential conflicts of interest with respect to the research, authorship, and/or publication of this article.
Funding
The author(s) received no financial support for the research, authorship, and/or publication of this article.