
Abstract
The aim of this study was to evaluate the usefulness of simultaneous measurement of plasma steroids, including precursors, for the evaluation of drug effects on adrenal steroidogenesis in vivo. Plasma concentrations of corticosterone and its precursors were examined in rats dosed with compounds that affect adrenal steroidogenesis via different modes of action as well as the relationships of the changes with blood chemistry and adrenal histopathology. Male rats were dosed with tricresyl phosphate, aminoglutethimide, trilostane (TRL), metyrapone (MET), ketoconazole (KET), or mifepristone for 7 days. In the TRL, MET, and KET groups, precursor levels were markedly increased, while there were no significant changes in the corticosterone level, suggesting that the precursors are more sensitive biomarkers to detect the effect on adrenal steroidogenesis. Also, the precursors with increased levels were those that are normally metabolized by the inhibited enzymes, reflecting the modes of action of the compounds. In addition, different patterns of changes were observed in blood chemistry and histopathology, supporting the mechanism suggested by the steroid changes. These results show that simultaneous measurement of plasma steroids, including precursors, can be a valuable method to sensitively evaluate drug effects on adrenal steroidogenesis and to investigate the underlying mechanisms.
Keywords
The adrenal gland is the most common toxicological target within the endocrine system (Ribelin 1984), and drug-induced inhibition of steroidogenesis in the adrenal cortex can be fatal in humans (Harvey and Everett 2003). However, methods to evaluate drug effects on adrenal steroidogenesis are relatively limited, and a novel evaluation method is needed (Harvey and Everett 2003; Hinson and Raven 2006).
In our previous study, we showed that by simultaneous measurement of plasma adrenal steroids including precursors, effects of ketoconazole (KET), a known inhibitor of steroidogenesis, could be evaluated sensitively in rats, while providing insight into the underlying mechanism (Tochitani et al. 2016).
The aim of the present study was to further evaluate the usefulness of simultaneous measurement of plasma steroids, including precursors, for the evaluation of drug effects on adrenal steroidogenesis in vivo. With this aim, we examined the changes in plasma concentrations of corticosterone and its precursors in rats dosed with compounds that affect adrenal steroidogenesis via different modes of action. The precursors examined were deoxycorticosterone, progesterone, and pregnenolone, and the compounds used and their modes of actions are shown in Table 1. Assuming the possible incorporation of the simultaneous measurement into toxicity studies, the study was conducted in the context of general toxicity studies, and the relationships of the changes with other toxicological parameters, blood chemistry, and histopathology of the adrenal gland were also examined.
The Compounds and Dose Levels Used in This Study.
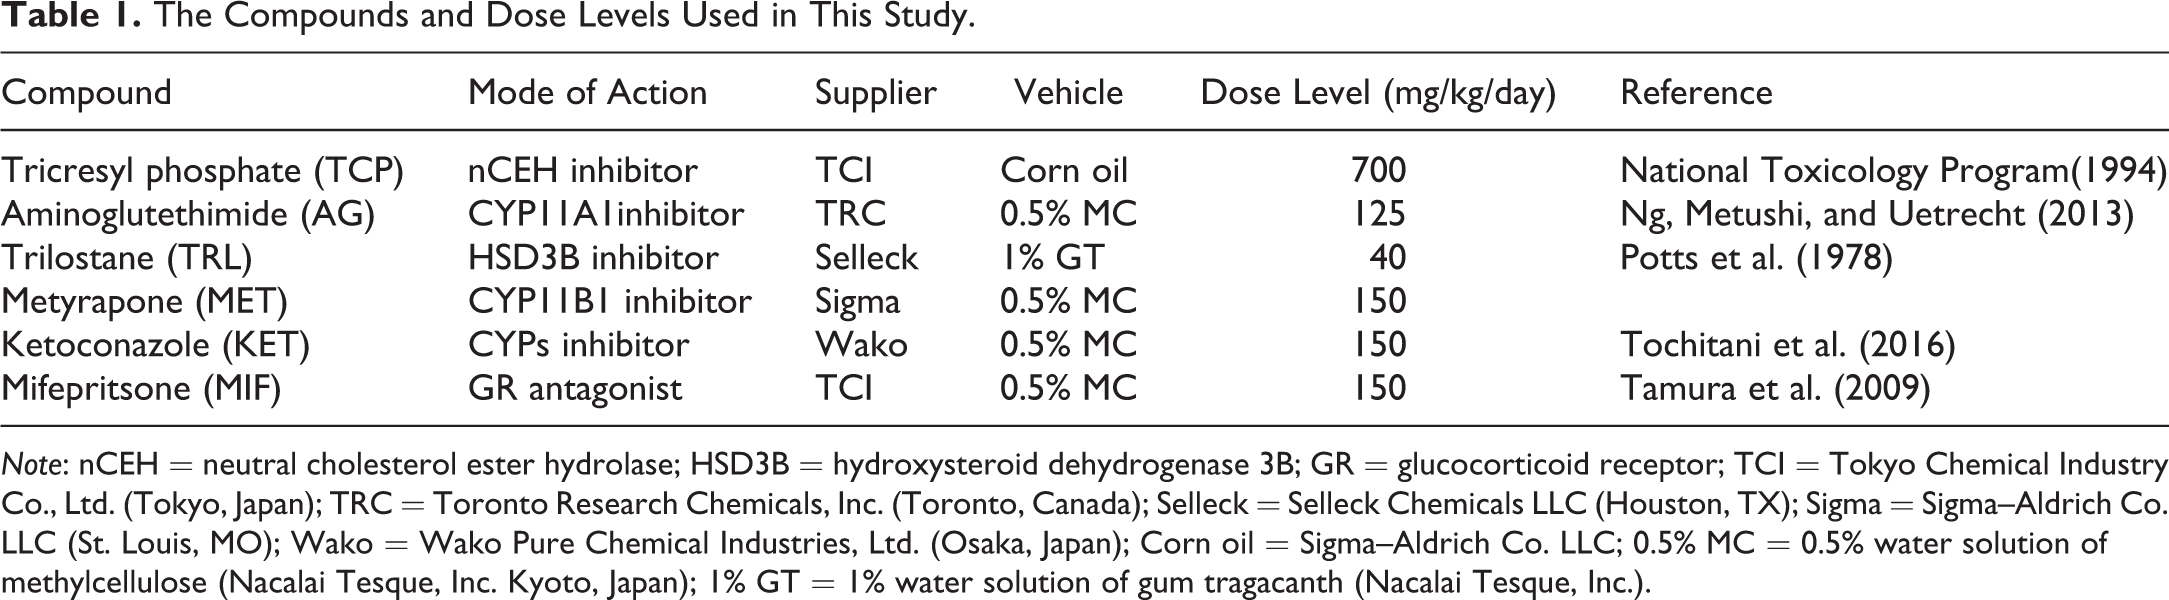
Note: nCEH = neutral cholesterol ester hydrolase; HSD3B = hydroxysteroid dehydrogenase 3B; GR = glucocorticoid receptor; TCI = Tokyo Chemical Industry Co., Ltd. (Tokyo, Japan); TRC = Toronto Research Chemicals, Inc. (Toronto, Canada); Selleck = Selleck Chemicals LLC (Houston, TX); Sigma = Sigma–Aldrich Co. LLC (St. Louis, MO); Wako = Wako Pure Chemical Industries, Ltd. (Osaka, Japan); Corn oil = Sigma–Aldrich Co. LLC; 0.5% MC = 0.5% water solution of methylcellulose (Nacalai Tesque, Inc. Kyoto, Japan); 1% GT = 1% water solution of gum tragacanth (Nacalai Tesque, Inc.).
Material and Method
Compounds
The compounds and dose levels used in this study are summarized in Table 1. The vehicles and doses levels were selected based on previous reports.
Animals and Husbandry
Animal usage was approved by the Committee for the Ethical Usage of Experimental Animals of Sumitomo Dainippon Pharma Co., Ltd. Male Sprague-Dawley (Crl:CD) rats aged 6 to 7 weeks were purchased from Charles River Laboratories Japan, Inc. (Kanagawa, Japan) and were allowed an acclimation period of more than 1 week. The animals were housed individually or 2 animals per cage in a barrier-sustained room with controlled temperature of 24°C ± 2°C, relative humidity of 55% ± 10%, and a 12-h light (8 a.m. to 8 p.m.)/dark cycle. The rats were fed commercial pellet diet (CRF-1, Oriental Yeast Co., Ltd.) and tap water ad libitum.
Animal Experiment
In each experiment, 5 rats per group were randomly assigned to vehicle and compound groups at 8 weeks of age. The animals were dosed with a compound or concurrent vehicle by oral gavage once daily around 10 a.m. for 7 days. The dosing volume was 5 ml/kg. During the dosing period, daily observation for clinical signs and mortality was performed before the dosing. Also, body weights were measured before and 2 days after the initiation of dosing and on the day of necropsy.
Six hours after the final dosing, approximately 0.5 ml of blood was sampled from the tail vein without anesthesia for steroid measurement using a syringe with a needle. Twenty-four hours after the final dosing, blood was sampled from the abdominal aorta under isoflurane anesthesia for blood chemistry, and the rats were euthanized by exsanguination and were necropsied.
At necropsy, the bilateral adrenal glands and thymus were rapidly removed, grossly examined, and weighed. The organ weight relative to body weight was calculated using the body weight recorded on the day of necropsy.
Plasma was prepared by centrifuging the blood sample using heparin and EDTA as anticoagulants for the blood chemistry and steroid measurement, respectively. The plasma was stored at −80°C until the blood chemistry and steroid measurement.
Blood Chemistry
Using the plasma sampled 24 hr after the final dosing, glucose, total cholesterol (T-Cho), triglyceride (TG), phospholipid (PL), sodium (Na), and potassium (K) were measured using an automated analyzer JCA-BM1650 (JEOL Ltd., Tokyo, Japan).
Histopathology
After the organ weight measurement, the right adrenal gland was fixed in 10% neutral-buffered formalin, embedded in paraffin, sectioned, stained with hematoxylin and eosin (HE), and examined by light microscopy.
Image Analysis
Whole images of the HE-stained adrenal sections were captured using the Aperio ScanScope AT2 at 20× objective lens magnification and were analyzed to quantify vacuolation using ImageScope software (version 12. 2. 2; Leica Biosystems Imaging Inc., Vista, CA). Image analysis was performed using the Nuclear Algorithm (version 9.1), which was adjusted to recognize vacuoles (lipid droplets) as “nuclei.” The algorithm parameters are shown in Supplemental Table 1. For each adrenal section, the entire zona fasciculata/reticularis were manually extracted as the area of analysis, and the total area of vacuoles was quantified. The ratio of the total area of vacuoles to the area of analysis was then calculated and used as the adrenal vacuolation index.
Measurement of Plasma Concentrations of Steroids
Using 50 μl of the plasma sampled 6 hr after the final dosing, plasma concentrations of corticosterone, deoxycorticosterone, progesterone, and pregnenolone were simultaneously measured, using a liquid chromatograph (Nexera, Shimadzu, Kyoto, Japan) coupled with a tandem mass spectrometer (LC–MS/MS; Triple Quad 6500, AB Sciex, Framingham, MA). Briefly, the steroids were extracted from the plasma by liquid–liquid extraction and separated by liquid chromatography with a pentafluorophenyl column. The mass spectrometer was operated in electrospray ionization positive-ion mode, and detection of the ions was performed in selected reaction monitoring mode. Water was used as artificial matrix to prepare calibration samples to make calibration curves, and rat plasma was used as authentic matrix to prepare quality control (QC) samples. As internal standards, triamcinolone acetonide or corticosterone-d8 was used for corticosterone, deoxycorticosterone-d7 or triamcinolone acetonide was used for deoxycorticosterone, and progesterone-d9 was used for progesterone and pregnenolone. The quantification range for each steroid was as follows: corticosterone, 100 to 1,000,000 pg/ml; deoxycorticosterone, 10 to 100,000 pg/ml; progesterone, 5 to 30,000 pg/ml; and pregnenolone, 100 to 100,000 pg/ml. The deviations of calculated concentrations from nominal values were within ±15% in the calibration samples and within ±25% in the QC samples.
Statistical Analysis
Group means and standard deviations of body weight, blood chemistry, organ weights, adrenal vacuolation index, and plasma steroid concentration were calculated, and each value was statistically analyzed as follows using SAS versions 9.2 or 9.3 software (SAS Institute Inc., Cary, NC). First, homogeneity of variance between the treatment groups and the concurrent vehicle control groups was tested by F test (significance level of 25%). When the variance was homogeneous, Student’s t-test was applied, and when the variance was not homogeneous, Welch’s t-test was applied. Plasma steroid concentration values below the lower limit of quantification (LLOQ) were set at LLOQ/2 and were analyzed using Wilcoxon’s test. Unless otherwise specified, two-tailed test was performed with significance level of 5%.
Results
Clinical Signs and Body Weight
Throughout the dosing period, no animal died or showed clinical signs or body weight changes, except that the KET group showed slight decrease in body weight from 2 days after the initiation of dosing.
Blood Chemistry
Table 2 shows the results of blood chemistry. T-Cho was high in the tricresyl phosphate (TCP) and aminoglutethimide (AG) groups, while it was low in the mifepristone (MIF) group. TG was low in the metyrapone (MET) and KET groups, and PL was also low in the KET and MIF group, while PL was high in the TCP group. In addition, high Na and low K were observed in the KET group. Although Na was low in the MIF group, this was thought to be an incidental change considering its minimal extent and the small variance in the MIF group.
Blood Chemistry.
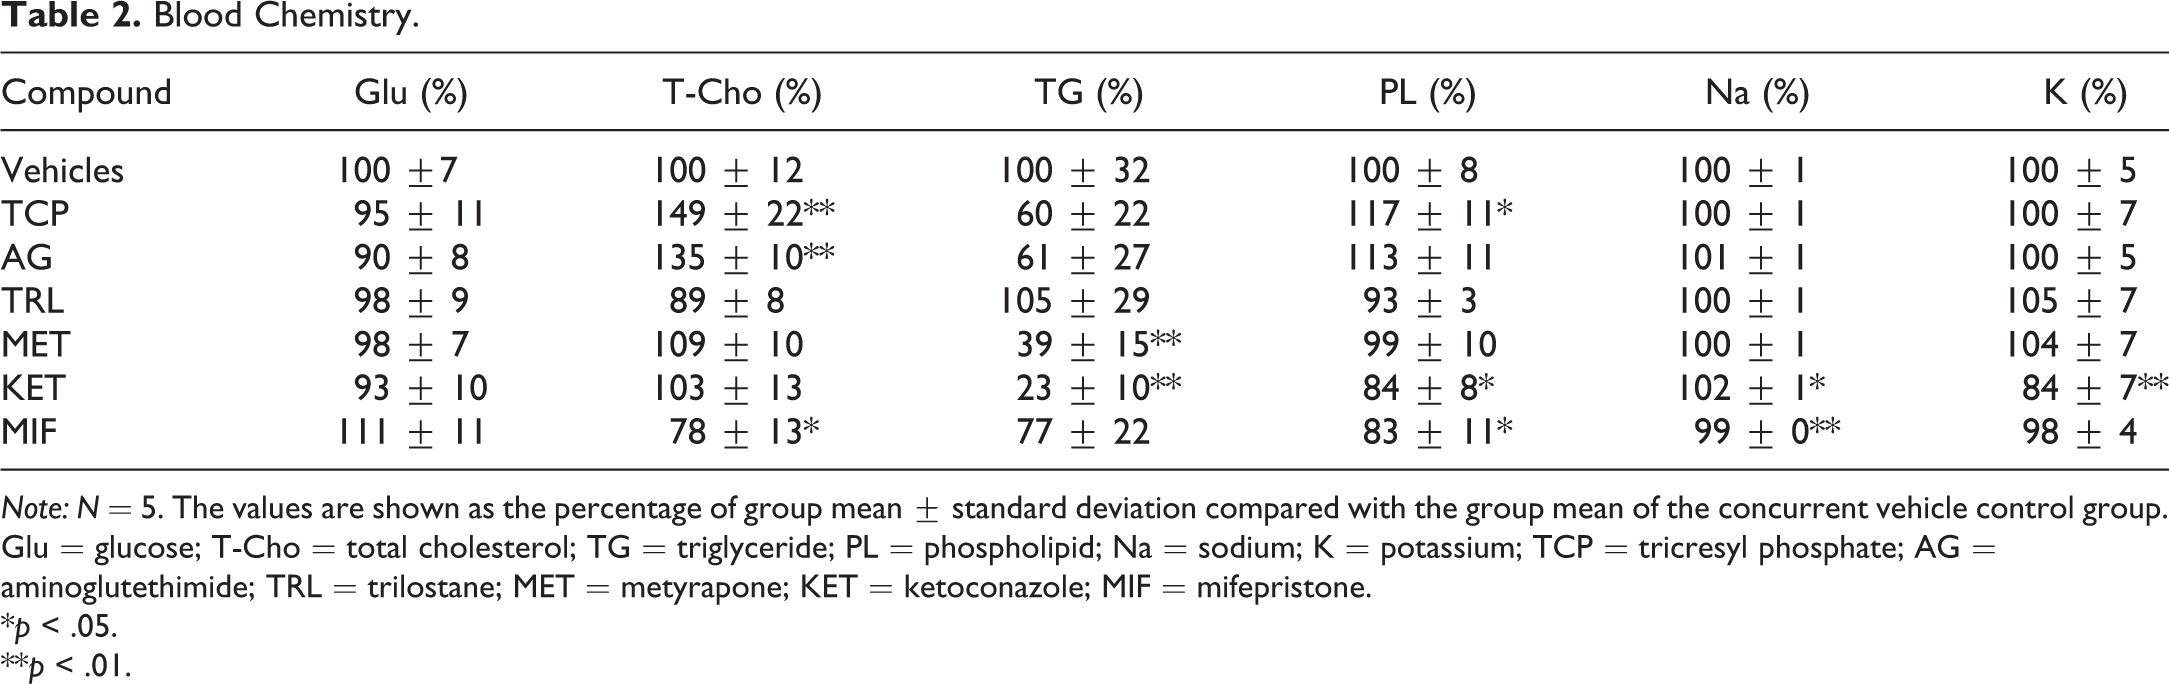
Note: N = 5. The values are shown as the percentage of group mean ± standard deviation compared with the group mean of the concurrent vehicle control group. Glu = glucose; T-Cho = total cholesterol; TG = triglyceride; PL = phospholipid; Na = sodium; K = potassium; TCP = tricresyl phosphate; AG = aminoglutethimide; TRL = trilostane; MET = metyrapone; KET = ketoconazole; MIF = mifepristone.
*p < .05.
**p < .01.
Necropsy and Organ Weights
At necropsy, the adrenal glands were pale and large in the AG and KET groups. The adrenal glands were also large in the trilostane (TRL) and MIF groups. No abnormality was seen in the TCP or MET groups.
Table 3 shows the organ weights. The adrenal weights were high except in the TCP group. No significant change was seen in the thymus weight in any group.
Body Weight and Organ Weights.
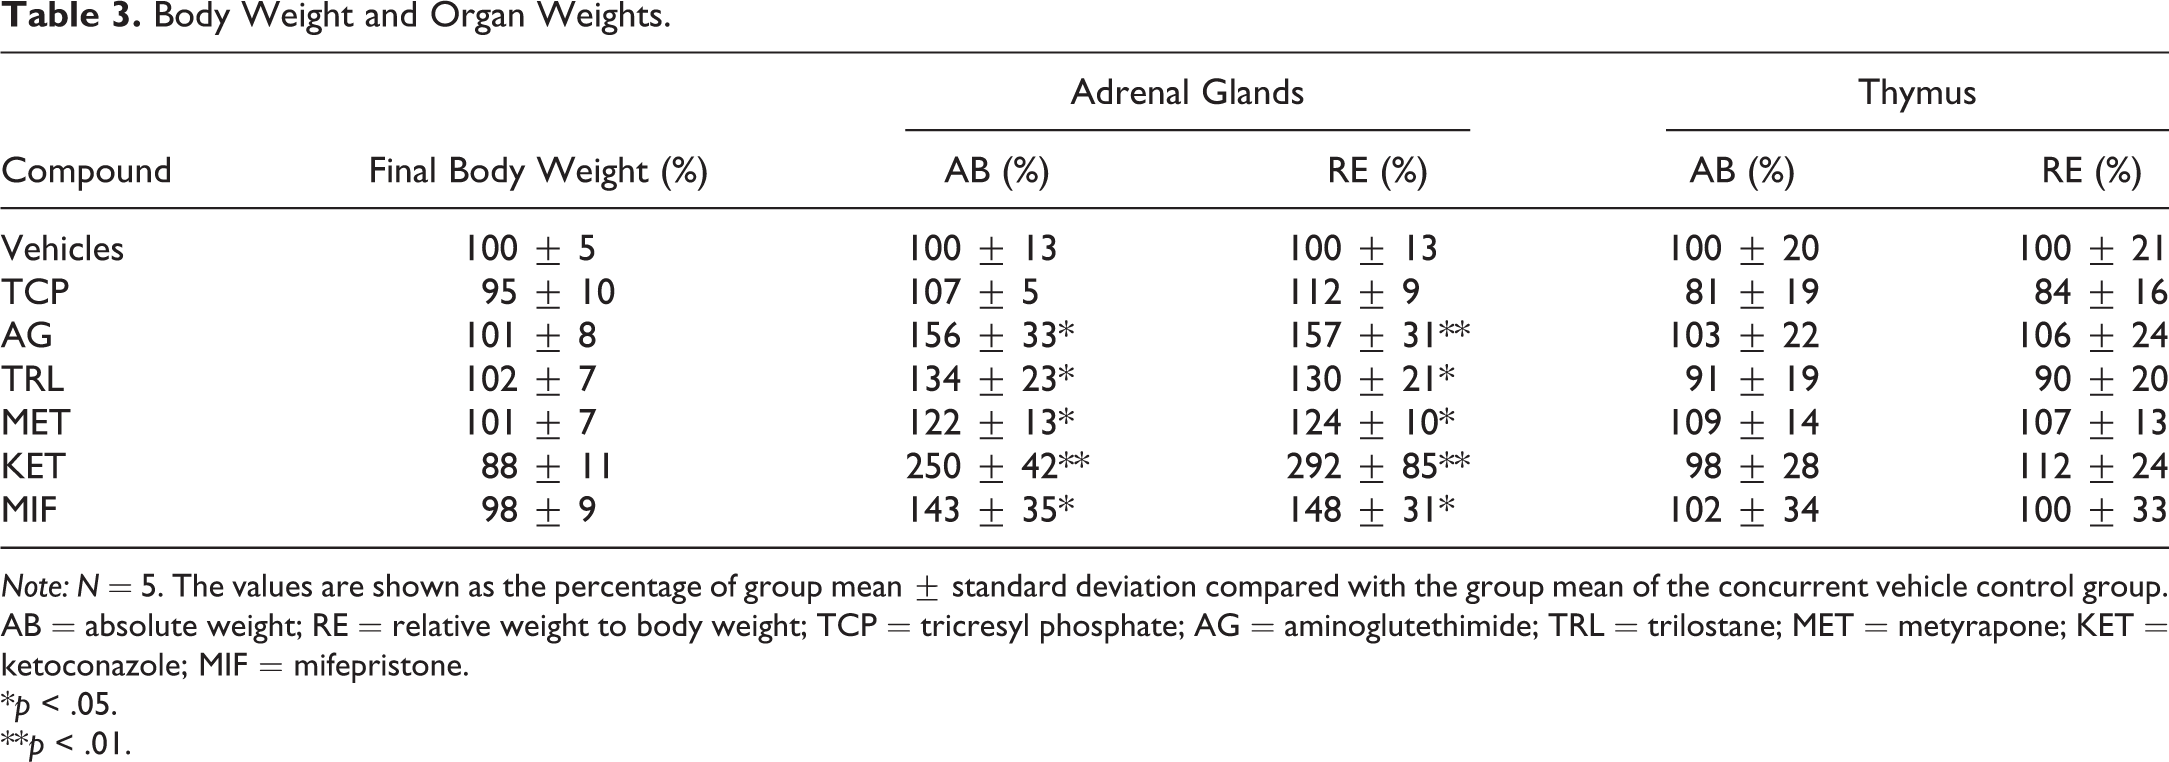
Note: N = 5. The values are shown as the percentage of group mean ± standard deviation compared with the group mean of the concurrent vehicle control group. AB = absolute weight; RE = relative weight to body weight; TCP = tricresyl phosphate; AG = aminoglutethimide; TRL = trilostane; MET = metyrapone; KET = ketoconazole; MIF = mifepristone.
*p < .05.
**p < .01.
Histopathology and Image Analysis
Figure 1 shows histopathology of the adrenal glands of the TCP and AG groups. The zona fasciculata/reticularis of the adrenal glands were vacuolated in the TCP, AG, and KET groups. The vacuolation tended to be more severe in the outer cortex than in the inner cortex. The vacuoles were generally smaller than nuclei in the TCP group, while larger vacuoles compressing nuclei were observed in the AG and KET groups. Based on their morphology, the vacuoles were thought to be lipid droplets. The vacuolation, or lipidosis, was accompanied by hypertrophy in the AG and KET groups. The zona fasciculata/reticularis were hypertrophic without vacuolation in the TRL, MET, and MIF groups. The hypertrophy was generally more obvious in the inner cortex than in the outer cortex.
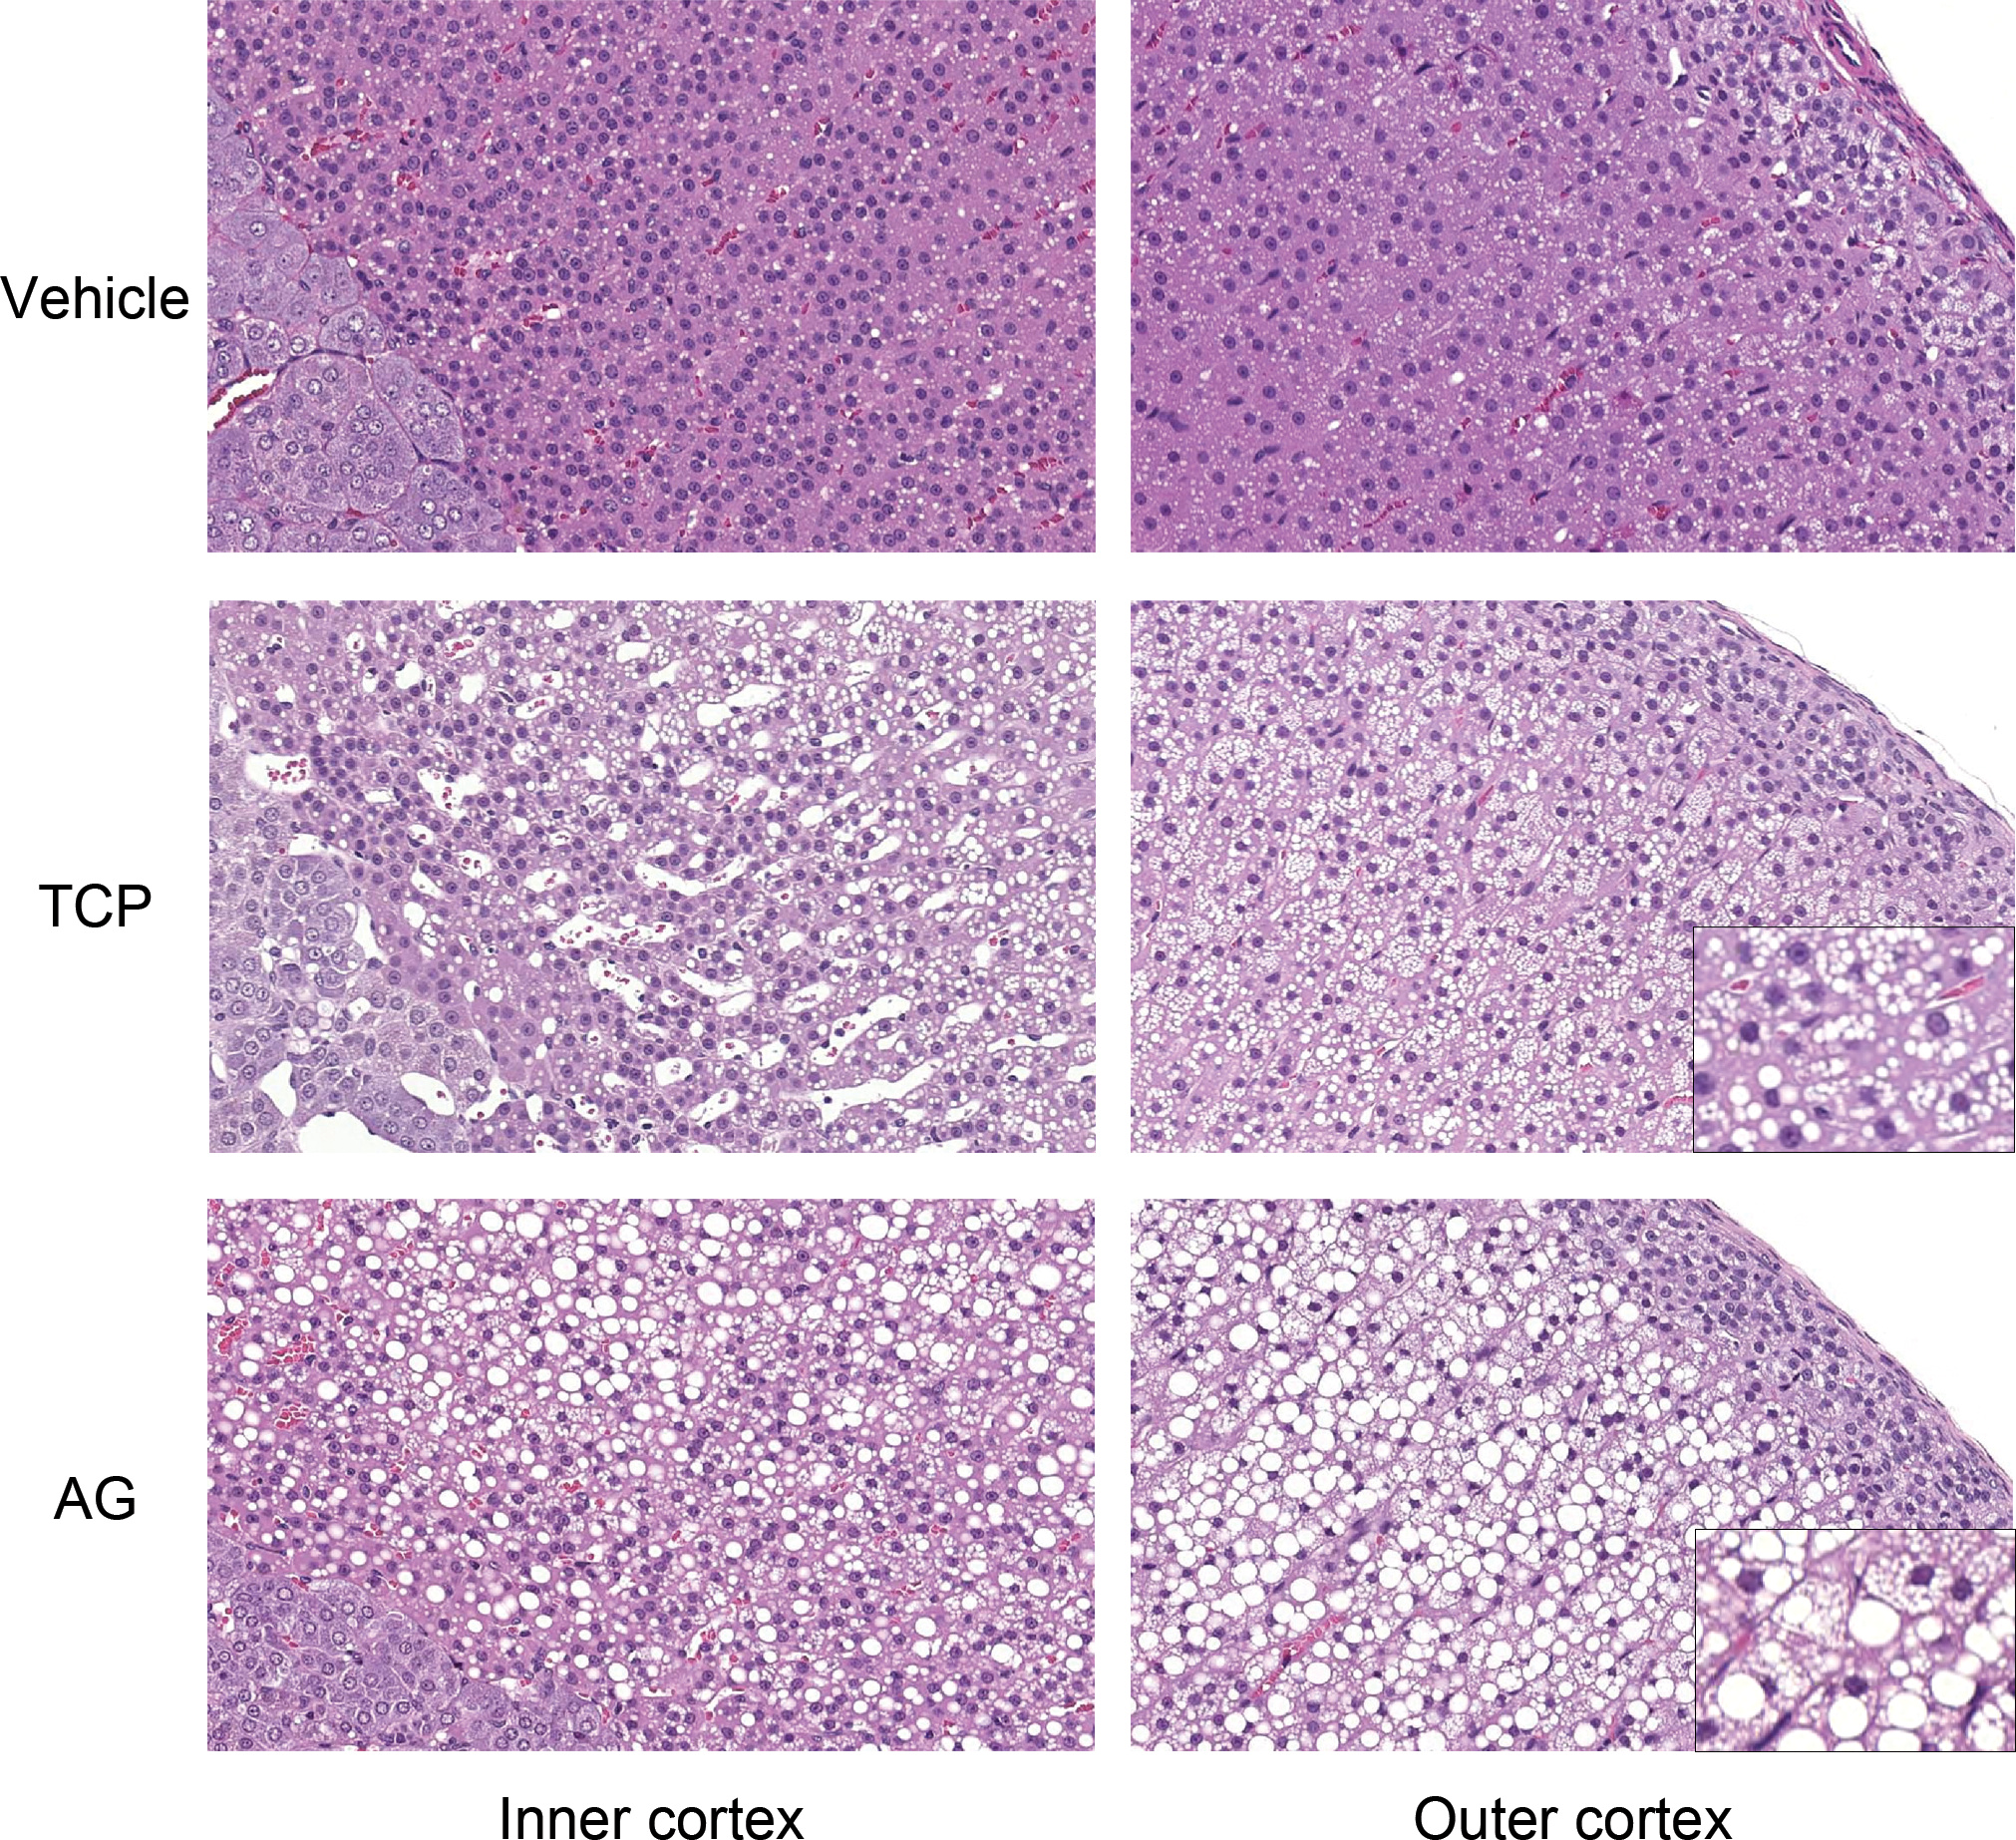
Histopathological images of the adrenal cortex of a rat from the vehicle, tricresyl phosphate (TCP), and aminoglutethimide (AG) groups (hematoxylin and eosin sections). The zona fasciculata/reticularis of the adrenal glands were vacuolated in the TCP and AG groups. The vacuolation was accompanied by hypertrophy in the AG group. The insets show higher magnifications of the affected cells.
Image analysis confirmed the vacuolation of zona fasciculata/reticularis in the TCP, AG, and KET groups (Figure 2).
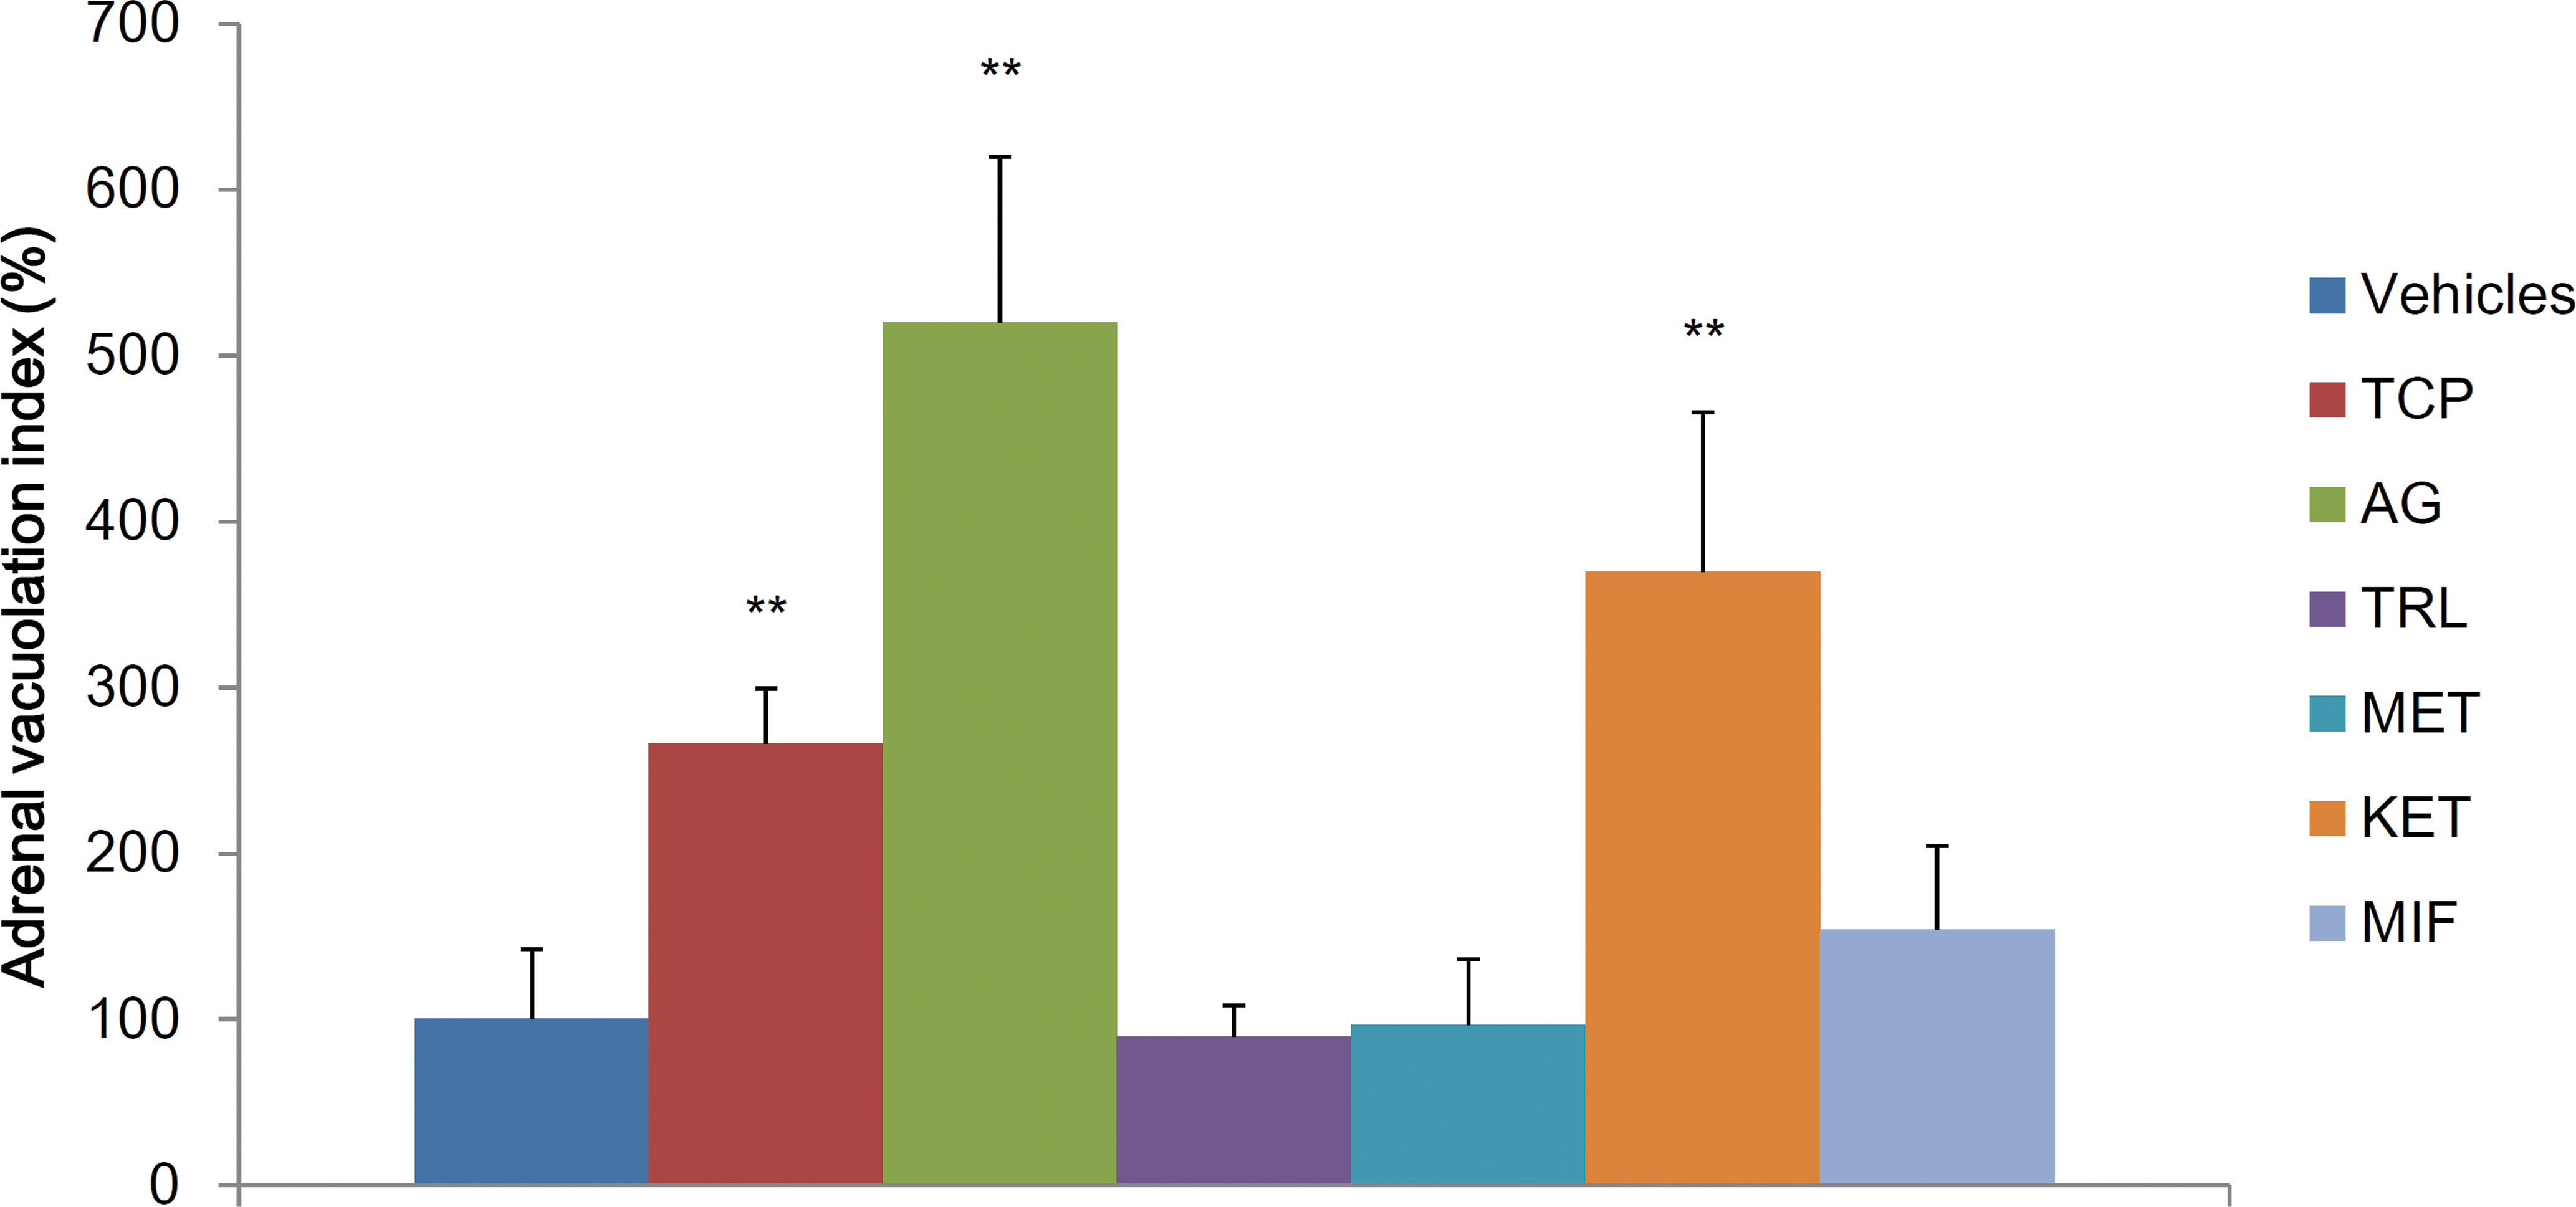
Image analysis of the vacuolation of the zona fasciculata/reticularis. The data are shown as the percentage of group mean ± standard deviation compared with the group mean of the concurrent vehicle control group (n = 5/group). Asterisk indicates statistically significant difference from the vehicle control (**p < .01).
Plasma Concentrations of Steroids
Figure 3 shows changes in plasma concentrations of corticosterone and its precursors. Levels of pregnenolone in the TRL group and deoxycorticosterone in the MET and KET groups were more than 30 times higher than in the vehicle group. Progesterone was also high in the TRL and MET groups, though the extent was smaller than that of the above steroids. There were no significant changes in corticosterone.
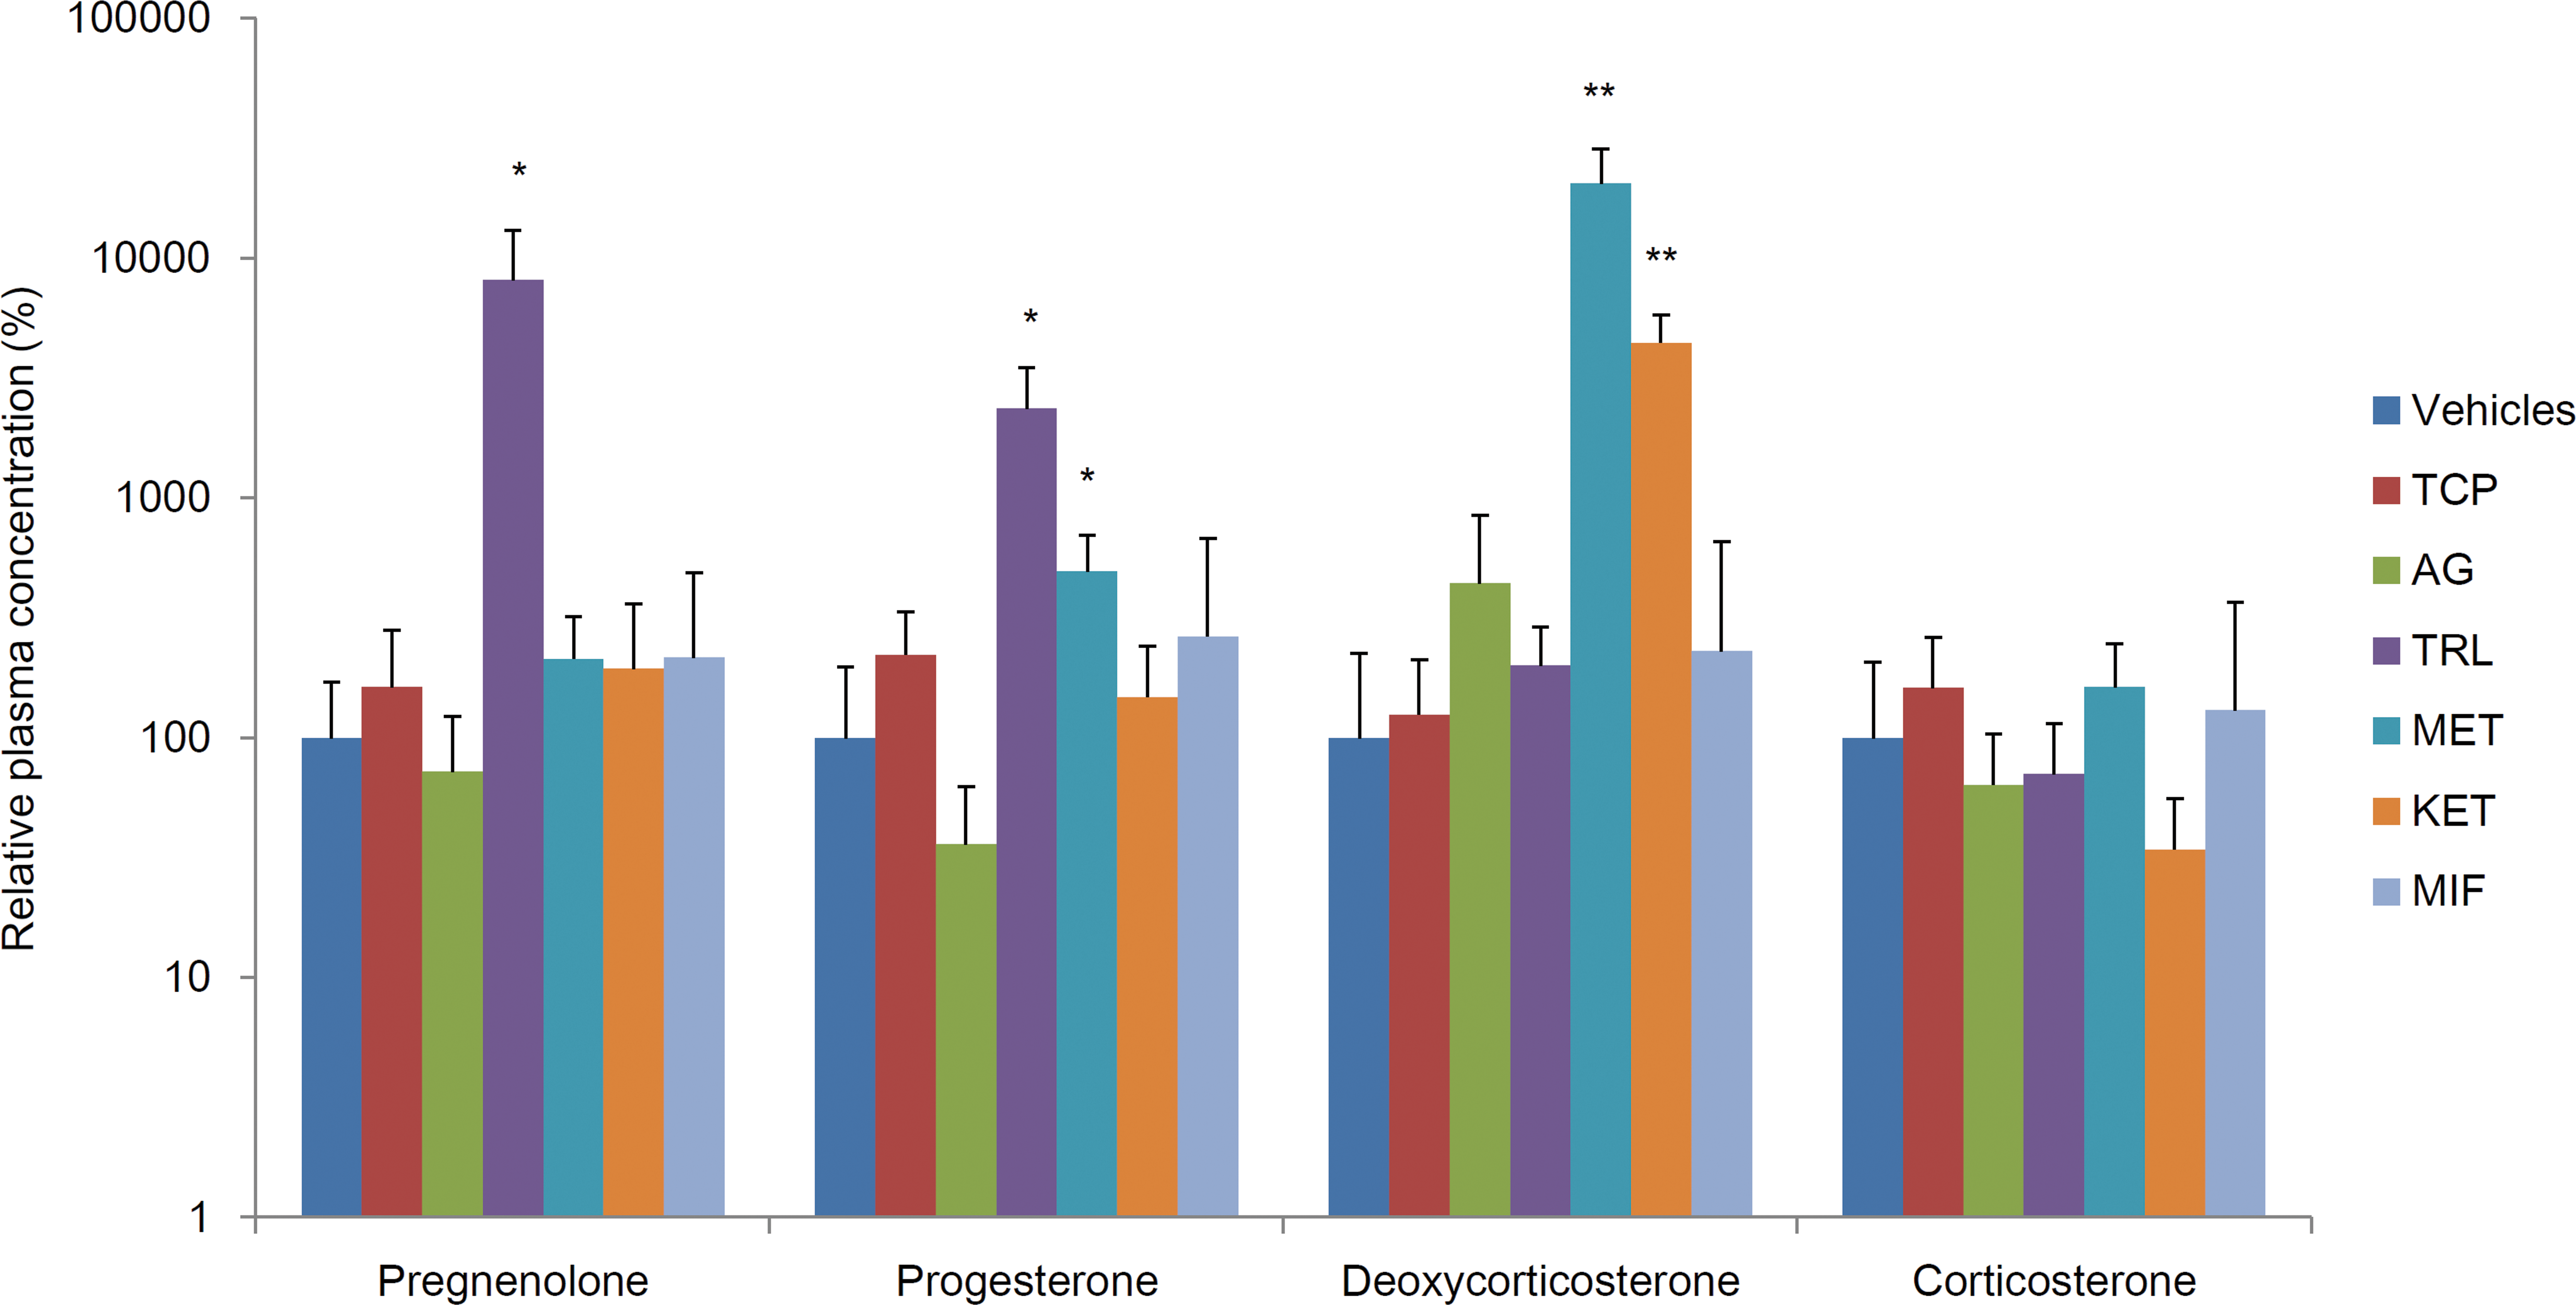
Changes in plasma concentrations of corticosterone and its precursors. The data are shown as the percentage of group mean ± standard deviation compared with the group mean of the concurrent vehicle control group (n = 5/group). Asterisk indicates statistically significant difference from the vehicle control (*p < .05; **p < 0.01).
Discussion
In this study, we examined the changes in plasma concentrations of corticosterone and its precursors in rats dosed with various compounds that affect adrenal steroidogenesis. The modes of action of the compounds are shown in Figure 4, with the steroidogenic pathway in the rat adrenal gland. Unlike human adrenals, rat adrenals lack CYP17 (cytochrome P450c17) expression and synthesize corticosterone as the major glucocorticoid (Hanukoglu 1992; Hinson and Raven 2006), from cholesterol in the zona fasciculata and zona reticularis. In rats, cholesterol is mainly supplied by neutral cholesterol ester hydrolase (nCEH)-mediated hydrolyzation of cholesterol ester, which is derived from plasma high-density lipoprotein (HDL) or stored in lipid droplets (Latendresse et al. 1993; Nishizato et al. 2014; Wickramaratne et al. 1998). Uptake of cholesterol from HDL is upregulated by ACTH (Gwynne et al. 1976). Cholesterol is first metabolized to pregnenolone by CYP11A1 (cytochrome P450 11A1), next to progesterone by hydroxysteroid dehydrogenase 3B (HSD3B), then to deoxycorticosterone by CYP21 (cytochrome P450c21), and finally to corticosterone by CYP11B1 (cytochrome P450 11B1; Harvey and Sutcliffe 2010; Rosol et al. 2001).
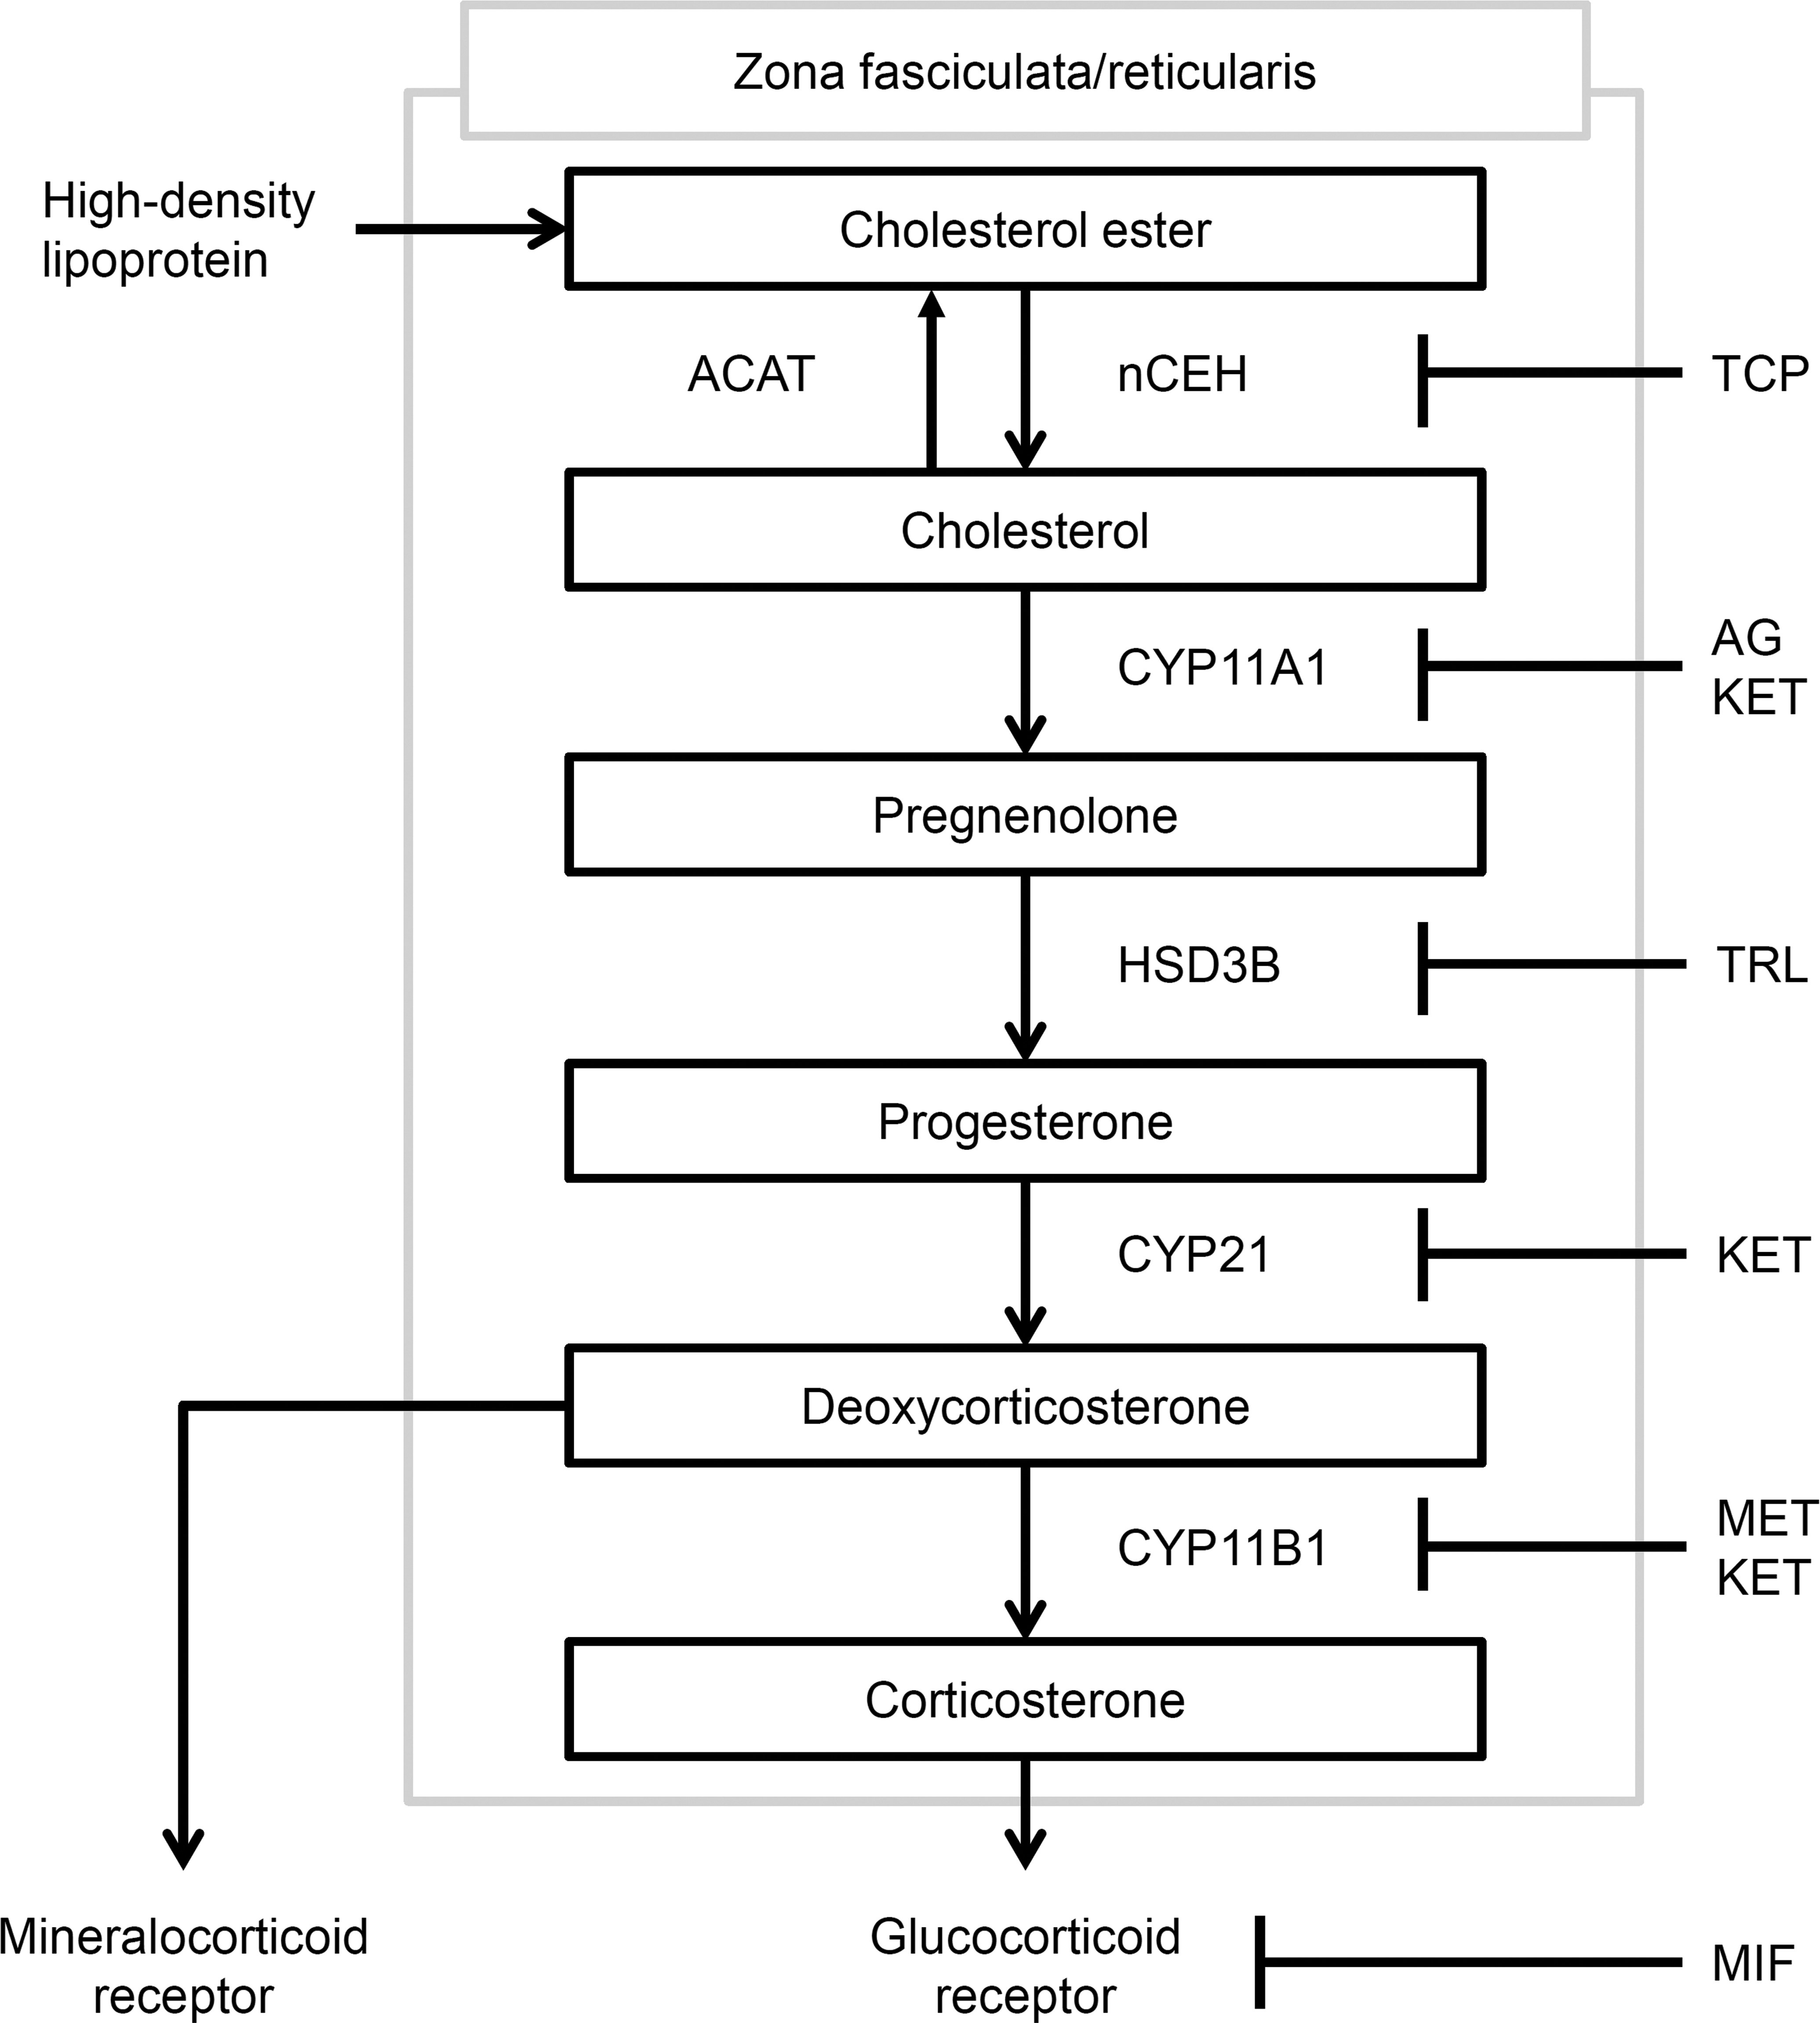
The steroidogenic pathway in the rat adrenal gland. The modes of action of the compounds used in this study are also shown. ACAT: acyl-coenzyme A: cholesterol acyltransferase.
The results are summarized in Table 4. It is well-known that adrenal changes can be observed as nonspecific, chronic stress responses. However, in the present study, though the final body weight was slightly low in the KET group, there were no clinical signs or significant changes in the thymus weight, which is easily decreased under stress conditions (Elmore 2012; Harvey and Sutcliffe 2010). Therefore, it was thought to be unlikely that the adrenal changes were caused by a stress response.
Summary of the Results.
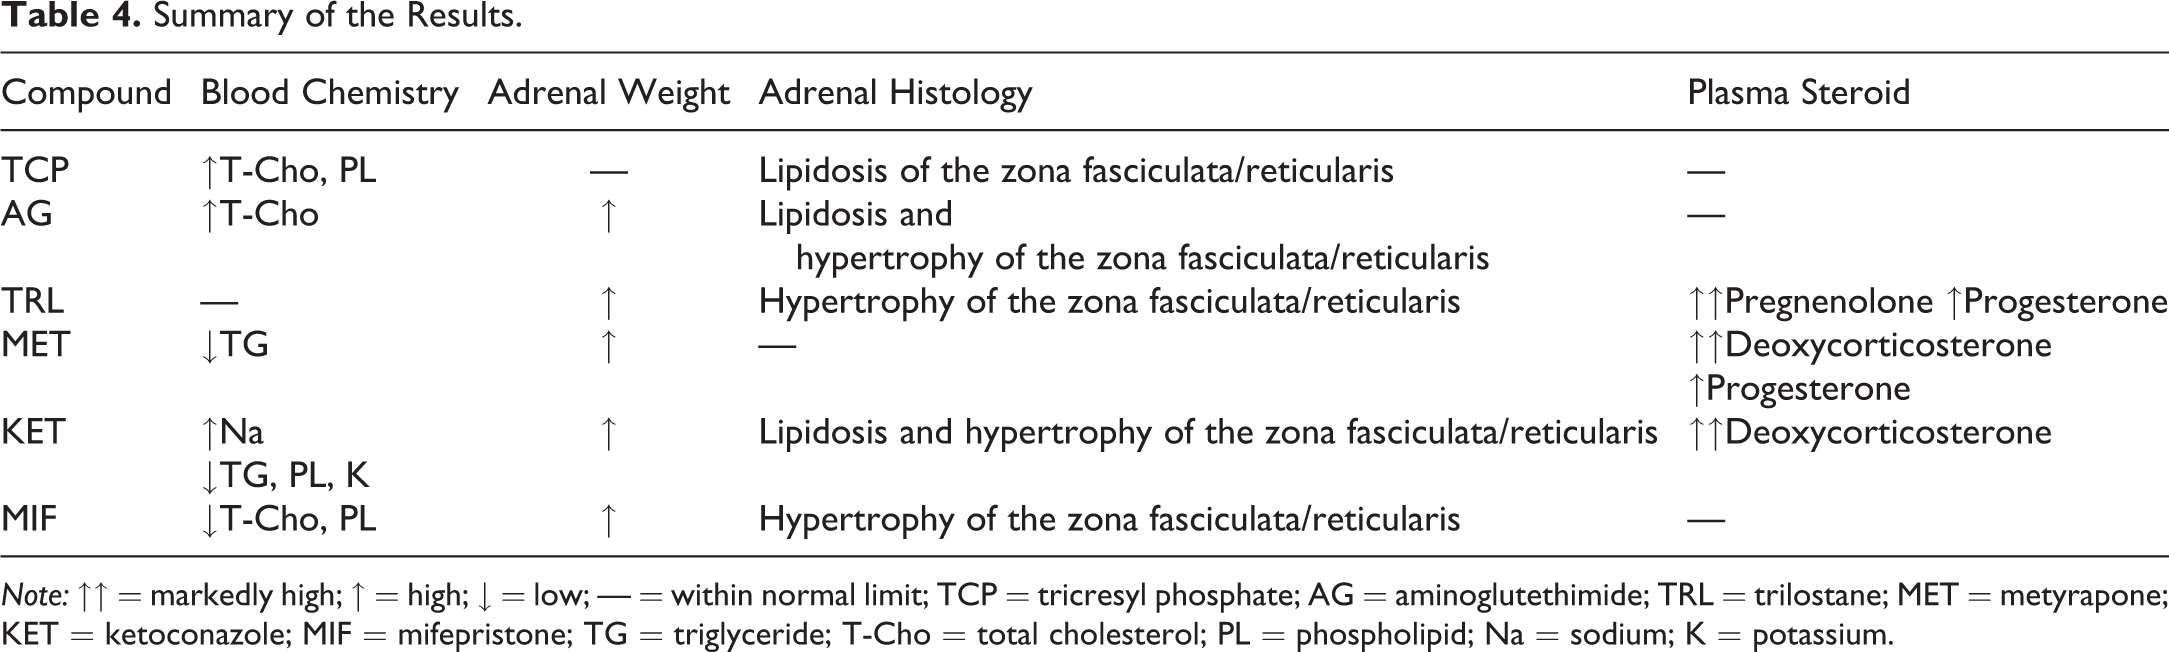
Note: ↑↑ = markedly high; ↑ = high; ↓ = low; — = within normal limit; TCP = tricresyl phosphate; AG = aminoglutethimide; TRL = trilostane; MET = metyrapone; KET = ketoconazole; MIF = mifepristone; TG = triglyceride; T-Cho = total cholesterol; PL = phospholipid; Na = sodium; K = potassium.
In the TCP group, there were no changes in steroid levels, but lipidosis (vacuolation) of the adrenal gland was observed. TCP has been reported to increase cholesterol ester concentration in the rat adrenal gland (Latendresse et al. 1993). Thus, the lipidosis was thought to be caused by accumulation of cholesterol ester. Also, T-Cho and PL were high in the TCP group. Increased T-Cho has also been reported in mice deficient in hormone-sensitive lipase (HSL), the major nCEH in the adrenal gland (Li et al. 2002), and this was thought to be caused by inhibited cholesterol metabolism. T-Cho includes (free) cholesterol and cholesterol ester, and based on the mode of action of TCP, it was suspected that cholesterol ester was especially affected. However, both blood cholesterol and cholesterol ester levels were high to the same extent (data not shown). In the TCP group, there were no changes in the adrenal weights, and hypertrophy was not observed. It has been reported that TCP did not cause changes in corticosterone level in rats (Latendresse, Brooks, and Capen 1995), and it has been speculated that this is because even when nCEH is inhibited, newly synthesized cholesterol can be used for steroid synthesis (Rosol et al. 2001). Also, it has been reported that in HSL-deficient mice, there were no significant changes in corticosterone level from wild-type mice, except after ACTH administration (Li et al. 2002). Therefore, it was suspected that the effect of nCEH inhibition alone on corticosterone synthesis is weak and does not easily lead to compensatory changes such as hypertrophy.
In the AG group, the changes in steroid levels were not obvious, but adrenal lipidosis was observed. It has been reported that AG increased concentration of cholesterol and cholesterol ester in the rat adrenal gland (Szabó, Gláz, and Kelemen 1974). Thus, the lipidosis was thought to be caused by accumulation of cholesterol and/or cholesterol ester. Increased T-Cho in the blood chemistry was thought to be caused by inhibited cholesterol metabolism. Unlike the TCP group, the lipidosis was accompanied by hypertrophy in the AG group, as seen in lipoid congenital adrenal hyperplasia in humans (Bose et al. 1996).
In the TRL group, plasma concentration of pregnenolone was markedly high, as reported previously (Potts et al. 1978). Increase in pregnenolone is a hallmark of HSD3B deficiency in humans (Cavanah and Dons 1993). Thus, the high pregnenolone level was thought to be due to HSD3B inhibition by TRL. Unexpectedly, progesterone level was also high in the TRL group, though the extent was smaller than that of pregnenolone. It is known that in HSD3B2 deficiency in humans, increased level of 17-hydroxyprogesterone can be observed, and this is thought to be due to synthesis from increased 17-hydroxypregnenolone by spared activity of HSD3B1, mainly in the liver (Miller and Auchus 2011). Thus, the increased level of progesterone in this study may be due to synthesis from accumulated pregnenolone, because of short half-life and competitive, reversible effect of TRL on HSD3B (McGee and Shaw 1992; Potts et al. 1978), or spared activity of HSD3B2, on which the effect of TRL is weaker than that on HSD3B1 (Thomas, Bucholtz, and Kacsoh 2011). Also, increased weights and hypertrophy of the adrenal glands were observed, and they were thought to be compensatory changes to the disrupted steroidogenesis.
In the MET and KET groups, the plasma concentration of deoxycorticosterone was markedly high. This was consistent with previous studies (Tochitani et al. 2016; Colby, Skelton, and Brownie 1970). Increased deoxycorticosterone is a hallmark of CYP11B1 deficiency in humans (New 2004) and in mice (Mullins et al. 2009). Thus, the increase in deoxycorticosterone was thought to be caused by CYP11B1 inhibition. The cause of the high progesterone level in the MET group was uncertain. In blood chemistry, high Na and low K were observed in the KET group. Although they were not observed in the MET group in the present study, similar changes have been reported in rats treated twice daily with MET (Colby, Skelton, and Brownie 1970). Also, it is known that hypertension and hypokalemia are observed in humans with CYP11B1 deficiency, and they are attributed to increased deoxycorticosterone, which has mineralocorticoid activity (Vinson 2011). Thus, the electrolyte changes are probably due to increased deoxycorticosterone. The cause of low TG and/or PL was unknown. Histopathologically, lipidosis and hypertrophy of the adrenal gland were observed in the KET group, as seen in the AG group. On the other hand, in the MET group, though the adrenal weights were high and hypertrophy was suggested, lipidosis was not observed. It has been reported that in CYP11B1 deficient mice (Mullins et al. 2009) and in rats treated with other CYP11B1 inhibitor osilodrostat (Li et al. 2015), adrenal hypertrophy is observed without lipidosis. Thus, it can be speculated that CYP11B1 inhibition alone does not generally lead to lipidosis, and the lipidosis observed in the KET group was due to the inhibition of other CYPs such as CYP11A1 (Johansson, Sanderson, and Lund 2002).
In the MIF group, the changes in plasma steroid levels were not obvious. However, hypertrophy of the zona fasciculata/reticularis was observed, consistent with a previous report (Tamura et al. 2009). The hypertrophy, as well as low T-Cho, was thought to be a compensatory change to the antagonistic effect on the glucocorticoid receptor. The cause of low PL was unknown.
Overall, the changes in the precursor steroid levels were more dynamic than in the corticosterone level. In the cases of HSD3B inhibitor TRL, and CYP11B1 inhibitors MET and KET, simultaneous measurement of plasma steroids revealed marked increase in precursor levels. In contrast, there were no significant changes in the plasma corticosterone level, and this was thought to be partly due to its wide interindividual variability. It is known that the basal level of blood corticosteroid is not a sensitive marker for impaired adrenal steroidogenesis (Hinson and Raven 2006; Yarrington and Reindel 1996). Thus, it was shown in this study that at least for HSD3B and CYP11B1 inhibitors, the precursors are more sensitive than corticosterone to evaluate the effect of compounds on adrenal steroidogenesis. Although not examined in this study, similar increase in precursor steroids can be expected for CYP21 inhibitors, considering the increased blood progesterone level reported in CYP21-deficient mice (Gotoh et al. 1988). In addition, though only male rats were used in this study, similar changes in plasma steroid levels can be expected in female rats too; however, the interpretation may be confounded by the effect of estrus cycle. Furthermore, considering the similarity of the adrenal steroidogenic pathway between humans and rats except the lack of CYP17 expression in the latter, changes in rats would be easily translated to humans.
Also, the changes in the plasma steroid levels reflected the modes of action of the compounds. The precursor steroids with markedly increased levels were those that are normally metabolized by the inhibited enzymes. In addition, different patterns of changes were observed in blood chemistry and histopathology. Thus, the pattern of changes in plasma steroid levels can provide insight into the underlying mechanisms of the adrenal effect, and the suggested mechanism will be supported by other toxicological parameters such as blood chemistry and histopathology. Image analysis such as used here will improve the objectivity of histopathology and help the detection of subtle changes. In the cases of nCEH inhibitor TCP and CYP11A1 inhibitor AG, lipidosis of the zona fasciculata/reticularis was characteristically observed, with or without hypertrophy, and was accompanied by increased blood lipid, but plasma steroid changes were not obvious. In these cases, other methods would be needed to monitor the effect on adrenal steroidogenesis. Also, in cases like MIF, in which hypertrophy of the zona fasciculata/reticularis is observed without lipidosis or plasma steroid changes, the presence of body weight changes, clinical signs, or thymus atrophy should be considered to differentiate from nonspecific, stress-related changes (Harvey and Sutcliffe 2010).
Since the measurement method of plasma steroid levels was very sensitive, the sample volumes needed were very small (50 μl of plasma). Therefore, we could use blood samples from the tail vein, which is a suitable method for repeated blood collection. The changes in steroid levels were clearly detected using plasma sampled from the tail vein in this study, though blood sampling for adrenal steroid measurement is commonly done by decapitation (Colby, Skelton, and Brownie 1970) or by cardiac puncture (Latendresse, Brooks, and Capen 1995). Thus, measurement at several time points in one animal and incorporation into general toxicity study would be relatively easy, leading to a reduction in animal use.
In conclusion, simultaneous measurement of plasma steroids, including precursors, can be a valuable method to sensitively evaluate drug effects on adrenal steroidogenesis and to investigate the underlying mechanisms.
Footnotes
Acknowledgments
We wish to thank Kaori Kunito, Yumi Tateishi, and Izuru Mise for their excellent histotechnical work, Chikako Horike for her contract management work, members of Preclinical Research Laboratories at Sumitomo Dainippon Pharma Co., Ltd. (Osaka, Japan) for conducting the animal experiments, and members of Sumika Chemical Analysis Service, Ltd. (Osaka, Japan) for the measurement of plasma concentrations of the steroids.
Authors’ Contribution
Authors contributed to conception or design (TT, AY, IMi, TY), data acquisition, analysis, or interpretation (TT, AY, IM, MK, YF, IMi, TY, KB); drafted the manuscript (TT); and critically revised the manuscript (AY, IM, MK, YF, IMi, TY, KB). All authors gave final approval and agreed to be accountable for all aspects of work in ensuring that questions relating to the accuracy or integrity of any part of the work are appropriately investigated and resolved.
Declaration of Conflicting Interests
The author(s) declared no potential conflicts of interest with respect to the research, authorship, and/or publication of this article.
Funding
The author(s) received no financial support for the research, authorship, and/or publication of this article.
Supplementary Material
Supplementary material for this article is available online.
References
Supplementary Material
Please find the following supplemental material available below.
For Open Access articles published under a Creative Commons License, all supplemental material carries the same license as the article it is associated with.
For non-Open Access articles published, all supplemental material carries a non-exclusive license, and permission requests for re-use of supplemental material or any part of supplemental material shall be sent directly to the copyright owner as specified in the copyright notice associated with the article.