
Abstract
Clofibrate is a known rodent hepatotoxicant classically associated with hepatocellular hypertrophy and increased serum activities of cellular alanine aminotransferase/aspartate aminotransferase (ALT/AST) in the absence of microscopic hepatocellular degeneration. At toxic dose, clofibrate induces liver and skeletal muscle injury. The objective of this study was to assess novel liver and skeletal muscle biomarkers following clofibrate administration in Wistar rats at different dose levels for 7 days. In addition to classical biomarkers, liver injury was assessed by cytokeratin 18 (CK18) cleaved form, high-mobility group box 1, arginase 1 (ARG1), microRNA 122 (miR-122), and glutamate dehydrogenase. Skeletal muscle injury was evaluated with fatty acid binding protein 3 (Fabp3) and myosin light chain 3 (Myl3). Clofibrate-induced hepatocellular hypertrophy and skeletal muscle degeneration (type I rich muscles) were noted microscopically. CK, Fabp3, and Myl3 elevations correlated to myofiber degeneration. Fabp3 and Myl3 outperformed CK for detection of myofiber degeneration of minimal severity. miR-122 and ARG1 results were significantly correlated and indicated the absence of liver toxicity at low doses of clofibrate, despite increased ALT/AST activities. Moreover, combining classical and novel biomarkers (Fabp3, Myl3, ARG1, and miR-122) can be considered a valuable strategy for differentiating increased transaminases due to liver toxicity from skeletal muscle toxicity.
Clofibrate belongs to the first class of hypolipidemic agents and acts as an agonist of the peroxisome proliferator–activated receptor α (PPAR-α). It is well established that long-term administration of clofibrate or other peroxisome proliferators (PPs) results in liver tumors in rodents (Hartig et al. 1982). In humans, PPs and also statins may cause myopathy and rhabdomyolysis (Lane and Mastaglia 1978; Hodel 2002; Thompson, Clarkson, and Karas 2003). In comparison, in rats, subacute or chronic administration of clofibrate induces specific skeletal muscle degeneration and classical liver hypertrophy, with a mild increase in liver enzymes like alanine aminotransferase (ALT) and aspartate aminotransferase (AST). This occurs either with or without microscopic hepatocellular degeneration depending on the administered doses (Kramer et al. 2003; Okada et al. 2007, 2009; Ennulat et al. 2010; Hall et al. 2012).
Identification of liver toxicity associated with mild increases in ALT and AST remains challenging, especially in the absence of microscopic hepatocellular damage. Moderately higher serum ALT levels, especially in mice treated with liver enzyme inducers, might occur without cell membrane damage (Hall et al. 2012). Moreover, concomitant skeletal muscle degeneration may also influence the ALT and AST serum values. Increased ALT and AST activities following muscle injury in humans (Nathwani et al. 2005) and animals (Boyd 1983) have been described. Therefore, in addition to creatine kinase (CK), AST is commonly used to assess striated muscle injury in animals. However, the diagnostic power of CK and AST in preclinical toxicity studies is limited. AST is not skeletal muscle specific while CK has a short half-life in rats and is mostly present in type II myofibers (Hoffmann, Wilson, and Solter 1999). Therefore, a sensitive biomarker of specific (type I/II) skeletal muscle injury is needed (Boyd 1988). Oxidative injury (increased β-oxidation) may play a role in fibrate-related skeletal muscle injury (Pettersen et al. 2012). Fibrates induce pyruvate dehydrogenase kinase 4 activation, which is marked in the liver as well as skeletal muscle tissue and leads to enhanced fatty acid oxidation and to hepatocyte or myofiber potential injury (Motojima 2000). Fibrates may also elicit mitochondrial dysfunction, which could play a role in fibrates-induced myopathy (Brunmair et al. 2004).
Clinical and preclinical evaluations of additional liver or skeletal muscle are ongoing. Recent publications, in the context of drug-induced liver injury (DILI), identified microRNA-122 (miR-122), high-mobility group box 1 (HMGB1), cytokeratin 18 (CK18, both caspase cleaved and full length), arginase 1 (ARG1), and glutamate dehydrogenase (GLDH) as sensitive markers of hepatotoxicity in humans or animals (Antoine et al. 2009; Wang et al. 2009; Hornby et al. 2014). HMGB1 is a chromatin component that passively leaks from cells when the integrity of membranes is lost during necrosis (Scaffidi, Misteli, and Bianchi 2002). CK18 is one of the intermediate filaments expressed by epithelial cells and its cleavage by caspases occurs during apoptosis (Caulin, Salvesen, and Oshima 1997). Full-length CK18 is released passively in the blood during necrotic cell death, while cleaved CK18 is generated in the blood during apoptosis (Schutte et al. 2004). To our knowledge, CK8 and CK19 are the two major cytokeratins expressed in mature striated muscle in adult rodents, while CK18 is not expressed at significant levels (Kosmehl, Langbein, and Katenkamp 1990; O’Neill et al. 2002; Ursitti et al. 2004; Stone et al. 2005). Therefore, CK18 can be considered a potential biomarker for the evaluation of hepatocellular injury in rats.
GLDH, a key enzyme in amino acid oxidation and urea production, is a relatively liver-specific enzyme located in the mitochondrial matrix. GLDH is present in tissues containing matrix-rich mitochondria, such as liver, as opposed to tissues containing cristae-rich mitochondria like skeletal and cardiac muscle (Schmidt and Schmidt 1988). GLDH activity is higher in the centrilobular region than in the periportal zone (O’Brien et al. 2002). Recent publications evaluated miR-122 as a potential new biomarker of hepatotoxicity when combined with ALT, AST, and GLDH in rat toxicology studies (Starckx et al. 2013; Sharapova et al. 2016). MicroRNAs are small (21–22 nucleotides size) regulatory RNA molecules. They modulate the activity of specific messenger RNA targets and have important roles in several physiologic and pathologic processes. miR-122 is considered to be a liver-specific biomarker of hepatocellular damage (Filipowicz and Grosshans 2011). ARG1, being highly abundant in liver cytosol, has a critical function in the mammalian liver as the final enzyme in the urea cycle. ARG1 in rat liver presents the most intense staining around the portal vein, with a gradual decrease up to the central vein. ARG1 was described to be sensitive in detecting single-cell necrosis in the absence of more severe hepatocellular degeneration in rats (Bailey et al. 2012) and is not increased in the presence of skeletal muscle degeneration (Saitoh et al. 2014).
CK is the standard biomarker for assessing skeletal muscle injury in clinical and preclinical studies and shows higher activity in type II compared to type I skeletal muscles (Burtis et al. 2012). Skeletal muscles composed primarily of type I fibers (e.g., diaphragm or soleus) have the highest concentration of fatty acid binding protein 3 (Fabp3), a novel heart and skeletal muscle biomarker. Fabp3, a small cytoplasmic protein (14.5 kDa), has a permissive role in transport and mobilization of fatty acids at the cellular level and binds fatty acids with high affinity. Fabp3 has been previously evaluated as a skeletal muscle biomarker in rats (Pritt et al. 2008; Burch et al. 2016). Myosin light chain 3 (Myl3) is an essential light chain of the myosin molecule expressed mainly in cardiac and skeletal muscle and heavily expressed in type I skeletal muscle (Berna et al. 2007). Myl3 has also been investigated as a specific heart and skeletal muscle biomarker in humans (Sorichter et al. 1998) and rats (Periasamy et al. 1989; Pritt et al. 2008).
In the present study, we investigated liver and skeletal muscle biomarkers following clofibrate administration in Wistar rats. We chose clofibrate to induce muscle injury because slow-twitch type 1 oxidative fibers are especially sensitive to clofibrate- or PPAR-α-mediated toxicity (De Souza et al. 2006; Pritt et al. 2008). A panel of additional biomarkers (CK18 cleaved form, HMGB-1 total form, ARG1, miR-122, and GLDH) was used to assess the effect of clofibrate on liver tissue in addition to AST and ALT. Clofibrate-induced skeletal muscle changes were also evaluated with Fapb3 and Myl3 in addition to CK. The specificity and sensitivity of Fabp3 and Myl3 levels were compared to CK and correlated to the histopathologic scoring of skeletal muscle degeneration.
Material and Method
Chemicals
Clofibrate (CAS: 637-07-0) purchased from TCI America (Portland, OR) was suspended in 0.5% methylcellulose and 0.1% polysorbate 80 (v/v) in water. A correction factor of 1.14 was taken into consideration for correction of the relative density.
Animals
Purpose-bred male Han WIST (Wistar)/HanRCCWIST (specific pathogen free) rats aged approximately 10–12 weeks were purchased from Harlan Laboratories Ltd. (Horst, Netherlands) and habituated for 1 week. Animals (2 per cages) were kept in an air-conditioned vivarium under periodic bacteriologic control at 22°C ± 2°C and 40–80% humidity, with a 12-hr light/dark cycle and background music coordinated with light hours. They were offered standard rodent diet, tap water ad libitum, and an enriched environment (applied to best practice animals welfare standards and rotated on a weekly base with the use of Macrolon boxes, type IV, with autoclaved sawdust bedding). Animals were randomly assigned to groups based on body weight and the use of data collection software Provantis (Instem Life Sciences, Stone, Staffordshire). The animals were kept in a facility accredited by the Association for Assessment and Accreditation of Laboratory Animal Care International and treated in accordance with the guidelines of the Swiss Animal Welfare Act. All procedures were in accordance with the respective Swiss regulations and approved by the Cantonal Ethical Committee for Animal Research.
Study Design, Clinical Observations, and Mortality
Ten rats per group were dosed with clofibrate by oral gavage at doses of 0 (vehicle), 200, 400, or 750 mg/kg/day for up to 7 consecutive days at 10 ml/kg body weight. Dose levels were selected based on previous tolerability data for acute or chronic administration of clofibrate to rats as well as on information for inducing liver or skeletal muscle degeneration (Tanaka et al. 1992; Kramer et al. 2003; Okada et al. 2007; Ennulat et al. 2010).
Clinical observations were performed twice daily, a detailed physical examination was performed weekly, and body weight was recorded on a daily basis. Blood was sampled from the vena sublingualis on day 4 and shortly before the scheduled necropsies on day 8 (approximately 24 hr after last dose). Rats dosed at 750 mg/kg/day were preterminally sacrificed on day 3 (animals 401, 403, 405, and 409; approximately 26 hr after the last dose) and day 4 (animals 404, 406, 407, 408, and 410; approximately 55 hr after the last dose) due to moribund condition (hypoactivity and prone posture). Therefore, for these animals, blood was sampled on day 3 (from vena cava) or day 4 only (animal 402 was found dead on day 3 and therefore no blood could be sampled). One animal, dosed at 400 mg/kg/day (animal number 308), was sacrificed on day 4 due to moribund condition (7 hr after last dose). At study termination on day 8, animals dosed at 0, 200, and 400 mg/kg/day were anesthetized by intraperitoneal injection of 150 mg/kg pentobarbital and subsequently euthanized.
Pathology
The thoracic and abdominal cavity and tissues were macroscopically examined, and liver and brain were weighed. Liver, quadriceps, diaphragm and soleus muscles, heart, kidneys, and brain were sampled for histopathologic evaluation. These tissue samples were fixed in 10% phosphate-buffered formalin for at least 48 hr and embedded in paraffin. Sections were stained with hematoxylin–eosin (H&E).
Biomarkers
Panel of serum biomarkers
Serum bilirubin (total), cholesterol, creatinine, triglycerides, urea, ALT, AST, alkaline phosphatase (ALP), CK, γ-glutamyl transferase, GLDH, sorbitol dehydrogenase (SDH), and serum cholinesterase were analyzed on an Advia 1800 automated clinical chemistry analyzer (Siemens, Healthineers, Erlangen, Germany). ALP, SDH, and serum cholinesterase measurements are not reported herein, as they did not provide additional information compared to ALT and AST results. Serum cholinesterase (synthesized by the liver) is used internally for assessing liver function (Ogunkeye and Roluga 2006).
Fabp3
The quantitative determination of rat Fabp3 concentration in serum was performed by immunoassay on a Gyrolab® platform (Gyros AB, Uppsala, Sweden). This assay employs the quantitative sandwich enzyme immunoassay technique transferred on Gyrolab Bioaffy CD 1000 coated with streptavidin Dynosphere® (product #P0004253). The same chicken antirat cardiac Fabp antibody for capture and detection (cat #10092; Life Diagnostic Inc., West Chester, PA) was utilized. Rat cardiac Fabp (cat# 7930; Life Diagnostic Inc.) diluted in Rexxip Buffer A (product #P0004820; Gyros AB) was used for the standard curve. The capture antibody was biotinylated and the detection antibody was conjugated to Alexa Fluor® 647 (cat #A20186; monoclonal antibody labeling kit from Molecular Probes, Eugene, OR). Unknown samples and standard samples are included in the same experiment. The concentration of Fabp3 was determined from the response acquired from the sample and the corresponding concentration in the standard curve, using Gyrolab Evaluator software, version 3.15.137 (Gyrolab AB).
Myl3
The quantitative determination of rat Myl3 concentration in serum was performed using an immunoassay on a Gyrolab® platform as described above. Rat heart homogenate in Tissue Protein Extraction Reagent, diluted in Rexxip Buffer A, was used for the standard curve. The capture antibody (cat #2-018-C; mouse antimyosin monoclonal antibody, BiosPacific, Emeryville, CA) was biotinylated and the detection antibody (cat #ab679; mouse antimyosin monoclonal antibody, Abcam, Cambridge, United Kingdom) was conjugated to Alexa Fluor® 647 (monoclonal antibody labeling kit from Molecular Probes). Samples were analyzed as described above.
ARG1
The quantitative determination of rat ARG1 concentration in serum was performed using an in-house developed immunoassay on a Gyrolab® platform as described above. The same polyclonal sheep antibody (cat #AF 5868; R&D Systems, Minneapolis, MN) was utilized for capture and detection. Recombinant human ARG1 (cat #AF 5868-AR-010; R&D Systems) diluted in Rexxip Buffer A was used for the standard curve. The capture antibody was biotinylated and the detection antibody was conjugated to Alexa Fluor® 647 (cat #A20186; monoclonal antibody labeling kit from Molecular Probes). Samples were analyzed as described above.
HMGB1 protein (total form)
The quantitative determination of rat HMGB1 (total form) concentration in serum was done using a commercial sandwich enzyme immunoassay (cat #ST51011; IBL International, Hamburg, Germany). The wells of the microtiter strips are coated with purified anti-HMGB1 antibody. The HMGB1 in the sample binds specifically to the immobilized antibody and is recognized by a second enzyme-marked antibody. After substrate reaction, the HMGB1concentration is determined colorimetrically.
CK18: Rat CK18-M30 (cleaved form)
The quantitative determination of rat cytokeratin M-30 (cleaved form for detection of apoptosis) concentration in serum was performed using a commercial sandwich enzyme immunoassay (cat #MBS700460; MybioSource, San Diego, CA). The wells of the microtiter strips are coated with an antibody specific for CK-M30. CK-M30 in the sample binds specifically to the immobilized antibody and is recognized by a second biotin conjugated specific antibody. Following washing, avidin-conjugated horseradish peroxidase is added, and after substrate reaction, the CK-M30 concentration is determined colorimetrically.
Validation/qualification of new liver and skeletal muscle biomarkers
ARG1, Myl3, and Fabp3 are immunoassays developed in house and read on a Gyros platform. The exploratory method validation for ensuring suitable and reliable analytical use included intra- and interassay validation with an expected coefficient of variation ≤20% for intraassay and ≤30% for interassay as well as serial dilutions for linearity (recovery between 70% and 130%). Determination of lower limit of detection (LLOD) and lower and upper level of quantification (ULOQ; LLOD and ULOQ with percentage recovery equal 100 ± 20 and percentage of coefficient of variation ≤25) were evaluated for sensitivity. Stability assessment included room temperature, +4°C and −20°C for 24 hr, 1 week, and 1 month. HMGB1 and CK-18 are commercial assays. The qualification for internal use corresponded to the test of linearity, reproducibility, and spike experiment for matrix effect recovery. Detection range and sensibility indicated by the vendor were taken into consideration.
miR-122
Serum samples were collected and centrifuged for 10 min at 1,900× g at +4°C using a swinging bucket rotor. Serum was transferred to new RNase-free tubes without disturbing the intermediate buffy coat layer and centrifuged for 10 min at 16,000× g at +4°C in a fixed-angle rotor. Clear supernatants were transferred to new RNase-free tubes and stored at approximately −80°C until RNA extraction.
Total RNA was isolated from 80 µl serum using the miRNeasy Qiagen kit (cat #217184; Qiagen, Hilden, Germany), which combines phenol/guanidine-based lysis of samples and silica membrane-based purification of total RNA. Samples were spiked with a panel of synthetic RNAs (UniSp2, UnisP4, and UnisP5; Exiqon Vedbaek, Denmark) with a defined quantity at different concentrations prior to RNA isolation to control extraction efficiency. Complementary DNA (cDNA) was generated using 6 µl extracted total RNA by reverse transcription with cDNA synthesis kit II (cat #203301; Exiqon) and diluted 40 times in RNase-free water.
SYBR Green real-time quantitative Polymerase Chain Reaction (qPCR; cat #203421; ExiLENT SYBR Green master mix, Exiqon) was performed with 4 µl diluted cDNA using the LightCycler 96 real-time PCR system version 1.1.0.1320 (Roche Diagnostic International Ltd., Rotkreuz, Switzerland). The qPCR conditions were a 10-min initial denaturation at 95°C followed by 40 cycles of 10 sec denaturation at 95°C, annealing at 60°C for 1 min, and extension at 72°C for 1 min. A dissociation curve analysis was performed at the end to control the Polymerase Chain Reaction (PCR) specificity.
qPCR results were analyzed using the ΔΔCt method to assess the fold change of miR-122 in serum of treated animal versus control animal. This included normalization to a reference gene miR-16 to correct for differences in sample loading.
Statistical Analysis
Statistical analyses were performed by the use of Prism 6.07 (GraphPad Software Inc., La Jolla, CA) and R 3.3.1 (R Foundation for Statistical Computing, Vienna, Austria). Liver organ weights and each biochemical parameter of interest were assessed by a parametric one-way analysis of variance (ANOVA) test. When significant differences among the means were indicated by the ANOVA (p < .05), a Dunnett’s post hoc test was used to compare the group means between the reference group and each dose group. Whenever Brown–Forsythe test, Levene’s test, or Bartlett’s test (Bartlett 1937; Brown and Forsythe 1974; Levene 1960) indicated heterogeneous group variances (p < .05), a heteroscedastic consistent covariance estimation was applied in the Dunnett’s test procedure (Herberich, Sikorski, and Hothorn 2010). Multiple testing correction was performed on all comparisons of group means to control the false discovery rate (Benjamini and Hochberg 1995).
When no value was measured (below the limit of detection), respective limit-of-detection values for the concerned biomarkers (i.e., Fabp3, Myl3, Ck18, ARG1, and HMGB-1) were used to prevent statistical overestimation of their effects.
Diagnostic performance of CK, Fabp3, and Myl3 parameters were evaluated for skeletal muscle degeneration by receiver operator characteristic (ROC) analysis (Hanley and McNeil 1982). ROC curves plot the true-positive rate (sensitivity) on the y-axis as a function of the false-positive rate (1 − specificity) on the x-axis for all values of a biochemical test at all possible test decision thresholds versus a definitive reference standard. Here, clinical chemistry data were evaluated against histopathology as reference standard (myofiber degeneration). The diaphragm was selected as the standard microscopic tissue, as it is most sensitive to clofibrate administration, and the histopathology finding was used as a binary end point, indicating the presence or absence of degeneration. The histopathologic end point was compared to the respective biomarker results when necropsy was performed: day 8 for controls, low- and mid-dose animals (except 1 mid dose on day 4), and days 3–4 for high-dose animals. Skeletal muscle biomarkers were also compared individually using performance statistics. The definition of the detection threshold level for each biomarker was determined in order to have at least 90% specificity.
Equations for calculating performance statistics assume histopathology findings are the gold standard by which biomarkers are assessed. Somehow, skeletal muscle (diaphragm) degeneration may be occurring in some animals but not detected by histology; therefore, there is a risk of underestimating the diagnostic power of these biomarkers. The following performance statistics were used for comparison: concordance is the proportion of instances that were correctly reported. Positive predictive value (PPV) is the proportion of treatment groups with positive biomarker test results that were correctly diagnosed. Negative predictive value (NPV) is the proportion of treatment groups with negative biomarker test results that were correctly diagnosed. Specificity is the proportion of true negatives among all treatment groups with no skeletal muscle degeneration. Sensitivity is the proportion of true positives among all treatment groups that had skeletal muscle necrosis. False positive rate is the proportion of negative instances that were erroneously reported as positive. False negative rate is the proportion of positive instances that were erroneously reported as negative.
For correlation analysis between different skeletal muscle biomarkers (CK, Fabp3, and Myl3), Pearson’s correlation test and R 2 analyses were performed. Correlation analysis of biomarkers was performed with the interim blood sampling results, where significantly increased levels/activities were observed. The histopathologic score (diaphragm degeneration) was compared to the respective biomarker results when necropsy was performed. Findings were considered significant at p < .05.
Results
In-life Observations
Rats in the 750 mg/kg/day group were dosed on days 1–2 and were sacrificed earlier than planned on days 3–4. This dose was associated with clinical signs (hypoactivity, prone posture) and a loss in body weight (up to 8% for 1 animal). Clofibrate was tolerated at 200 and 400 mg/kg/day (1 male dosed at 400 mg/kg/day was sacrificed in a moribund condition on day 4 at 7 hr postdosing). A reduction in mean body weight gain (up to 80%), associated with reduced food consumption (up to 20%), was identified in rats at 400 mg/kg/day toward the end of the study.
Macroscopic Findings and Organ Weights
No macroscopic findings were noted at necropsy in the majority of animals; some animals (6/10) in the 750 mg/kg/day groups presented with a few redness areas on the forestomach (attributed to stress due to their poor clinical condition). Liver weights were increased at all dose levels (Figure 1).
Comparison of liver to body weight ratios at interim (high-dose group) and terminal sacrifice (others groups). Ratios were significantly increased when compared to controls sacrificed on day 8 (+49%, +76%, and +46%) at 200 (+49%), 400 (+76%), and 750 mg/kg/day (+46%) dose levels. ****p < .0001. *****p < .00001.
Biomarkers Results at Interim Blood Sampling (Days 3–4)
Cholesterol and triglycerides levels are presented in Figure 2. Both were decreased in the treated groups with a significant decrease in cholesterol in all groups and triglycerides in the 750 mg/kg/day group, confirming the clofibrate-related effect. Biomarkers related to liver (hepatocellular) injury are presented in Figure 3. Overall, ALT, CK18, and ARG1 showed increased activities/levels in treated groups when compared with controls. Specifically, ALT activity was increased at 200 (p < .01), 400 (p < .00001), and 750 mg/kg/day (p < .00001), whereas ARG1 and CK18 (cleaved form) were increased at 400 (p < .05 for CK18 only) and 750 mg/kg/day (p < .05 and p < .01, respectively). miR-122 expression level was increased (4.6-fold change) at 750 mg/kg/day although this change was not statistically significant. At 400 mg/kg/day, a minimal increase was noted (2-fold change; Figure 4).
Comparison of cholesterol and triglyceride levels between groups at interim blood sampling. (A) Cholesterol levels were significantly decreased, respectively, at 200 (−65%), 400 (−69%), or 750 mg/kg/day (−64%) dose levels (when compared to controls). (B) Triglyceride levels were significantly decreased at 750 mg/kg/day (−45%). *p < .05. *****p < .00001.
Comparison of alanine aminotransferase (ALT), glutamate dehydrogenase (GLDH), arginase 1 (ARG1), and cytokeratin 18 (CK18) serum levels/activities between groups at interim blood sampling. (A) ALT serum activities were significantly increased at all doses (when compared to controls). (B) GLDH results were equivocal. (C) CK18 levels at 400 and 750 mg/kg/day were significantly increased. (D) ARG1 levels were increased (7-fold) at 400 and 750 mg/kg/day (p < .05 at 750 mg/kg/day). *p < .05. **p < .01. *****p < .00001.
Fold change in microRNA 122 (miR-122) expression versus control group at interim blood sampling. A 4.6-fold increase in miR-122 relative expression was observed at 750 mg/kg/day compared to the control group (not statistically significant). A 2.0-fold change was noted at 400 mg/kg/day (not statistically significant).
GLDH increases at 750 mg/kg/day were equivocal (only 1 animal with increased values). HMGB-1 results were inconclusive at 750 mg/kg/day, as only few animals had values dissimilar to those of controls (data not shown).
Biomarkers related to skeletal muscle injury are presented in Figure 5. AST activities were increased at 200, 400, and 750 mg/kg/day (p < .00001). Fapb3 also showed increased values at 200 (p < .01), 400 (p < .00001), and 750 mg/kg/day (p < .00001). CK activity was increased at ≥400 mg/kg/day doses (p < .00001) only, suggesting lower sensitivity than AST or Fabp3. Myl3 levels were increased at 200 (p < .01), 400 (p < .0001), and 750 mg/kg/day (p < .05).
Comparison of aspartate aminotransferase (AST), creatine kinase (CK), myosin light chain 3 (Myl-3), and fatty acid binding protein 3 (Fabp3) serum levels/activities between groups at interim blood sampling. (A) AST activities, (C) Fabp3, and (D) Myl3 levels were significantly increased at 200, 400, and 750 mg/kg/day (when compared to controls). (B) CK activities were significantly increased at 400 and 750 mg/kg/day. *p < .05. **p < .01. ****p < .0001. *****p < .00001.
Biomarkers Results at Terminal Blood Sampling (Day 8)
Cholesterol and triglycerides levels are presented in Figure 6. Cholesterol or triglycerides levels were significantly decreased in the 200 and 400 mg/kg/day treated groups, confirming the clofibrate pharmacologic hypolipidemic effect noted at the interim blood sampling. Overall, both liver and skeletal muscle biomarkers presented some remarkable decreases at terminal compared to interim blood sampling (Figures 7 and 8).
Comparison of cholesterol and triglyceride levels between groups at terminal blood sampling. (A) Cholesterol levels were significantly decreased at 200 (−55%) and 400 (−50%) mg/kg/day. (B) Triglycerides levels were significantly decreased at 200 (−57%) and 400 (−59%) mg/kg/day. ***p < .001. *****p < .00001.
Comparison of alanine aminotransferase (ALT), glutamate dehydrogenase, arginase 1, and cytokeratin 18 (CK18) serum levels/activities between groups at terminal blood sampling (A, B, C and D respectively). Only (A) ALT and (D) CK18 still showed increased mean values at 400 mg/kg/day, but with some remarkable decreases if compared to the interim blood sampling. *p < .05. **p < .01.
Comparison of aspartate aminotransferase (AST), creatine kinase (CK), myosin light chain 3 (Myl-3), and fatty acid binding protein 3 (Fabp3) serum levels/activities between groups at terminal blood sampling. (A) AST activity, (C) Fabp3, and (D) Myl3 levels remained significantly increased at 400 mg/kg/day when compared to controls. These three biomarkers showed a remarkable decreased in levels/activities in comparison to the interim blood sampling. (B) CK activities were not increased and had returned to baseline/control values. *p < .05. **p < .01. *****p < .00001.
ARG1 concentrations were comparable between clofibrate-treated and control groups, indicating a return to a normal range when compared to the interim blood sampling. CK18 still showed a significant increase at 400 mg/kg/day (p < .05), but with a mean value (3.75 mIU/ml) much lower than the 1 observed at the interim sacrifice (10.12 mIU/ml). Interestingly, no increase in miR-122 expression level was observed at the terminal sacrifice (Figure 9) in accordance with ARG1 results.
Fold change in microRNA 122 expression versus control group at terminal blood sampling. No increases in expression level were observed at 200 nor 400 mg/kg/day when compared to the control group. *p < .05.
ALT activity was increased at 400 mg/kg/day (p < .01) but with less amplitude when compared to the interim blood sampling. Fabp3 and Myl3 levels were also slightly increased at 200 (p < .05 for Myl3) and 400 mg/kg/day (p < .05 and p < .01, respectively); however, their respective means were similar or below those at 200 mg/kg/day at the interim blood sampling. CK activities at 200 or 400 mg/kg/day doses were lower than the respective control group. AST activities remained significantly increased at 200 (p < .01) and 400 mg/kg/day doses (p < .00001), but with a lower amplitude when compared to the interim blood sampling.
Microscopic Findings
Expected clofibrate-related histopathology findings were observed for terminal sacrifice or moribund animals. The histopathologic changes are shown in Figure 10 and are tabulated in Table 1. Occurrence of hepatocellular hypertrophy was noted in a dose-related manner, despite the discontinuation of the dosing at the high dose. Increased incidences of hepatocellular mitoses were also observed in treated groups. Evidence of apoptosis was not identified.
Features of clofibrate-induced myofiber and hepatocellular alterations on cellular level (Hematoxylin Eosin stain). (A) Transverse section of clofibrate treated (750 mg/kg/day) rat diaphragm showing macrophagic cell infiltration and myofiber degeneration (hypereosinophilia with loss of cross striation; original objective 20×). (B) Longitudinal section of clofibrate treated (400 mg/kg/day) rat diaphragm showing multiple myofiber regeneration with cytoplasmic basophilia, centralized row of nuclei (original objective 20×). (C) Longitudinal section of clofibrate treated (750 mg/kg/day) rat, heart, showing myofiber minimal vacuolation without concomitant degeneration or necrosis (original objective 20×). (D) Control rat liver (original objective 20×). (E) Clofibrate treated (400 mg/kg/day) rat liver showing hepatocellular hypertrophy and mitoses (original objective 20×). (F) Clofibrate treated (750 mg/kg/day) rat liver showing hepatocellular hypertrophy. Hypertrophy was less prominent than at 400 mg/kg/day due to limited duration of exposure (2 days of administration). Absence of hepatocellular degeneration or necrosis (original objective 20×).
Summary of Liver and Type I–rich Skeletal Muscle Histopathological Findings.
Note: Hepatocellular hypertrophy was noted in all treated groups in a dose-related manner. Diaphragm myofiber degeneration was noted in all clofibrate groups and was associated with mononuclear (mainly macrophages) cell infiltrates. Myofiber regeneration was observed at 200 and 400 mg/kg/day only. Soleus muscle was less affected than diaphragm. Bold values correspond to the total number of animals affected (per group) for each microscopic observation.
aOne 400 mg/kg/day rat was sacrificed on day 4.
Myofiber changes were noted in type I rich skeletal muscles (diaphragm and soleus muscle to a lower extent). Myofiber degeneration was observed in all treated groups, whereas myofiber regeneration was also noted, but at 200 or 400 mg/kg/day doses only. Myofiber degeneration was characterized by individual hypereosinophilic and/or fragmented myocytes. In some animals, these changes were associated with mononuclear cell (macrophage) infiltration. Muscle degeneration was noted in the diaphragm and soleus muscles, and no changes were noted in quadriceps. Lesion severity was greatest in the diaphragm. The histologic features of affected myocytes in this study were consistent with those described previously in rats, given similar doses of clofibrate (Afifi et al. 1984; Okada et al. 2007). Microscopic evaluation correlated well with skeletal muscle biomarkers results. High concordance and PPV between histopathology, Fabp3, and Myl3 were observed (see diagnostic performance and predictivity of skeletal muscle biomarkers section).
Minimal focal myofiber vacuolation was noted in the heart at 750 mg/kg/day in individual animals. Increased CK, Fabp3, or Myl3 levels/activities have been described, but only in cases of significant cardiac myofiber necrosis when toxic doses of specific cardiotoxicants are used (Tonomura et al. 2012). With toxic doses of fenofibrate, cardiac myofiber necrosis was obtained but not associated with any increase in CK activity (Pettersen et al. 2012). In our study, myofiber necrosis was not observed at 750 mg/kg/day or lower doses. Increases in Fabp3 or Myl3 were noted at 200 and 400 mg/kg/day in the absence of any myofiber change in the heart. Therefore, presence of myofiber vacuolation at 750 mg/kg/day was considered most likely not to alter the interpretation of CK, Fabp3, or Myl3 results.
Correlation between Liver Biomarkers and Skeletal Muscle Biomarkers
Correlation between liver biomarkers (ARG1, CK18, and GLDH) and miR-122 are presented in Figures 11 and 12. Correlation analysis was performed at 750 and 400 mg/kg/day at the interim sacrifice (significant biomarker responses were observed only at these doses and at this blood sampling time point). ARG1 correlated significantly with mi-R122 at 750 and 400 mg/kg/day (r = −.84 and r = −.69, p < .01 and p < .05, respectively). This is especially remarkable, considering the limited number of compared animals per group. Correlation results for CK18 and GLDH were not significant (data not shown).
Pearson product–moment correlation at interim blood sampling between (A) microRNA 122 (miR-122) and arginase 1 (p < .01, r = −.84), (B) miR-122 and glutamate dehydrogenase (NS, r = −.67), (C) miR-122 and cytokeratin 18 (NS, r = −.66), and (D) miR-122 and creatine kinase (NS, r = −.18). Scatterplots with regression line are shown. Δ Ct values were calculated using miR-16 as a reference gene.
Pearson product–moment correlation between microRNA 122 and arginase 1 (p < .05, r = −.69) in the 400 mg/kg/day group at interim blood sampling. A scatterplot with regression line is shown. Δ Ct values were calculated using miR-16 as a reference gene.
Correlation results between different muscular biomarkers levels (CK, Fabp3, and Myl3) or between those biomarkers and their histopathologic score are presented in Figure 13. Fabp3 correlated significantly with CK (p < .001), and Fabp3 data showed a higher amplitude response when compared to CK. Fabp3 also presented a higher amplitude response when compared to Myl3 (most of the Myl3 data were comprised in a small range from 0 to 5 ng/ml). When compared to the histopathologic score, CK presented better overall reliability (r = .6706, p < .001) when compared to Fabp3 (p < .001, r = .5231) or Myl3 (p < .01, r = .485). As expected, complete absence of correlation between miR-122 and CK (Figure 13, r = −.05) was noted. miR-122 demonstrated a correlation with ARG1, and CK correlated with both Fabp3 and Myl3. This confirms the specificity of miR-122 for liver and Fabp3/Myl3 for skeletal muscle, respectively.
Pearson product–moment correlation between (A) creatine kinase (CK) and fatty acid binding protein 3 (Fabp3; p < .001, r = .5351), (B) Fabp3 and myosin light chain 3 (Myl3; p < .001, r = .7202), (C) CK and the histopathologic score (p < .001, r = .6706), (D) Fabp3 and the histopathologic score (p < 0.001, r = .5231), and (E) Myl3 and the histopathologic score (p < .01, r = .485). Scatterplots with regression lines are shown. Interim blood sampling data were analyzed. The histopathologic score (diaphragm degeneration) was compared to the respective biomarkers results when necropsy was performed. The cutoff criteria for CK, Fabp3, and Myl3 levels/activity were represented by traverse lines at 90% specificity.
Correlation analysis between liver biomarkers and hepatocyte hypertrophy was not conducted because of the absence of a dose-related effect in terms of incidence in the treated groups. This is due to the fact that clofibrate administered at a low dose (200 mg/kg/day) already causes large increases in liver weights and significant hepatocyte hypertrophy. Additionally, lack of predictivity of some of these biomarkers with regard to hepatocyte hypertrophy is already reported in the literature (Sharapova et al. 2016).
Diagnostic Performance, Predictivity of Skeletal Muscle Markers
To examine the diagnostic accuracy for detecting pathological alterations in the most sensitive skeletal muscle (diaphragm), we individually performed the ROC analysis for CK, Fabp3, and Myl3 individually and also for the 3 markers combined. ROC analysis was not performed for liver biomarkers, since there was no concomitant hepatocellular microscopic degeneration.
Fabp3 and Myl3 had the greatest diagnostic accuracy for predicting myofiber degeneration when compared to CK (Figure 14). Fabp3 and Myl3 outperformed CK overall in terms of sensitivity and specificity (AUCs of 0.8625 and 0.8861 vs. 0.5667, respectively; both p < .0001). As shown in Table 2, performance statistics calculations also indicated higher sensitivity in addition to higher PPV and NPV for Fabp3 and Myl3 in comparison to CK. These results are in accordance with previous publications (Tonomura et al. 2009, 2012; Burch et al. 2016). Combination of the three markers showed an even better performance with AUC = 0.9139 (p < .0001). Threshold detection levels were defined as 16.5 ng/ml (Fabp3), 1.3 ng/ml (Myl3), and 415 IU/L (CK) for achieving at least 90% specificity for each biomarker (Table 3). This is consistent with previous publications that indicate a Fabp 3 threshold level of 26 ng/ml and reported baseline values of 0.65–9.99 ng/m (Pritt et al. 2008; Bodie et al. 2016). Regarding Myl3, our cutoff level was consistent with the previous literature (Tonomura et al. 2012; Bodie et al. 2016), where baseline and threshold values were lower than 1 ng/ml.
Performance of fatty acid binding protein 3 and myosin light chain 3 as biomarkers of skeletal muscle injury in comparison to creatine kinase. Data are expressed as area under the curve, with p < .05 being statistically significant. A response is defined by the cumulative histopathology grade of myofiber degeneration in the diaphragm, with grade 0 considered negative and grades >0 considered positive. The histopathologic end point (diaphragm myofiber degeneration or/absence of degeneration) was compared to the respective biomarkers results when necropsy was performed.
Performance Statistics for Fatty Acid Binding Protein 3 (Fabp3), Myosin Light Chain 3 (Myl3), and Creatine Kinase (CK), and Their Relative Predictivity of Histopathologic Observations of Skeletal Muscle Degeneration in the Diaphragm.
Note: Results were calculated based upon the data presented in Table 3, where blood sampling time point corresponds to necropsy time point. Positive prediction of diaphragm myofiber degeneration required Fabp3 level to be higher than 16.5 ng/ml, Myl3 higher than 1.3 ng/ml, and CK levels higher than 415 IU/L. Concordance = (TP + TN)/(TP + TN + FP + FN); PPV = (TP/TP + FP); NPV = (TN/TN + FN); specificity = (TN/TN + FP); sensitivity = (TP/TP + FN); FPR = (FP/FP + TN), and FNR = (FN/FN + TP). PPV = positive predictive value; NPV = negative predictive value; FPR = false positive rate; FNR = false negative rate; TN = true negatives; TP = true positives.
Summary of Animal Fatty Acid Binding Protein 3 (Fabp3), Myosin Light Chain 3 (Myl3) Levels, CK serum activities, and Respective Histopathological Score of Myofiber Degeneration (Diaphragm).
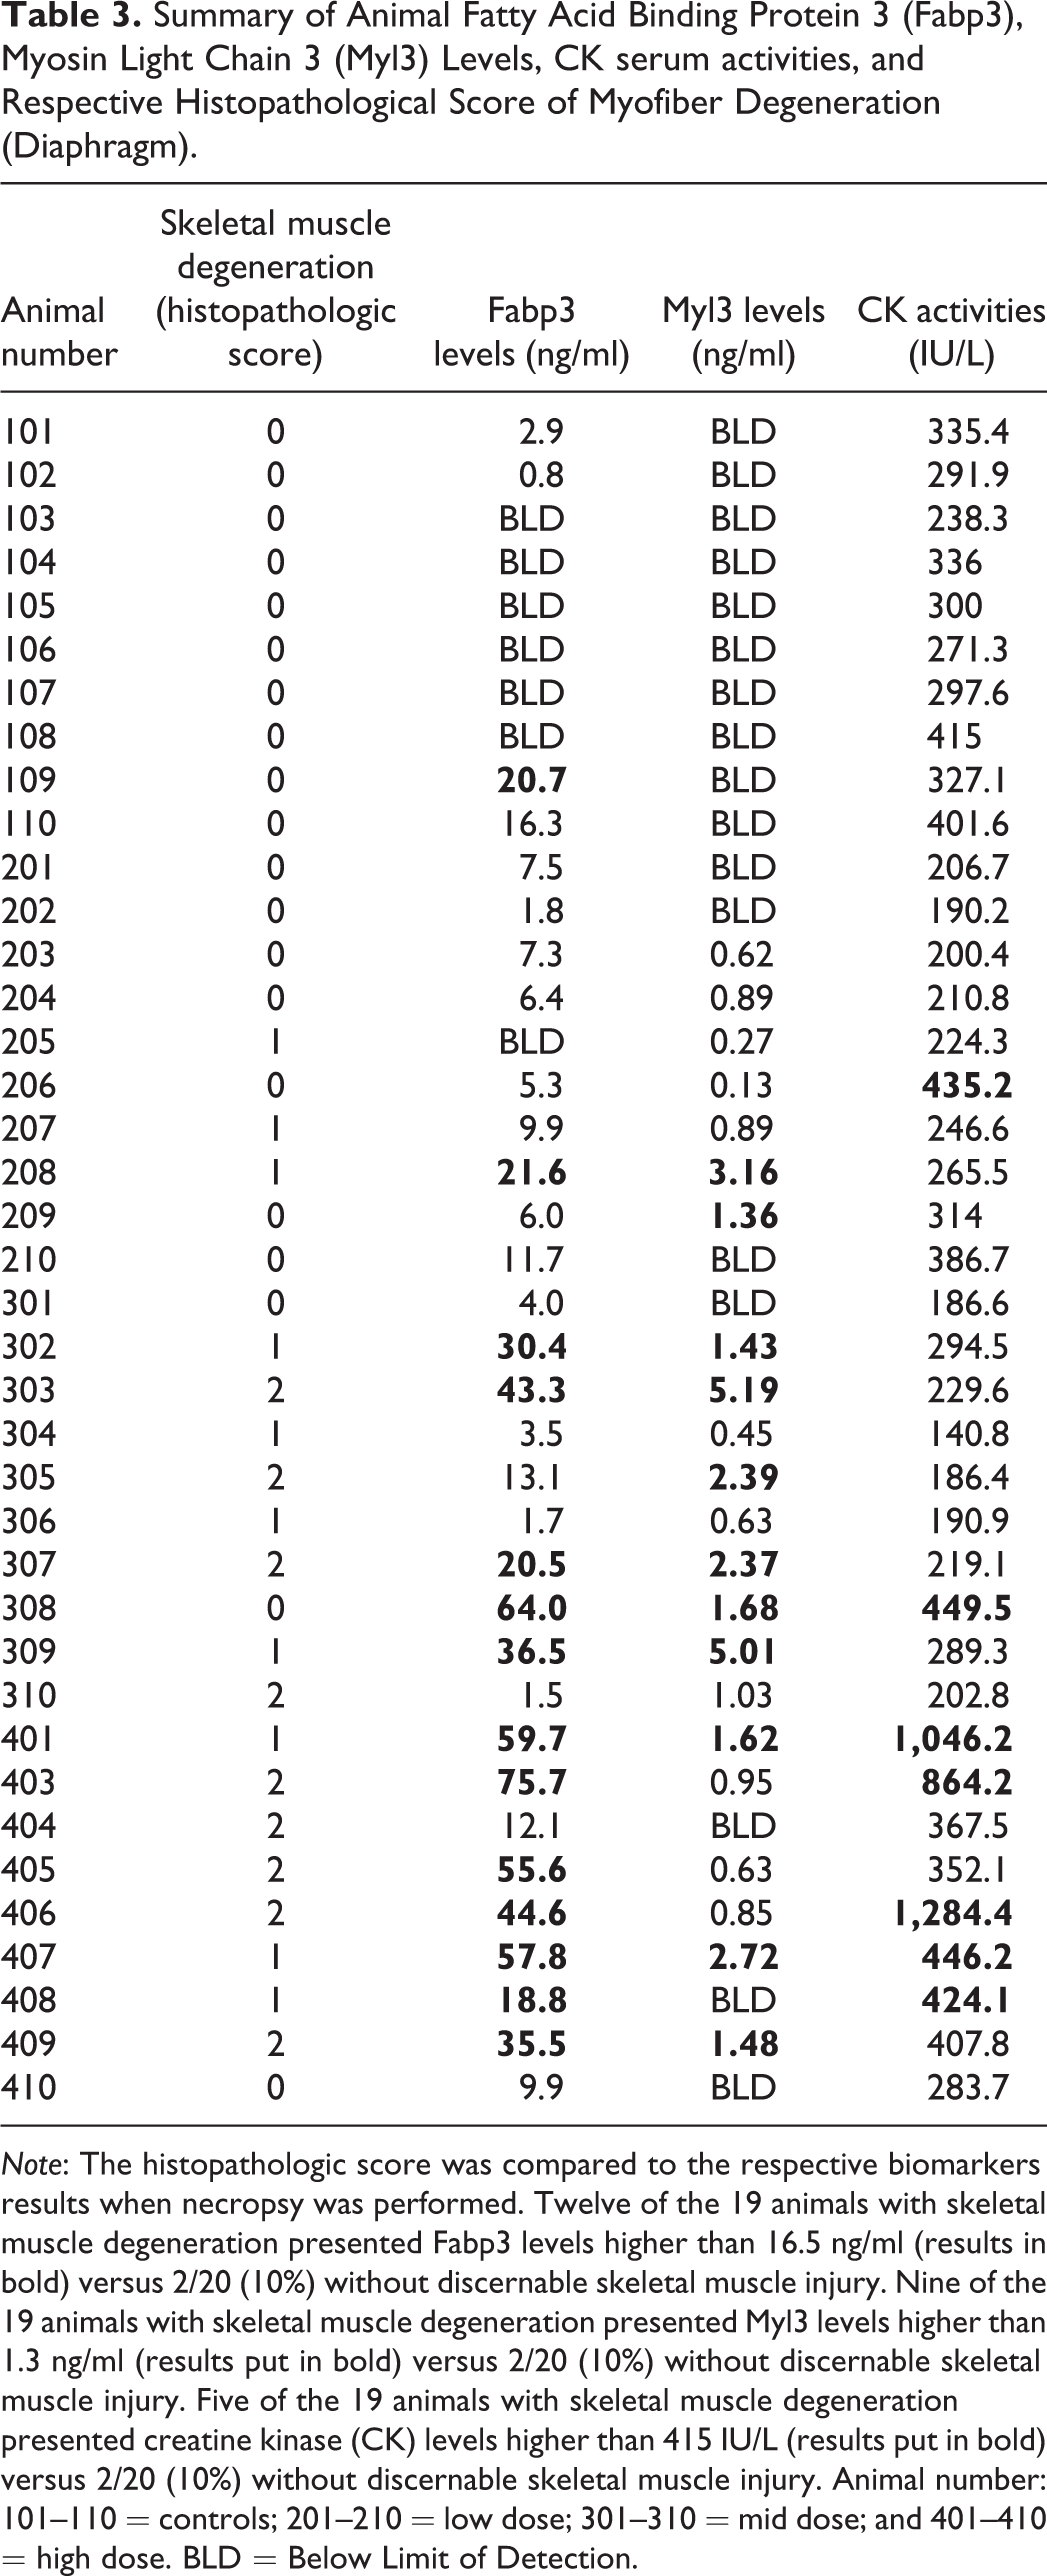
Note: The histopathologic score was compared to the respective biomarkers results when necropsy was performed. Twelve of the 19 animals with skeletal muscle degeneration presented Fabp3 levels higher than 16.5 ng/ml (results in bold) versus 2/20 (10%) without discernable skeletal muscle injury. Nine of the 19 animals with skeletal muscle degeneration presented Myl3 levels higher than 1.3 ng/ml (results put in bold) versus 2/20 (10%) without discernable skeletal muscle injury. Five of the 19 animals with skeletal muscle degeneration presented creatine kinase (CK) levels higher than 415 IU/L (results put in bold) versus 2/20 (10%) without discernable skeletal muscle injury. Animal number: 101–110 = controls; 201–210 = low dose; 301–310 = mid dose; and 401–410 = high dose. BLD = Below Limit of Detection.
Discussion
ALT, AST, and CK have been used in preclinical and clinical studies for the identification of liver and skeletal injury. Since ALT and AST are also expressed in other tissues (e.g., skeletal muscle), liver injury may be under- or overestimated in the absence of more liver-specific biomarkers. Moreover, administration of some classes of compounds is correlated with increased serum activities of ALT/AST without microscopic evidence of hepatocellular injury. Dexamethasone, a potent inducer of CYP3A in the rat, is associated with increases in hepatic and serum ALT activities (Jackson et al. 2008). As already mentioned, microsomal enzyme inducers, like fibrate hypolipidemics and other PPAR-α agonists, were associated with increases in ALT or AST serum activities (Kramer et al. 2003; Ennulat et al. 2010). Therefore, the toxicological relevance of increased ALT/AST when preclinically investigating liver inducers is challenging. Striated skeletal muscle degeneration is commonly evaluated with CK, AST, and, to a lesser extent, ALT, but their diagnostic power in preclinical toxicity studies may be suboptimal because of their limited sensitivity, highlighting the need for improved biomarkers.
In this study, we used clofibrate to study potential new biomarkers due to its ability to induce both liver and/or skeletal muscle toxicity. The objective was to obtain an increase in ALT/AST activities at 200 and 400 mg/kg/day without concomitant liver microscopic degeneration. The high dose of 750 mg/kg/day was expected to elicit liver and skeletal muscle microscopic degeneration, which represents an additional and separate factor for ALT and AST increases (Kramer et al. 2003; Okada et al. 2007).
Unexpectedly, animals at 750 mg/kg/day did not tolerate this dose level and were sacrificed earlier than planned, on days 3–4 (following 2 days of clofibrate administration). The 750 mg/kg/day dose level was selected based on a previous publication where multifocal hepatocellular centrilobular apoptosis was observed after oral administration of clofibrate at 800 mg/kg/day during at least 5 days (Kramer et al. 2003). Presence of hepatocellular degeneration was not observed; this was most likely because of the premature sacrifice of the 750 mg/kg/day group as hepatocellular degeneration was only expected to occur after at least 5 days of administration (Kramer et al. 2003). Nevertheless, relevant clinical pathology changes were observed at this dose despite shorter treatment duration and different blood sampling time points when compared to the others groups (interim blood sampling). Hepatocellular hypertrophy and skeletal muscle degeneration were also noted in almost all animals with no significant difference in either incidence or severity between day 3 and day 4 animals. There was no difference between animals with regard to Fabp3, Myl3, and CK range of data values (see Table 3). Liver biomarkers presented lower values on day 4 versus day 3 animals. Differences in treatment duration prevented identification of clear dose-related clinical pathology changes but did not impair the identification of significant changes between 750 mg/kg/day and the control group. There was a concordant increase in several liver (ARG1, CK18, ALT, and miR-122) and skeletal muscle (Fabp3, CK, Myl3, and AST) biomarkers, with most changes being statistically significant, confirming the expected toxicity at 750 mg/kg/day in this group. Large increases in liver weights as well as statistically significant decreases in cholesterol and/or triglyceride levels were observed at all doses, confirming the clofibrate-related pharmacological effect. Therefore, data from the 750 mg/kg/day group were considered suitable for analysis, interpretation, and comparison versus the control group at the interim blood sampling time point.
Liver-relevant changes consisted of an increase in ARG1 and MiR-122 biomarkers in addition to hepatocellular hypertrophy. At the interim blood sampling, higher miR-122 and ARG1 sensitivity was supported by their significant correlation at 400 and 750 mg/kg/day. The specificity of miR-122 and ARG1 was also confirmed by the absence of correlation between miR-122 and CK.
ARG1 is reported to show good sensitivity in detecting hepatocellular injury, including single-cell necrosis (Bailey et al. 2012). Rodent studies have demonstrated significant increases and peak levels of ARG1 prior to similar elevations of ALT and with a higher amplitude response (Murayama et al. 2008). Minimal increases in ARG1 may be due to its high cytosolic concentration and suggest a higher sensitivity compared to classical liver biomarkers. miR-122 is also reported with the highest area under curve for detecting necrosis/single-cell necrosis (0.89) when compared to ALT (0.81) and GLDH (0.82; Sharapova et al. 2016).
The clofibrate-induced hypertrophy (already observed with 750 mg/kg/day animals on days 3 and 4) may have been severe enough to prompt acute leakage of miR-122 especially due to an active release of exosomes. This was demonstrated in a mouse study where active release of exosomes corresponded to hepatocyte injury of low severity. In contrast acute, passive release of protein complexes containing miR-122 occurred with significant hepatocyte necrosis (miRNAs are normally bound in the cytoplasm with proteins like argonaute 2; Bala et al. 2012; Hornby et al. 2014). In response to a toxic insult that leads to hepatocellular proliferation, hepatocytes may also release miR-122. miR-122 is known to be involved in the regulation of hepatocyte differentiation and to play a role in homeostasis as well as hepatocyte regeneration after injury. Active shedding of miR-122 is supported by experiments showing a loss of miR-122 during hepatocyte proliferation (Tsai et al. 2012). Therefore, with regard to the homeostasis process and the mitoses observed microscopically, hepatocellular proliferation may have a role in the increase in miR-122. Nevertheless, no miR-122 increase was noted at 200 mg/kg/day on day 8 despite the presence of microscopic mitoses.
With regard to ALT/AST, increased serum activities may occur in the absence of microscopic hepatocellular degeneration. Increases in ALT/AST activities have been described (through cytoplasmic blebbing) with reversible hepatocellular injury (Ennulat et al. 2010).
Absence of a statistically significant correlation between miR-122 and CK18 remains unexplained. CK18 is being extensively evaluated in humans in the context of developing new DILI biomarkers (Weiler, Merz, and Kullak-Ublick 2015) and is therefore also a potential translatable biomarker in preclinical species. Previously, CK18 has been shown to correlate to liver injury in mice; however, these data were generated in an overdose acetaminophen study where massive hepatocellular degeneration (apoptosis/necrosis) and release of both cleaved and uncleaved CK18 were expected (Antoine et al. 2009). In the Kramer et al. (2003) publication, caspase-3 immunohistochemistry did not provide any additional information beyond classical microscopic examination. This suggests that the increase in CK18 (cleaved form) in our study may not correspond to concomitant hepatocellular apoptosis, which was not identified microscopically. In addition, the 750 mg/kg/day group was only dosed for 2 days, limiting liver exposure to clofibrate and potential reducing the potency of clofibrate to elicit hepatocyte apoptosis or degeneration. Therefore, a lack of CK18 specificity cannot be excluded in this study.
GLDH and HMGB-1 results were inconclusive in all treated groups (i.e., the absence of response cannot rule out hepatocellular toxicity). This is most likely due to the limited sensitivity of these biomarkers under the conditions of this study. Absence of a GLDH response could be attributed to its specific cellular location; GLDH is a mitochondrial enzyme (rather than cytosolic) and is therefore less sensitive to minimal and reversible hepatocyte insult. Absence of a GLDH response with phenobarbital induced-liver hypertrophy has been previously reported (Starckx et al. 2013) and GLDH has been shown to be an unreliable predictor of liver hypertrophy (Sharapova et al. 2016). However, GLDH control values and standard deviations were similar to those described in previous publication (O’Brien et al. 2002).
At terminal compared to the interim blood sampling, a remarkable decrease was noted at 400 mg/kg/day for both ARG1 and miR-122 biomarkers, with serum concentration/expression level similar or lower than control animals. Transient upregulation of a variety of cell proliferation–associated genes has been described in clofibrate rat studies (7 day administration), with a peak occurring between days 3 and 7 and downregulation occurring on day 7. Reduced upregulation of genes involved in potential hepatotoxicity, that is, fatty acid metabolism (acyl-CoA oxidase) and fatty acid oxidation (cytochrome P450 4A1), was also noted in gene expression analysis on day 7 when compared to day 3 (Baker et al. 2004). These time-specific gene expression changes, which have a direct impact on hepatocellular toxicity, may explain the transient increases in ARG1 and miR-122 in our study. Interestingly, ALT and AST also presented decreased activities, but since these enzymes are also increased in the presence of myofiber degeneration, we cannot specifically assess the liver effects with these enzymes.
From a preclinical safety perspective, hepatocellular leakage of enzymes/miRNAs is an indicator of both transient and permanent hepatocellular damage and has to be considered carefully. Therefore, at 750 mg/kg/day, the magnitude of increase in ARG1 and miR-122 suggests the onset of specific hepatocellular injury despite the absence of discernable microscopic hepatocellular degeneration. In contrast, at 200 mg/kg/day, the absence of a biomarker response for ARG1 and miR-122 (despite increased AST/ALT activities) in addition to the absence of any microscopic hepatocyte degeneration is indicative of the absence of hepatocellular toxicity (i.e., hepatocellular integrity and function is maintained) at terminal sacrifice. With the higher sensitivity and specificity of ARG1 and miR-122, we are confident that absence of toxicity is also applicable at interim blood sampling at 200 mg/kg/day, despite the absence of concomitant microscopic evaluation.
Skeletal muscle clofibrate-related changes consisted of myofiber degeneration and/or regeneration and correlated strongly with Fabp3 and Myl3 biomarkers. Overall, Fabp3 demonstrated higher sensitivity and specificity for detecting type I skeletal muscle injury than CK and to a lesser extent Myl3.
Clofibrate-related myofiber degeneration was noted in type I rich muscles such as the diaphragm and soleus, which is consistent with published literature (Okada et al. 2007, 2009). Myofiber degeneration was not observed in quadriceps muscle sections; however, we could not exclude the presence of myofiber degeneration in the quadriceps since the deep portion (vastus intermedius) of the quadriceps contains type I myofiber and this portion was not sampled in our study. Moreover, type I myofiber clofibrate-related degeneration has recently been reported in deep portions of the quadriceps muscle (Bodie et al. 2016). High levels of Fabp3 and CK were noted at 750 mg/kg/day, where the most significant microscopic skeletal muscle degeneration was also noted, without any indication of myofiber regeneration.
CK values were mainly increased at the 750 mg/kg/day dose, suggesting lower sensitivity of CK as a biomarker, as confirmed with ROC and test performance analyses. Higher expression of CK in type II myofibers as well as the short CK half-life in rats may explain the absence of a significant response at 200 and 400 mg/kg/day doses at terminal blood sampling, where blood sampling was performed 24 hr after the last dosing (Hoffmann, Wilson, and Solter 1999). In comparison, a previous publication (Pritt et al. 2008) indicated that Fabp3 typically peaks between 4 and 24 hr after dosing (Pritt et al. 2008), whereas Myl3 levels remain high 24hr postdosing (Tonomura et al. 2012).
Compared to the interim blood sampling, lower concentrations of Fabp3 and Myl3 were noted terminally at the remaining 200 and 400 mg/kg/day doses, correlating to the observed microscopic skeletal muscle myofiber regeneration, in addition to degeneration. This also indicated an active phase of degeneration/necrosis and justifies the minimal yet persistent increases in the most sensitive biomarkers (Fabp3 and Myl3).
Concomitant increases in ALT/AST were considered to be partly due to skeletal muscle degeneration in addition to the possible leakage of hepatocellular AST/ALT. ALT and AST show similar skeletal muscle distribution as Fabp3. Skeletal muscles composed primarily of type I fibers (and the left cardiac ventricle) have up to 3-fold higher AST/ALT activities than muscles composed primarily of type II fibers (Pritt et al. 2008). Therefore, there is coherence between the changes observed for ALT/AST activities and Fabp3 or Myl3 levels. In addition to Fabp3 and Myl3, skeletal troponin I type II (sTnI), as well as CK-MM homodimer (Ckm), have been recently evaluated in rats as promising skeletal muscle biomarkers. They outperformed CK and AST and added value for the diagnosis of drug-induced skeletal muscle injury in rats (Burch et al. 2016). A clofibrate-induced (up to 500 mg/kg/day for 7 days) skeletal muscle injury study confirmed the usefulness of Fabp3, Myl3, and sTnI for the detection of minimal severity skeletal injury compared to CK (Bodie et al. 2016).
Conclusion
Fabp3 and Myl3 outperformed CK for the overall detection of myofiber type I degeneration, especially in case of minimal severity. CK was not sensitive enough to confirm skeletal muscle injury at 200 mg/kg/day, and ALT/AST data alone were not conclusive due to the lack of tissue specificity. At 200 mg/kg/day, despite increased AST/ALT serum activities, the absence of ARG1 and miR-122 responses, in addition to the absence of microscopic liver degeneration, indicated the absence of liver toxicity. Furthermore, results for GLDH, CK18, and HMGB-1 were inconclusive. Overall, combining both classical and additional liver and skeletal muscle biomarkers can be considered a valuable strategy for differentiating increased transaminases due to liver toxicity from skeletal muscle toxicity. Moreover, these promising biomarkers help identify compound-related hepatotoxicity, as liver injury may be overestimated when ALT and AST activities are increased in preclinical studies. Nevertheless, further investigation in the presence of significant, dose-related microscopic hepatocyte degeneration is needed for a complete evaluation and comparison of miR-122, CK18, ARG1, GLDH, and HMGB-1 as liver biomarkers in rats.
Footnotes
Authors’ Note
Editorial assistance was provided by Meridian HealthComms.
Acknowledgment
We would like to thank Tanja Zabka and Mudher Albassam for their insightful discussion and useful comments on a previous draft of this article.
Author Contribution
Authors contributed to conception or design (PM, MF, MB, FC, BL, and WM); data acquisition, analysis, or interpretation (PM, MF, MB, FC, BB, and WM); drafting the manuscript (PM, MF, FC, and BB); and critically revising the manuscript (MF, MB, BL, and WM). All authors gave final approval and agreed to be accountable for all aspects of work in ensuring that questions relating to the accuracy or integrity of any part of the work are appropriately investigated and resolved.
Declaration of Conflicting Interests
The author(s) declared the following potential conflicts of interest with respect to the research, authorship, and/or publication of this article: Pierre Maliver, Matthias Festag, Francois Christen, Moritz Bennecke, Michael Winter, and Barbara Lenz are employed by F. Hoffmann-La Roche Ltd., Basel, Switzerland. Balázs Bánfai is employed by Soladis GmbH, Basel, Switzerland.
Funding
The author(s) disclosed receipt of the following financial support for the research, authorship, and/or publication of this article: The study was sponsored by Hoffmann La Roche and funded by F. Hoffmann-La Roche Ltd.