
Abstract
Two-week administration of (+)-usnic acid (UA) induces mitochondrial swelling of cardiomyocytes, and toxicogenomic analysis of the heart revealed upregulation of oxidative stress, amino acid limitation, and endoplasmic reticulum stress–related genes in rats. To analyze the pathogenesis, UA was orally administrated to rats for 1, 4, 7, and 14 days, and sequential histopathological, genomic, and metabolomic analyses were performed on the heart, liver, and plasma. As a result, mitochondrial swelling of cardiomyocytes was observed on day 15 preceded by genomic upregulation on days 5 and 8. Of the focused gene groups, amino acid limitation–related genes represented by Mthfd2 showed numerically higher values or upregulation from day 5, which was sustained through the experimental period. On the contrary, oxidative stress–related genes were upregulated temporally on day 5. In metabolomic analysis, amino acids such as taurocholate and their metabolites fluctuated in concert with the upregulation of amino acid limitation–related genes in the heart, liver, and plasma. Moreover, accumulations of bile acids were manifested in all the tested tissues, while no histopathological change was seen in the liver. Increased bile acids might have an indirect effect on the myocardium; however, more detailed analysis is required. In conclusion, amino acid limitation was suggested as the pivotal toxic trigger of UA-induced cardiotoxicity.
Keywords
(+)-Usnic acid (UA), 2,6-diacetyl-7,9-dihydroxy-8,9bdimethyl-1,3(2H,9bH)-dibenzofurandione, is a strong uncoupler, and its pharmacological effect has been explained by the uncoupling of oxidative phosphorylation in mitochondria, characterized as stimulated oxygen consumption and induction of maximal stimulation of respiration (Johnson, Feldott, and Lardy 1950; Pramyothin et al. 2004). UA-induced toxicity has been investigated mainly in the liver, and a few reports have provided examples of potential toxicity in other organs such as skeletal muscular necrosis in sheep (Cook et al. 2007; Dailey et al. 2008). In our previous study, the myocardial change indicative of mitochondrial stress (mitochondrial swelling and increased expression of prohibitin) was revealed microscopically in rats following a 2-week repeated dosing (Yokouchi et al. 2015). Toxicogenomic analysis revealed upregulation of amino acid limitation and oxidative and endoplasmic reticulum (ER) stress–related gene groups (Yokouchi et al. 2015). Especially, the number of upregulated genes in the amino acid limitation–related gene group was larger than those in other groups. It was speculated that besides the mitochondrial and ER-originated stresses, amino acid limitation was one of the sources of oxidative stress.
The relationship between amino acid limitation and oxidative stress has been investigated. For example, Eisler, Frohlich, and Heidenreich (2004) reported that the starvation of essential amino acids induces apoptosis and oxidative stress in yeast. They found that protracted starvation of lysine or histidine in auxotrophic Saccharomyces cerevisiae resulted in an increased number of cells exhibiting DNA fragmentation, chromatin condensation, and an apoptotic phenotype. The starving cells rapidly exhibited indicators of oxidative stress, denoting that the starvation of essential amino acids evoked severe cell stress, which may be a trigger of programmed cell death (Eisler, Frohlich, and Heidenreich 2004). The upregulation of amino acid limitation–related genes caused by UA in the previous study possibly implied that the actual starvation of amino acids is followed by oxidative stress in cardiomyocytes (Yokouchi et al. 2015). However, the pathogenesis of UA-induced cardiomyocytes and related genetic changes remained unclear because of the limited number of time points noted.
In the present study, we explored UA-induced myocardial changes sequentially by histopathological, genetic, and metabolomic analyses to obtain an initial change of the toxicity. In the metabolomic analysis, amino acids and their metabolites of the heart, liver, and plasma were analyzed. The liver is a pivotal organ for metabolism as well as one of the main target organs for UA, and plasma was analyzed as a primary carrier of metabolites.
Materials and Methods
Animals and Experimental Design
Sixty-four female F344/DuCrlCrlj rats aged 7 weeks were obtained from Charles River Japan, Inc. (Kanagawa, Japan). The animals were housed under controlled conditions (24°C ± 2°C temperature, 40–70% relative humidity, 12hr:12hr light–dark cycle) and fed a standard laboratory diet (CRF-1) from Oriental Yeast Co., Ltd. (Tokyo, Japan) and water ad libitum during the experimental period. After an acclimation period of 1 week, animals were randomly divided into 8 groups of 8 animals each. Four groups were defined as treatment groups, and the animals were orally administered 100 mg/kg of UA (Wako Pure Chemical Industries, Ltd., Osaka, Japan) once daily for 1, 4, 7, or 14 consecutive days. The dose level was set based on the previous study in which UA clearly exhibited histopathological and toxicogenomic changes (Yokouchi et al. 2015). The animals in the other 4 groups were orally treated with vehicle (0.5% methylcellulose, Wako Pure Chemical Industries, Ltd.) on the same schedule as the UA-treated groups. The 8 animals in each group were further subdivided into 2 groups of 4 animals each: a TOX group (for laboratory examination and histopathology) and OMICs groups (for electron microscopy, toxicogenomic, and metabolomic analyses). The first day of treatment was defined as day 1. On the next day of the final dosing (days 2, 5, 8, and 15), animals were euthanized by exsanguination under isoflurane anesthesia. All animals were observed for general conditions starting 1 hr after the treatment and continuing throughout the experimental period. Body weights were measured on days 1, 4, 7, and 15. Food consumption per cage was measured on days 1, 4, 7, and 15 and was divided by the number of animals in the cage to express the group mean value. The experimental protocol was approved by the Ethics Review Committee for Animal Experimentation of Daiichi Sankyo Co., Ltd. and was conducted in compliance with the law concerning the protection and control of animals (Japanese Law 105, October 1, 1973; revised on June 22, 2005).
Collection of Blood and Tissue Samples
Blood samples were collected from the abdominal aorta of rats under isoflurane anesthesia. After centrifugation, obtained plasma was immediately stored at −80°C until analysis and dispensed for blood chemistry and metabolomics analysis. The hearts and livers of the TOX groups were excised, macroscopically examined, and weighed. Organ-to-body weight percentages were calculated as relative weights. Tissues were fixed in 10% neutral-buffered formalin for light microscopy and immunohistochemistry. Since the increased staining intensity of prohibitin was diffusely observed and apparent in the left ventricular wall in the previous study (Yokouchi et al. 2015), a part of the left ventricular wall was collected for electron microscopy in OMICS groups. Samples for toxicogenomics and metabolomics were taken from the interventricular septum and the apex in combination with the residual left ventricular wall to supplement a shortage of samples for the analysis. Each sample included approximately 100 mg. The samples were collected immediately after exsanguination (within 3 min), wiped softly to reduce blood contamination, and immediately frozen in liquid nitrogen and stored at −80°C until analysis. For liver metabolomics analysis, approximately 100 mg samples were collected from left lateral lobes.
Blood Chemistry
Aspartate aminotransferase, alanine aminotransferase, lactate dehydrogenase and its isozymes, and creatine kinase were determined using an automatic analyzer (H7180, Hitachi High Tech, Tokyo, Japan).
Light Microscopy and Immunohistochemistry
The heart was trimmed longitudinally, and the liver was vertically trimmed. The trimmed samples were embedded in paraffin, sectioned at a thickness of 4 μm, and stained with hematoxylin and eosin (H&E). According to the manufacturer’s instructions, using a 2-step peroxidase 3,30-diaminobenzidine staining technique with a DAKO Envision+ Kit (DAKO Japan, Tokyo, Japan), the heart sections were also prepared for immunohistochemistry against prohibitin to detect the imbalanced mitochondrial function in myocardium. Mouse monoclonal antiprohibitin (Clone II-14-10, DAKO Japan) was used at a dilution of 1:75. The sections were counterstained with hematoxylin to visualize nuclear stainability of myocardium. Sections processed with replacement of primary antibody by Dako REAL™ Antibody Diluent (DAKO Japan) were used as a negative control. The findings were adopted when positive granules in the cytoplasm of cardiomyocytes were more than doubled compared to the control group.
Electron Microscopy
The left ventricles of the hearts in all animals of the OMICs groups were excised and cut into a few small pieces for electron microscopy (each approximately 1 mm × 1 mm × 1 mm in size). The tissues in the central portion of the left ventricle (in the middle of the apex and base and the middle layer of the myocardium, between the endocardium and epicardium) were minced, fixed in 2.5% glutaraldehyde in 0.1 M sodium phosphate buffer, postfixed in 0.1 M sodium phosphate buffered 2% osmium tetroxide, dehydrated through a graded ethanol series, and embedded in epoxy resin. Sections of approximately 1-μm thickness were prepared from epoxy resin tissue-bearing blocks and stained with toluidine blue to identify the target area. Ultrathin sections were cut from each of the 2 selected blocks of each animal, stained with uranyl acetate and lead citrate, and examined by an electron microscope.
RNA Extraction and Real-time Quantitative Reverse Transcriptase–Polymerase Chain Reaction (RT-PCR) Analysis
Obtained heart samples were homogenized with TRIzol® Reagent (Life Technologies, Carlsbad, CA), and the total RNA was isolated according to the manufacturer’s instructions. The total RNA was treated with deoxyribonuclease I (Takara, Shiga, Japan) in the manufacturer’s buffer supplemented with 10 mM dithiothreitol, 0.5 mM deoxyribonucleoside triphosphates, and 40U RNase inhibitor (Toyobo Life Science, Tokyo, Japan). Nine representative genes were selected based on the previous study (Yokouchi et al. 2015). They were classified into 3 gene groups including 3 genes each: amino acid limitation–related genes (methylenetetrahydrofolate dehydrogenase 2, methenyltetrahydrofolate cyclohydrolase [Mthfd2], asparagine synthetase [Asns], and activating transcription factor 5 [Atf5]), oxidative stress–related genes (NAD(P)H dehydrogenase, quinone 1 [Nqo1], thioredoxin reductase 1 [Txnrd1], and sulfiredoxin 1 homolog [Srxn1]), and ER stress–related genes (caspase 4, apoptosis-related cysteine peptidase [Casp4], tribbles homolog 3 [Drosophila] [Trib3], and DNA-damage inducible transcript 3 [Ddit3]). TaqMan gene expression assays were used as probes and primers and are summarized in Supplemental Table 1. The Entrez IDs and the gene symbols of each gene were retrieved from the website of the National Center for Biotechnology Information (http://www.ncbi.nlm.nih.gov/). The quantitative polymerase chain reactions (qPCRs) were performed using qPCR Mastermix Plus (Eurogentee, Philadelphia, PA). The program used was 50°C for 2 min and 95°C for 10 min with amplification in 40 cycles at 95°C for 15 s and 6°C for 1 min. Glyceraldehyde-3-phosphate dehydrogenase (GAPDH; Applied Biosystems, Foster City, CA) was used as an endogenous control.
Metabolomic Analysis
The metabolomics analysis was performed at Metabolon Inc. (Durham, NC). The detailed conditions of sample preparation and platform have been described in previous publications (Evans et al. 2009; Takei et al. 2010). In brief, the sample preparation process of the frozen heart, liver, and plasma was carried out using the automated MicroLab STAR® system (Hamilton Company, UT). The samples were then separated into 3 equal aliquots for analysis in 3 independent untargeted metabolic profiling platforms: ultrahigh-performance liquid chromatography/tandem mass spectrometry (UHPLC/MS/MS) optimized for basic species, UHPLC/MS/MS optimized for acidic species, and gas chromatography/mass spectrometry.
Statistical Analysis
All the quantitative data except for food consumption and metabolomic analysis were expressed as group mean ± standard deviation. Data of food consumption were shown in group means. Values for body weights, organ weights (absolute and relative heart and liver weights), blood chemistry, and real-time quantitative RT-PCR were employed with 2-way analysis of variance (ANOVA) to test the effect of treatment and time. A post hoc test (student’s t-test) was used to determine whether there was any significant difference between control and UA treatment at a given time point. These analyses were performed using Microsoft Office Excel 2003 (Microsoft, WA) and JMP® (SAS Institute Japan Ltd., Tokyo, Japan). A p value less than .05 (2-tailed) was considered to be significant in body weights, organ weights, and blood chemistry. In the real-time quantitative RT-PCR, the upregulated genes were given signals by the following criteria: (1) the mean signal intensity values were at least 1.5-fold higher than the concurrent control value and (2) a p value less than .05 (two-tailed) was statistically significant.
For the analysis of metabolomic data, we referred to previous publications (Evans et al. 2009; Takei et al. 2010). Natural log-transformed data were used to reduce the effect of any potential outliers in the data. A 2-way ANOVA with contrast comparisons was made between the means of each biochemical from the control and UA-treated groups and was calculated using either or both of the statistical analysis software programs: Array Studio 6.0 (Omicsoft Corp., NC) or ‘R’ (Version 3.3; http://cran.r-project.org/). Values were shown in UA-treated/control ratios. Missing values for a given metabolite were imputed with the observed minimum detection value on the assumption that they were below the limits of detection. Statistically significant signals were given when a p value was less than .05.
Results
Laboratory Examinations
No abnormal clinical signs were observed in any of the animals. In the UA-treated group, mean food consumption exhibited a numerically higher value from day 4 to day 15 as compared to the control group (Table 1). A two-way ANOVA was performed on body weight (treatment × time), absolute liver weight (treatment × time), relative liver weight (treatment × time), absolute heart weight (treatment × time), and relative heart weight (treatment × time). In absolute liver weight, the main effect of time, F(3, 24) = 14.05 and p < .001, main effect of treatment, F(1, 24) = 46.09 and p < .001, and treatment × time interaction, F(3, 24) = 3.08 and p = .0466, were observed. In relative liver weight, no effect of time, F(3, 24) = 2.20, ns, main effect of treatment, F(1, 24) = 46.25 and p < .001, and no treatment × time interaction, F(3, 24) = 3.00 and ns, were observed. In body weight and heart weight, no main effect of treatment was observed. In a post hoc test, the treated liver weights were significantly higher than those in the control groups from day 5 to day 15 (Table 2). In blood chemistry, no significant changes were observed in any of the examined parameters at the given time points (data not shown).
Body Weight and Food Consumption of Female Rats Receiving 1, 4, 7, or 14-day Oral Administration of (+)-Usnic Acid (UA).
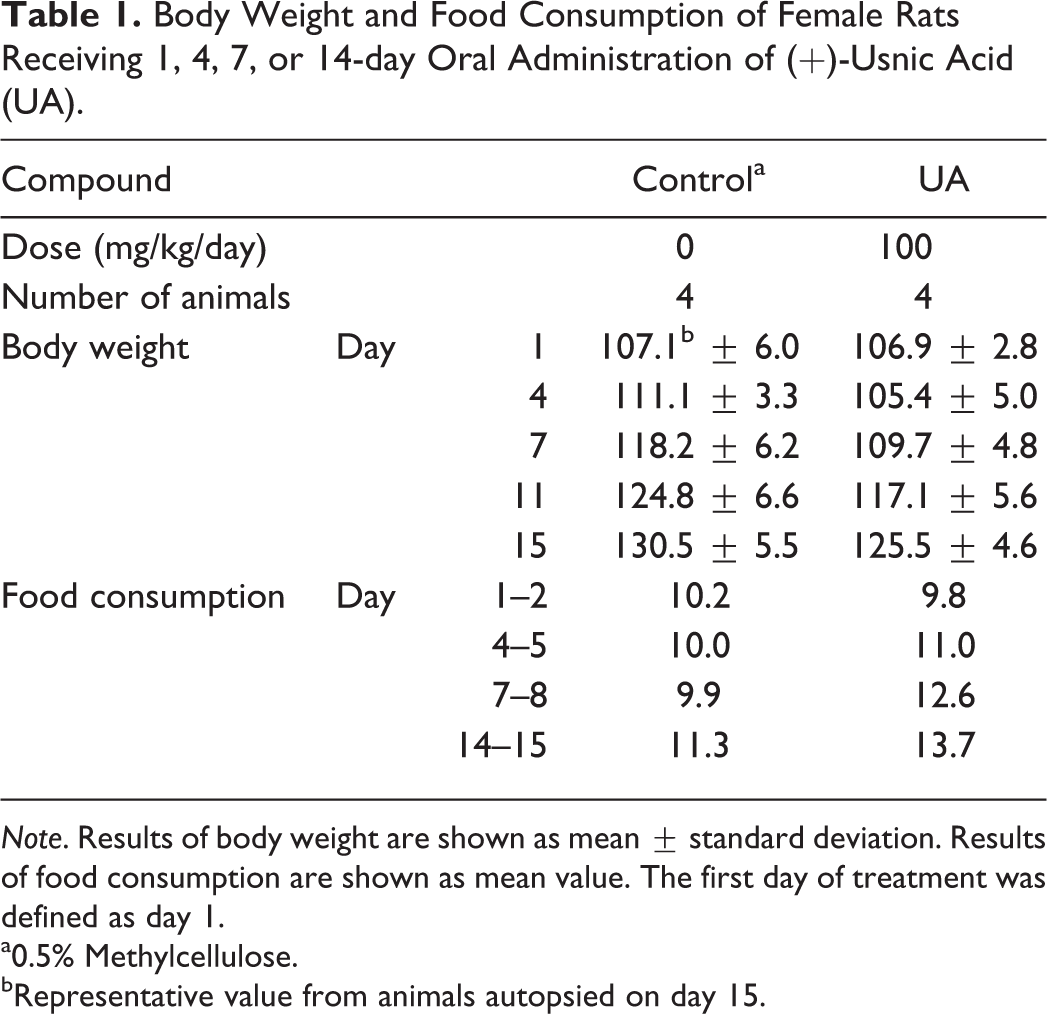
Note. Results of body weight are shown as mean ± standard deviation. Results of food consumption are shown as mean value. The first day of treatment was defined as day 1.
a0.5% Methylcellulose.
bRepresentative value from animals autopsied on day 15.
Heart and Liver Weights of Female Rats Receiving 1, 4, 7 or 14-day Oral Administration of (+)-Usnic Acid (UA).
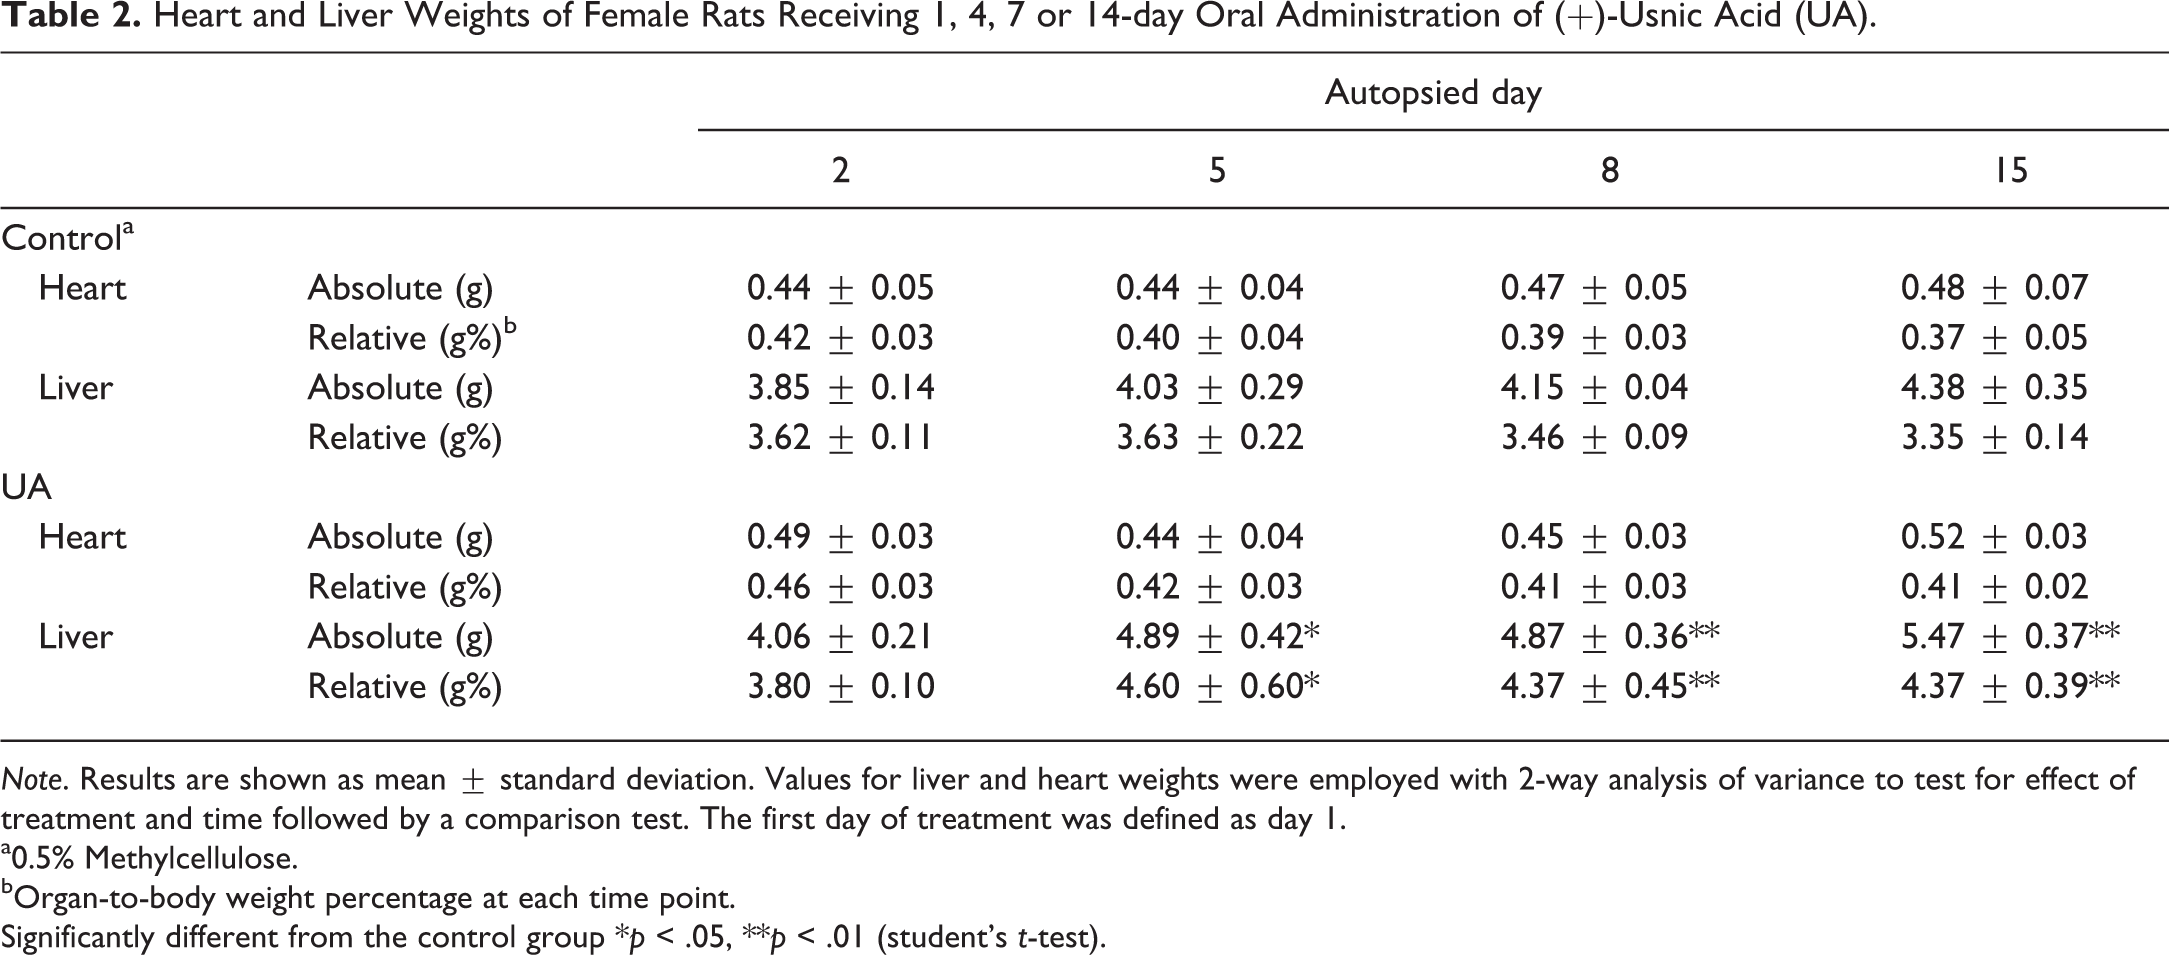
Note. Results are shown as mean ± standard deviation. Values for liver and heart weights were employed with 2-way analysis of variance to test for effect of treatment and time followed by a comparison test. The first day of treatment was defined as day 1.
a0.5% Methylcellulose.
bOrgan-to-body weight percentage at each time point.
Significantly different from the control group *p < .05, **p < .01 (student’s t-test).
Pathological Examination
The results of the pathological examination of the heart are summarized in Table 3. In the macroscopic and microscopic examinations using H&E-stained sections, no changes were found in the heart and liver (data not shown in the liver). Immunohistochemistry revealed an increased expression of prohibitin in the myocardium of the UA-treated groups on days 8 and 15. Increased expression of prohibitin was detected as an increased intensity and number of positive granules. Most of the granules were located in the sarcoplasmic area of myocytes (Figure 1). Additionally, some nuclei showed a positive reaction in all groups, but there was no apparent difference in the stainability between the control and UA-treated groups. In electron microscopy, swelling of mitochondria was diffusely observed in the myocardium in the UA-treated group on day 15. At higher magnification, an electron-lucent mitochondrial matrix and discrete cristae were also observed (Figure 2).
Histological and Ultrastructural Findings in the Heart of Female Rats Receiving 1, 4, 7 or 14-day Oral Administration of (+)-Usnic Acid (UA).
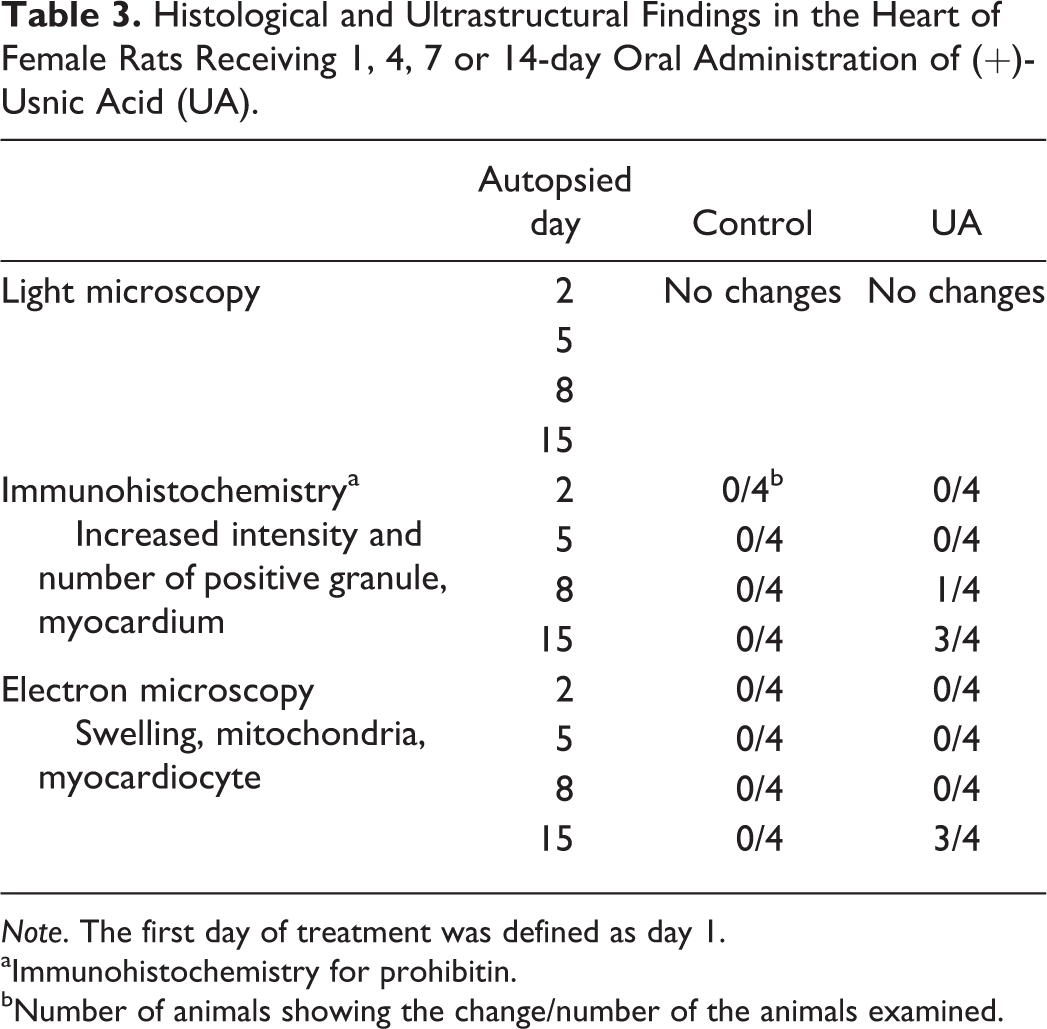
Note. The first day of treatment was defined as day 1.
aImmunohistochemistry for prohibitin.
bNumber of animals showing the change/number of the animals examined.
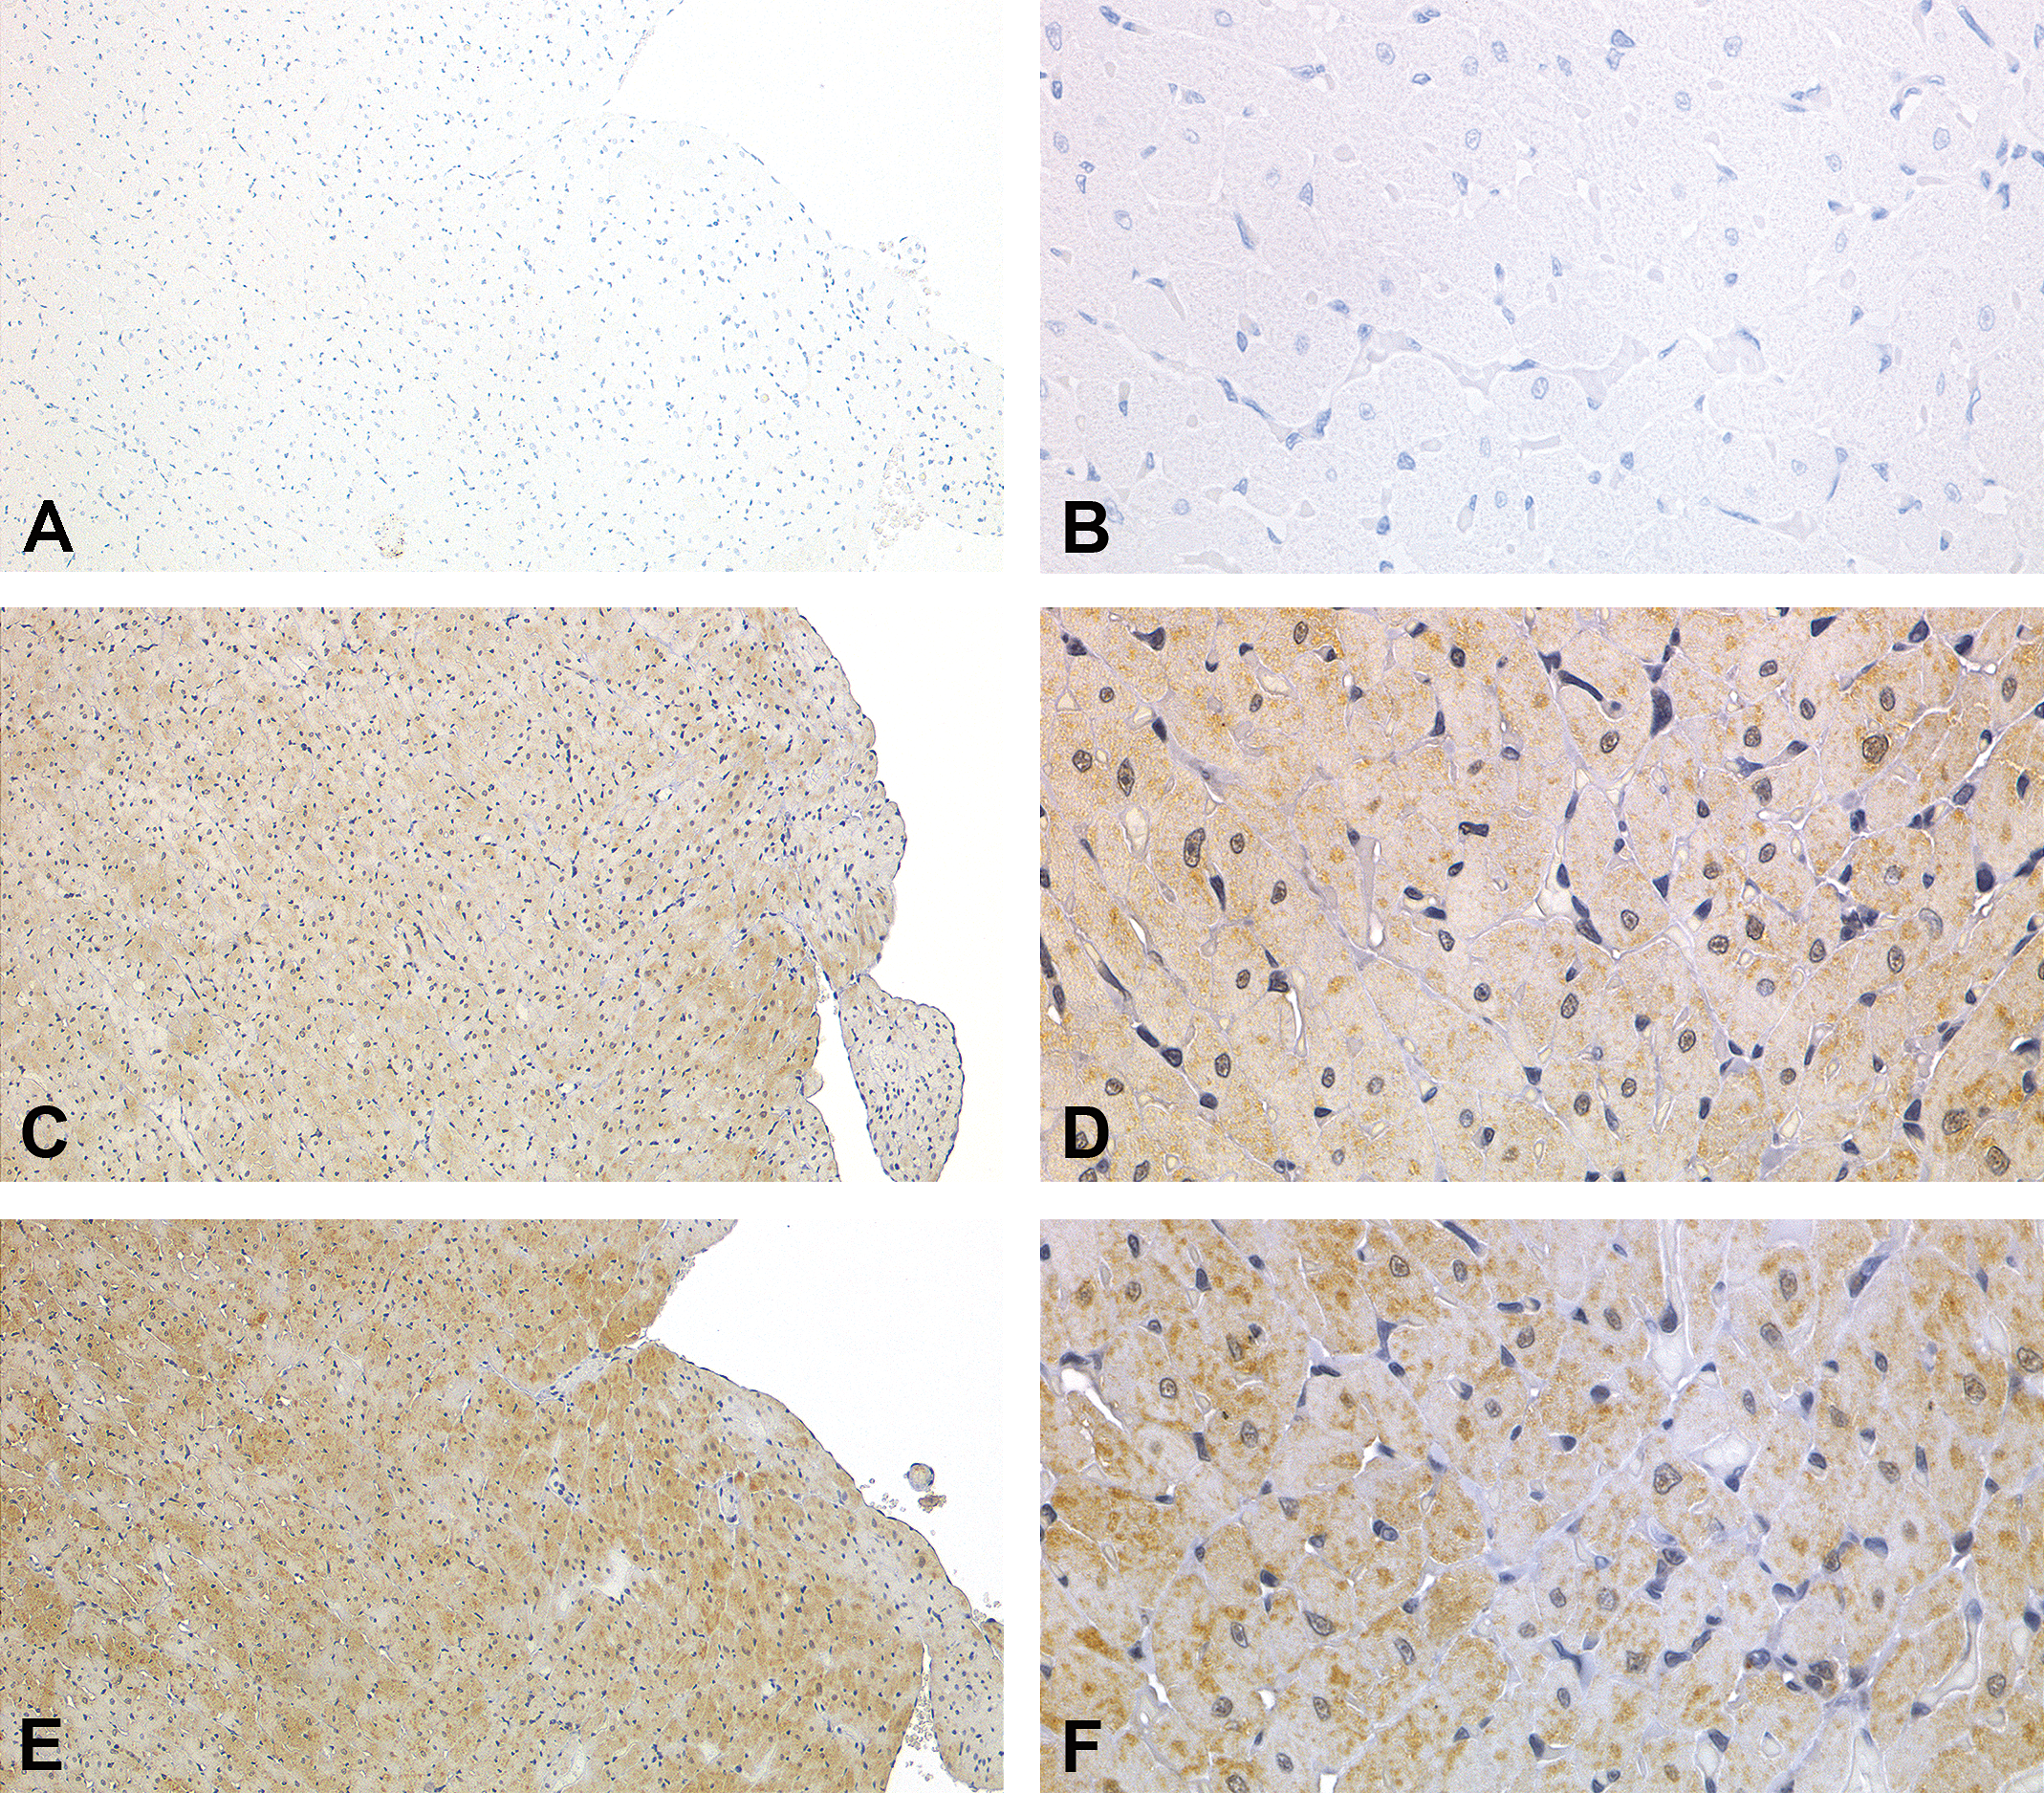
Immunohistochemistry for prohibitin in the left ventricular myocardium. Negative controls at low magnification (A) and high magnification (B) of the (+)-usnic acid (UA)-treated animal on day 15. The control animal at low magnification (C) and high magnification (D) on day 15. The UA-treated animal at lower magnification (E) and higher magnification (F) on day 15. Increased intensity and number of positive granules are observed in the sarcoplasmic area.
Representative ultrastructural appearance of the left ventricular myocardium of the animal autopsied on day 15. The control animal (A and B). The animal in the (+)-usnic acid (UA)-treated group (C and D). At lower magnification, swollen mitochondria are observed diffusely in the myocardium (C). At higher magnification, electron-lucent mitochondrial matrix and discrete cristae are observed (D).
Real-time Quantitative RT-PCR Analysis
A 2-way ANOVA was performed on all examined genes (treatment × time). The results are listed for each category of genes as follows.
Amino acid limitation–related genes (Figure 3)
Statistical significance was observed in Mthfd2 and Atf5 on days 8 and 15 and day 8, respectively. In addition, the UA-treated groups showed numerically higher Mthfd2, Asns, and Atf5 values than the control groups on day 5. For the expression of Mthfd2, the main effect of time, F(3, 24) = 3.39 and p = .034, main effect of treatment, F(1,24 = 25.73 and p < .001, and treatment × time interaction, F(3, 24) = 3.40 and p = .034, were observed. Post hoc t-tests revealed that the Mthfd2 expression of the UA-treatment group was significantly higher than that of the control group on days 8 and 15. For Atf5, no main effect of time, F(3, 24) = 1.40 and p = .266, main effect of treatment, F(1, 24) = 7.54 and p = .011, or treatment × time interaction, F(3, 24) = 1.40 and p = .266, were observed. Post hoc t-tests revealed that the Atf5 expression of the UA-treatment group was significantly higher than that of the control group on day 8. For Asns, no significant differences between the UA-treated and the control group were observed.
Real-time quantitative reverse transcriptase–polymerase chain reaction analysis for amino acid limitation–related genes. Mthfd2 in the (+)-usnic acid (UA)-treated group was significantly higher than that in the control group on days 8 and 15. Atf5 in the UA-treated group was significantly higher than that in the control group on day 8. The upregulated genes were given signals by the following criteria: the mean signal intensity values were at least 1.5-fold higher than the concurrent control value. *p < .05 defined to be statistically significant (student’s t-test).
Oxidative stress–related genes (Figure 4)
Nqo1 showed significant upregulation on day 5. Although there was no apparent upregulation for any of the four genes, but numerically higher values were obtained at all time points compared to the control group. For Nqo1, no effect of time, F(3, 24) = 1.59 and p = .22, main effect of treatment, F(1, 24) = 14.00 and p = .001, or treatment × time interaction, F(3, 24) = 1.80 and p = .17, were observed. Post hoc t-tests revealed that the Nqo1 of the UA-treatment group was significantly higher than that of the control group on days 5. For Txnrd1 and Srxn1, no significant differences between the UA-treated and the control groups were observed.
Real-time quantitative reverse transcriptase–polymerase chain reaction analysis for oxidative stress–related genes. Nqo1 in the (+)-usnic acid–treated group was significantly higher than that in the control group on day 5. The upregulated genes were given signals by the following criteria: the mean signal intensity values were at least 1.5-fold higher than the concurrent control value. *p < .05 defined to be statistically significant (student’s t-test).
ER stress–related genes (Figure 5)
There were no significant differences between the UA-treated and the control groups, whereas slightly higher values were seen for Casp4 and Trib3 on day 5 or after.

Real-time quantitative reverse transcriptase–polymerase chain reaction analysis for endoplasmic reticulum stress–related genes. No significant difference was observed between the (+)-usnic acid-treated and the control group.
Metabolomic Analysis
From the results of metabolomic analysis, amino acids, bile acids, and their metabolites are summarized in Tables 4 and 5, respectively. They exhibited notable changes as detailed below. Whole data of the plasma, heart, and liver are attached as Supplemental Tables 2, 3, and 4, respectively.
Heat Map of Sequential Metabolomic Analysis of Amino Acids in the Plasma, Heart, and Liver.
Note. The 2-way analysis of variance with contrast comparisons was made between the means of each biochemical from the control and (+)-usnic acid–treated groups. Red and green shaded cells indicate p ≤ .05 (red indicates that the mean values are significantly higher for that comparison and green indicates that values are significantly lower for that comparison). Data of black-shaded cells mean missing values for a given metabolite as below the limits of detection.
Heat Map of Sequential Metabolomic Analysis of Bile Acids in the Plasma, Heart, and Liver.
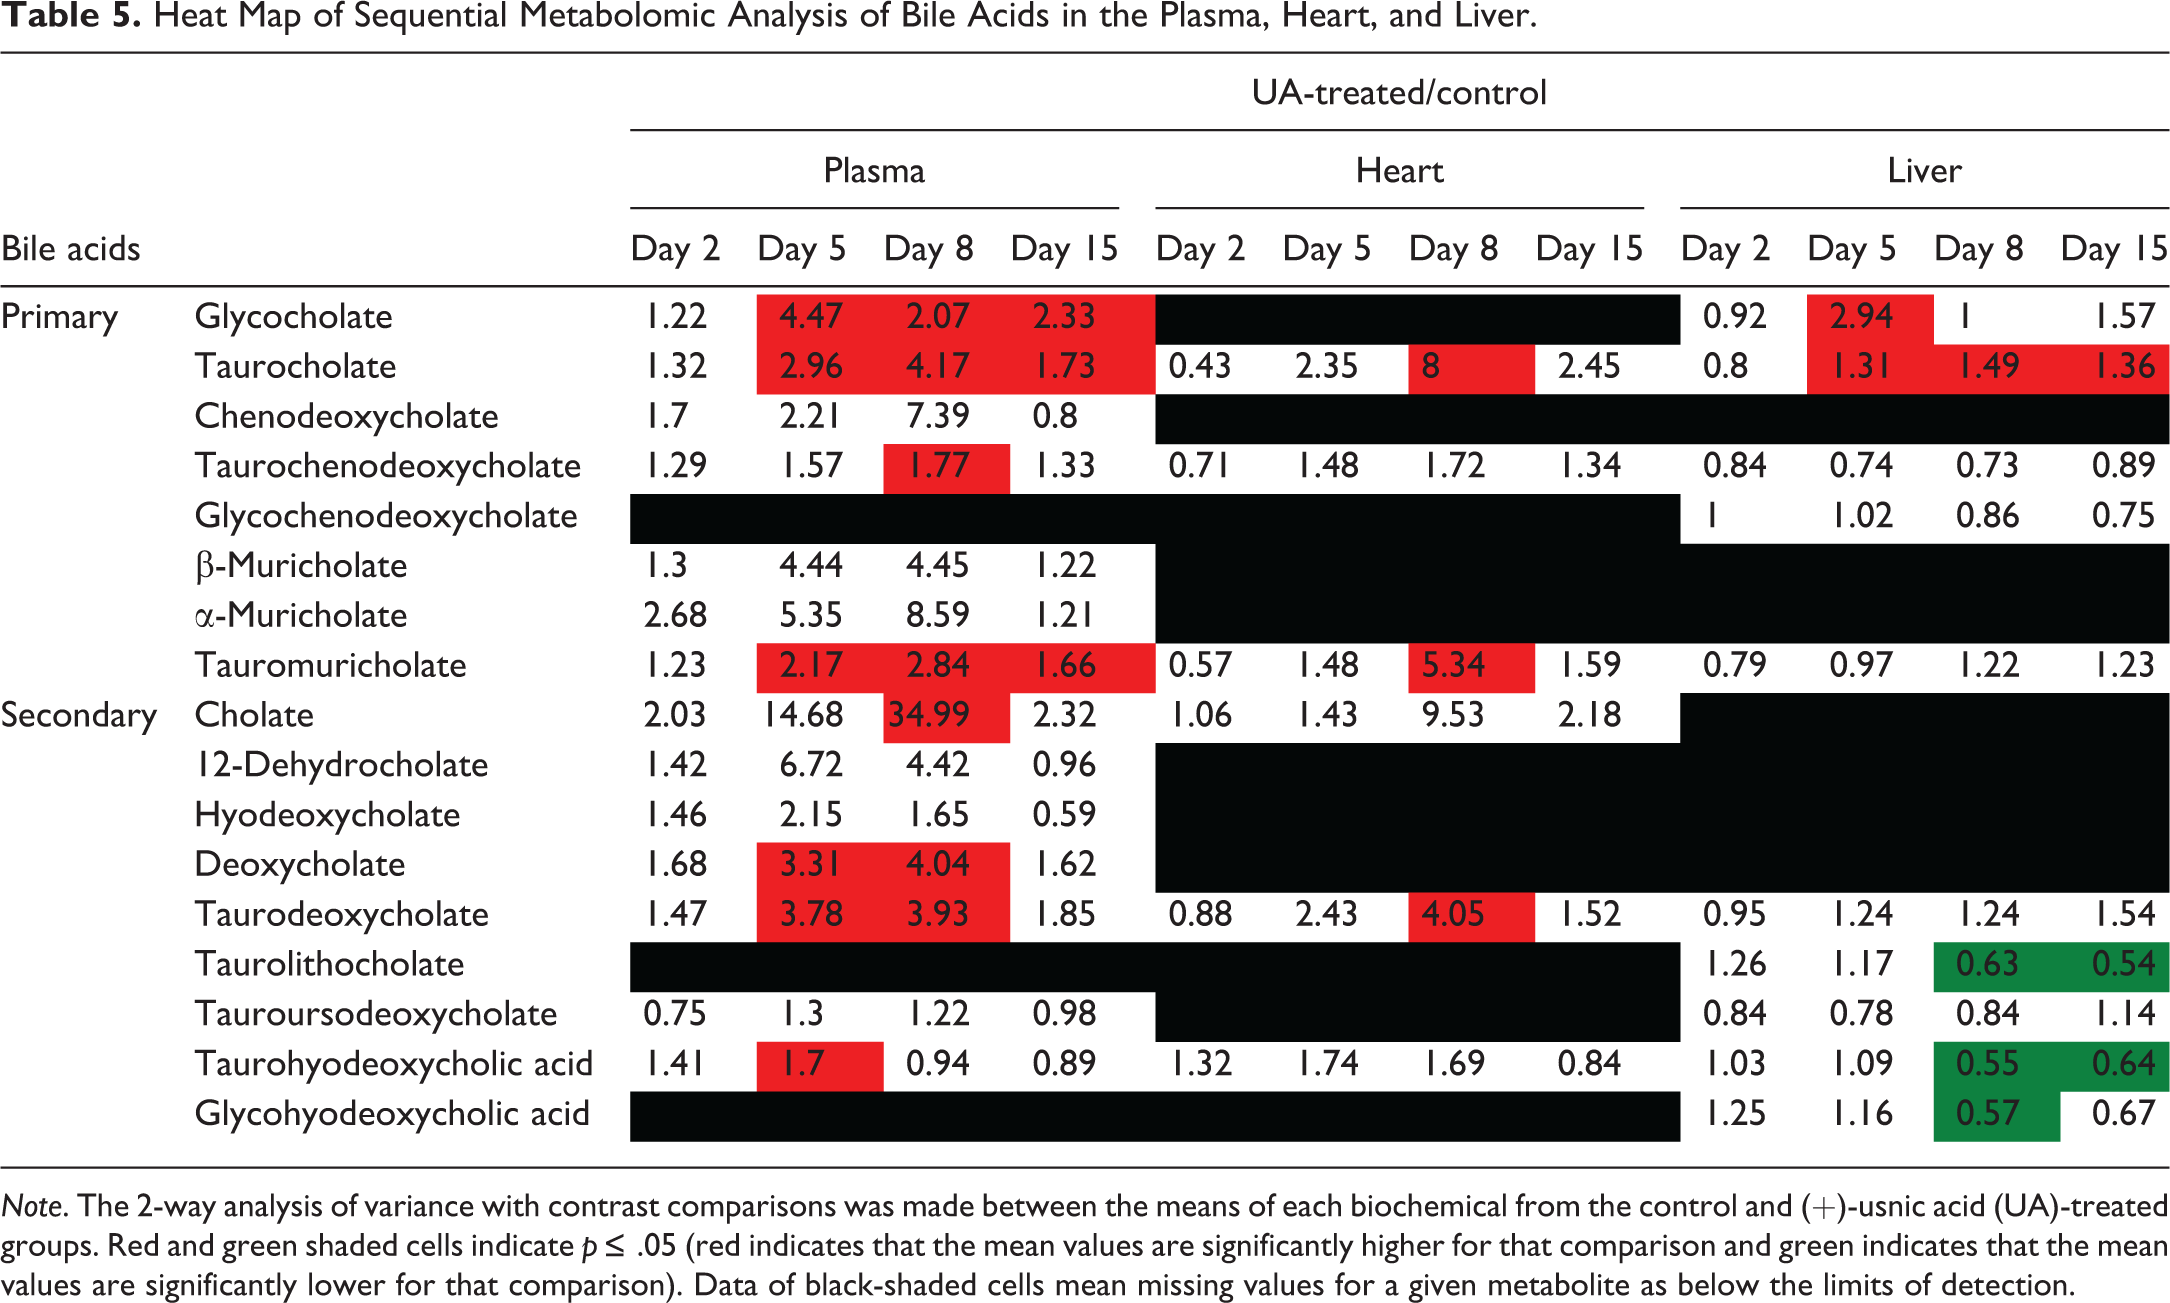
Note. The 2-way analysis of variance with contrast comparisons was made between the means of each biochemical from the control and (+)-usnic acid (UA)-treated groups. Red and green shaded cells indicate p ≤ .05 (red indicates that the mean values are significantly higher for that comparison and green indicates that the mean values are significantly lower for that comparison). Data of black-shaded cells mean missing values for a given metabolite as below the limits of detection.
Amino acid (Table 4)
In plasma, many of the amino acids, with the exception of tyrosine, decreased on day 2 regardless of their classification. Four kinds of amino acids (histidine, alanine, glycine, and phenylalanine) increased on day 5, but none of them continued to increase until day 15. On the contrary, tyrosine increased at all time points. In the heart, no notable change was observed on day 2, while histidine and glutamine showed decreases on days 8 and 15. Several glucogenic or ketogenic/glucogenic amino acids increased on days 8 and 15. Tyrosine showed an increase throughout the experimental period similar to that seen in plasma. In the liver, many kinds of amino acids decreased on days 8 and 15 regardless of their classification.
Bile acid (Table 5)
In plasma, several kinds of bile acids increased on days 5 and 8, and this change was sustained until day 15 for glycocholate, taurocholate, and tauromuricholate. In the heart, taurocholate, tauromuricholate, and taurodeoxycholate significantly increased or showed numerically higher values from day 5 to day 15. In the liver, taurocholate increased from day 5 to day 15. Meanwhile, several secondary bile acids showed decreases on days 8 and 15.
Discussion
In the present study, mitochondrial imbalance was suggested immunohistochemically on days 8 and 15, and ultrastructural findings of swollen mitochondria were noted on day 15. Increased expression of prohibitin has been considered to be the result of imbalanced oxidative phosphorylation and excessive formation of reactive oxygen species (ROS; Artal-Sanz and Tavernarakis 2009; Lee et al. 2010). Since upregulation of Nqo1 was seen from day 5, it was suggested that the production of ROS provoked increased staining intensity of prohibitin. In particular, amino acid limitation–related genes showed a significant increase on days 8 and 15 or numerically higher values on day 5. Metabolomics in the heart showed decreases in serine from day 5, and histidine and glutamine from day 8 implying that decreased amino acid supply might cause fluctuation of amino acid limitation genes. Furthermore, decreases of several kinds of amino acids were observed in plasma on day 2, and the amino acid balance fluctuated in the heart and liver on day 5. The influence of amino acid decrease was considered to be reflected in plasma first and subsequently extended to the heart and liver, while the cause of the time course difference was undetermined. Relevant factors might include inhibition of amino acid transport between plasma and cells by UA or secondary fluctuations affected by amino acid imbalance in plasma. Further investigation will be required to clarify this issue.
There are some reports referring to the correlation between amino acid deficiency, fluctuation of amino acid limitation–related genes, and mitochondrial swelling. Mthfd2 is known as an enzyme encoding mitochondrial NAD-dependent methylenetetrahydrofolate dehydrogenase cyclohydrolase, which plays a central role in the 1-carbon metabolism in mitochondria (Fox and Stover 2008; Bolusani et al. 2011). Histidine and serine are also kinds of primary metabolites of 1-carbon metabolism, a metabolic network in the cytoplasm, mitochondria, and the nuclei of cells. They generate and transfer 1 carbon for the de novo synthesis of purines, thymidylate, and methionine (Fox and Stover 2008). An abnormal activation of 1-carbon metabolism and hypermethylation of mtDNA has been suggested to contribute to the mitochondrial malfunction and decreased quality of polycystic ovary–derived oocytes in gilts (Jia et al. 2016). Overexpression of Mthfd2 with a deficiency of serine and histidine in the present study led us to the speculation that UA induced the losses of several amino acids in the plasma and heart and was followed by imbalance of 1-carbon metabolism leading to an adaptive Mthfd2 upregulation.
Glutamine deficiency has been reported to induce the expression of Atf5 mRNA at the posttranscriptional level in an in vitro model (Watatani et al. 2007). It has been reported that glutamine protects the mitochondrial structure and function in the condition of oxygen toxicity in a hyperoxia-exposed A549 cell model (Ahmad et al. 2001). These reports support the possibility that glutamine deficiency contributes to the increased expression of Atf5 following mitochondrial swelling.
Several factors rise as the cause of amino acid limitation. For instance, a shortage of food intake or an inhibition of uptake from the gastrointestinal tract could be a cause of amino acid imbalance. However, food consumption in the present study was similar between the UA-treated group and the control group. UA-induced inhibition of cellular transport of amino acids is worthy of being discussed. The relationship between oxidative phosphorylation (or uncoupler) and inhibition of amino acid transport has been reported. Amino acid transport in Bacillus subtilis is inhibited by an uncoupler (Nicholas and Ordal 1978; Brummett and Ordal 1977). In renal tubules afflicted with mitochondrial DNA mutation-derived oxidative phosphorylation disease, the abnormality of amino acid transport has been reported (Shoffner et al. 1995). However, amino acid transport of histidine, serine, and glutamine is mainly in cotransport with a sodium ion (Broer 2008) and does not depend on an active transport requiring ATP. Amino acid starvation by UA might be due to a direct disorder of amino acid transport independent of the uncoupling effect.
It was speculated that amino acids were excessively consumed by UA in the present study. Some types of amino acids can be modified directly via side-chain reactions with ROS. The most sensitive amino acids are those with aromatic side-chain groups such as phenylalanine, histidine, and tryptophan (Stadtman and Levine 2003). In our work, an oxidative stress–related gene (Nqo1) was upregulated on day 5, and histidine, a metabolite belonging to the aromatic side-chain groups, decreased on days 8 and 15 in the heart. This phenomenon might indicate that ROS affected the histidine oxidation following consumption in the myocardium.
Interestingly, metabolomic analysis showed increases in several bile acids such as taurocholate, tauromuricholate, and taurodeoxycholate in the heart, plasma, and liver from day 5 to day 15. Since bile acids are produced in the hepatocyte, it was speculated excessive production and/or leakage of them in the hepatocyte occurred—and there might be secondary influence to the myocardiocyte. However, the mechanism of this finding was unclear. There were no abnormal findings in blood biochemical parameters and histopathology in the liver. The inhibition of bile acid transport was hypothesized, but the present results were not sufficient to determine the reason. Bile acid accumulation and its effect in the cardiomyocyte have been reported. Taurodeoxycholic acid, which increased in the heart on day 8 in our study, induces alteration of mitochondrial bioenergetics in isolated cardiac mitochondria (Ferreira et al. 2005). In addition, it is well known that an accumulation of bile acids leads to cellular toxicity followed by necrosis or apoptosis via mitochondria (Palmeira and Rolo 2004). Since the mitochondrial permeability transition is induced by cytotoxic bile acids only if the mitochondrial inner boundary membrane is disrupted by the bile acids bound to the mitochondrial outer membrane, the mechanism of mitochondrial toxicity by bile acids is considered to be different from that of mitochondrial permeability transition pore by calcium overload (Schulz et al. 2013). In view of these insights, myocardial bile acid accumulation in the present study might have toxic effect on cardiac mitochondria, whereas the magnitude of these effects was unknown.
In conclusion, the sequential evaluation of UA-induced cardiotoxicity manifested that mitochondrial swelling was preceded by genomic/metabolomic fluctuations, and amino acid limitation has been suggested as a pivotal toxic trigger in the myocardium. Moreover, increased bile acids in the plasma might have an indirect effect on the myocardium.
Footnotes
Author Note
All authors are employed by Daiichi Sankyo Co., Ltd.
Acknowledgments
The authors are grateful to Keiko Okado of Daiichi Sankyo RD NOVARE Co., Ltd., for her technical assistance in the slide preparation for electron microscopy.
Author Contribution
All authors (YY, IM, KW, NN, KK) contributed to conception or design; data acquisition, analysis, or interpretation; drafting the manuscript; and critically revising the manuscript. All authors gave final approval and agreed to be accountable for all aspects of work in ensuring that questions relating to the accuracy or integrity of any part of the work are appropriately investigated and resolved.
Declaration of Conflicting Interests
The author(s) declared no conflicts of interest with respect to the research, authorship, and/or publication of this article.
Funding
The author(s) received no financial support for the research, authorship, and/or publication of this article.
References
Supplementary Material
Please find the following supplemental material available below.
For Open Access articles published under a Creative Commons License, all supplemental material carries the same license as the article it is associated with.
For non-Open Access articles published, all supplemental material carries a non-exclusive license, and permission requests for re-use of supplemental material or any part of supplemental material shall be sent directly to the copyright owner as specified in the copyright notice associated with the article.