
Abstract
Usnic acid (UA) is a multifunctional bioactive lichen secondary metabolite with potential anti-cancer properties. Although the promising therapeutic effects of UA have been investigated in different cancer cell lines, the mechanism driving UA-induced cell death has yet to be elucidated. As the type of cell death (apoptosis or autophagy) induced by UA may vary depending on the cancer cell type, we first studied the cytotoxic effects of UA in HEPG2 (HBV(−)) and SNU-449(HBV(+)) hepatocellular carcinoma (HCC) cell lines. HCC cell viability was considerably reduced in a dose-dependent manner at 12, 24, and 48 h after treatment with UA (p < 0.05). However, SNU-449 cells were more sensitive to UA than HEPG2 cells. UA also induced apoptotic cell death in HCC cells with cell cycle arrest at G0/G1 and G2/M phase depending on the genetic profile of each cell type. On the other hand, we observed acidic vesicular organelles in HCC cells after 36 h of UA treatment. Taken together, these findings suggest that UA stimulates apoptosis and autophagy in HEPG2 and SNU-449 cells without damaging normal control cells. Thus, UA might be a potential therapeutic compound for HCC treatment. However, there is a need for further studies investigating the death-promoting or preventing roles for autophagy and the molecular signaling mechanisms induced by UA treatment.
Introduction
Hepatocellular carcinoma (HCC) is the third leading cause of cancer-related deaths and is associated with chronic liver problems. 1,2 The most important risk factor for HCC development is cirrhosis. 3 Approximately 80% of HCC patients are infected with chronic hepatitis B virus (HBV) and/or hepatitis C virus (HCV). Additional factors such as age, obesity, alcohol use, and accompanying comorbidities contribute to the development of HCC. 4,5 Most HCC patients are diagnosed at an advanced stage and the 5-year survival rate remains low. Currently, surgical resection and chemotherapy are the most effective therapeutic options for the treatment of HCC. However, resistance to conventional chemotherapeutic agents, the heterogeneous structure of the tumor, and the metastatic and angiogenic potential of HCC tumor cells present a challenge for successful treatment strategies. 6,7 Novel therapeutic options are necessary to improve the survival rate, enhance the early detection, and minimize the risk of adverse response.
Natural products, which are potent bioactive compounds found in plants, have recently received increased attention as potential cancer therapies due to their unique antitumor activities and minimal side effects. 8 –12 In recent years, there has been a growing interest in lichen metabolites as anticancer agents due to their highly potent pharmaceutical activities. 13 –17 Usnic acid (UA) is one of the most extensively studied secondary lichen metabolites due to its anti-inflammatory, antimicrobial, antiviral, antioxidant, and anticancer properties. The potential anticancer effects of UA have been demonstrated in several tumor types including HCC, breast, nonsmall cell lung, colon, gastric, ovarian, and cervical human cancer cells. However, the antiproliferative effects of UA and induced cell death (apoptosis or autophagy) in human cancer cell lines have been shown to vary according to UA concentration and cell type. 18 –22 A better understanding of how UA induces apoptotic or autophagic cell death based on cell type, as well as determining the type of cell death in specific cancer cells, is required for the clinical evaluation of UA-based therapies.
In this study, we aimed to determine the cytotoxic and apoptotic effects of UA in HEPG2 and SNU-449 hepatocarcinoma cells compared with human umbilical vein endothelial cells (HUVECs).
Materials and methods
Materials
UA (≥98% purity), Dulbecco’s Modified Eagle’s Medium (DMEM), fetal bovine serum (FBS), penicillin-streptomycin, dimethyl sulfoxide (DMSO), and acridine orange were purchased from Sigma-Aldrich (St Louis, Missouri, USA). RPMI 1640 with L-glutamine was purchased from Lonza (Basel, Switzerland). The Muse® Annexin V, Dead Cell Assay Kit, and Cell Cycle Assay Kit were supplied by Millipore (Darmstadt, Germany). The WST-1 Cell Proliferation Kit was purchased from Boster Bio (Pleasanton, CA, USA).
Cell culture
The HepG2 (HB-8065™) and SNU-449 (CRL-2234™) were supplied from Professor Mehmet Ozturk, Dokuz Eylul University, Faculty of Medicine Basic Medical Sciences Department of Medical Biology. HUVEC (CRL-1730™) cell lines obtained from American Type Culture Collection. HEPG2 and HUVEC cells were cultured in DMEM supplemented with 10% FBS and 1% penicillin-streptomycin. 23 SNU-449 cells were cultured RPMI-1640 medium supplemented with 10% FBS and 1% penicillin-streptomycin. HEPG2, HUVEC, and SNU-449 cell lines cultured at 37°C in a humidified atmosphere of 95% air and 5% CO2.
Determination of cytotoxicity
A 0.0145 M (0.1 mg) stock solution of UA was prepared in less than 2% concentration of DMSO and stored at +4°C. The cell viability was determined by WST-1 assay. Briefly, the HEPG2 cells were seeded into 96-well plates at a density of 3 × 10⁴ cells/well, whereas SNU-449 and HUVECs were seeded at 2 × 10⁴ cells/well and incubated overnight. Then, the cells treated with a series of UA concentrations (6.25–100 µM) for 12, 24, and 48 h. After the incubation, 10 μL of WST reagent was added to each well and incubated for 1–4 h in a humidified atmosphere. Finally, absorbance was measured at wavelength of 450 nm using a multimode microplate Reader (Berthold Technologies, Bad Wildbad, Germany).
Determination of apoptosis
To determine the apoptotic effect of UA on HEPG2, SNU-449, and HUVECs, cells from each cell line were cultured into six-well plates (1 × 10⁵/each well). Then, the cells were treated with 12.5, 25, 50, and 100 µM of UA for 48 h. Afterward, the cells were collected at 2000 ×g for 5 min, washed twice with cold phosphate buffered saline (PBS), and stained with Annexin V and Dead Cell Assay Kit for at least 30 min in the dark and room temperature. Finally, cells were analyzed using a Muse® Cell Analyzer (Millipore).
Cell cycle analysis
The cells were seeded at 5 × 10⁵ cells/well into six-well plates. After the incubation, the cells were treated with increasing concentrations (12.5, 25, 50, and 100 µM) of UA for 48 h at 37°C. Then, the cells were fixed in 70% ethyl alcohol (EtOH) and stored at −20°C for 3 h. The fixed-cell pellets were washed with ice-cold PBS, collected by centrifugation (2000 ×g for 5 min) and were stained with Muse® Cell Cycle Assay Kit (Millipore) for 30 min in dark. Finally, the cells were analyzed with a Muse® Cell Analyzer (Millipore).
Determination of morphological changes
Morphological changes of HEPG2, SNU-449, and HUVECs after treatment with varying concentrations (12.5–100 µM) of UA were detected by staining with acridine orange/ethidium bromide (AO/EB). Cells were seeded in six-well plates (5 × 10⁵ cells/well) and treated with UA for 48 h. Afterward, the cells were fixed with 4% paraformaldehyde for 15 min at room temperature and then stained with AO/EB (100 μg/ml AO and 100 μg/ml EB) for 30 min in the dark. After staining, the cells were washed with PBS. The resulting images were recorded using a EVOS FL Cell Imaging System (Thermo Fisher Scientific, Waltham, Massachusetts, USA) and used to observe morphological features of apoptosis.
Detection of acidic vesicular organelles
Formation of acidic vesicular organelles (AVOs), a morphological characteristic of autophagy, was detected by AO staining. Briefly, HEPG2, SNU-449, and HUVECs were seeded into six-well plates and then treated with UA. Media were removed, and the cells were washed with PBS at 12, 24, 36, and 48 h after initial treatment. After washing, the cells were stained with 1 μg/ml AO for 15 min, washed with PBS, and immediately examined using a EVOS FL Cell Imaging System (Thermo Fisher Scientific).
Autophagy
To determine, measure, and discriminate between cytosolic and lipidated LC3, the Muse Autophagy LC3-antibody-based kit was used as per manufacturer instructions. HEPG2, SNU-449, and HUVECs were seeded in 96-well plates and treated with 12.5 and 25 µM of UA. These concentrations were chosen due to the induction of autophagic vacuoles confirmed by AO staining. Finally, the cells were analyzed with a Muse® Cell Analyzer (Millipore).
Statistical analysis
Statistical analysis was performed by using SPSS 20.00 (IBM Corp, New York, USA). All experiments were performed at least three times. The data were expressed as the means ± standard deviation (SD). The differences between groups were analyzed by one-way analysis of variance, and significance of differences was indicated.
Results
Effect of UA on cell viability
WST-1 analysis was carried out to detect the anti-tumor activity of UA in HCC (HEPG2 and SNU-449) and control cell (HUVEC) lines. As shown in Figure 1, UA inhibited cell proliferation in HepG2 and SNU-449 cell lines in a time-dependent manner (p < 0.05). The viability of HEPG2 and SNU-449 cells was reduced to 32.50% and 18.76% of the control, respectively, after treatment with 25 µM UA for 48 h (p < 0.05). However, the cell viability of HEPG2 and SNU-449 cells was decreased to 15.38% and 23.27% of the control, respectively, after treatment with 100 µM UA for 48 h (p < 0.05). After treatment with increasing concentrations of UA for 12, 24, and 48 h, a significant decrease in the viable number of HUVECs was not observed. The maximum inhibition rate was 18.82% and 23.25% at 50 µM and 75 µM UA, respectively (p < 0.05). Furthermore, we summarized the results with ANOVA table in Tables 1 –6. Thus, the HepG2 and SNU-449 cells were susceptible to UA treatment, while UA did not have a significant cytotoxic effect on HUVECs.
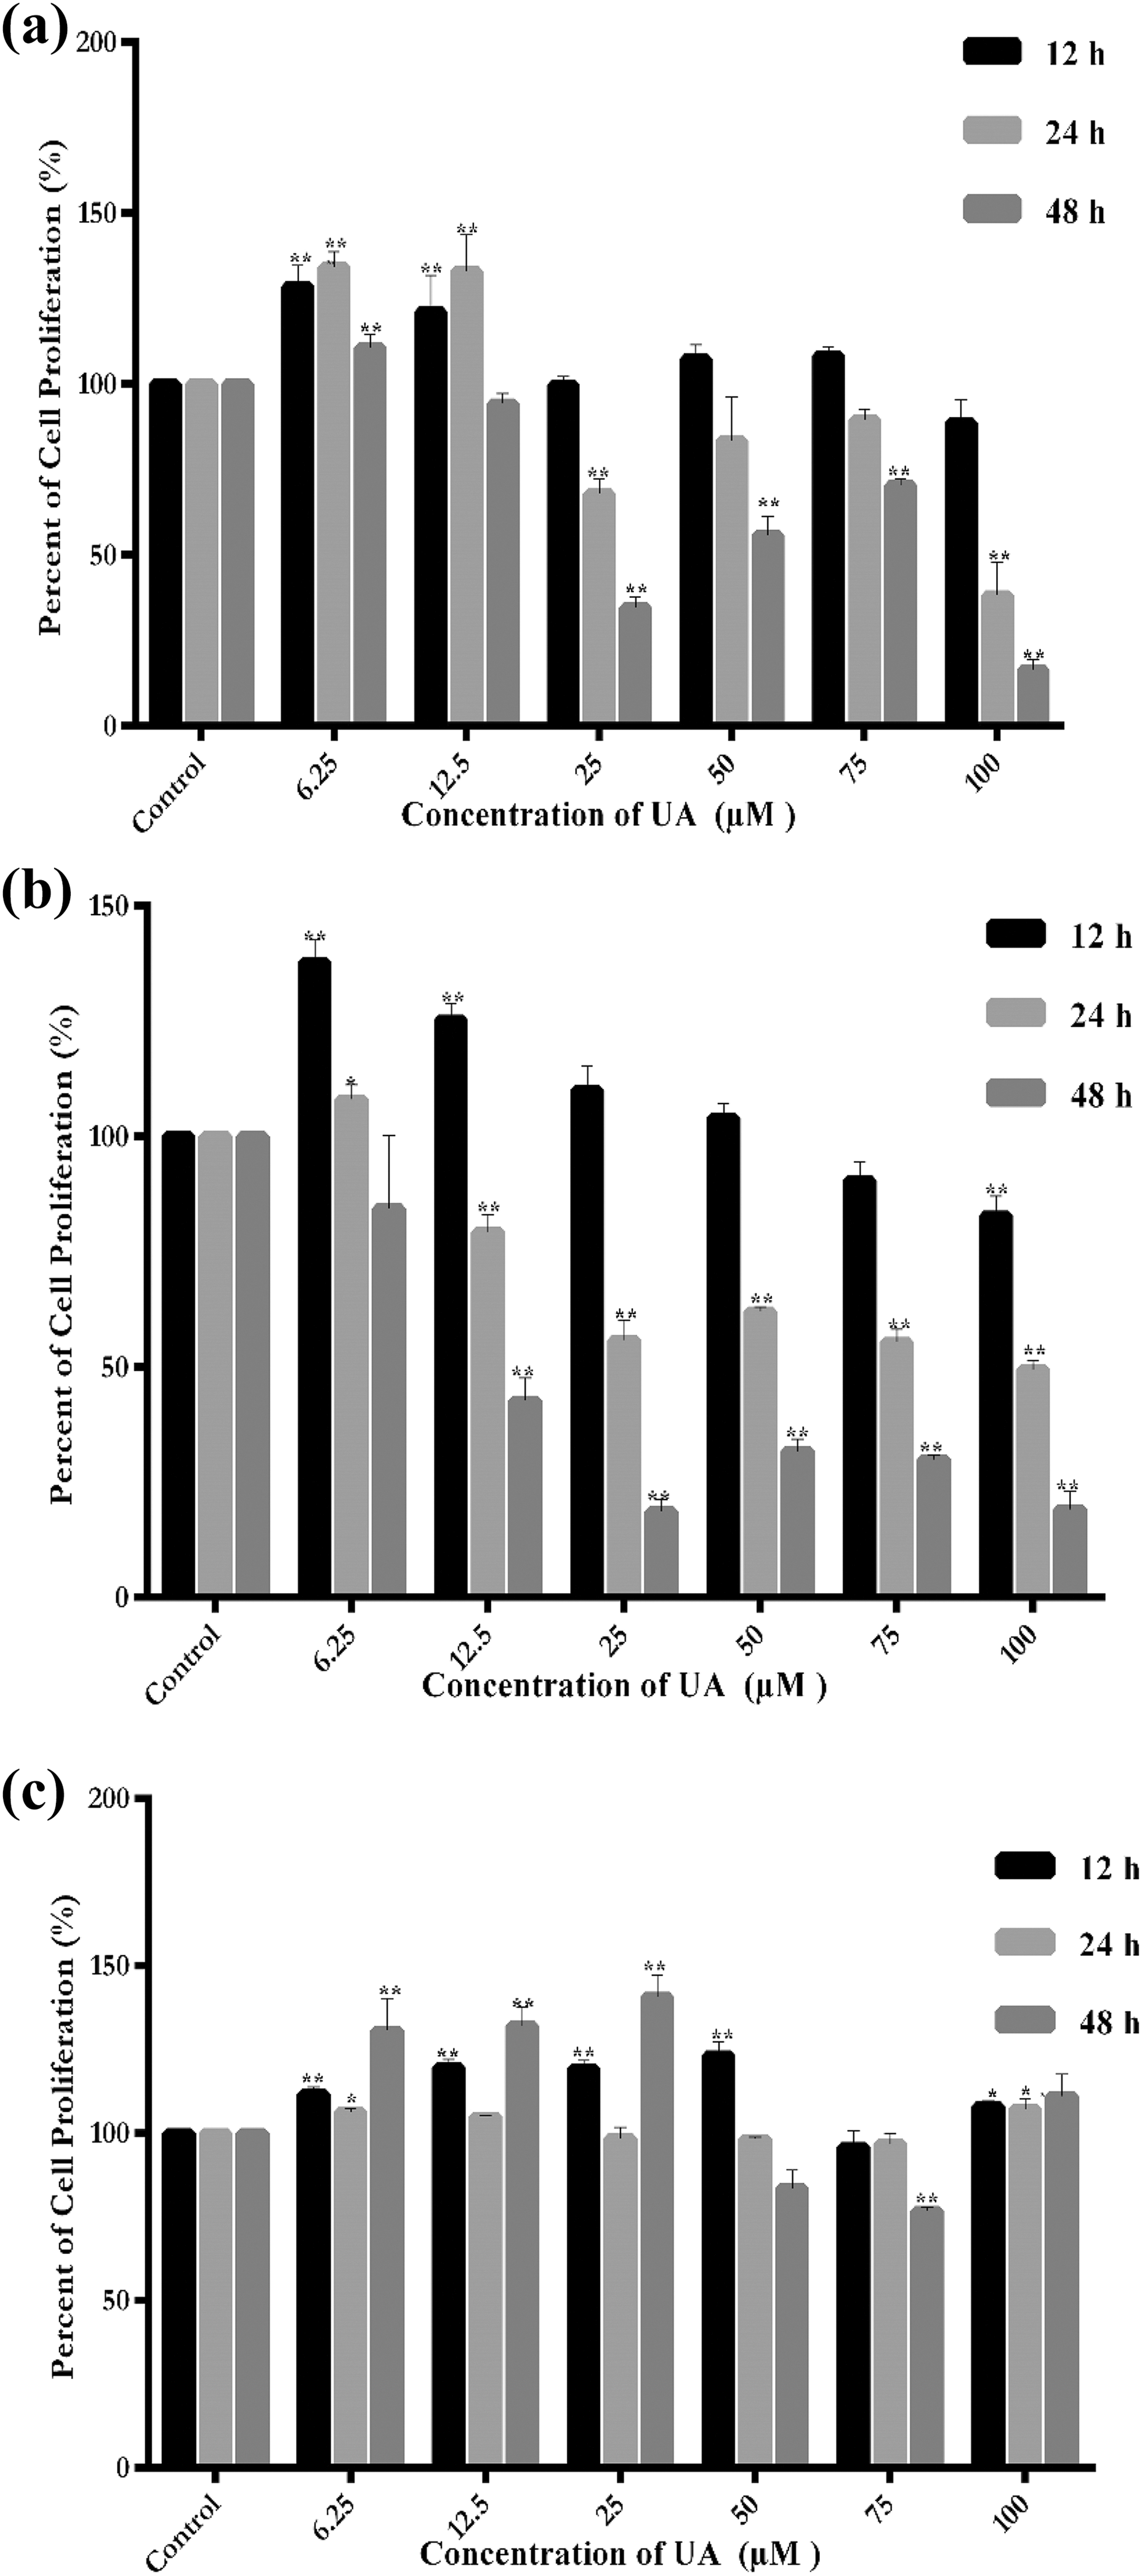
The cytotoxic effects of UA on (a) HEPG2, (b) SNU-449, and (c) HUVEC cells after 12, 24, and 48 h incubation. Data represent the mean ± standard error. *indicates significant difference (*p < 0.05, ** p < 0.01) from control. UA: usnic acid; HUVEC: human umbilical vein endothelial cell.
One-way ANOVA results in HEPG2 cell line.

ANOVA: analysis of variance.
Multiple comparisons of UA in HEPG2 cell line.
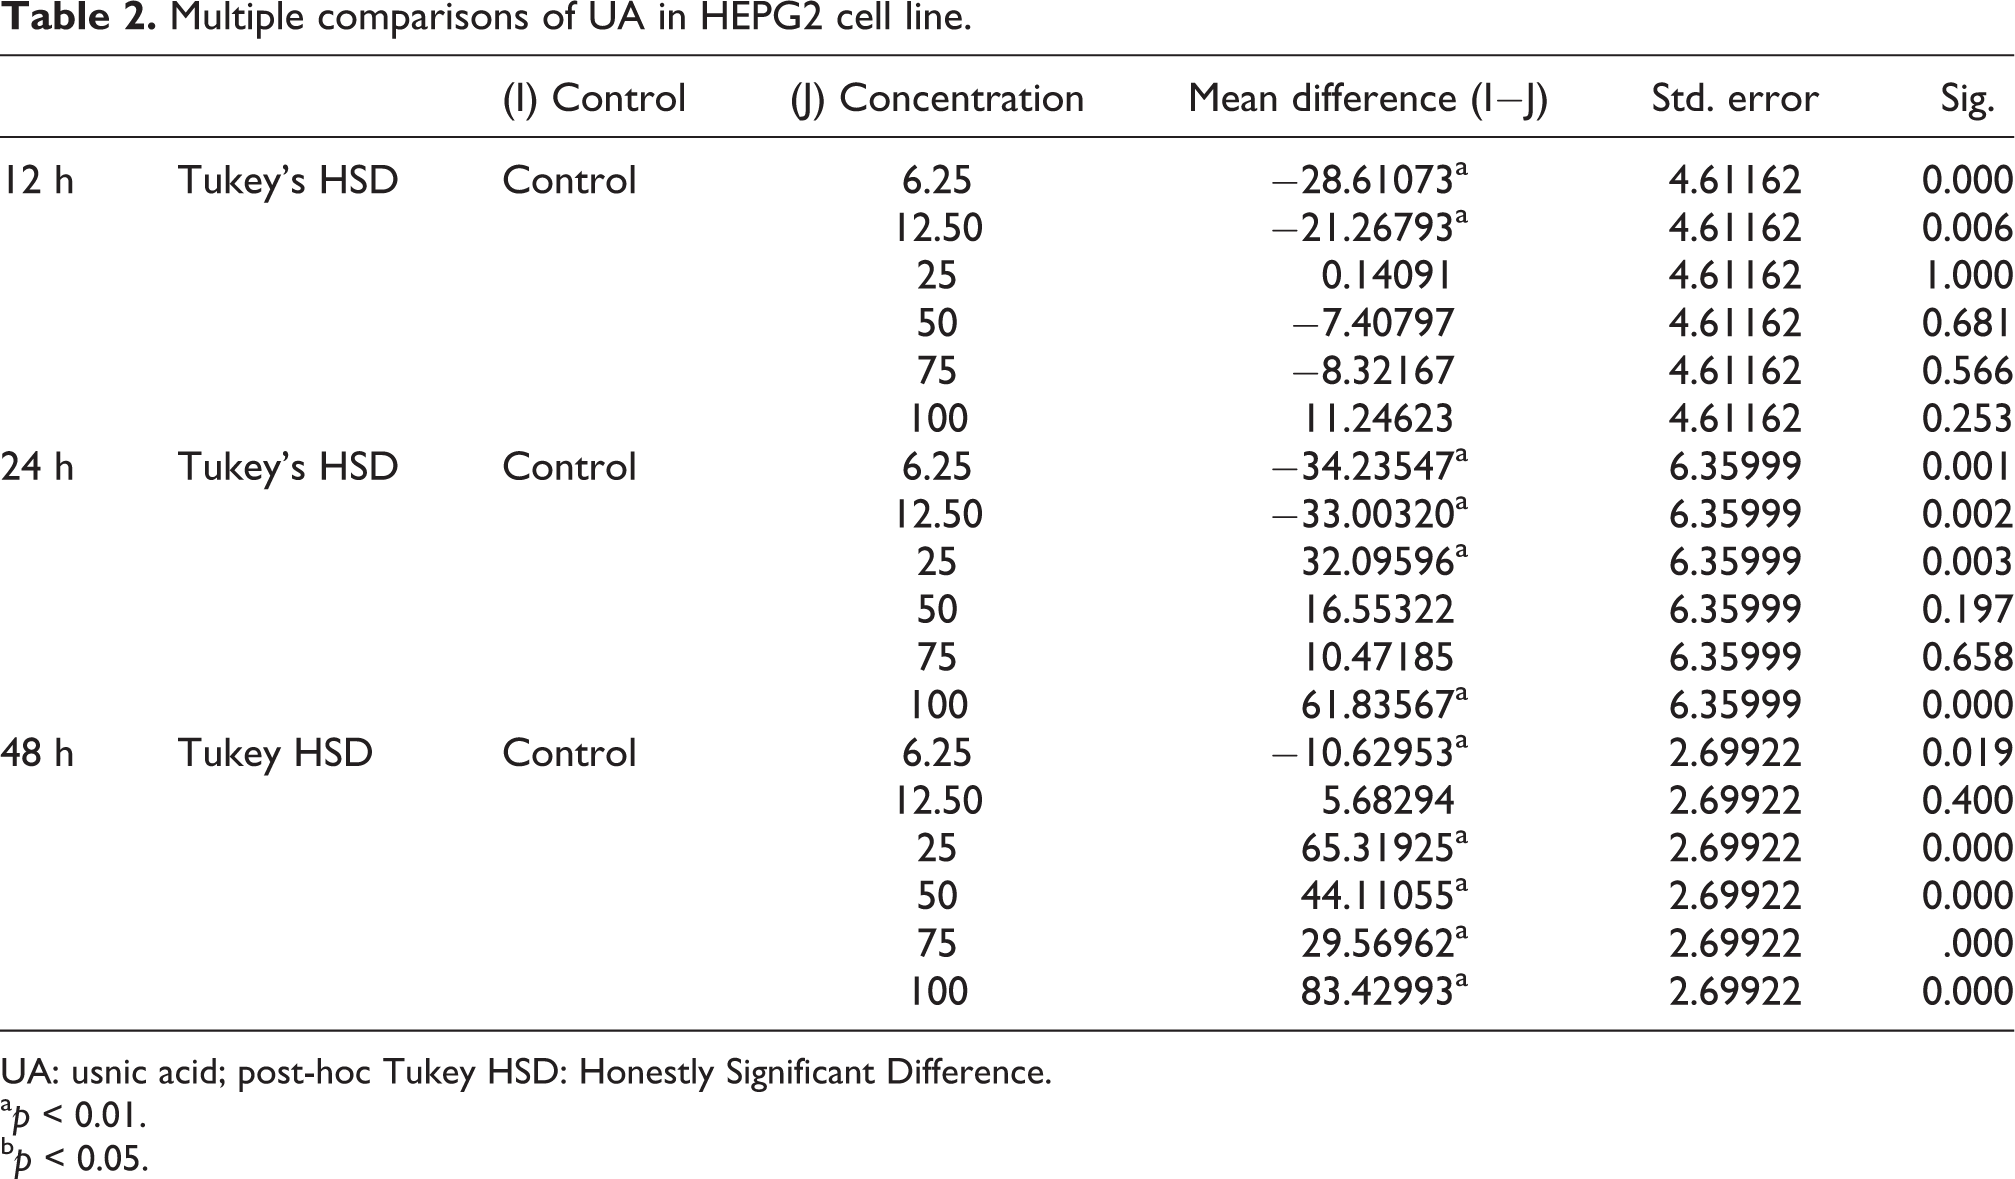
UA: usnic acid; post-hoc Tukey HSD: Honestly Significant Difference.
a p < 0.01.
b p < 0.05.
One-way ANOVA results in SNU-449 cell line.
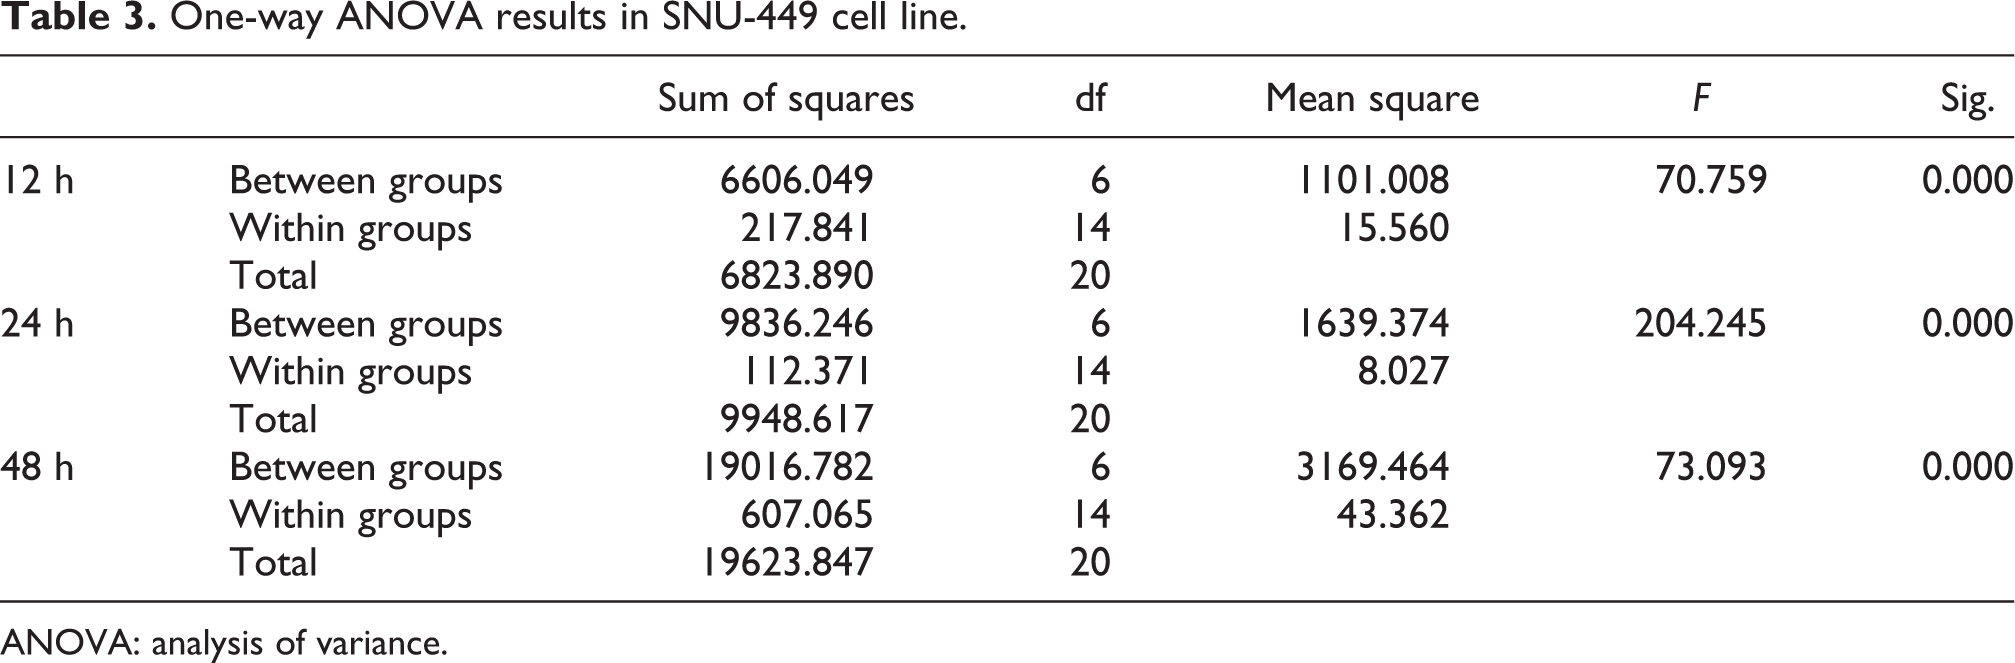
ANOVA: analysis of variance.
Multiple comparisons of UA in SNU-449 cell line.

UA: usnic acid.
a p < 0.01.
b p < 0.05.
One-way ANOVA results in HUVEC cell line.

ANOVA: analysis of variance; HUVEC: human umbilical vein endothelial cell.
Multiple comparisons of UA in HUVEC cell line.

UA: usnic acid; HUVEC: human umbilical vein endothelial cell.
a p < 0.01.
b p < 0.05.
Effect of UA on apoptosis
The Annexin V results demonstrated that the percentage of early and late apoptosis in HCC cells was increased in dose-dependent manner (Figure 2). Treatment with 25 µM UA induced 74.65 ± 0.9%, 56.24 ± 3.8%, and 2.70 ± 1.3% late apoptotic death in HEPG2, SNU-449, and HUVEC cell lines, respectively. The percentage of late apoptotic cell death in SNU-449 was less than in HEPG2 cells due to the percentage of dead and early apoptotic cells after treatment with 25 µM UA. The percentage of late apoptotic cells increased from 2.10 ± 0.7% to 82.84 ± 2.1% at 100 µM UA in HEPG2 cells, whereas late apoptotic cells were observed 88.67 ± 3.7% after treatment with 100 µM UA in SNU-449 cells. Furthermore, 88.95 ± 1.7% HUVECs were viable after treatment with 100 µM UA. These results indicate that treatment with UA induces apoptotic cell death in HCC cells but does not significantly damage HUVECs.

UA induced apoptosis in HEPG2, SNU-449, and HUVEC cells. Cells were seeded at 1 × 10⁵ cells per well in six-well plates and treatment with (a) control, (b) 12.5, (c) 25, (d) 50, and (e) 100 μM of UA for 48 h. UA: usnic acid; HUVEC: human umbilical vein endothelial cell.
Effect of UA on cell cycle
As shown in Figure 3, UA significantly induced cell cycle arrest at G0/G1 and G2/M phase in HCC and HUVECs in dose-dependent manner; 25 µM UA induced late apoptotic death G0/G1 arrest with an accumulation of 81.7 ± 1.0% and 58.4 ± 1.3% in HEPG2 and HUVECs, respectively. However, the G2/M cell population increased from 31.1 ± 1.2% to 47.6 ± 2.9% in SNU-449 cells. The accumulation of HEPG2 and HUVECs exposed to 100 μM UA in G0/G1 phase increased from 44.1 ± 1.7% and 31.7 ± 2.4% to 86.9 ± 1.1% and 95.4 ± 0.9%, respectively. However, the percentage of SNU-449 cells in G2/M phase was 48.6 ± 3.4% after 100 μM UA treatment. As a result, treatment with UA in HCC cell lines may be resulted in different arrest points, possibly due to differing genetic profiles. However, the considerable accumulation of HUVECs in G0/G1 phase probably resulted from growing healthy cell population.

Analysis of the HEPG2, SNU-449 and HUVEC cells in cell cycle phases G1, S, and G2/M. Histograms showed changes in cell cycle phases of cells treated with different concentration of UA for 48 h. (a) Control, (b) 12.5, (c) 25, (d) 50 and (e) 100 µM UA. UA: usnic acid; HUVEC: human umbilical vein endothelial cell.
Effects of UA on cell morphology
To observe morphological changes, AO/EB staining was carried out in HEPG2, SNU-449, and HUVECs treated with different concentrations of UA (Figure 4). In HEPG2 and SNU-449 cells, cytoplasmic and nuclear shrinkage as well as chromatin condensation and/or fragmentation, which are indicative of apoptosis (especially late apoptosis as indicated by the orange stained nuclei), were observed in response to UA treatment. Furthermore, many vacuoles (vacuolization) were observed in HCC cells treated with 12.5 µM and 25 µM UA for 48 h. However, noticeable changes (more similar morphology to control group) in SNU-449 cells were also observed after treatment with 25 µM UA. Chromatin condensation and cell rounding were occurred in SNU-449 cells. In HUVECs, the general morphology was similar to that of the control group. However, some early and late apoptotic and necrotic cells were also observed in response to UA treatment. Thus, UA treatment induced both early and late apoptosis in HCC cell lines. However, the mechanism driving vacuolization should be further investigated to determine the autophagic effects of UA treatment.
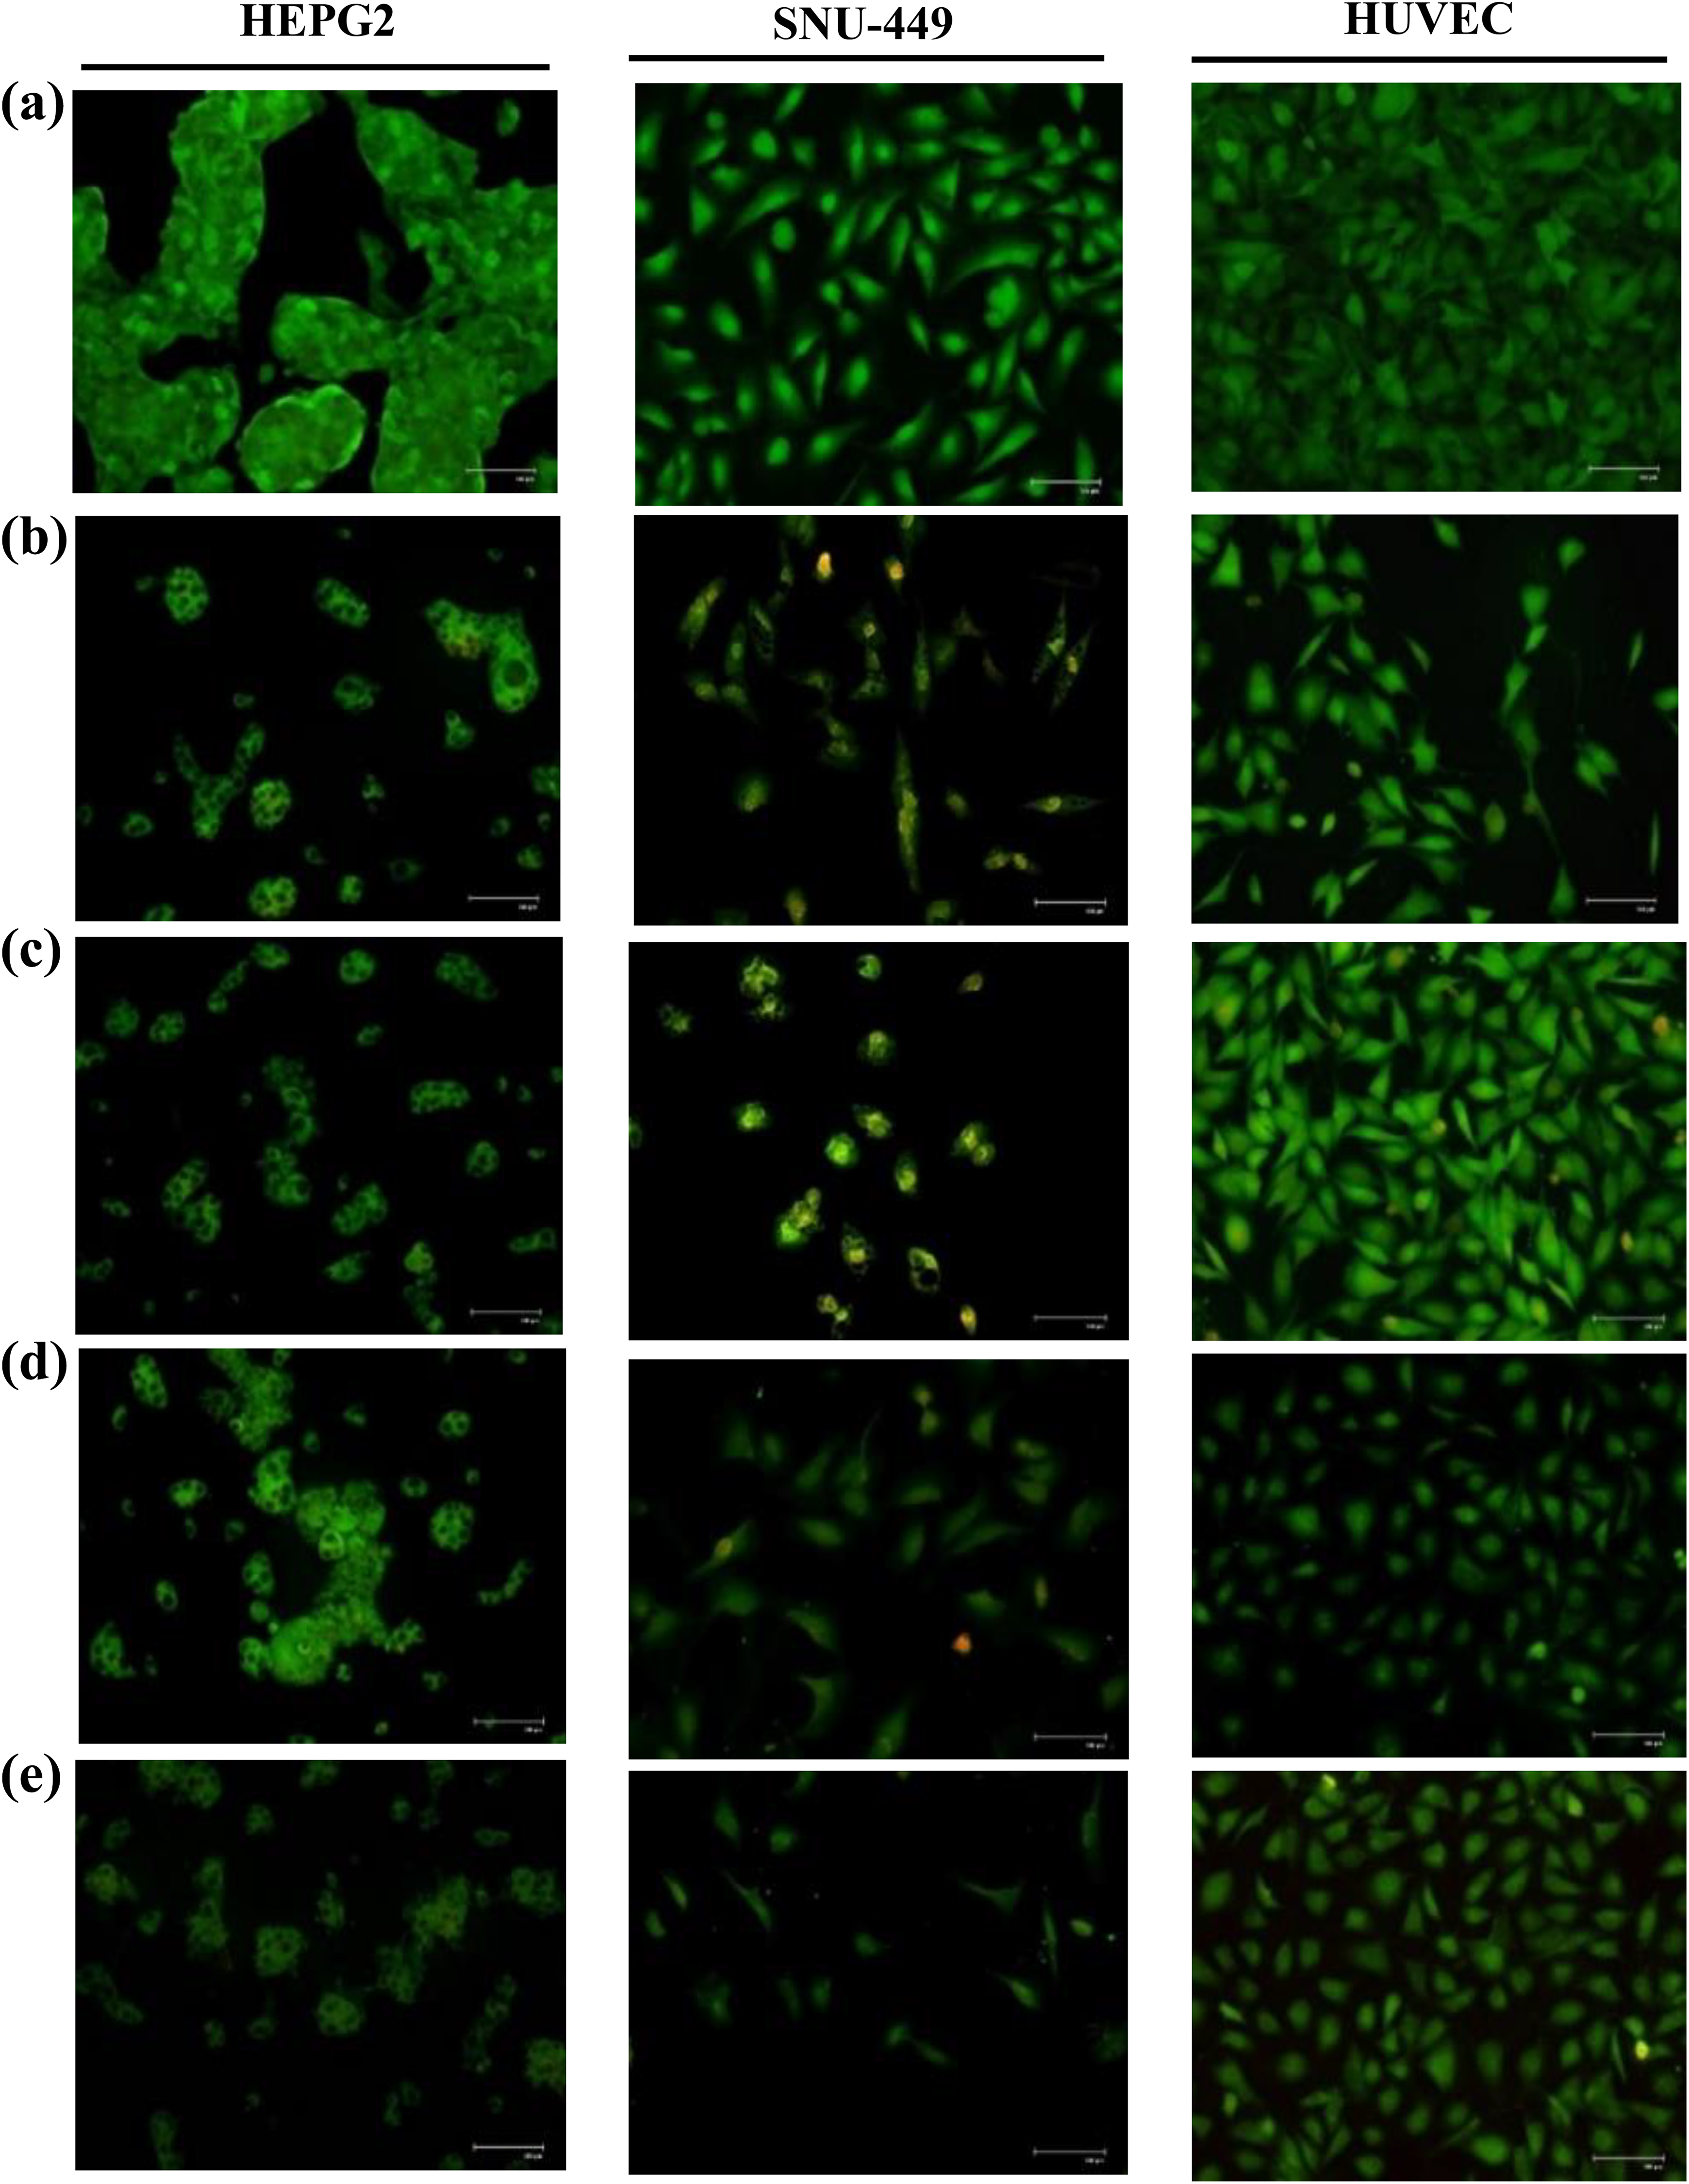
AO/EB double staining of HEPG2, SNU-449 and HUVEC cells. (a) Untreated cells, After treatment with (b) 12.5, (c) 25, (d) 50, and (e) 100 μM UA, respectively. UA: usnic acid; AO/EB: acridine orange/ethidium bromide; HUVEC: human umbilical vein endothelial cell.
Effect of UA on autophagy
AO staining revealed that UA treatment enhanced the formation of AVO in HEPG2 and SNU-449 cells, especially after treatment with 12.5 and 25 µM UA, as shown in Figure 5. Furthermore, the number and brightness of the AVO could be easily detected in HCC cells. No AVO positive HUVECs were observed after UA treatment. Thus, UA treatment resulted in AVO formation in HCC cell lines; however, AVO formation decreased following treatment with increasing concentration of UA. These results were supported by AO/EB staining.
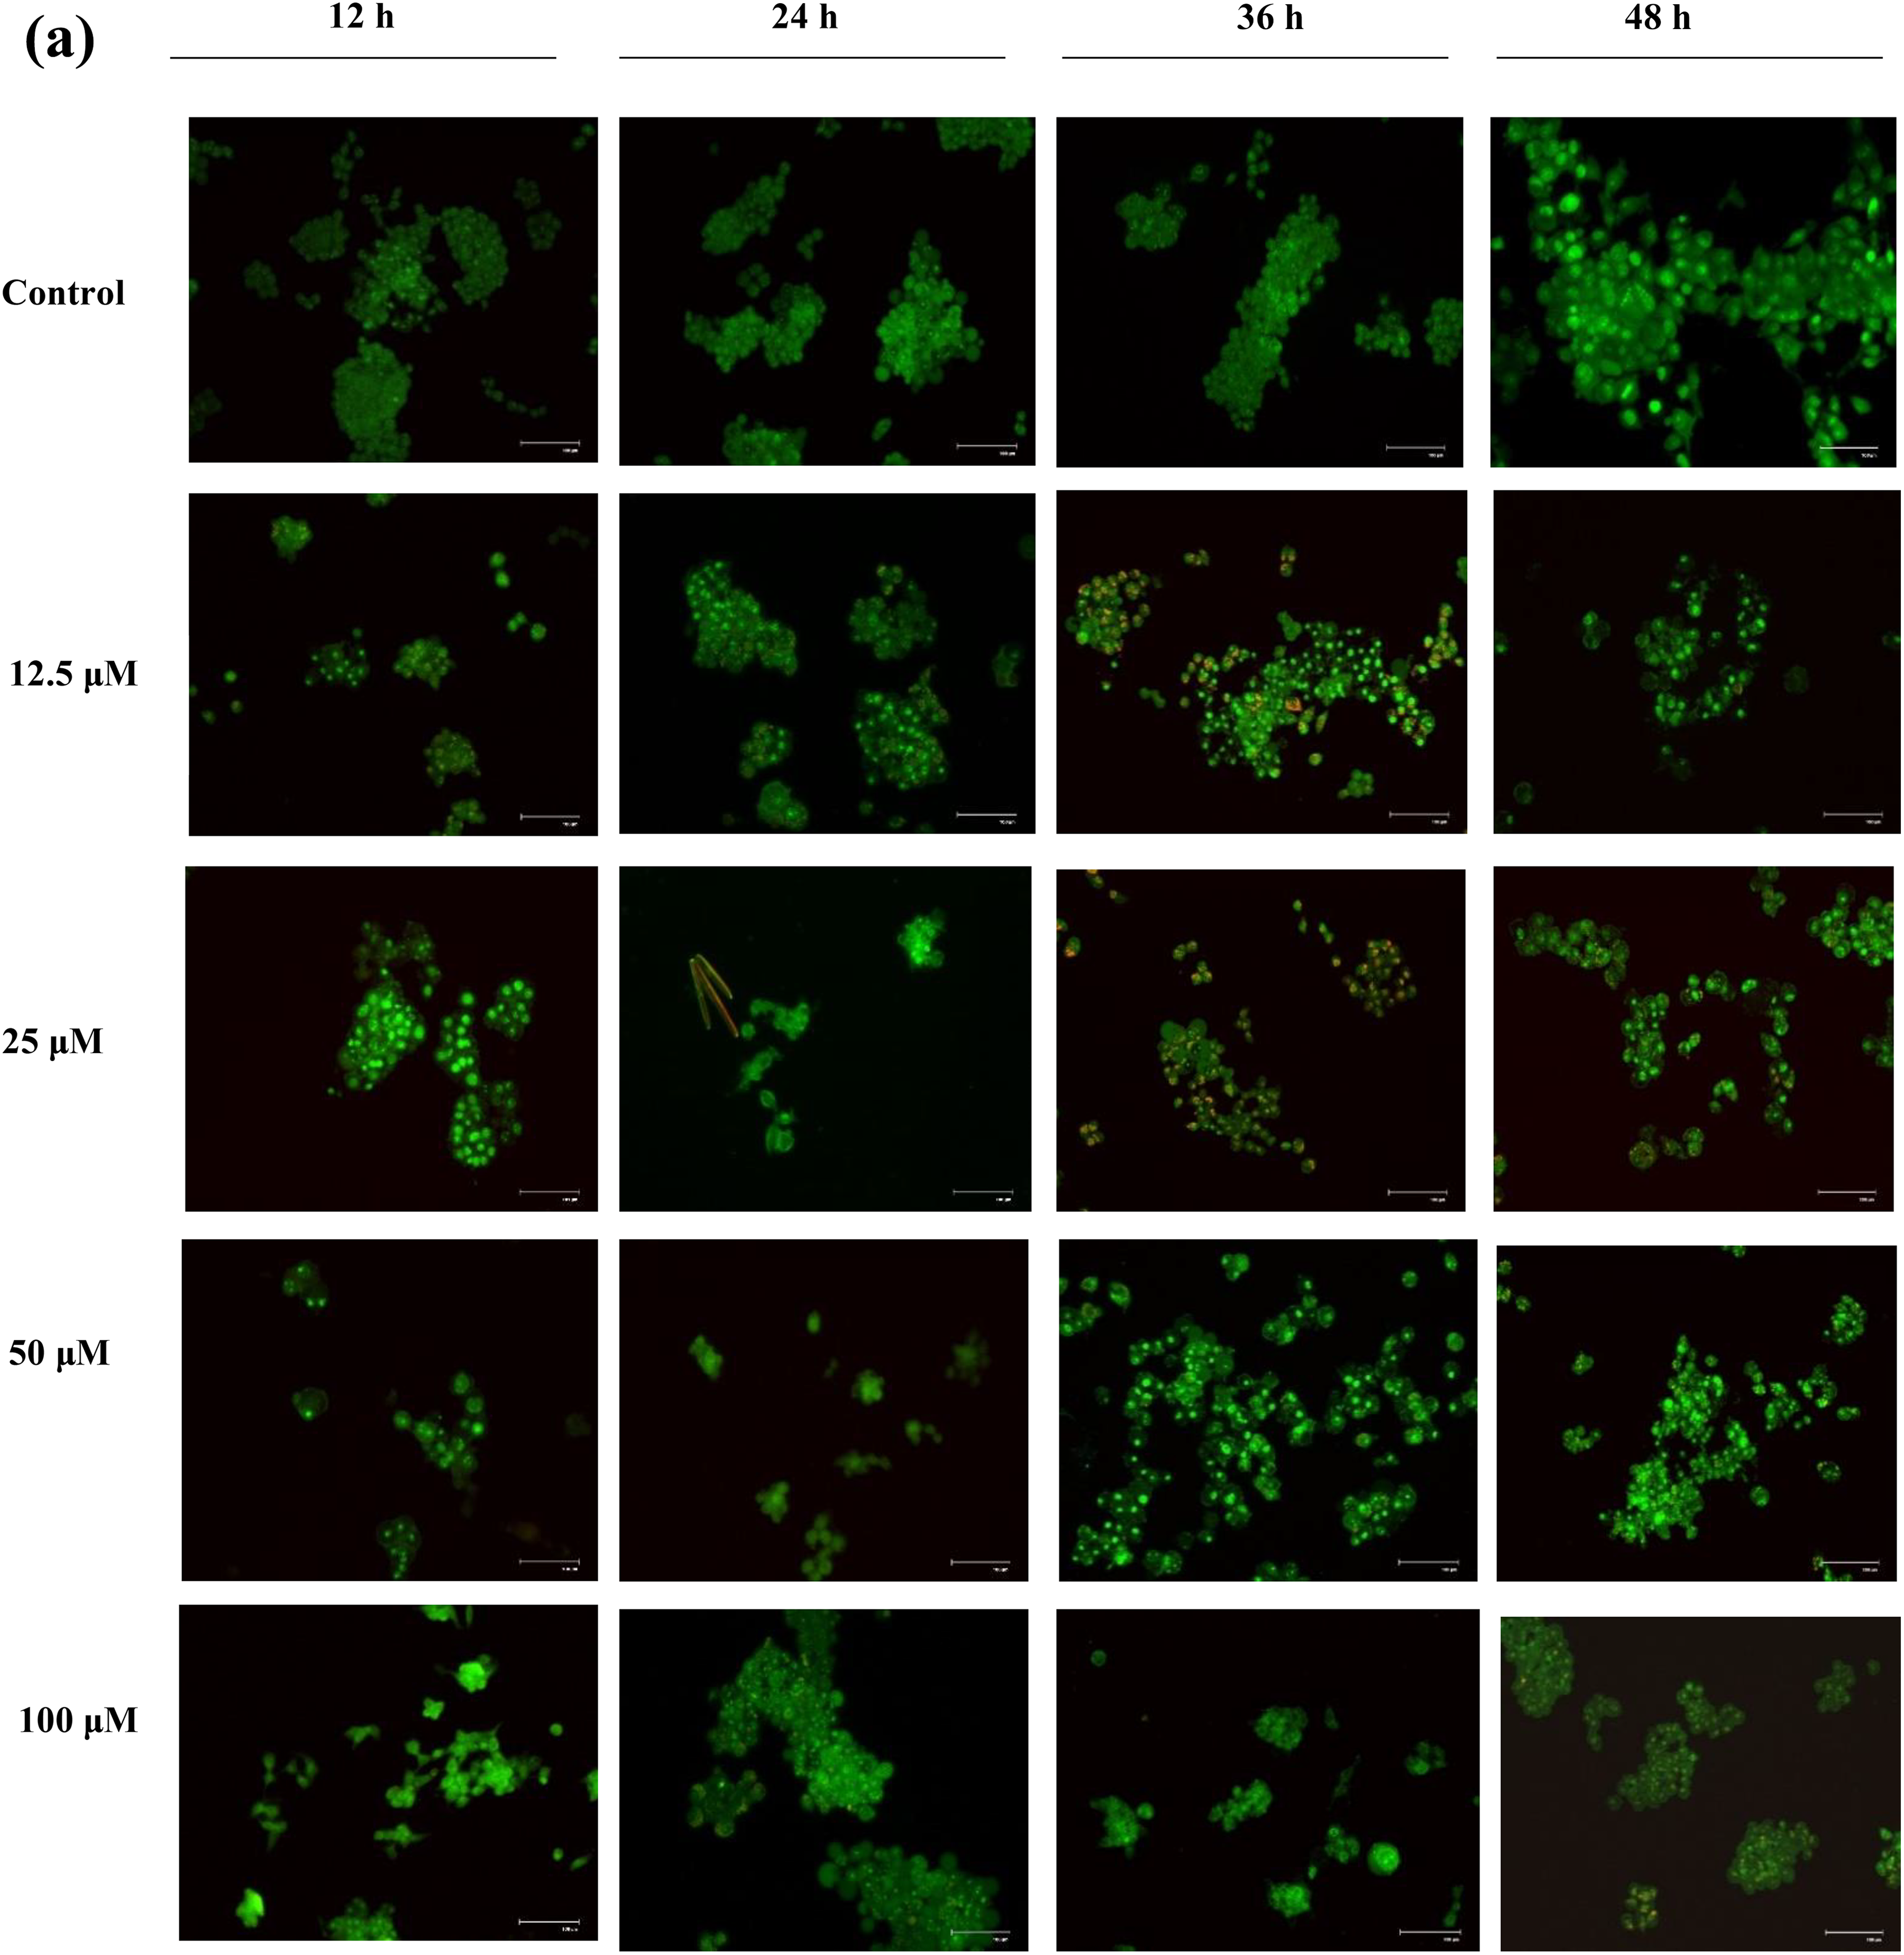
Assessment of AVOs formation by UA treatment in (a) HEPG2, (b) SNU-449, and (c) HUVEC cells, respectively. AVO: acidic vesicular organelle; UA: usnic acid; HUVEC: human umbilical vein endothelial cell.
Furthermore, the quantity of LC3-II was analyzed to validate the AO staining as shown in Figure 6. The experiment was carried out for 36 h UA exposure as the most significant AVO formation was observed at this timepoint. The quantity of LC3-II is increased in UA-treated HEPG2 and SNU-449 cells. In SNU-449 cells treated with 12.5 and 25 µM UA, the quantity of LC3-II increased 1.4-fold and 1.3-fold, respectively. In HEPG2 cells, a 1.7-fold and 1.4-fold increase was detected after 36 h of treatment with 12.5 and 25 µM UA, respectively. However, no significant difference in LC3 was detected in HUVECs.
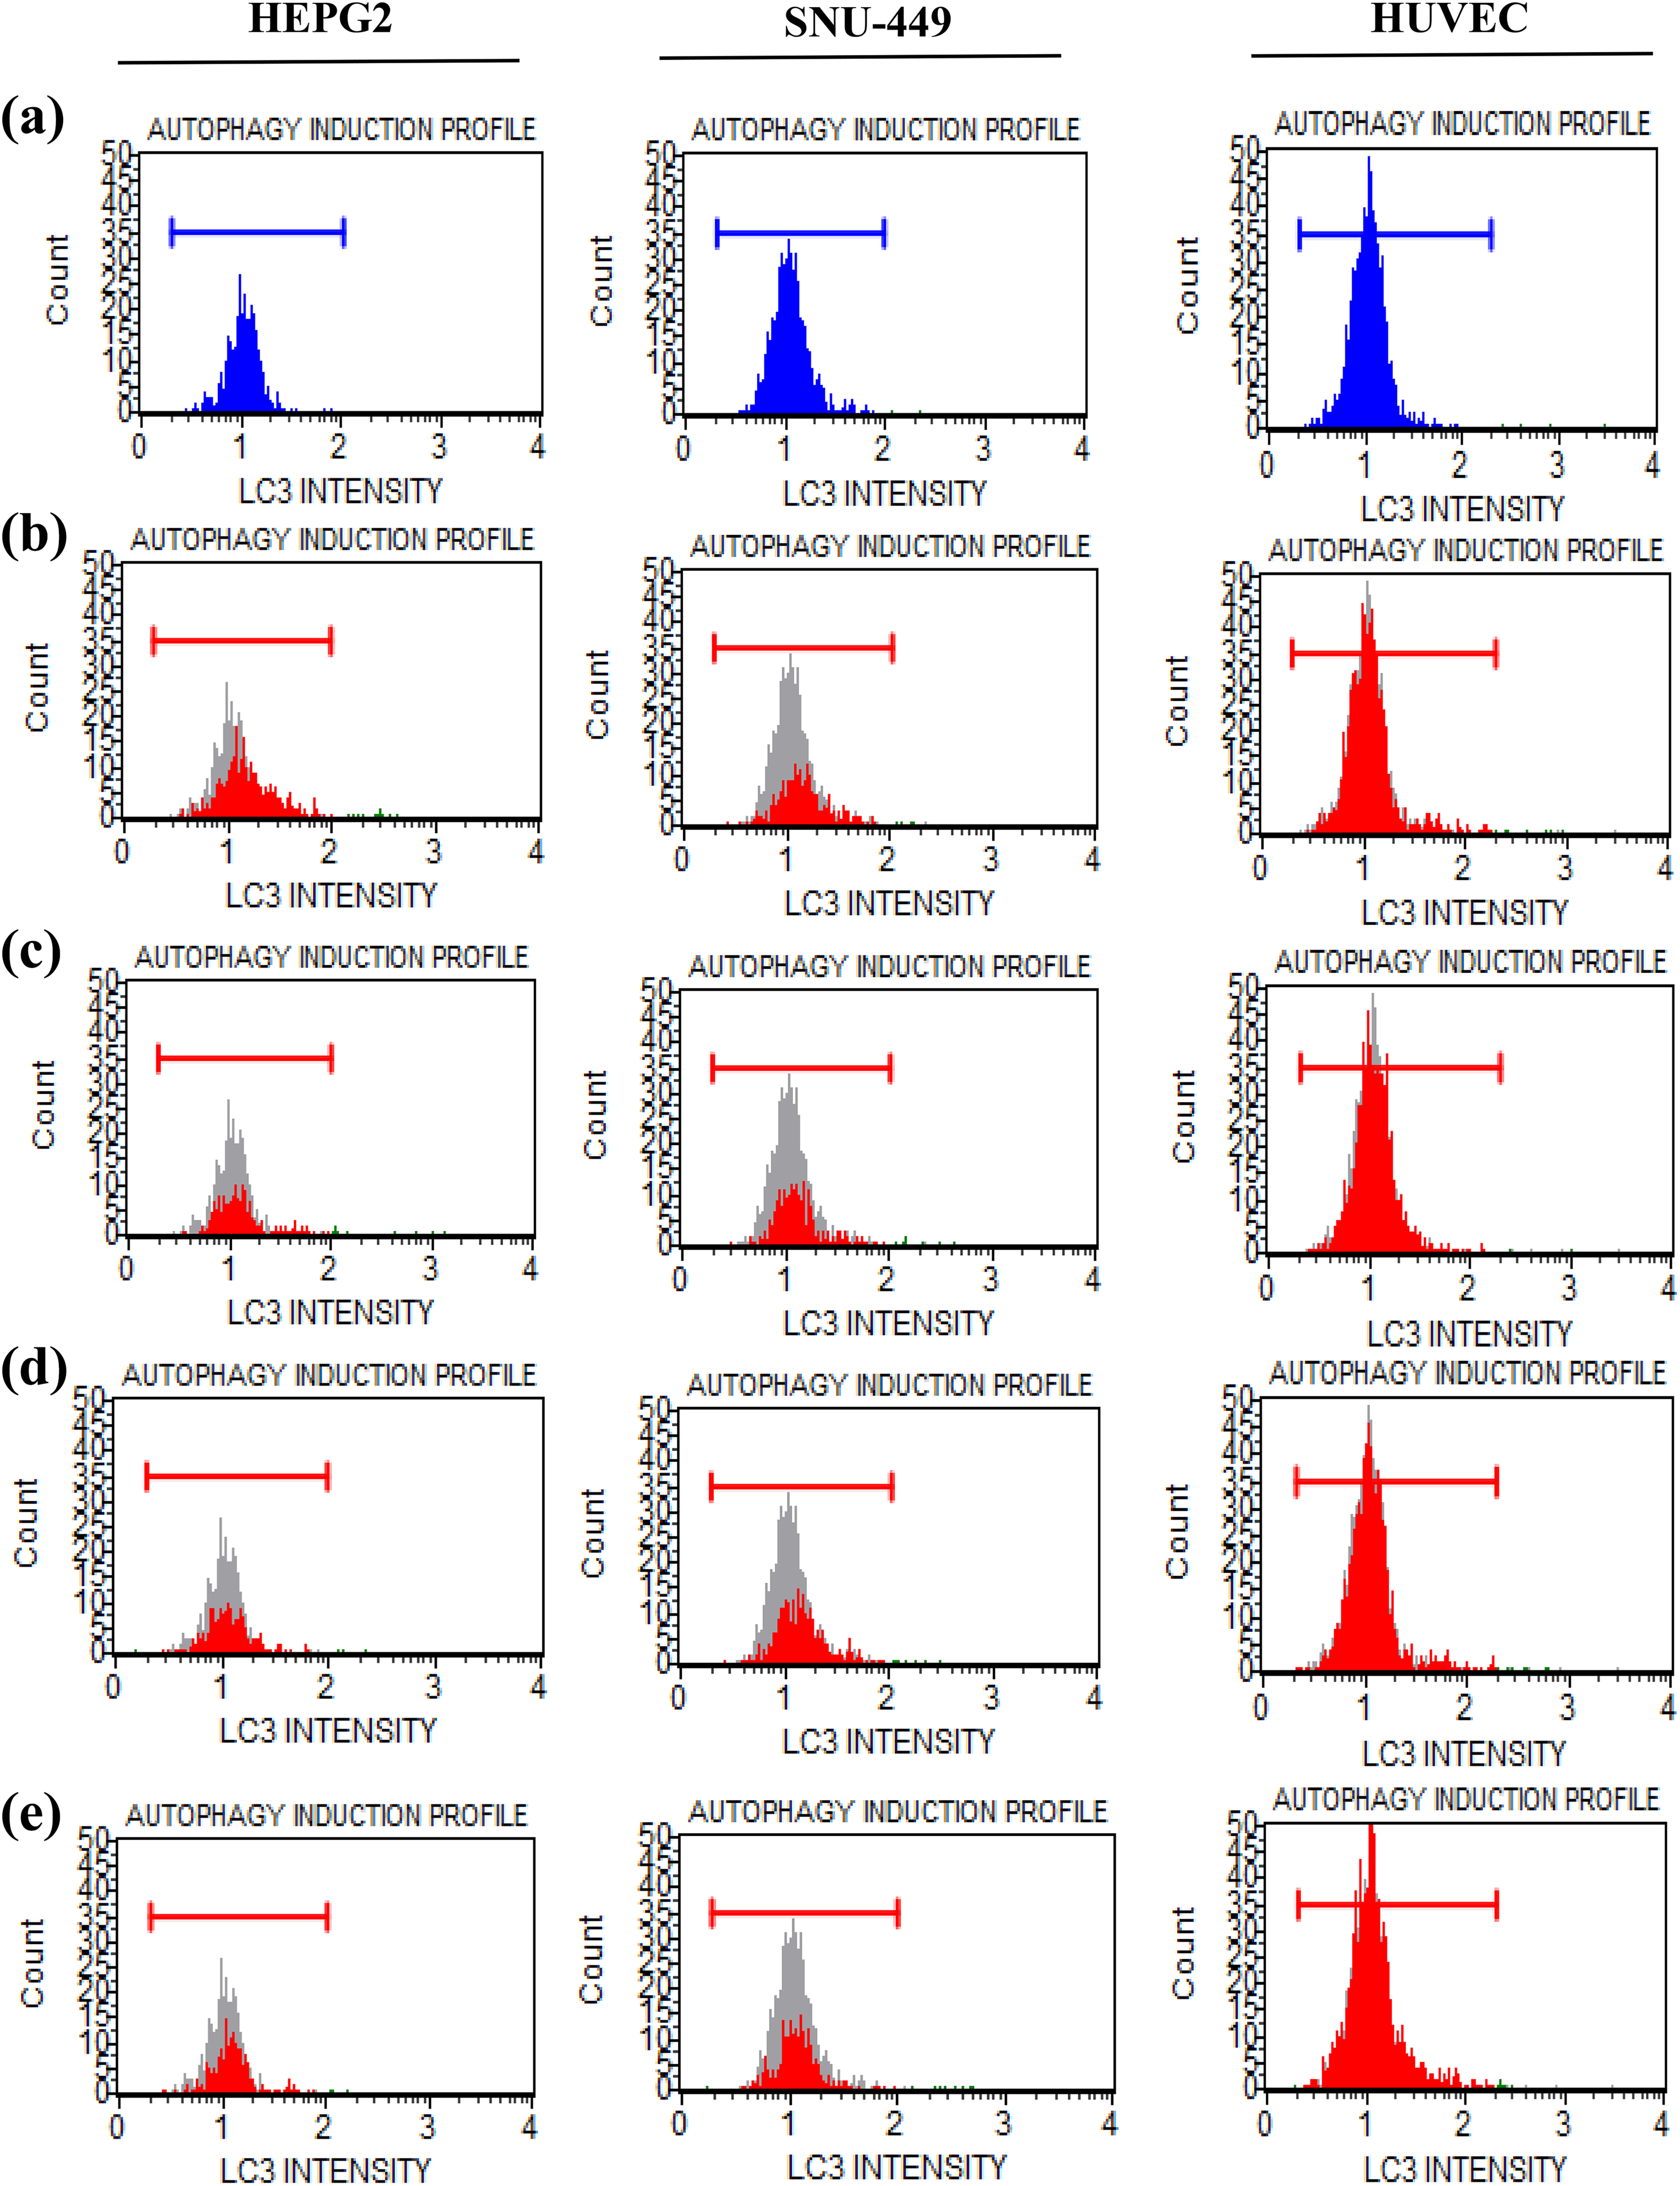
Histogram of UA-induced quantity of LC3-II in HEPG2, SNU-449 and HUVEC cell lines. (a) Control, (b) 12.5, (c) 25, (d) 50, and (e)100 µM UA, respectively. UA: usnic acid; HUVEC: human umbilical vein endothelial cell.
Discussion
Lichens possess promising antitumoral potency against various cancer cell lines, both in crude and purified forms. Numerous reports have indicated that lichen metabolites have shown strong cytotoxic effects at micro-molar concentrations by inducing apoptosis, necrosis, and autophagy with arrest at G0/G1, S, and G2/M phases. 15,19,24 UA, which is found in Usnea, has already been reported as a potential antimitotic and antiproliferative compound. 22,25,26 To this end, we first determined the apoptotic and autophagic effects of UA in HEPG2 and SNU-449 HCC cell lines. The results obtained from the WST-1 assay demonstrated that treatment with UA significantly inhibited HEPG2 and SNU-449 cell viability without damaging HUVEC control cells (p < 0.05; Figure 1). Moreover, SNU-449 cells, which are HBV (+), were more sensitive to UA than HEPG2 cells. This distinct response to UA treatment may result from the different origins of HCC cell lines. For example, HEPG2 cells are epithelial, while SNU-449 cells are mesenchymal as demonstrated by differential expression of E-cadherin and vimentin. 27 –29 A significant increase (p < 0.01) was detected in the viability of HEPG2 cells treated with 50 and 75 μM UA. This increase may be due to the aggressive heterogeneous structure of HepG2 cells or acquired multidrug resistance (MDR) to UA.
As mentioned earlier, UA induces apoptotic cell death in different cancer cell lines (A549, H1650, H1975, H460). 20,22,30 –32 In this study, UA induced both apoptosis (particularly late apoptosis) and autophagy in HCC cells. There is a remarkable link between cell cycle arrest and apoptosis in terms of prevention or induction of an apoptotic response. 33,34 The percentage of the HEPG2 cells at G0/G1 phase was remarkably increased after the treatment with UA for 48 h (Figure 3), whereas treatment with increasing concentrations of UA considerably induced arrest at the G2/M phase in SNU-449 cells. In addition, UA did not have a significant effect on the cell cycle distribution in HUVECs. The increased amount of cells in the G0/G1 phase results in a cell cycle delay and is thus effective at reducing proliferation. However, the percentage of SNU-449 cells in the G2/M phase after UA treatment may result from homozygous mutations in the CDKN2A and p53 genes, which are involved in the retention of cells in the G0/G1 phase. 34,35 Moreover, Baek et al. (2000) have reported that SNU-449 cells included homozygous deletions in p16INK4A and p15INK4B, two cell cycle regulator genes. 35 Thus, UA could induce cell cycle arrest; however, the different transition point (G0/G1 or G2/M) depends on cell type, the genetic background of the cell, and any altered expression of cell cycle-related genes.
Different studies have indicated the morphological changes induced by UA treatment in different cancer cell lines (HEPG2, CAPAN-2, MCF-7, T47D) and specify that UA significantly induced both apoptotic and autophagic death in cancer cells. 36,37 Chen et al. 37 have found that UA induces apoptosis, inactivates mTOR, activates JNK, and induces autophagy. Although the suppression of mTOR promotes autophagy, autophagy induction prevents apoptosis and cell death via JNK activation in HEPG2 cells. Thus, the authors have stated that autophagy can prevent apoptotic cell death. 37
In this study, 48 h of treatment with UA at increasing concentrations induced apoptotic cell death in both HEPG2 and SNU-449 cells, which was confirmed by AO/EB staining (Figure 4). On the other hand, an induction of autophagic death involving AVO formation was observed after treatment with 12.5 and 25 µM UA for 36 h (Figure 5). These results were supported by the quantification of LC3 as summarized in Figure 6. However, there is an urgent need to carry out a detailed study to determine whether apoptosis is attenuated by UA-induced autophagic death. In addition, further study is needed to investigate cellular autophagy-related proteins (LC3I, LC3II, and Beclin-1) by laser scanning confocal microscopy (LSCM), gene expression, and western blotting studies. To validate this finding associated with autophagic death, the ultrastructural changes in these cells should be examined by electron microscopy. Based on the results, we believe that UA induces autophagy as a defense mechanism in HCC cell lines at an early exposure time, while the characteristic features of apoptosis are observed at a later timepoint. Moreover, the multiple molecular mechanisms that are related to cell death or cell survival should be investigated by identifying specific cellular responses to UA for each cancer cell line.
Conclusion
In summary, the current findings reveal that UA has selective antitumor activity against HCC cell lines (HEPG2 and SNU-449) by inducing apoptotic and autophagic cell death, with limited effect on HUVEC control cells. Thus, UA might be a promising therapeutic option for HCC treatment. However, studies examining the molecular mechanisms of UA induced apoptosis and autophagy, as well as in vivo research, should be carried out to determine the exact effects of UA and the potential of UA as a clinically useful therapeutic agent.
Footnotes
Acknowledgments
The authors would like to thank Mehmet Ozturk from Dokuz Eylul University, Faculty of Medicine, Basic Medical Sciences Department of Medical Biology, who kindly provided HCC cell lines for the study.
Declaration of Conflicting Interests
The author(s) declared no potential conflicts of interest with respect to the research, authorship, and/or publication of this article.
Funding
The author(s) disclosed receipt of the following financial support for the research, authorship, and/or publication of this article: This study was supported by a grant from the Scientific Research Projects Foundation of the Uludag University of Turkey (project no: HDP(T)-2017/13).