
Abstract
Gastrointestinal toxicity is dose limiting with many therapeutic and anticancer agents. Real-time, noninvasive detection of markers of toxicity in biofluids is advantageous. Ongoing research has revealed microRNAs as potential diagnostic and predictive biomarkers for the detection of select organ toxicities. To study the potential utility of microRNA biomarkers of intestinal injury in a preclinical toxicology species, we evaluated 3 rodent models of drug-induced intestinal toxicity, each with a distinct mechanism of toxicity. MiR-215 and miR-194 were identified as putative intestinal toxicity biomarkers. Both were evaluated in plasma and feces and compared to plasma citrulline, an established intestinal injury biomarker. Following intestinal toxicant dosing, microRNA changes in feces and plasma were detected noninvasively and correlated with histologic evidence of intestinal injury. Fecal miR-215 and miR-194 levels increased, and plasma miR-215 decreased in a dose- and time-dependent manner. Dose-dependent decreases in plasma miR-215 levels also preceded and correlated positively with plasma citrulline modulation, suggesting miR-215 is a more sensitive biomarker. Moreover, during the drug-free recovery phase, plasma miR-215 returned to predose levels, supporting a corresponding recovery of histologic lesions. Despite limitations, this study provides preliminary evidence that select microRNAs have the potential to act as noninvasive, sensitive, and quantitative biomarkers of intestinal injury.
Introduction
Gastrointestinal (GI) toxicity is a dose-limiting liability associated with some therapeutics such as anticancer agents and nonsteroidal anti-inflammatory drugs (NSAIDs). Common symptoms including nausea, vomiting, abdominal pain, constipation, and diarrhea may accompany sequelae such as GI bleeding, ulceration, perforation, and sepsis (Butler 2008). In addition, GI toxicity can lead to altered drug absorption via the oral administration route, thus hampering effective disease control. Current detection of GI toxicity in the clinic includes endoscopic examination/biopsy, sugar permeability tests, 13C sucrose breath tests, and monitoring of diarrhea/constipation (Butler 2008), all of which may have some limitations. Histopathology, the current gold standard for characterization of GI injury, is invasive and may not identify focal or regional lesions without extensive sampling.
Ideal GI biomarkers are sensitive, noninvasive, quantitative, early predictive, and able to correlate with histologic evidence of injury. They should provide a means to easily follow the stages of GI damage and repair. Although several current biomarkers, including diamine oxidase, CD64, and gastrin, possess many of these attributes, they each have some characteristics that limit their use (John-Baptiste et al. 2012). Citrulline, a putative biomarker used to detect GI injury, is an intermediary metabolic amino acid produced by enterocytes of the small intestine (John-Baptiste et al. 2012). Citrulline levels generally correlate with enterocyte mass, thus enabling its quantification as a measure of enterocyte health. Although a promising biomarker for detection of enterocyte injury, the correlation of citrulline levels to injury may be disrupted by alteration in diet and gut microflora (John-Baptiste et al. 2012) as well as other disease states such as compromised renal function (Crenn, Messing, and Cynober 2008). Additionally, notable changes in citrulline are dependent on significant epithelial loss, a requirement that reduces its intrinsic utility as an early biomarker of GI injury (Crenn, Messing, and Cynober 2008), thus it may lack sensitivity as a biomarker under some circumstances.
The modulation of microRNA levels in biological samples is an area of current biomarker investigation for various organ toxicities (Ciesla et al. 2011; Mitchell et al. 2008; Gilad et al. 2008; McKenna et al. 2010; K. Wang et al. 2009). MicroRNAs, which are ∼21 to 25 nucleotides in length, constitute a large family of posttranscriptional regulators of gene expression that control many developmental and cellular processes in eukaryotic organisms. MicroRNAs negatively regulate gene expression of messenger RNAs (mRNA) in a sequence-specific manner by targeting 1 or more mRNAs for translational repression or cleavage, thereby impacting diverse physiological and pathophysiological functions (Gilad et al. 2008). Several microRNAs show tissue-specific expression patterns, consistent with their unique roles in these organs (Sun et al. 2004). In the GI tract, microRNAs have been shown to play a role in barrier function (McKenna et al. 2010), epithelial differentiation (McKenna et al. 2010), and mucosal innate immunity (Biton et al. 2011); they have also been associated with diseases such as colon cancer (Huang et al. 2011) and inflammatory bowel disease (Iborra et al. 2012). MicroRNAs can be detected in body fluids such as plasma, urine, and feces, and their levels may change in response to toxic insults or disease states. Published reports have demonstrated the potential for plasma/serum microRNA changes to reflect liver, cardiac, muscle, and brain toxicities as well as the use of microRNAs as diagnostic markers for cancer (Sun et al. 2004; Ciesla et al. 2011). MicroRNAs are remarkably stable in biofluids (compared to mRNA), relatively easy to measure, and present with a manageable level of diversity (compared to the complexity of the proteome). Conservation of microRNA sequences and associated biological functions across multiple species suggests strong potential clinical applicability as biomarkers of organ toxicity.
In an effort to identify and characterize the utility of microRNAs as biomarkers associated with GI toxicity, 2 antiproliferative compounds, p21-activated kinase 4 (PAK4) inhibitor and heat-shock protein 90 (HSP90) inhibitor, and 1 NSAID, diclofenac, all known to induce intestinal injury (Tamaki et al. 2011; Wallace 2013; Dammann, Khare, and Gasche 2014), were used in rodent toxicity studies (Table 1). On the other hand, a glucokinase activator (GKA), known not to cause intestinal injury, served as a negative control compound (Table 1). MicroRNA transcriptome profiling of intestinal tissue showed that miR-215 and miR-194 underwent significant dose-responsive decreases following induction of intestinal injury. In situ hybridization (ISH) further localized miR-215 and miR-194 in intestinal epithelial cells throughout the intestinal tract. MiR-215 and miR-194 levels were subsequently quantified in feces and plasma relative to the severity and time course and recovery of histologic injury. The data described herein provide evidence that miR-215, to a greater extent, and potentially miR-194 could act as sensitive, noninvasive, and quantitative biomarkers, holding promise for better management of drug-induced intestinal toxicity.
In Vivo Study Design.
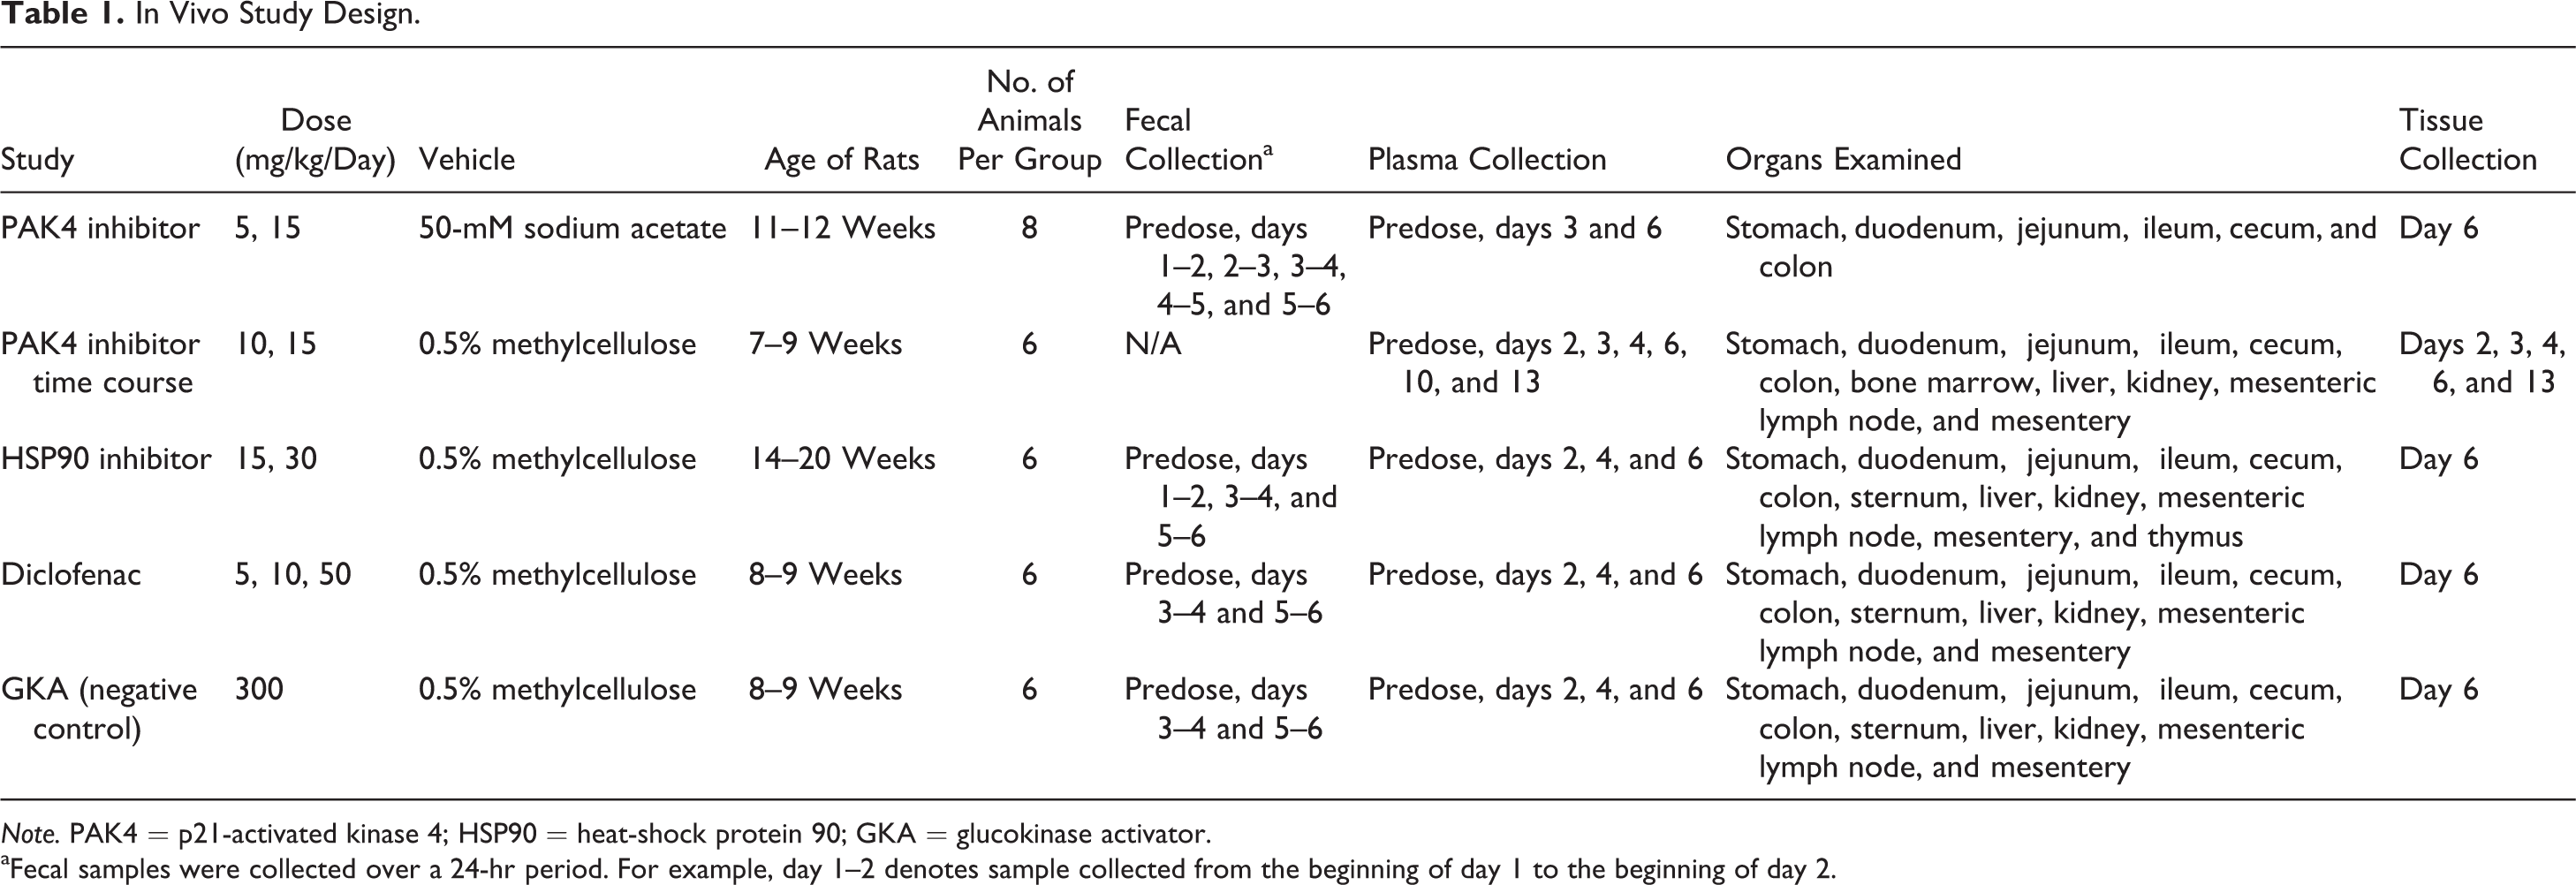
Note. PAK4 = p21-activated kinase 4; HSP90 = heat-shock protein 90; GKA = glucokinase activator.
aFecal samples were collected over a 24-hr period. For example, day 1–2 denotes sample collected from the beginning of day 1 to the beginning of day 2.
Result
Identification of Putative MicroRNA Biomarkers of Intestinal Toxicity Using a PAK4 Inhibitor as a Tool Compound
PAK4 inhibitor was dosed to 11- to 12-week-old Wistar Han rats at 5 or 15 mg/kg daily for 5 days; these doses were selected to induce minimal or significant GI injury, respectively. As expected, the 5-mg/kg dose led to minimal histologic changes (Table 2) and clinical observations (rough hair coat in 1 of the 8 animals). At 15 mg/kg, rats were observed to exhibit general morbidity (rough hair coat, decreased skin turgor, increased salivation, or hunched posture) starting on day 4, soft/watery feces on days 5 and 6, and 10% weight loss by day 5. Microscopically, epithelial necrosis and mixed cell inflammation were observed in the duodenum, jejunum, ileum, cecum, and colon; erosions/ulcerations were also noted in the ileum, cecum, and colon only in rats dosed at 15 mg/kg of the PAK4 inhibitor (Table 2).
Histopathology Scores From the PAK4 Inhibitor, HSP90 Inhibitor, and Diclofenac Studies.
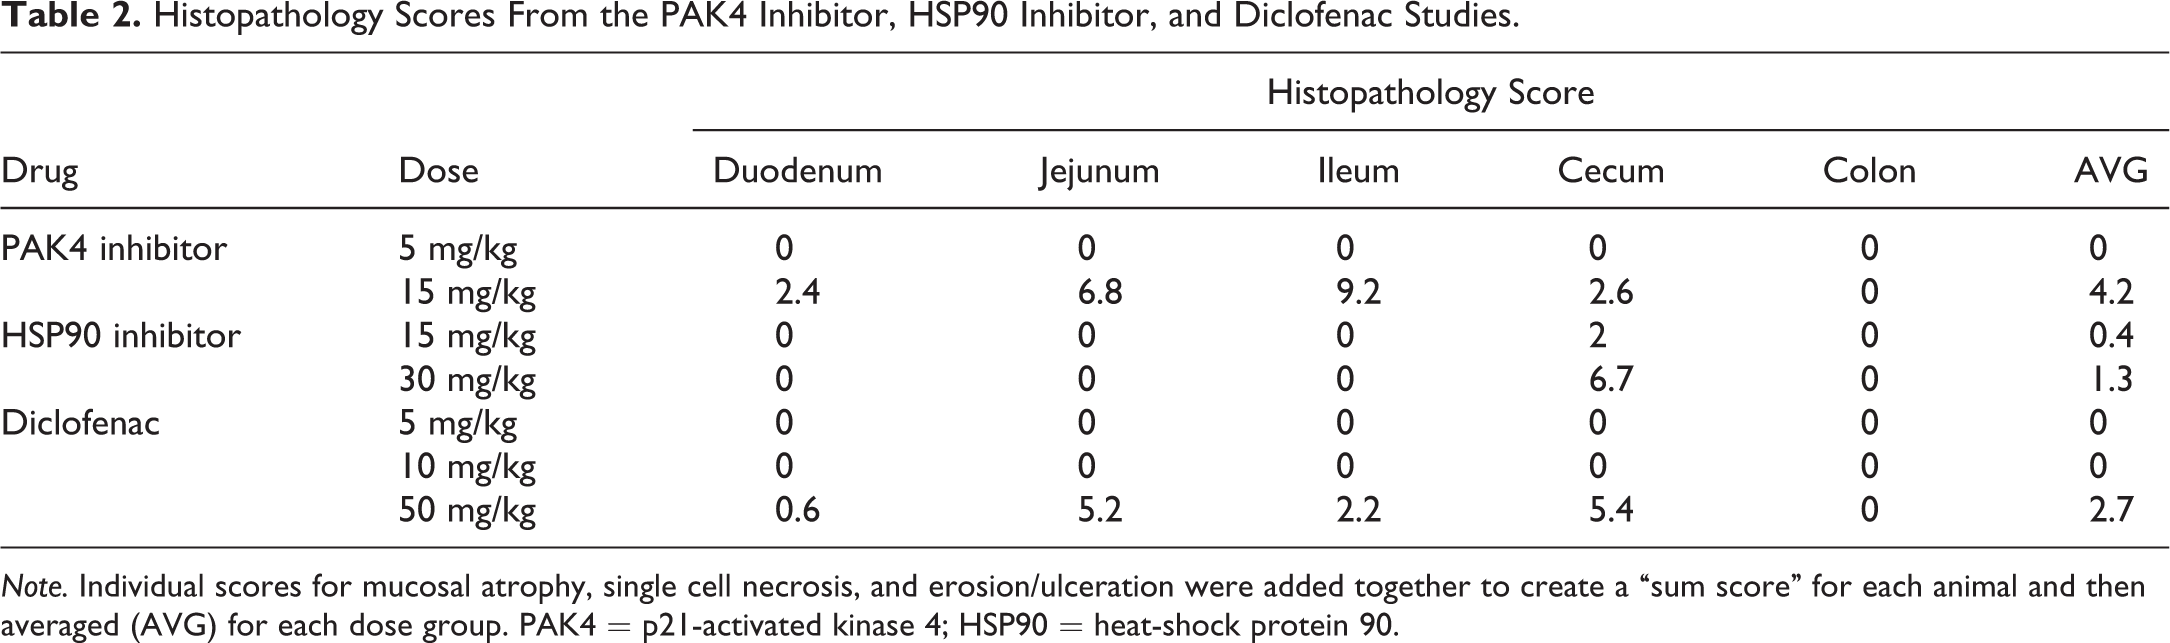
Note. Individual scores for mucosal atrophy, single cell necrosis, and erosion/ulceration were added together to create a “sum score” for each animal and then averaged (AVG) for each dose group. PAK4 = p21-activated kinase 4; HSP90 = heat-shock protein 90.
To identify microRNA changes following drug-induced intestinal injury, total RNA samples from the jejunum of vehicle- and PAK4 inhibitor-dosed rats were analyzed by microRNA transcriptome profiling, which identified significantly perturbed microRNAs (Figure 1). Compared to the baseline expression patterns in the vehicle control group, hierarchical clustering revealed microRNAs were minimally modulated at 5 mg/kg but significantly impacted at 15 mg/kg (Figure 1). This observation is consistent with the presence of microscopic lesions only in the 15-mg/kg dose group. Of these significantly perturbed microRNAs, miR-194 and miR-215 showed the highest expression in the vehicle control group and also the greatest extent of downregulation in the 15-mg/kg dose group (Figure 1). These 2 microRNAs also have a known role in the differentiation of intestinal epithelial cells (McKenna et al. 2010). Thus, miR-194 and miR-215 were selected for further characterization.
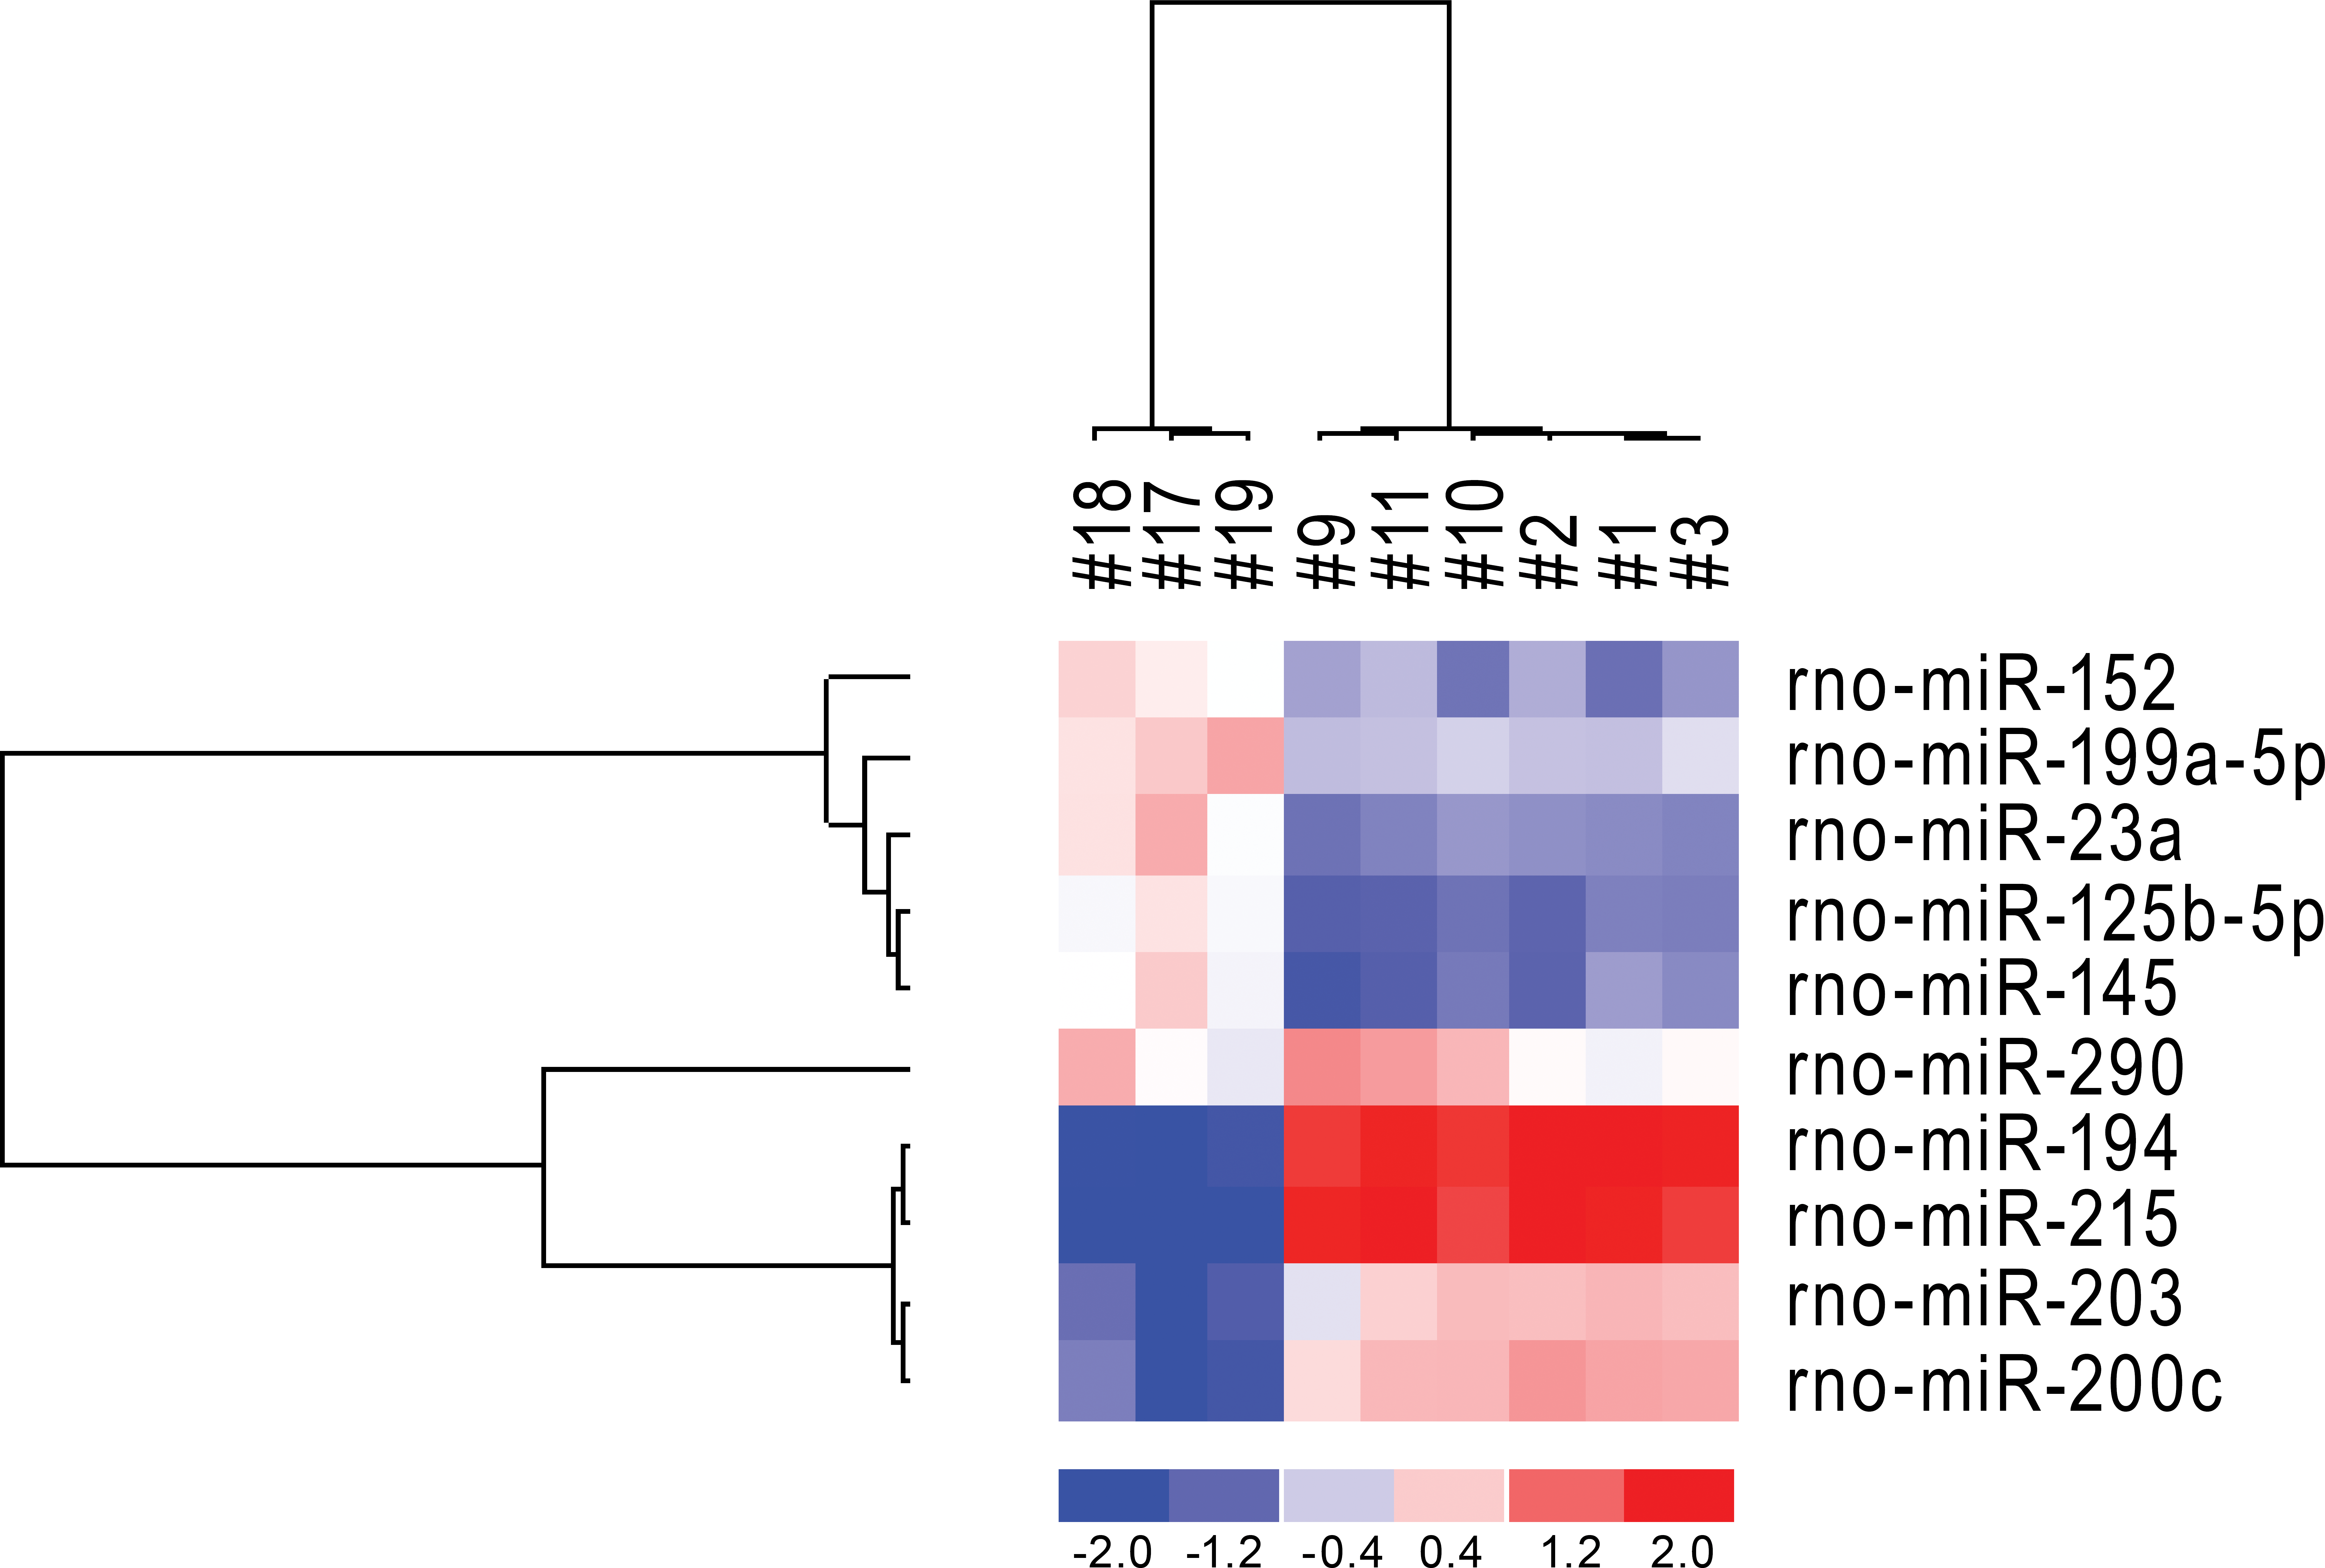
Two-way hierarchical clustering of significantly perturbed microRNAs (t-test, p < .01) from the jejunum transcriptome in the 5-day p21-activated kinase 4 inhibitor study in rats. Jejunum samples #1 to 3, vehicle control group; samples #9 to 11, 5-mg/kg group; samples #17 to 19, 15-mg/kg group. The color scale represents normalized signal intensities expressed as log2 values.
To confirm these gene expression patterns, ISH for miR-194 and miR-215 was performed on intestinal tissue sections of naive rats and PAK4 inhibitor study rats (Figure 2). Both miR-194 and miR-215 were localized to all GI tract segments in naive rats, with the most prominent staining in duodenum and jejunum (representative GI staining patterns for miR-194 shown in Figure 2A; data not shown for miR-215). Moreover, ISH for miR-194 was subsequently performed on representative GI sections of the PAK4 inhibitor study (Figure 2B). Consistent with the microRNA transcriptome profiling results (Figure 1), miR-194 ISH intensities in intestinal sections were clearly lower in the 15-mg/kg dose group than in the vehicle control group.
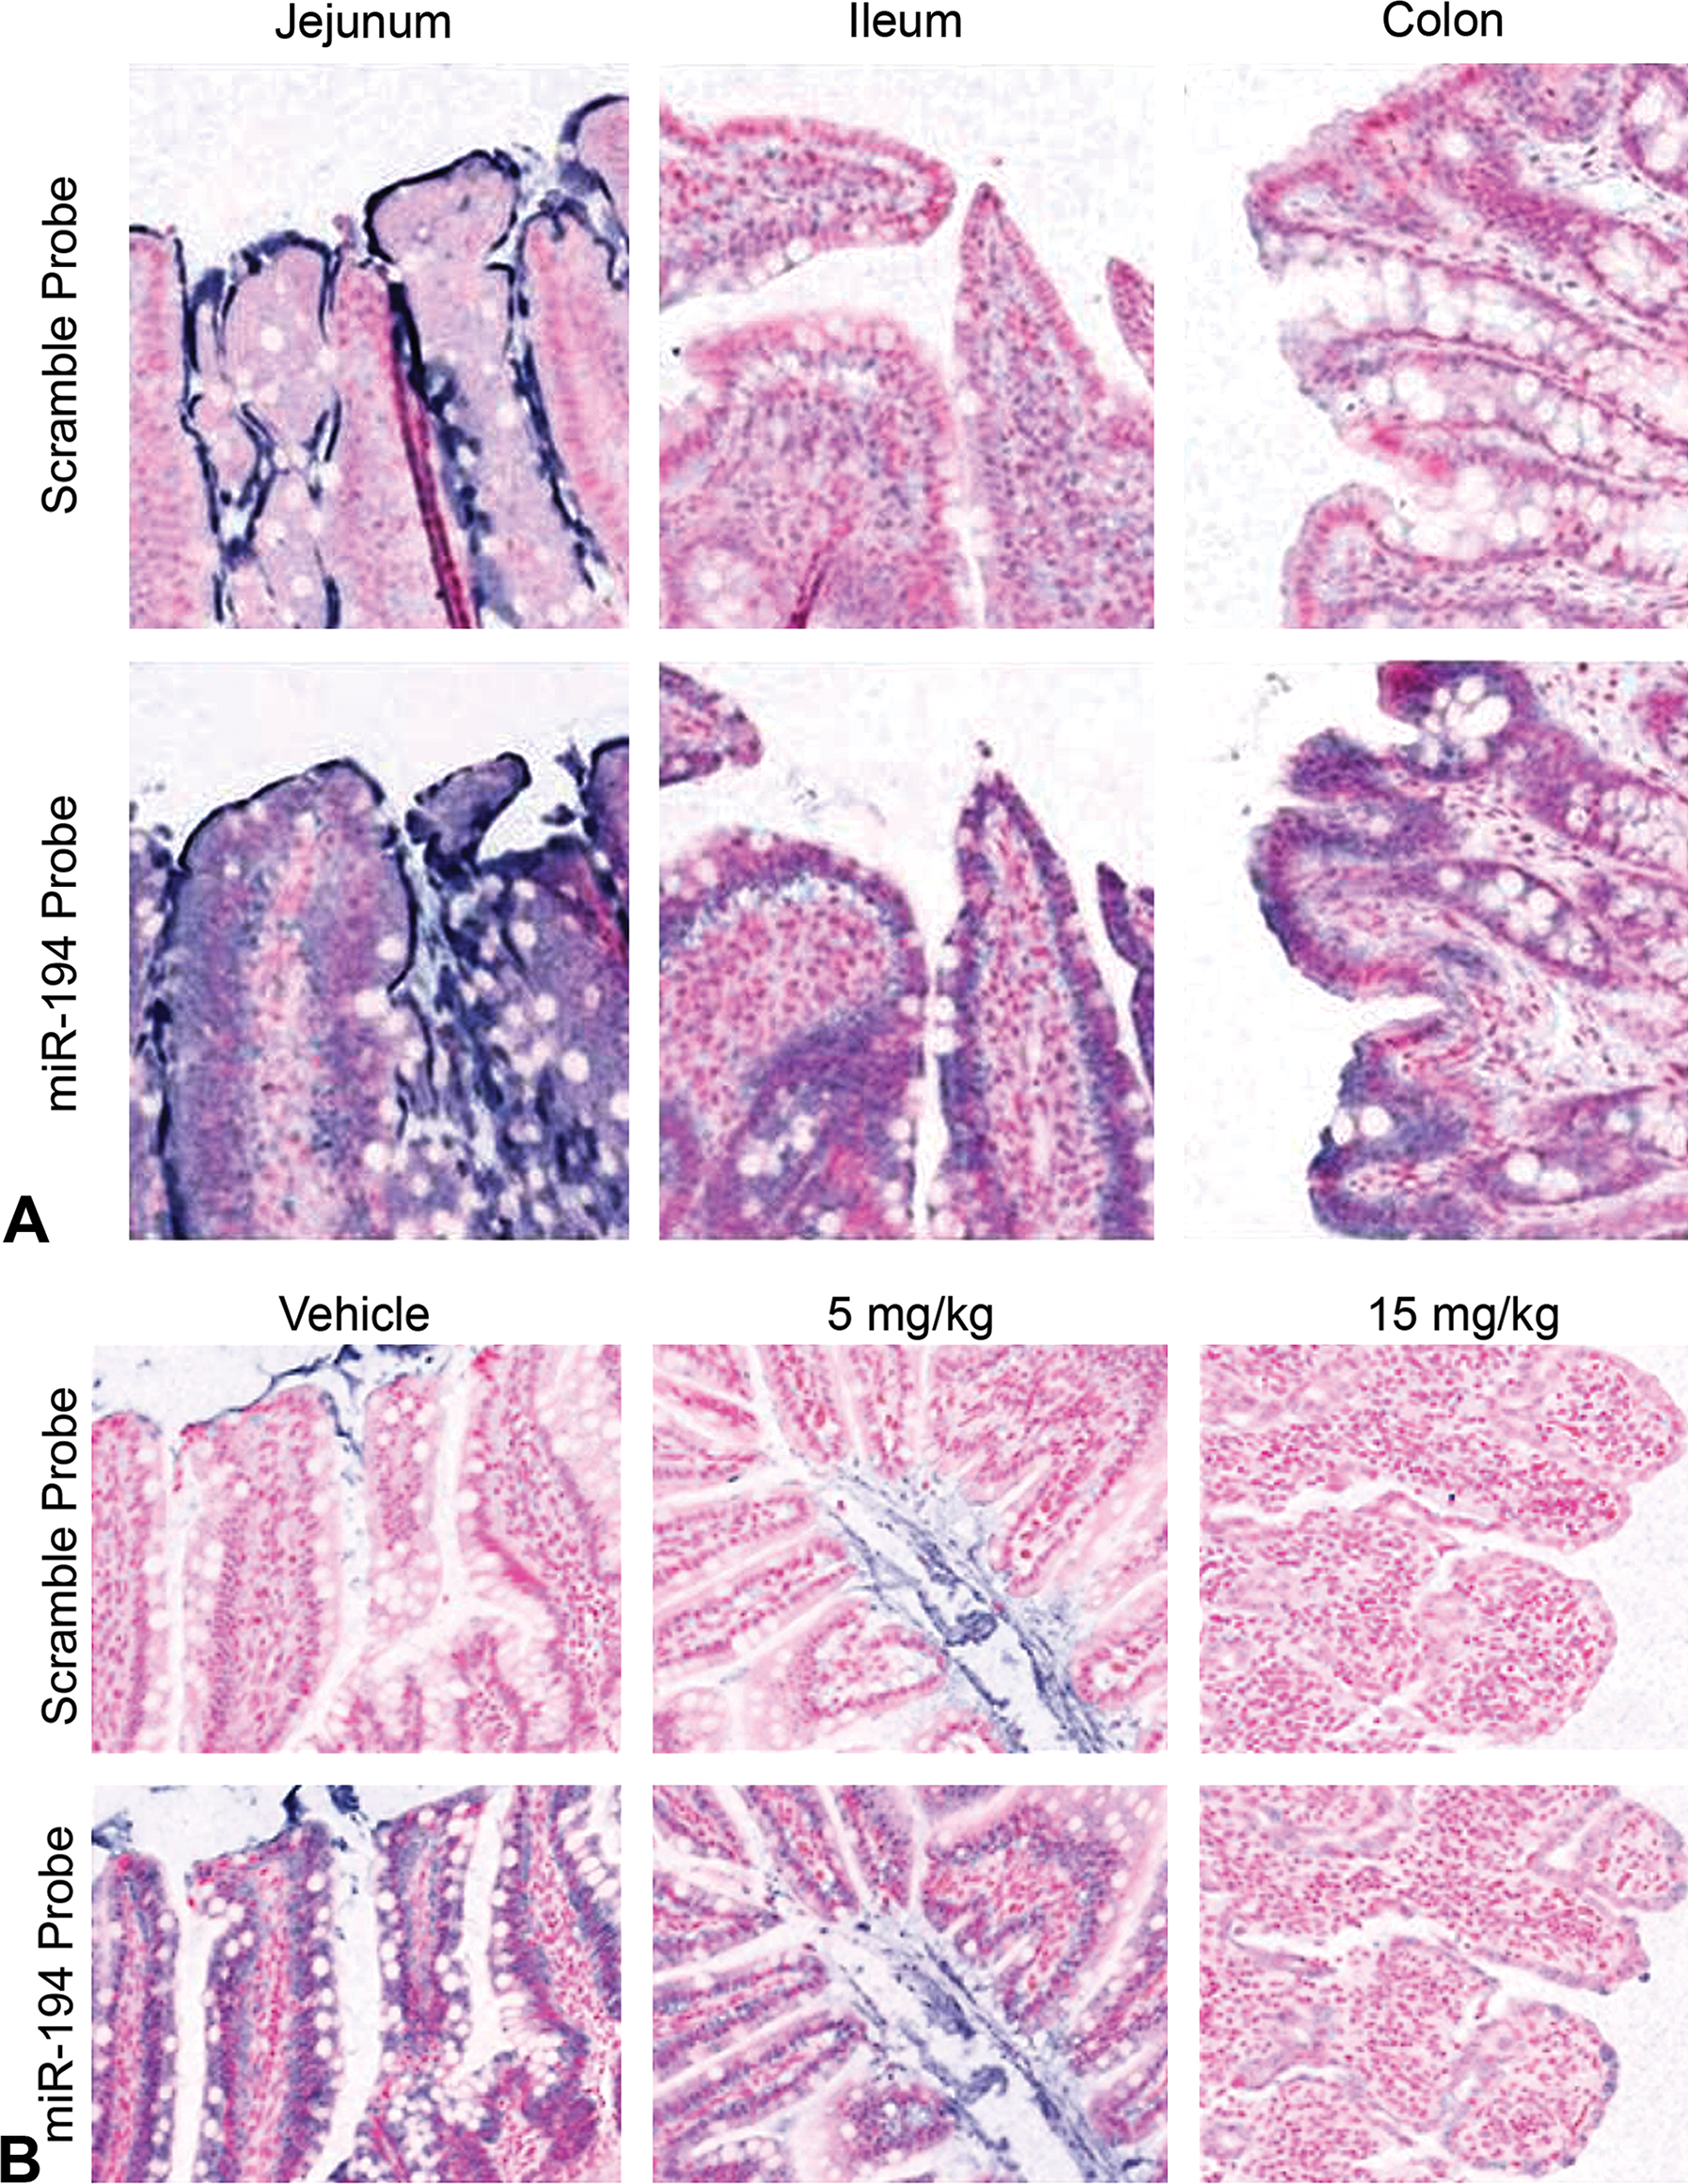
In situ hybridization (ISH) of miR-194 in the rat intestines. ISH was performed in GI sections obtained from naive (A) and p21-activated kinase 4 inhibitor-dosed (B) Wistar Han rats using a scramble probe and a sequence-specific probe to miR-194. Ileum sections are shown in (B).
Having identified modulation of miR-194 and miR-215 in the intestines by transcriptome profiling and ISH following PAK4 inhibitor administration, the levels of each microRNA were assessed in fecal samples collected daily throughout the duration of the study. In vehicle-dosed rats, both miR-194 and miR-215 were absent or present at very low levels in the feces. Following dosing with 5- or 15-mg/kg PAK4 inhibitor, miR-194 and miR-215 were both elevated in feces by day 3 to 4 (Figure 3A). By day 4 to 5, both miR-194 and miR-215 levels in animals dosed with PAK4 inhibitor were largely similar to those in the vehicle group. However, by day 5 to 6, there was a second peak of miR-194 and miR-215 increase at the 15-mg/kg dose only. The cause of the biphasic increase is unclear and requires further investigation. The data provide preliminary evidence that fecal miR-215 and miR-194 levels are modulated in conjunction with intestinal injury.
Biofluid evaluation of miR-215, miR-194, and citrulline levels in the p21-activated kinase 4 (PAK4) inhibitor study. Wistar Han rats were administered vehicle control (yellow) or PAK4 inhibitor at 5 mg/kg (orange) or 15 mg/kg (red) daily for 5 days. (A) Fecal samples were collected predose and daily and analyzed for miR-215 and miR-194 levels by quantitative reverse transcription-polymerase chain reaction (qRT-PCR). Time points denote fecal sample collection over a 24-hr collection period. (B)–(C) Plasma samples were collected predose on days 3 and 6 and analyzed for miR-215 and miR-194 (B) and citrulline (C) levels by qRT-PCR and liquid chromatography tandem mass spectrometry, respectively. Statistically significant changes (two-way analysis of variance, p < .05) are indicated by asterisks; error bars represent standard error of the mean.
Plasma miR-194 and miR-215 levels were also evaluated in the PAK4 inhibitor study and displayed distinct patterns both before and after compound administration. Analysis of baseline plasma samples showed miR-194 was not detectable in the plasma; in contrast, miR-215 appeared quite abundant (Figure 3B). Dosing with the PAK4 inhibitor caused no change in plasma miR-194 levels, which remained undetectable throughout the study; plasma miR-215 levels, on the other hand, underwent a dose- and time-dependent decrease (Figure 3B), suggesting miR-215 may be a better marker for detecting intestinal injury in the plasma. Levels of plasma citrulline, a more established surrogate biomarker for the enterocyte mass, also showed a dose- and time-dependent decrease following PAK4 inhibitor dosing (Figure 3C). A correlation analysis of plasma miR-215 and citrulline data demonstrated a positive correlation between these 2 biomarkers (Figure 4, green data points). In short, concordance with histological and citrulline data provide support for miR-215 as an attractive biomarker of intestinal toxicity in both feces and plasma.
Comparison of plasma miR-215 and citrulline modulation. Scatter plot shows plasma miR-215 versus citrulline levels across samples from diclofenac, heat-shock protein 90 and p21-activated kinase 4 inhibitor studies. Days 3–4 and 5–6 samples were included in the analysis to represent common time points in all the 3 studies. Positive pathology scores are noted next to corresponding study samples. HD = high dose; LD = low dose; MD = mid dose; neg ctrl = glucokinase activator
To further characterize the temporal relationship between plasma miR-215 and citrulline modulation and histopathologic lesions, a time-course study using the PAK4 inhibitor was conducted to evaluate these end points concurrently at multiple time points throughout the dosing and the recovery phase (Table 1). Plasma was the chosen biofluid for this study due to the relative ease of sample collection and microRNA isolation when compared to fecal samples. Compared to the previous PAK4 inhibitor study, the frequency of tissue and plasma sampling was increased (Table 1) to provide better resolution of temporal trends in histology and biomarker modulation. The inhibitor was dosed at 10 or 15 mg/kg daily for 5 days, with a subset of the 10-mg/kg group animals being allowed to recover for 7 days after the last dose. Histologically, animals dosed with the PAK4 inhibitor, on days 2, 3, and 4 (day 6 not assessed for the 15-mg/kg dose group), exhibited dose-dependent intestinal toxicity involving the small intestine (most notably ileum and jejunum; Table 3). In less severely affected rats in both drug-treated groups, mucosal atrophy and single cell necrosis of the crypt epithelium were identified, while in more severely affected animals, more extreme mucosal atrophy was observed. Mucosal atrophy in the small intestine increased in incidence and severity over days 2 to 4 of the study (Table 3). The cecum exhibited minimal to severe mucosal atrophy in both dose groups, as well as single cell necrosis of the crypt epithelium. There were other PAK4 inhibitor–related changes in the bone marrow (minimal to severe decreased cellularity, mild to moderate increased neutrophils, and single cell necrosis), mesenteric lymph node (minimal to mild decreased lymphoid cellularity of the primary follicles and central deep cortical units), and mesenteric adipose tissue (minimal to mild atrophy of fat cells) of rats given ≥10 mg/kg. The histologic findings in the bone marrow, mesenteric lymph node, and mesenteric adipose tissue were expected to have minimal impact on the microRNA changes, since both microRNAs have not been shown to be expressed in the aforementioned tissues (Collino et al. 2010; Liang et al. 2007). After the drug-free phase, atrophy and single cell necrosis were minimal in the intestine and correlated with clinical signs of decreased skin turgor and rough hair coat.
Histopathology Scores from the PAK4 Inhibitor Time-Course Study.
Note. Individual scores for mucosal atrophy, single cell necrosis, and erosion/ulceration were added together to create a “sum score” for each animal and then averaged (AVG) for each dose group. PAK4 = p21-activated kinase 4.
Concurrent with histopathology end points, both plasma miR-215 and citrulline levels were evaluated. For plasma miR-215 levels, there was a dose-dependent decrease starting on day 2, and over days 3 to 4, the magnitude of decrease deepened in both dose groups (Figure 5A), correlating with the progression of epithelial injury in the small intestines over the same period (Table 3). Plasma citrulline levels followed a similar trend as plasma miR-215; however, a significant decrease was noted only starting on day 3 (Figure 5B), demonstrating a delayed response compared to either histology or plasma miR-215. On day 6, no histological findings were seen at the 10-mg/kg dose (Table 3), but plasma miR-215 and citrulline levels were significantly decreased relative to the time-matched vehicle control levels (Figure 5). This discrepancy may have been due to the fundamentally different nature of sampling for plasma biomarkers versus histology: whereas the plasma readout could reflect injury occurring along the entire length of the intestinal tract, histology sampling was performed on representative, but discrete, intestinal segments. During the recovery phase, both plasma miR-215 and citrulline levels returned to predosing or vehicle control levels, and this trend was accompanied by the recovery of histopathologic lesions. Taken together, these data provide evidence that miR-215 modulation was more sensitive at detecting drug-associated intestinal injury than plasma citrulline, since the onset of plasma miR-215 modulation coincided with the histologic detection of intestinal injury and preceded a significant citrulline modulation by a day. The data also demonstrated that both plasma miR-215 and citrulline modulation could reverse with the recovery of histologic lesions, which is a desirable feature of any biomarker.
Evaluation of plasma miR-215 and citrulline levels in the p21-activated kinase 4 (PAK4) inhibitor time course and recovery study. Wistar Han rats were administered vehicle control (yellow) or PAK4 inhibitor at 10 mg/kg (orange) or 15 mg/kg (red) daily for 5 days. Plasma samples were collected predose on days 2, 3, 4, 6, 10, and 13 and analyzed for miR-215 (A) and citrulline (B) levels by quantitative reverse transcription-polymerase chain reaction and liquid chromatography tandem mass spectrometry, respectively. Statistically significant changes (p < .05) are indicated by asterisks; error bars represent standard error of the mean.
Qualification of miR-215 and miR-194 as Biomarkers of HSP90 Inhibitor–mediated GI Toxicity
A second investigative toxicity study was conducted using an HSP90 inhibitor, which previously caused injury in the stomach and cecum (data not shown). To induce GI injury, HSP90 inhibitor was administered at 15 or 30 mg/kg to male Wistar Han rats once daily for 5 days. Clinical observations at the 30-mg/kg dose included soft feces on day 6 as well as 10% weight loss. Dose-dependent, treatment-related lesions were noted within the GI tract, with the most prominent changes in the cecum; findings included mucosal atrophy and mucosal erosion and ulceration in both dose groups. Animals dosed with 30 mg/kg additionally exhibited minimally decreased sternal bone marrow cellularity, moderate thymic atrophy, and minimal to mild atrophy of the mesenteric adipose tissue.
Biomarker levels in fecal and plasma samples were assessed every other day throughout the study for citrulline and microRNA modulation. In the feces, an increase in miR-194 and miR-215 levels was observed on day 5 to 6 at 30-mg/kg dose only (Figure 6A). In the plasma, miR-194 was not detected at appreciable levels in any groups (Figure 6B). Contrarily, plasma miR-215 demonstrated dose-responsive decrease from day 2 forward at the 30-mg/kg dose group and on day 4 in at the 15-mg/kg dose group (Figure 6B). A significant decrease in plasma citrulline levels compared with the time-matched vehicle control group was only seen at the 30-mg/kg dose on day 6 (Figure 6C). The plasma data suggest miR-215 could detect injury earlier than citrulline. The histologic findings in the bone marrow, thymus, and mesenteric adipose tissue were expected to have minimal impact on the microRNA changes, since both microRNAs have not been shown to be expressed in the aforementioned tissues (Liang et al. 2007; Reddy et al. 2009; Barad et al. 2004; Collino et al. 2010).
Biofluid evaluation of miR-215, miR-194, and citrulline levels in the heat-shock protein 90 (HSP90) inhibitor study. Wistar Han rats were administered vehicle control (yellow) or HSP90 inhibitor at 15 mg/kg (light blue) or 30 mg/kg (dark blue) daily for 5 days. (A) Fecal samples were collected predose on days 1–2, 3–4, and 5–6 and analyzed for miR-215 and miR-194 levels by quantitative reverse transcription-polymerase chain reaction (qRT-PCR). Time points denote fecal sample collection over a 24-hr collection period. (B)–(C) Plasma samples were collected predose on days 2, 4, and 6 and analyzed for miR-215 and miR-194 (B) and citrulline (C) levels by qRT-PCR and liquid chromatography tandem mass spectrometry, respectively. Statistically significant changes (two-way analysis of variance, p < .05) are indicated by asterisks; error bars represent standard error of the mean.
Qualification of miR-215 and miR-194 as Biomarkers of Diclofenac-mediated GI Toxicity
To investigate the utility of miR-194 and miR-215 as general intestinal toxicity biomarkers, for compound diversity, the NSAID diclofenac, which is known to cause GI toxicity through mechanisms distinct from PAK4 and HSP90 inhibitors (Dammann, Khare, and Gasche 2014; Tamaki et al. 2011; Wallace 2013), was employed. Diclofenac was dosed at 5, 10, or 50 mg/kg to Wistar Han rats for 5 days to induce a spectrum of minimal to significant GI injury (Gan 2010; O’Brien 1986). Fecal and plasma samples were collected at multiple time points throughout the study for biomarker analysis, and terminal intestinal samples were evaluated histologically (Table 1). At the 10-mg/kg dose group, discolored feces was observed on day 4. Animals dosed at 50 mg/kg exhibited severe clinical signs starting on study day 2, including discolored feces, decreased skin turgor, hunched posture, and decreased activity, leading to unscheduled mortality. Microscopically, rats administered ≥ 5-mg/kg diclofenac exhibited dose-dependent GI lesions with the greatest severity affecting the jejunum, ileum, and cecum observed at day 5. Histologic changes (with the scores shown in Table 2) consisted of inflammation and mucosal erosions/ulceration as well as occasional transmural necrosis that was often associated with vascular thrombosis (infarction), as previously characterized (O’Brien 1986). In addition, hepatic necrosis was noted in the high-dose group. Other findings show increased bone marrow myeloid cells, pancreatic exocrine acinar atrophy, and mesenteric inflammation and necrosis on day 5.
Fecal and plasma samples were evaluated at regular intervals for citrulline and microRNA changes. In feces, there was an increase in miR-194 and miR-215 levels observed on day 3 to 4 at 50 mg/kg; however, no data were available for this dose group on day 5 to 6 due to early animal mortality (Figure 7A). In the plasma, miR-194 was initially undetectable until a slight increase was observed on day 2, most noticeably in the 50-mg/kg dose group; the level of miR-194 continued to increase on days 4 and 6 but only in the 50-mg/kg group. The changes in plasma miR-194 were unexpected since the PAK4 and the HSP90 inhibitor studies showed no detection of plasma miR-194 at baseline or following administration of the test article. The diclofenac-associated plasma miR-194 increase could be due to diclofenac-induced liver toxicity and subsequent release of hepatic miR-194. In contrast, plasma miR-215, which was detected at appreciable levels predose, demonstrated dose-responsive decrease from day 2 forward (Figure 7B). The more established biomarker plasma citrulline followed a similar trend as plasma miR-215; however, modulation was only seen at 50 mg/kg starting on day 4 (Figure 7C). In short, histologic and plasma citrulline results corroborated the microRNA findings (except for the plasma miR-194 changes) as being due to NSAID-mediated intestinal injury.
Biofluid evaluation of miR-215, miR-194, and citrulline levels in the diclofenac study. Wistar Han rats were administered vehicle control (yellow) or diclofenac at 5 mg/kg (blue), 10 mg/kg (purple), or 50 mg/kg (magenta) daily for 5 days. (A) Fecal samples were collected predose on days 3–4 and 5–6 and analyzed for miR-215 and miR-194 levels by quantitative reverse transcription-polymerase chain reaction (qRT-PCR). Day 5–6 samples for the 50-mg/kg dose group were not available due to animal mortality or unscheduled euthanasia on day 5. Time points denote fecal sample collection over a 24-hr collection period. (B)–(C) Plasma samples were collected predose on days 2, 4, and 5–6 and analyzed for miR-215 and miR-194 (B) and citrulline (C) levels by qRT-PCR and liquid chromatography tandem mass spectrometry, respectively. Due to mortality of some of the rats in the 50-mg/kg dose group, the surviving rats from the same dose group were euthanized on day 5 instead of day 6. Therefore, plasma samples in the 50-mg/kg dose group were collected on day 5 rather than bay 6 as was the case with the other dose groups. Statistically significant changes (two-way analysis of variance, p < .05) are indicated by asterisks; error bars represent standard error of the mean.
GKA, a Non-GI Toxicant, Did Not Cause MiR-215 or MiR-194 Changes
A GI toxicity negative control, GKA, was used to determine whether perturbation in microRNA or citrulline levels would arise in the absence of GI injury. Historically, animals treated with GKA showed a reduction in serum glucose, and there were no GI findings. GKA was dosed up to 300 mg/kg to Wistar Han rats for 5 days. Fecal and plasma samples were collected at multiple time points throughout the study for biomarker analysis, and terminal intestinal samples were evaluated histologically (Table 1). Animals treated with GKA had no histological findings in the intestines. Fecal (Figure 8A) and plasma (Figure 8B) miR-215 and miR-194 levels as well as citrulline levels (Figure 8C) were not altered in the GKA group when compared to the vehicle group.
Biofluid evaluation of miR-215, miR-194, and citrulline levels in the glucokinase activator (GKA) study. Wistar Han rats were administered vehicle control (yellow) or GKA at 300 mg/kg (Gray) daily for 5 days. (A) Fecal samples were collected predose on days 3–4 and 5–6 and analyzed for miR-215 and miR-194 levels by quantitative reverse transcription-polymerase chain reaction (qRT-PCR). Time points denote fecal sample collection over a 24-hr collection period. (B)–(C) Plasma samples were collected predose on days 2, 4, and 6 and analyzed for miR-215 and miR-194 (B) and citrulline (C) levels by qRT-PCR and liquid chromatography tandem mass spectrometry, respectively. Statistically significant changes (two-way analysis of variance, p < .05) are indicated by asterisks; error bars represent standard error of the mean.
Comparison of Plasma MiR-215 and Citrulline
To directly compare plasma miR-215 with plasma citrulline modulation across the 3 in vivo models, a correlation analysis was performed (Figure 4). A positive correlation is evident between plasma miR-215 and plasma citrulline across all 3 compounds and their associated dosing groups, but miR-215 demonstrated a wider dynamic range. In addition, histological scores are inversely correlated with the plasma miR-215 or plasma citrulline levels, suggesting the extent of plasma miR-215 or citrulline modulation reflected the severity of histologic lesions. In detecting intestinal injury, miR-215 showed an earlier onset of modulation and was more sensitive than plasma citrulline (Table 4). Together, the corroborating trends in plasma citrulline and histopathology across the 3 in vivo models provide support for plasma miR-215 as a promising and more sensitive biomarker for detecting intestinal toxicities induced by compounds of distinct mechanisms of action.
Tabulation of the Onset of Plasma MiR-215 and Citrulline Modulation in the In Vivo Studies.
Note. PAK4 = p21-activated kinase 4; HSP90 = heat-shock protein 90.
Discussion
Although several quantitative GI biomarkers exist to detect GI toxicity, limitations such as lack of sensitivity, specificity, invasive sample collection, and a potential to be influenced by GI conditions unrelated to injury result in questionable translatability. To date, there has been no systematic investigation into the potential of microRNAs as biomarkers of GI toxicity. Through the use of 3 in vivo models employing known GI toxicants and a negative control, coupled with tissue- and biofluid-based molecular analyses, we identified and qualified miR-194 and miR-215 as potential biomarkers of drug-associated intestinal toxicity. The in vivo models in this study, including recovery, showed the perturbation patterns of miR-194 and miR-215 in the feces and plasma closely followed the time course and severity of intestinal injury. Also, preliminary plasma miR-215 data suggest it is more sensitive than plasma citrulline in detecting intestinal injury. This is the first report to expand the repertoire of intestinal injury biomarkers to include microRNAs and paves the way for more detailed characterization in future studies. The authors suggest incorporation of microRNA testing in both sexes and other rat strains in conjunction with investigative studies to demonstrate microRNA modulation is not influenced by diet or toxicity in other tissues.
Mechanisms of GI toxicity mediated by pharmaceuticals are diverse (Wolfe, Lichtenstein, and Singh 1999; Loriot et al. 2008; Y. Wang and Aggarwal 1997), and we focused on compounds that cause direct damage to the intestinal mucosa in our study, including PAK4 and HSP90 inhibitors and the NSAID diclofenac. These compounds were chosen because they mediate mucosal injury through distinct biological pathways. Potential mechanisms of PAK4 inhibitor–mediated epithelial damage include deregulation of cell motility, morphology, and cytoskeletal dynamics (Eswaran et al. 2007). HSP90 inhibitors may have caused intestinal toxicity by affecting the interaction between HSP90 and its cellular substrates that play a critical role in growth control, cell survival, and tissue development (Bagatell and Whitesell 2004; Pratt 1998). Diclofenac, on the other hand, may directly inhibit cyclooxygenase, resulting in the suppression of prostaglandin production which is important in maintaining homeostasis of the GI mucosa (Sigthorsson et al. 2002; Tanaka et al. 2002). That largely similar patterns of miR-215 and miR-194 perturbation were observed with these compounds provides support that the microRNA changes were specific to the intestinal injury and not limited to a specific compound or biological pathway. In our study, we also included GKA, a compound that did not cause GI injury, to allow an assessment of the specificity of miR-194 and miR-215 modulation.
As potential biomarkers of intestinal injury, the tissue distribution and biological function(s) of miR-194 and miR-215 are relevant factors to consider. Literature review of miR-194 and miR-215 showed enriched expression of both microRNAs in the intestines (McKenna et al. 2010; Beuvink et al. 2007), consistent with our transcriptome analysis of untreated animals. These 2 microRNAs also belong to related microRNA clusters and are under some of the same regulatory controls (Braun et al. 2008; Georges et al. 2008), signifying similar localization and expression in the intestine. In addition, miR-194 and miR-215 expression is highly and specifically induced in differentiating intestinal epithelial cells (Hino et al. 2008). ISH data further corroborated intestinal localization for both microRNAs. Together, these findings confirm functional roles for miR-194 and miR-215 in the differentiation of intestinal epithelial cells and suggest injury-associated modulation of these microRNAs could be detected during early intestinal injury. It is important to note however that even though miR-215 and miR-194 are highly expressed in the GI tract, they are also expressed in additional tissues. MiR-194 is expressed in the mouse liver, kidney, and to a lesser extent in brain, heart, lung, skeletal muscle, and spleen (Hino et al. 2008; Meng et al. 2010; Kato et al. 2007). MiR-215, on the other hand, has a more restricted expression pattern outside the GI tract; it is expressed in the mouse kidney (Kato et al. 2007; Beuvink et al. 2007), and there is also evidence suggesting expression in the human liver (Kutay et al. 2006). Keeping the different tissue expression patterns in mind for both microRNAs, we set out to assess miR-194 and miR-215 levels in feces and plasma as potential biomarkers of intestinal toxicity in 3 different models.
An ideal biomarker for detection of injury/disease in any organ should allow for noninvasive sampling. Feces as a sample matrix has demonstrated potential for monitoring pathological changes within the GI tract, such as colon cancer and ulcerative colitis (Ahmed et al. 2013; Ahmed et al. 2009), and is a readily available sample source for the investigation of intestinal toxicity. In this study, miR-194 and miR-215 levels in the feces were low (near the limit of detection by reverse transcription-polymerase chain reaction [RT-PCR]) in vehicle-dosed rats. Upon induction of intestinal injury, they underwent a dose- and time-dependent increase. The fecal microRNA trends appeared to complement the dose-dependent decrease in the tissue levels of these microRNAs detected by ISH, suggesting sloughing of the necrotic epithelial cell debris, including microRNAs, and incorporation into the feces. To investigate whether these fecal microRNA changes were specific to intestinal injury, we also dosed rats with GKA, a non-GI toxicant, which did not cause morphologic signs of intestinal injury (data not shown) and likewise did not alter miR-194 and miR-215 levels in the feces (Figure 8A). In summary, our data provide evidence that miR-194 and miR-215 perturbation patterns in the feces specifically reflected underlying drug-associated intestinal injury.
The plasma is another sample matrix evaluated for a wide variety of noninvasive biomarkers due to the ease of sampling and its potential to signal toxicities in a distant site of injury. In vehicle and baseline samples, plasma miR-194 levels were low (near the limit of detection by RT-PCR), whereas plasma miR-215 was detected at 2 to 20 million copies/ml. Since miR-194 has a wider tissue distribution than miR-215 (Beuvink et al. 2007; Hino et al. 2008), the difference in miR-194 and miR-215 basal plasma levels may suggest differential export of miR-215 from tissue sources, primarily the intestines, into the plasma. Following administration of each of the 3 intestinal toxicants, dose- and time-responsive decreases in plasma miR-215 levels were observed, complementing a concomitant increase in fecal miR-215 and suggesting a disruption of the miR-215 export into plasma due to intestinal injury. At the same time, plasma miR-194 levels remained undetectable following administration of PAK4 or HSP90 inhibitors but became elevated following dosing with diclofenac. Diclofenac in our hands caused vascular thrombosis in addition to epithelial injury in the GI tract, consistent with known mechanisms of toxicity (Wallace 2013). Such vascular lesions were not noted with the PAK4 or HSP90 inhibitors. It is plausible that the breach of intestinal vasculature led to the release of miR-194 into the plasma that otherwise would not have occurred in the absence of such injury. Diclofenac also caused hepatic necrosis in the high-dose group. The hepatic lesion coupled with miR-194’s localization to liver hepatocytes may have contributed to the plasma miR-194 elevation in the diclofenac study but not in the PAK4 and HSP90 inhibitor studies. Therefore, a different compound that did not cause toxicities beyond the intestinal mucosa would have been better suited to investigate plasma miR-194 modulation. Finally, to demonstrate specificity, the non-GI toxicant, GKA, did not cause histologic signs of intestinal injury; consequently, plasma miR-215 (Figure 8B) or citrulline levels (Figure 8C) were not modulated significantly. Taken together, the plasma microRNA data lend support to plasma miR-215 being a superior biomarker to plasma miR-194, due to the more restricted tissue distribution of miR-215 and its significant modulation in response to each of the 3 distinct intestinal toxicants.
Any new prospective biomarker needs to be qualified based on currently applied test systems; in the case of intestinal toxicity, plasma citrulline is one of the more established quantitative biomarkers. Decreases in plasma citrulline levels have been shown to correlate with villous (mucosal) atrophy (Crenn et al. 2000; Papadia et al. 2010) and radiation-induced intestinal epithelial cell loss (Lutgens et al. 2003). Whereas citrulline levels could be affected by alteration in the gut microflora (John-Baptiste et al. 2012), there is evidence that miR-215 and miR-194 are not (Archambaud et al. 2013). With all 3 compounds, plasma miR-215 levels, for the most part, showed an earlier onset (Table 4) or a larger magnitude of change (note the logarithmic scale of miR-215 to the linear scale of citrulline; Figure 4) compared to plasma citrulline modulation. This suggests that plasma miR-215 is more sensitive and less affected by normal variations in GI conditions than plasma citrulline in detecting intestinal lesions.
Reversibility of biomarker signals as a result of recovery from tissue injury is another key parameter in the evaluation of putative biomarkers. The PAK4 inhibitor time-course study was conducted to investigate this parameter for plasma miR-215 and citrulline. Following the cessation of compound dosing, recovery in histopathologic lesions was seen (Table 3) and reflected in the return of plasma miR-215 and citrulline to control levels (Figure 5). These data demonstrate that the modulation of both plasma miR-215 and citrulline was capable of tracking the recovery from drug-associated intestinal injury.
An examination of vehicle control levels of plasma miR-215 (Figures 3B, 5A, 6B, and 7B) and citrulline (Figures 3C, 5B, 6C, and 7C) reveals a greater temporal variation in the former across time points within the same study and also across different studies. Plasma citrulline levels in vehicle control groups showed minimal intra- and interstudy variation. On the other hand, plasma miR-215 levels in vehicle control groups displayed more variation but were largely comparable throughout the study duration until day 6 when a notable decrease was observed across studies (Figures 3B, 5A, 6B, and 7B). Notable interstudy variation in plasma miR-215 levels in vehicle control groups was also observed. Vehicle control levels of fecal miR-215 showed similar trends in intra- and interstudy variation. Taken together, the variability in fecal and plasma miR-215 levels could not be accounted for by known parameters within the experimental protocols. It is possible that miR-215 levels were susceptible to variations in experimental procedures that were not controlled for; therefore, inclusion of time-matched controls is important to ensure optimal interpretation of compound-mediated effects.
Our data provide evidence for the potential utility of microRNAs as biomarkers of drug-associated intestinal toxicity and add to the growing body of literature, investigating the utility of microRNAs for different organ toxicities and diseases. MicroRNAs are attractive as biomarkers for several reasons: they are conserved among mammalian species and have been found in the serum of mice, rats, calves, and horses (Chen et al. 2008). Their short sequences are exceptionally stable compared with mRNAs in bodily fluids (Szafranska et al. 2008) and are able to survive in the hostile environment of plasma and other biological samples. The stability of microRNAs could be attributed to their packaging into vesicles such as exosomes or apoptotic bodies (Vickers et al. 2011; Zernecke et al. 2009) or to vesicle-independent association with proteins of Argonaute family (Arroyo et al. 2011). Moreover, microRNAs are quantifiable, supporting their potential roles as noninvasive, sensitive diagnostic, or progression biomarkers in various diseases such as cancer (Chen et al. 2008; Lawrie et al. 2008; Mitchell et al. 2008), drug-induced liver injury (K. Wang et al. 2009), acute retinal injury (Peng, Huang, and John-Baptiste 2014), cardiac toxicity (Ji et al. 2009), and injuries in muscle and brain (Laterza et al. 2009). Despite the aforementioned features that make microRNAs promising biomarkers of organ toxicities or disease states, certain challenges exist when working with microRNAs. Levels of certain microRNAs may be low in biofluids, especially in plasma/serum, thus rendering microRNA detection problematic. Cellular contamination due to hemolysis in plasma can artificially skew the data, and the presence of inhibitors in biofluids could inhibit enzymatic assays such as quantitative RT-PCR. Moreover, the mechanisms by which microRNAs are released in the bloodstream remain unclear. Current hypotheses include passive release during cell death or disruption of plasma membrane integrity (Ji et al. 2009) as well as active release through ceramide-dependent secretory machinery (Kosaka et al. 2010). Finally, as with all biomarkers, specificity or tissue distribution of biomarkers is important. Care must be taken to ensure microRNA changes are due to toxicity stemming from the organ of interest and not from another organ or other disease states. Despite the enriched intestinal expression of miR-215 and miR194, they are expressed in some other normal tissues (Kato et al. 2007; Meng et al. 2010; Beuvink et al. 2007; Hino et al. 2008) and have been used as biomarkers of various disease states (Z. Q. Zhang, Meng, et al. 2014; J. Zhang, Zhao, et al. 2014; Karaayvaz et al. 2011; Khella et al. 2013; Deng et al. 2014; Zhai et al. 2013; Matsumoto et al. 2013). For example, serum miR-215 has been shown to be a potential biomarker for the diagnosis of chronic hepatitis and hepatocellular carcinoma (Z. Q. Zhang, Meng, et al. 2014), and serum miR-194 has been explored as a predictor of ischemic heart failure (Matsumoto et al. 2013). Therefore, using other testing modalities to identify toxicities in other organs such as the heart or the liver would be useful in order to confirm microRNA changes were due to GI toxicity and no other organ toxicity. Keeping these technical and general considerations in mind will facilitate further research with microRNAs.
As a whole, this report provides preliminary but novel evidence that miR-215 and miR-194 could serve as biomarkers of drug-associated intestinal toxicity. MiR-215 and miR-194 are enriched in the intestines (demonstrated by ISH) and show a role in the differentiation of intestinal epithelial cells (McKenna et al. 2010). In the detection of drug-associated intestinal toxicity, the modulation of miR-215 and miR-194 levels in the feces and miR-215 levels in the plasma correlated with histopathology and citrulline data. Plasma miR-215 was also more sensitive and its onset of significant perturbation appeared earlier than the more established biomarker citrulline during the progression of intestinal epithelial injury. Finally, the recovery of intestinal epithelial injury was reflected by a reversal in miR-215 and citrulline modulation back to vehicle control levels. In conclusion, we presented evidence that miR-215 and miR-194 can act as quantitative, noninvasive, and sensitive biomarkers for the detection of drug-associated intestinal injury and recovery. This report expands the list of available biomarkers to researchers and practitioners studying and managing intestinal injury. Continued efforts in rigorous biomarker validation will further define their strengths and weaknesses toward an informed application in the preclinical drug discovery arena.
Materials and Method
Study Design
All animal studies were conducted in accordance with the current guidelines for animal welfare (National Research Council Guide for the Care and Use of Laboratory Animal, 2011; Animal Welfare Act [AWA], 1966, as amended in 1970, 1976, 1985, and 1990, and the AWA implementing regulations in Title 9, CFR Chapter 1, subchapter A, parts 13). The procedure used in this study was reviewed and approved by the Institutional Animal Care and Use Committee and executed in a facility accredited by the Association for Assessment and Accreditation of Laboratory Animal Care International. Male Wistar Han rats [Crl: WI(HAN)] were purchased from Charles River Laboratories (Hollister, California). All animals were single housed (1/cage) in a refrigerated metabonomic caging at 18C–26°C, with a relative humidity of 30% to 70% and a 12-hr light/dark cycle. Feed (Certified rodent diet #5002; PMI Nutrition International, LLC, Brentwood, MO) and purified municipal water was provided to the animals ad libitum. The doses selected for each drug were based on previous studies conducted on rats, where GI toxicity was detected. Studies began after an acclimation period of at least 5 days prior to the initiation of dosing. Clinical signs and body weights were monitored throughout the duration of the study. All animals were weighed prior to termination. Blood containing ethylenediaminetetraacetic acid (EDTA) and fecal samples were collected for microRNA analysis. Animals were euthanized the day after the last dosing and fasted overnight prior to scheduled necropsy. Animals were euthanized by isoflurane inhalation followed by exsanguination. Tissues were collected and fixed in 10% buffered formalin, processed, embedded, and stained with standard hematoxylin and eosin for histopathology evaluation. Tissue evaluation was performed by a board certified pathologist on all the animals.
In a GI toxicity model, experiments were executed according to Table 1 to assess the performance of potential early predictive GI biomarkers in circulation after exposure to a PAK4 inhibitor, HSP0 inhibitor, diclofenac, and GKA (negative control). In each experiment, rats were administered compound once daily via oral gavage over a 5-day period with daily clinical observations. All animals were weighed on days 1 (prior to dosing), 3, 5, and 6 prior to termination. In the PAK4 inhibitor time-course study, an additional clinical observation was performed on day 13, and the recovery group was weighed on day 9 and prior to termination on day 13.
MicroRNA Gene Arrays
Total RNA was isolated from the jejunum of vehicle- and 5- or 15-mg/kg PAK4 inhibitor–dosed rats using the miRNeasy kit (Qiagen, Valencia, CA). The quality of the total RNA was verified by an Agilent 2100 Bioanalyzer profile. For microRNA gene array analysis, 300-ng total RNA from sample and reference was labeled with Hy3™ and Hy5™ fluorescent label, respectively, using the miRCURY™ locked nucleic acid (LNA) array power labeling kit (Exiqon, Denmark), following the procedure described by the manufacturer. The Hy3-labeled samples and a Hy5-labeled reference RNA sample were mixed pairwise and hybridized to the miRCURY LNA array version 11.0 (Exiqon, Denmark), which contains capture probes targeting all microRNAs for human, mouse, or rat registered in the miRBASE version 14.0 at the Sanger Institute. The hybridization was performed according to the miRCURY LNA array manual using a Tecan HS4800 hybridization station (Tecan, Austria). After hybridization, the microarray slides were scanned and stored in an ozone-free environment (ozone level below 2.0 ppb) in order to prevent potential bleaching of the fluorescent dyes. The miRCURY LNA array microarray slides were scanned using the Agilent G2565BA Microarray Scanner System (Agilent Technologies, Inc., USA), and the image analysis was carried out using the ImaGene 8.0 software (BioDiscovery, Inc., USA). The quantified signals were background corrected (Normexp with offset value 10; Ritchie et al. 2007) and normalized using the global LOcally WEighted Scatterplot Smoothing (Lowess) regression algorithm. A two-tailed t-test calculated between PAK4 inhibitor and vehicle groups identified 10 microRNA with p values less than .01.
ISH
MiR-194 and miR-215 transcripts were localized in formalin-fixed, paraffin-embedded sections of rat small intestine and colon by ISH, using the automated Tecan Evo 150 Genepaint platform. Tissue sections were deparaffinized in xylene and rehydrated through graded ethanols to phosphate-buffered saline (PBS). Slides were assembled into Tecan TeFlow slide chambers and loaded on the TeFlow block, and all subsequent steps were performed on the Tecan Evo150 instrument. Tissue sections were digested with 8-µg/ml proteinase K (PK) in PK buffer (5-mM Tris-HCl pH 7.4, 1-mM EDTA, and 1-mM NaCl) for 8 min at 37°C and stopped in 2 changes of PBS. The sections were then prehybridized in 1× hybridization buffer (Exiqon Inc., Woburn, MA) at 60°C for 15 min. Digoxigenin (DIG)-labeled LNA probes (Exiqon, Inc.) were denatured at 90°C for 4 min and then quickly cooled on an ice bath and added to 1× hybridization buffer. After prehybridization, the tissues were incubated with double-DIG-labeled LNA probe in 1× hybridization buffer at a final concentration of 60 nM (for miR-194) or 80 nM (for miR-215) for 1 hr at 60°C, with fresh probe added after 30 min. Slides were washed in 5× SSC (saline sodium citrate) at room temperature for 5 min, followed by washes in 5× SSC (1 × 5 min), 1× SSC (2 × 5 min), and 0.2× SSC (2 × 5 min) at 60°C, and 0.2× SSC (1 × 5 min) and PBS at room temperature. Tissue sections were then incubated in blocking buffer (DIG Wash and Block Buffer Set, Roche, Indianapolis, IN) for 5 min at 30°C. Sheep anti-DIG antibody conjugated to alkaline phosphatase (anti-DIG-AP) was added at 1:800 in blocking buffer containing 0.2% sheep serum for 30 min at 30°C, with fresh anti-DIG-AP added after 15 min. Slides were then washed with PBS and incubated with nitro blue tetrazolium/5-bromo-4-chloro-indolyl-phosphate (NBT/BCIP) substrate (Roche) in AP buffer (100-mM Tris-HCl, 100-mM NaCl, 5-mM MgCl2, 0.05% Tween-20, pH 9.5), containing 0.2-mM levamisole for 1 hr at 30°C, with new substrate added every 20 min. The alkaline phosphatase reaction was stopped using a buffer consisting of 50 mM Tris-HCl, 150 mM NaCl, and 10 mM KCl, and slides were washed in water before counterstaining with filtered Nuclear Fast Red. Slides were then removed from the TeFlow block and slide chambers and dehydrated through graded ethanols to 100% ethanol before mounting cover slips with Eukitt mounting medium (Fisher Scientific, Waltham, MA). Reaction controls consisted of serial sections of tissues incubated with DIG-labeled LNA probe against miR-145, which is expressed by smooth muscle cells (positive control), and DIG-labeled LNA scramble negative control probe; both control probes were acquired from Exiqon.
Histopathology
Sections of duodenum, jejunum, ileum, cecum, and colon were examined histologically by a board-certified veterinary pathologist. Tissues were scored for the following lesions: necrosis (including single cell necrosis and crypt necrosis), mucosal atrophy (including crypt loss, villous blunting and fusion, and attenuation of mucosal epithelium), and erosion/ulceration. Lesion severity was scored on a 5-point scale, where 0 = no changes, 1 = minimal changes, 2 = mild changes, 3 = moderate changes, 4 = marked changes, and 5 = severe changes. The 3 scores for each lesion were added to create a single “sum score” for each tissue per animal and then averaged for each dose group.
Plasma Preparation
Approximately 0.8 ml of blood was collected in EDTA tubes (BD microtainer tubes, Cat. # 355973) from all animals per time point (Table 1) via lateral tail vein or inferior vena cava (at termination) for biomarker analysis. Samples were spun down at 1,100 g for 10 min at 4°C for citrulline analysis. About 200 μl of plasma was alliquoted into new tubes and further spun down at 16,000 g for 10 min and stored at −80°C for microRNA analysis.
Plasma L-Citrulline
The quantification of citrulline was performed by liquid chromatography tandem mass spectrometry (LC/MS/MS) in the selected reaction monitoring mode on an AB Sciex 5500 QTRAP (Framingham, MA) mass spectrometer, operated in the positive ionization mode. A deuterium-labeled isotope of citrulline (d4-L-citrulline) was employed as an internal standard in the method. For the analytes of interest, the following precursor-to-product ion transitions were obtained and optimized through direct infusion of each compound into the mass spectrometer: citrulline mass-to-charge ratio value (m/z) 176 > 70 and d4-citrulline m/z 180 > 74. Chromatographic conditions for the method consisted of a Shimadzu (Columbia, MD) high-performance liquid chromatography (HPLC) system and a Waters Atlantis HILIC silica HPLC column. The mobile phase consisted of 0.1% formic acid and acetonitrile with the HPLC pumps programmed to deliver a linear gradient at a flow rate of 0.3 ml/min. Final chromatographic retention time for all analytes was approximately 3.5 min.
The assay protocol consisted of diluting all samples 20-fold in water, followed by protein precipitation with acetonitrile and injecting 10 µl of supernatant into the LC/MS/MS system. With a linear calibration range from 0.5 to 50 µg/ml for citrulline using aqueous-based standards, quality control samples prepared in rat plasma demonstrated the assay to have an accuracy and precision error within 15%. Robustness of the assay was also confirmed through assessments of analyte recovery from different lots of plasma, freeze-thaw and sample storage stability, as well as selectivity from other potentially interfering components.
MicroRNA Extraction from Feces
Fecal droppings from each animal were collected separately, weighed, and reconstituted with RNase free water by taking the weight and multiplying by 3 which equals the amount of water in milliliters. The reconstituted feces was left in the fridge overnight to soften and homogenized the next day. One gram was weighed out and frozen at −80°C until ready for purification. When purifying 1 g of feces, 3-ml TRIzol LS RNA reagent (Invitrogen, Carlsbad, CA) was added and vortexed and left to stand at room temperature for 5 min. Next, 800 μl of chloroform was added and shaken by hand for 15 sec and allowed to stand at room temperature for 5 min and centrifuged at 4,000× g for 15 min at 4°C. Then, 1.6 ml of supernatant (75% of predicted volume) was gently mixed with 2.4 ml of 100% ethanol (1.5 volumes). The sample is then passed through a filter cup from an Rneasy midi kit (Qiagen, Valencia, CA) and centrifuged for 7 min at room temperature. The filter is washed once with 4 ml of RWT buffer and centrifuged for 5 min at room temperature. The filter is washed twice with 2.5 ml of RPE solution (centrifuge at room temperature 5 min for first spin and 10 min for a second spin). The filter cartridge is transferred to a fresh collection tube, and the microRNA is eluted with 200 μl of RNase-free water and centrifuged at maximum speed for 10 min. The final volume is measured and recorded before it is stored at −80°C.
MicroRNA Extraction from Plasma
Plasma samples were collected separately from each animal. Blood was processed to extract the plasma and then frozen at −80°C until RNA extraction. Total plasma RNA was extracted using TRIzol LS RNA reagent (Invitrogen, Carlsbad, CA) according to the manufacturer’s instructions. Low molecular-weight RNA was then isolated using the mirVana microRNA isolation kit (Ambion, Austin, TX).
RT and qPCR
RT and qPCR were performed on purified RNA using miR-215 and miR-194 TaqMan microRNA assays (Applied Biosystems, Foster City, CA). For each microRNA target evaluated, 5 μl of RNA was used in a 15-μl RT reaction; 15-μl RT reactions were performed using a TaqMan microRNA reverse transcription kit (Applied Biosystems catalog # 4366596) and incubated for 30 min at 16°C, 30 min at 42°C, 5 min at 85°C, and then maintained at 4°C. For real-time PCR, duplicate reactions using 1.33 μl of the RT in a 20-μl reaction and containing primers and probes for each microRNA and TaqMan Universal Master Mix II. All reactions were run on a LightCycler 480 (Roche) using the following conditions: 95°C for 10 min, followed by 40 cycles at 95°C for 15 sec and 60°C for 1 min. Copies per reaction were determined using a standard curve of synthetic miR-215 and miR-194 microRNAs (Integrated DNA Technologies, Coralville, IA). The data were plotted on GraphPad Prism 6 software (GraphPad Software, San Diego, CA).
Statistical Analysis
The values of experimental data were expressed as the mean ± standard error of the mean and analyzed using two-way analysis of variance using GraphPad Prism 6 software (GraphPad Software Inc., San Diego, CA) followed by SAS 9.4 for Windows software (SAS Institute Inc., Cary, NC). Differences with p < .05 were considered statistically significant.
Footnotes
Acknowledgments
Special thanks to Patrick Lappin, Shawn O’Neil, Aida Sacaan, Dingzou Li, Shirley Aguirre, Bob Denlinger, William Schaiff, Frederick Sace, Rolla Yafawi, Qing Zong, Annette Wu, and Pfizer La Jolla Histology group for their contribution to the article.
Author Contributions
Authors contributed to conception or design (AJ, HW, AY); data acquisition, analysis, or interpretation (DK, AV, WS, EK, KH, HW, AY); drafting the manuscript (DK, AY); and critically revising the manuscript (DK, AV, WS, EK, KH, AJ, HW, AY). All authors gave final approval and agreed to be accountable for all aspects of work in ensuring that questions relating to the accuracy or integrity of any part of the work are appropriately investigated and resolved.
Declaration of Conflicting Interests
The author(s) declared no potential conflicts of interest with respect to the research, authorship, and/or publication of this article.
Funding
The author(s) received no financial support for the research, authorship, and/or publication of this article.