
Abstract
Silver nanoparticle (Ag NP) production methods are being developed and refined to produce more uniform Ag NPs through chemical reactions involving silver salt solutions, solvents, and capping agents to control particle formation. These chemical reactants are often present as contaminants and/or coatings on the Ag NPs, which could alter their interactions in vivo. To determine pulmonary effects of citrate-coated Ag NPs, Sprague-Dawley rats were exposed once nose-only to aerosolized Ag NPs (20 nm [C20] or 110 nm [C110] Ag NPs) for 6 hr. Bronchoalveolar lavage fluid (BALF) and lung tissues were obtained at 1, 7, 21, and 56 days postexposure for analyses. Inhalation of Ag NPs, versus citrate buffer control, produced significant inflammatory and cytotoxic responses that were measured in BALF cells and supernatant. At day 7, total cells, protein, and lactate dehydrogenase were significantly elevated in BALF, and peak histopathology was noted after C20 or C110 exposure versus control. At day 21, BALF polymorphonuclear cells and tissue inflammation were significantly greater after C20 versus C110 exposure. By day 56, inflammation was resolved in Ag NP–exposed animals. Overall, results suggest delayed, short-lived inflammatory and cytotoxic effects following C20 or C110 inhalation and potential for greater responses following C20 exposure.
Introduction
Increased antimicrobial resistance, emergence of new pathogens, and resurgence of old infectious diseases necessitate novel solutions. Silver nanoparticles (Ag NPs) are being used to produce disinfectants in liquid (e.g., soaps and sprays) and solid (e.g., textiles and water treatments) forms due to their antimicrobial effects against a wide array of pathogens. Although use of nano silver is not new, our ability to produce it on a larger scale and incorporate it into a larger variety of matrices have expanded exponentially in recent years; thus, Ag NPs can be found in a myriad of consumer products (e.g., baby bottles, pesticides, and dietary supplements), medical equipment/supplies (e.g., lab coats, catheters), and public spaces (e.g., subways; Seltenrich 2013).
Top-down production methods are often used to manufacture Ag NPs. These methods involve the use of physical processes (e.g., cutting, etching) which break down bulk silver precursor materials into isolated atoms. With this method, surface defects are common (U.S. Environmental Protection Agency 2010). However, new bottom-up production methods are increasingly being developed and/or refined to manufacture more uniform and stable Ag NP suspensions through chemical reactions involving silver salt precursors (e.g., AgNO3), solvents (e.g., ethylene glycol), reducing agents, and stabilizing/capping agents (e.g., citrate, or polyvinylpyrrolidone [PVP]; Tolaymat et al. 2010). These chemical reactants are often present as contaminants and/or coatings on the Ag NPs, which could alter their interactions in vivo. In the production of monodisperse Ag NP suspensions, citrate is a commonly used reducing and surface coating capping agent that can inhibit oxidative dissolution of Ag NPs (Huynh and Chen 2011).
It is unclear whether and how Ag NPs and/or their coatings adversely affect human health. At least two occupational studies in Ag NP manufacturing plants have shown that the concentration of Ag NPs in the air increases during production (Park et al. 2009; Lee et al. 2012), which could increase the risk for inhalation exposure. Bolus intratracheal instillation or oropharyngeal aspiration exposure studies (Haberl et al. 2013; Wang et al. 2013) in rodents suggest that PVP- and citrate-coated Ag NPs are inflammatory and/or cytotoxic. Our laboratory (Silva et al. 2015) has shown with 20- and 110-nm citrate- or PVP-coated Ag NPs that all Ag NP types produce a significant influx of inflammatory polymorphonuclear cells (PMNs) in bronchoalveolar lavage fluid (BALF) following an alternate exposure method, intratracheal instillation, at days 1, 7, and/or 21 postexposure with 0.5 and/or 1.0 mg/kg body weight dose(s). Animals instilled with the highest dose had dead/dying cells at branch points along the main airway at postexposure day 1 and centriacinar inflammation, including influx of PMNs, monocytes, and/or macrophages, at all time points. However, by postexposure day 21, only animals instilled with 110-nm citrate- or PVP-coated Ag NPs (at 1.0 mg/kg body weight) exhibited significant BALF neutrophilia and marked cellular debris in alveolar airspaces.
Inhalation studies with uncoated Ag NPs suggest that they produce inflammation, allergic reactions, decrements in lung function, and/or DNA damage (Sung et al. 2008; Sung et al. 2009; Kwon et al. 2012; Cho et al. 2013; Chuang et al. 2013; Su et al. 2013; Song et al. 2013; Braakhuis et al. 2014) following acute, subchronic, and/or chronic exposures. In contrast, numerous other inhalation studies suggest that uncoated Ag NPs produce no adverse (toxic) responses (Hyun et al. 2008; Stebounova et al. 2011; Sung et al. 2011; Roberts et al. 2013). For example, Stebounova and colleagues (2011) found that mice inhaling uncoated Ag NPs (5 ± 2 nm) at 3 mg/m3, 4 hr/day, for 10 days showed minimal inflammatory or cytotoxic responses. Work by Roberts and colleagues (2013) with rats exposed to a wet aerosol of uncoated colloidal Ag NPs showed similar results. After 5 hr inhalation of a “low” (100 µg/m3) or “high” (1,000 µg/m3) concentration of Ag NPs (mean aerodynamic diameter = 33 or 39 nm, respectively) from a commercially available antimicrobial product, no acute toxic cardiopulmonary responses were noted. Although a study by Braakhuis and colleagues (2014) was completed using PVP-coated Ag NPs, the PVP was removed prior to exposure; therefore, our group is the first to investigate the pulmonary effects of coated Ag NPs.
The current study aimed to determine whether the responses noted previously upon intratracheal instillation (Silva et al. 2015) and oropharyngeal aspiration (Wang et al. 2013) were due to high Ag NP dose rates or physicochemical properties of the tested particles. The same batches of 20- and 110-nm citrate-coated Ag NPs (C20 and C110, respectively) tested by intratracheal instillation and oropharyngeal aspiration were used. The citrate-coated Ag NPs were chosen specifically because in vitro work by Wang and colleagues (2013) suggested that 20-nm Ag NPs exhibited faster dissolution and a higher ability to produce cellular toxicity and/or oxidative stress than 110-nm particles, irrespective of coating. In their study, citrate-coated Ag NPs produced greater and/or longer-lasting effects than PVP-coated ones due to a greater ability of PVP-coated Ag NPs to complex released Ag cations (Ag+). Previous studies by our group, Anderson, Silva, et al. (2015), using the same materials showed greater clearance of instilled PVP- versus citrate-coated Ag NPs. In accordance with findings by oropharyngeal aspiration (Wang et al. 2013), we hypothesized that nose-only inhalation of C20 would produce greater acute cellular toxicity and neutrophilic inflammation than C110 and that C110 would produce mild subchronic pulmonary fibrosis.
Findings in the current study are considered in relation to a companion paper (Anderson, Patchin, et al. 2015) reporting the Ag NP retention patterns for the same animals. Those results suggested that up to 56 days after nose-only inhalation of C20 or C110, silver persisted in lung tissues primarily at terminal bronchiole–alveolar duct junctions. In addition, at postexposure days 21 and 56, silver from C20 persisted in BALF macrophages to a greater degree than C110.
Materials and Methods
Physicochemical Characterization of Stock Ag Nanoparticles
Citrate-stabilized Ag NPs tested in the current study were purchased from nanoComposix, Inc. (San Diego, CA), from the BioPure™ line of materials and supplied by the National Institute of Environmental Health Sciences Centers for Nanotechnology Health Implications Research consortium. BioPure Ag NPs are extensively purified by nanoComposix, Inc., to remove residual reactants aside from those coating/capping the Ag NPs for stability (e.g., citrate); therefore, they are ideal for nanotoxicology and environmental studies aimed at determining the effects of coated Ag NPs. Suspensions included 20-nm and 110-nm citrate-coated Ag NPs (lot numbers MGM1659 and MGM1662, respectively) that underwent initial physicochemical analysis by the National Characterization Laboratory. Primary size and morphology, hydrodynamic size and electrostatic potential, elemental and Ag+ composition, and endotoxin content were determined using transmission electron microscopy (TEM), dynamic light scattering, inductively coupled plasma mass spectrometry (ICP-MS), and the Kinetic Turbidity and Gel-clot limulus amebocyte lysate assays, respectively. Descriptions and results of these characterization methods have been presented previously (Wang et al. 2013; Anderson, Silva, et al. 2015).
Aerosolized Ag NP size distribution, particle mass concentration, and silver concentration were determined as described (Anderson, Patchin, et al. 2015) by TEM and a scanning mobility particle sizer, gravimetric, and X-ray fluorescence analyses, respectively.
Aerosol System and Inhalation Exposures
Preparation of the Ag NP and sham control suspensions and operation of the exposure system used for the inhalation studies have been described previously (Anderson, Patchin, et al. 2015). Endotoxin free water (Fisher Scientific, Pittsburg, PA) was used to dilute trisodium citrate dihydrate powder (Sigma, St. Louis, MO) to make a 2-mM citrate buffer (pH = 7.5, sham control) of the same concentration as the suspended Ag NPs (1.0 mg/ml).
Ag NP suspension or sham control buffer was introduced via a Mesa Labs 6-jet Collison nebulizer (Butler, NJ) operated at 20 psi (6.9 kPa) for a manufacturer-specified output of 12 L/min over the exposure period. Utilization of the Mesa Labs nebulizer coupled to a downstream heater, diffusion dryers, and a Krypton-85 source (for charge neutralization) allowed for efficient delivery of a dry aerosol to the nose-only exposure chamber (Raabe et al. 1973) with minimal aggregation of particles. The aerosolization and exposure system is shown in Figure 1 and is also described in Anderson, Patchin, et al. (2015).
Aerosolization and exposure system.
Food was removed from animal cages 2 hr prior to exposure. Each animal entered an exposure tube that was coupled at an open nose port to the exposure system. Rats were exposed to either nebulized Ag NPs in citrate buffer or citrate buffer alone for a single 6-hr period.
Animal Protocol
Male, 12-week old Sprague-Dawley (SD) rats (Harlan Laboratories, Inc., Hayward, CA) were used for all experiments based on their extensive use in experimental studies and even temperament. Six animals per treatment group per time point were randomly assigned (n = 72, including controls). Animals were maintained (Silva et al. 2013), acclimated, and exposed (Anderson, Patchin, et al. 2015) in accordance with the UC Davis Institutional Animal Care and Use Committee. Animals were housed in pairs with enrichment objects and given access ad libitum to Laboratory Rodent Diet (Purina Mills, St. Louis, MO). In the week prior to the scheduled exposure, animals were trained to enter and remain in the exposure tubes until released. Time in the tube increased incrementally up to 6 hr over the training to decrease confinement stress during the actual 6-hr inhalation exposure period.
After a one-time, 6-hr nose-only exposure to aerosolized C20, C110, or citrate buffer, animals were euthanized at 1, 7, 21, or 56 days postexposure for collection of BALF and tissues. BALF was retrieved from lavaged right lungs and separated into cellular and supernatant fractions for determination of cell counts and differentials (Anderson, Patchin, et al. 2015) and same-day protein and lactate dehydrogenase analyses, respectively. Isolated left lungs were fixed with 4% paraformaldehyde for subsequent sectioning and staining as previously described (Silva et al. 2013). Hematoxylin and Eosin stains (H&E, Harris Hematoxylin, and Eosin Y Stain) were used to determine cellular infiltrates and epithelial abnormalities. Alcian Blue/Periodic Acid Schiff stain (AB/PAS) was used for verification of goblet (mucus) cell hyperplasia and/or changes in the types of mucosubstances being secreted in the airways. Stains were purchased from American MasterTech, Inc., Lodi, CA. Assessment of samples was performed blind. Semiquantitative histological assessment of H&E slides was performed using an ordinal scoring system (Table 1) designed to distinguish the degree of lung inflammation in the H&E-stained tissue sections. Severity scores ranging from 0 to 3 were used, and severity was assessed by noting the most advanced grade present within the specific sample irrespective of its horizontal extent. Extent was defined as the horizontal distribution of the pathology, where a score of 0, 1, 2, or 3 meant none of the lung was involved, ≤1/3 involvement, >1/3 to 1/2 involvement, or >1/2 involvement, respectively. The overall score was defined as a combined assessment of severity and extent (overall score = severity × extent).
Semiquantitative Histopathology Severity Scores.
High-resolution histopathology was enabled by examination of 1-µm lung sections embedded in araldite resin. Left lung lobes from 2 animals per treatment group (C20-, C110-, or citrate buffer-exposed) per time point were fixed in Karnovsky’s fixative and processed as previously described (Anderson, Silva, et al. 2015) to preserve ultrastructural cellular features.
Statistical Analysis
BALF data are presented as mean ± standard error of the mean (SEM). JMP 10.0.0 statistical software (Cary, NC) was used to perform analyses of variance (ANOVAs), and post hoc Tukey’s tests at a significance level of p ≤ .05. Data were analyzed for deviations from the assumptions of ANOVA and transformed to meet the requirement of normality when needed. To address issues of skewness and/or kurtosis, BALF total cell and protein data were adjusted using −1/x, and log (x + 1) transformations, respectively, where “x” corresponded to an individual data point. Leptokurtic (peaked) BALF PMN data could not be corrected for normality. However, ANOVA was used because it tolerates violations to its normality assumption with only a small effect on Type I (false discovery) errors. To account for possible errors in the case of BALF PMNs, a stricter p value of .01 was used.
Ordinal histopathology scores were also peaked. In this case, an ANOVA (p = .01) was still preferable to multiple, separate nonparametric categorical analyses, which can introduce Type I and II errors and do not test the interactions between the independent variables. No outliers were identified for BALF of histopathology by box plots and/or Grubb’s outlier tests.
Results
Aerosol Characterization
Full descriptions of the generated aerosols have been reported previously (Anderson, Patchin, et al. 2015). Silver concentrations averaged 7.2 ± 0.8 mg/m3 and 5.3 ± 1.0 mg/m3 for C20 and C110 Ag NPs, respectively. According to cascade impactor measurements, 82% or 81% of C20 or C110 particles were ≤1.6 µm in diameter, suggesting that the aerosolized particulates were submicron in size. Given the characterization data and a respiration minute volume for rats of approximately 0.21 L/min (Anderson, Patchin, et al. 2015), silver deposition in the alveolar and tracheobronchial regions was estimated to be 69 and 17 µg, respectively, for C20 exposures, or 41 and 12 µg, respectively, for C110 exposures (Anderson, Patchin, et al. 2015). Corresponding deposition in particle numbers would be approximately 1,955 × 109 C20 or 7 × 10⁹ C110 in the combined alveolar and tracheobronchial regions, respectively.
BALF Bioassays
Inhalation of Ag NPs (vs. sham control) produced significant inflammatory and cytotoxic responses measured in BALF cell and supernatant data at 7 and/or 21 days postexposure (Figure 2). Total BALF cells in Ag NP–exposed animals was elevated at day 7 (Figure 2A), and this correlated to a concomitant increase in BALF protein (Figure 2B). BALF PMNs increased and peaked at 7 and 21 days after C20 exposure (Figure 2C) but not after inhalation of C110. LDH concentrations were elevated at day 7 for both C20 and C110 groups versus citrate buffer groups (Figure 2D). Although inhalation of the citrate buffer alone appeared to produce some mild but significant inflammatory effects beyond that of C110 in a couple instances (Figure 2A and B), cumulatively, greater responses were observed due to Ag NP exposure. At day 7, BALF total cells, protein, and LDH were significantly elevated as a result of C20 or C110 exposure in contrast to sham control (Figure 2A, B, and D, respectively). These responses were also significantly higher than those noted on postexposure days 1, 21, and/or 56, with responses returning to control levels by day 21. Significant influx of PMNs was noted only for C20 versus sham control exposed animals, and this response was significantly higher than that produced by C110 (Figure 2C). Protein concentrations at days 1 and 7 were also significantly higher in C20- than C110-exposed animals. No other significant differences were noted between C20 and C110 induced BALF inflammation or cytotoxicity. Overall, results suggested delayed, but short-lived inflammatory and cytotoxic effects due to C20 or C110 inhalation, with a potential for greater responses due to C20.
Peak bronchoalveolar lavage fluid (BALF) inflammation and cytotoxicity was observed 7 or 21 days post-Ag nanoparticle (NP) exposure. Panels show (A) absolute numbers of total cells, (B) protein concentrations, (C) total polymorphonuclear cells (PMN), and (D) lactate dehydrogenase (LDH) on days 1 to 56 postinhalation of citrate buffer, C20, or C110. Results are from analysis of variance considering the interaction between treatment and time. Ω = different from same day citrate and C110, as well as C20 at all other days (p ≤ .01). Δ = different from citrate on the same day, and C110 at all other days (p ≤ .05). T = different from same day citrate and from same treatment (C20 or C110) at days 1 and 21 (p ≤ .05). ‡ = different from same day citrate and from same treatment (C20 or C110) at days 1 and 56 (p ≤ .05). * = different from C110 (same day, p ≤ .05). ϕ or # = different from day 1 or day 21, respectively (same treatment [C20 or C110], p ≤ .05).
Changes in the Lung Parenchyma
Semiquantitative scoring of H&E-stained slides from postexposure days 1 and 7 indicated mild but significant inflammation in animals exposed to C20 or C110 in contrast to the citrate control (Figures 3 –5). Tissues recovered from animals exposed to citrate buffer exhibited occasional perivascular PMNs or macrophages in the alveolar airspaces at days 1, 7, and 21 with otherwise normal-looking lung parenchyma (Figures 4 –7, panels A and B) during the time course of this experiment. Conversely, inhalation of Ag NPs produced macrophages and/or neutrophils in the alveolar airspaces and, in the most severe cases, sloughing of the bronchiolar epithelium at day 1 (Figure 4, panels C, D and E, F). Peak inflammation occurred at day 7 (Figure 3), when cellular exudate (Figure 5, panel D), enlarged macrophages (Figure 5, panels D and F), and some perivascular eosinophils (Figure 5, panels A, E, and F) were observed. During this time, particle agglomerates were still easily identified within the macrophages distributed throughout the alveolar spaces. By day 21 postexposure, significant inflammation was observed only in response to C20 (vs. control; Figures 3 and 6). This is the only day in which significant histopathological differences were noted between C20- and C110-exposed animals (Figure 3). Results correlate with those reported by Anderson, Patchin, et al. (2015) showing greater persistence of C20 versus C110 in macrophages at day 21. By day 56, no significant degree of inflammation was detectable in Ag NP–exposed animals (Figures 3). Due to the mild degree of inflammation noted by H&E (Figure 7) and lack of signs indicative of lung remodeling (e.g., thickening of the alveolar and/or bronchiolar epithelium), staining for collagen was not done.
Ag nanoparticles (NP) produce significant histopathology 1 to 21 days postinhalation. Graphs show semiquantitative histopathology scores for animal groups exposed to citrate buffer or Ag NP by inhalation. Results are from an analysis of variance considering the interaction of treatment and time postinstillation. #, †, or ‡ = significantly different from (same day) citrate group (p ≤ .0001) and all other days (p ≤ .0001), days 21 and 56 (p ≤ .01), or day 56 only (p ≤ .01), respectively. ϕ = different from (same day) citrate and C110 (p ≤ .01) and day 56 (p ≤ .001).
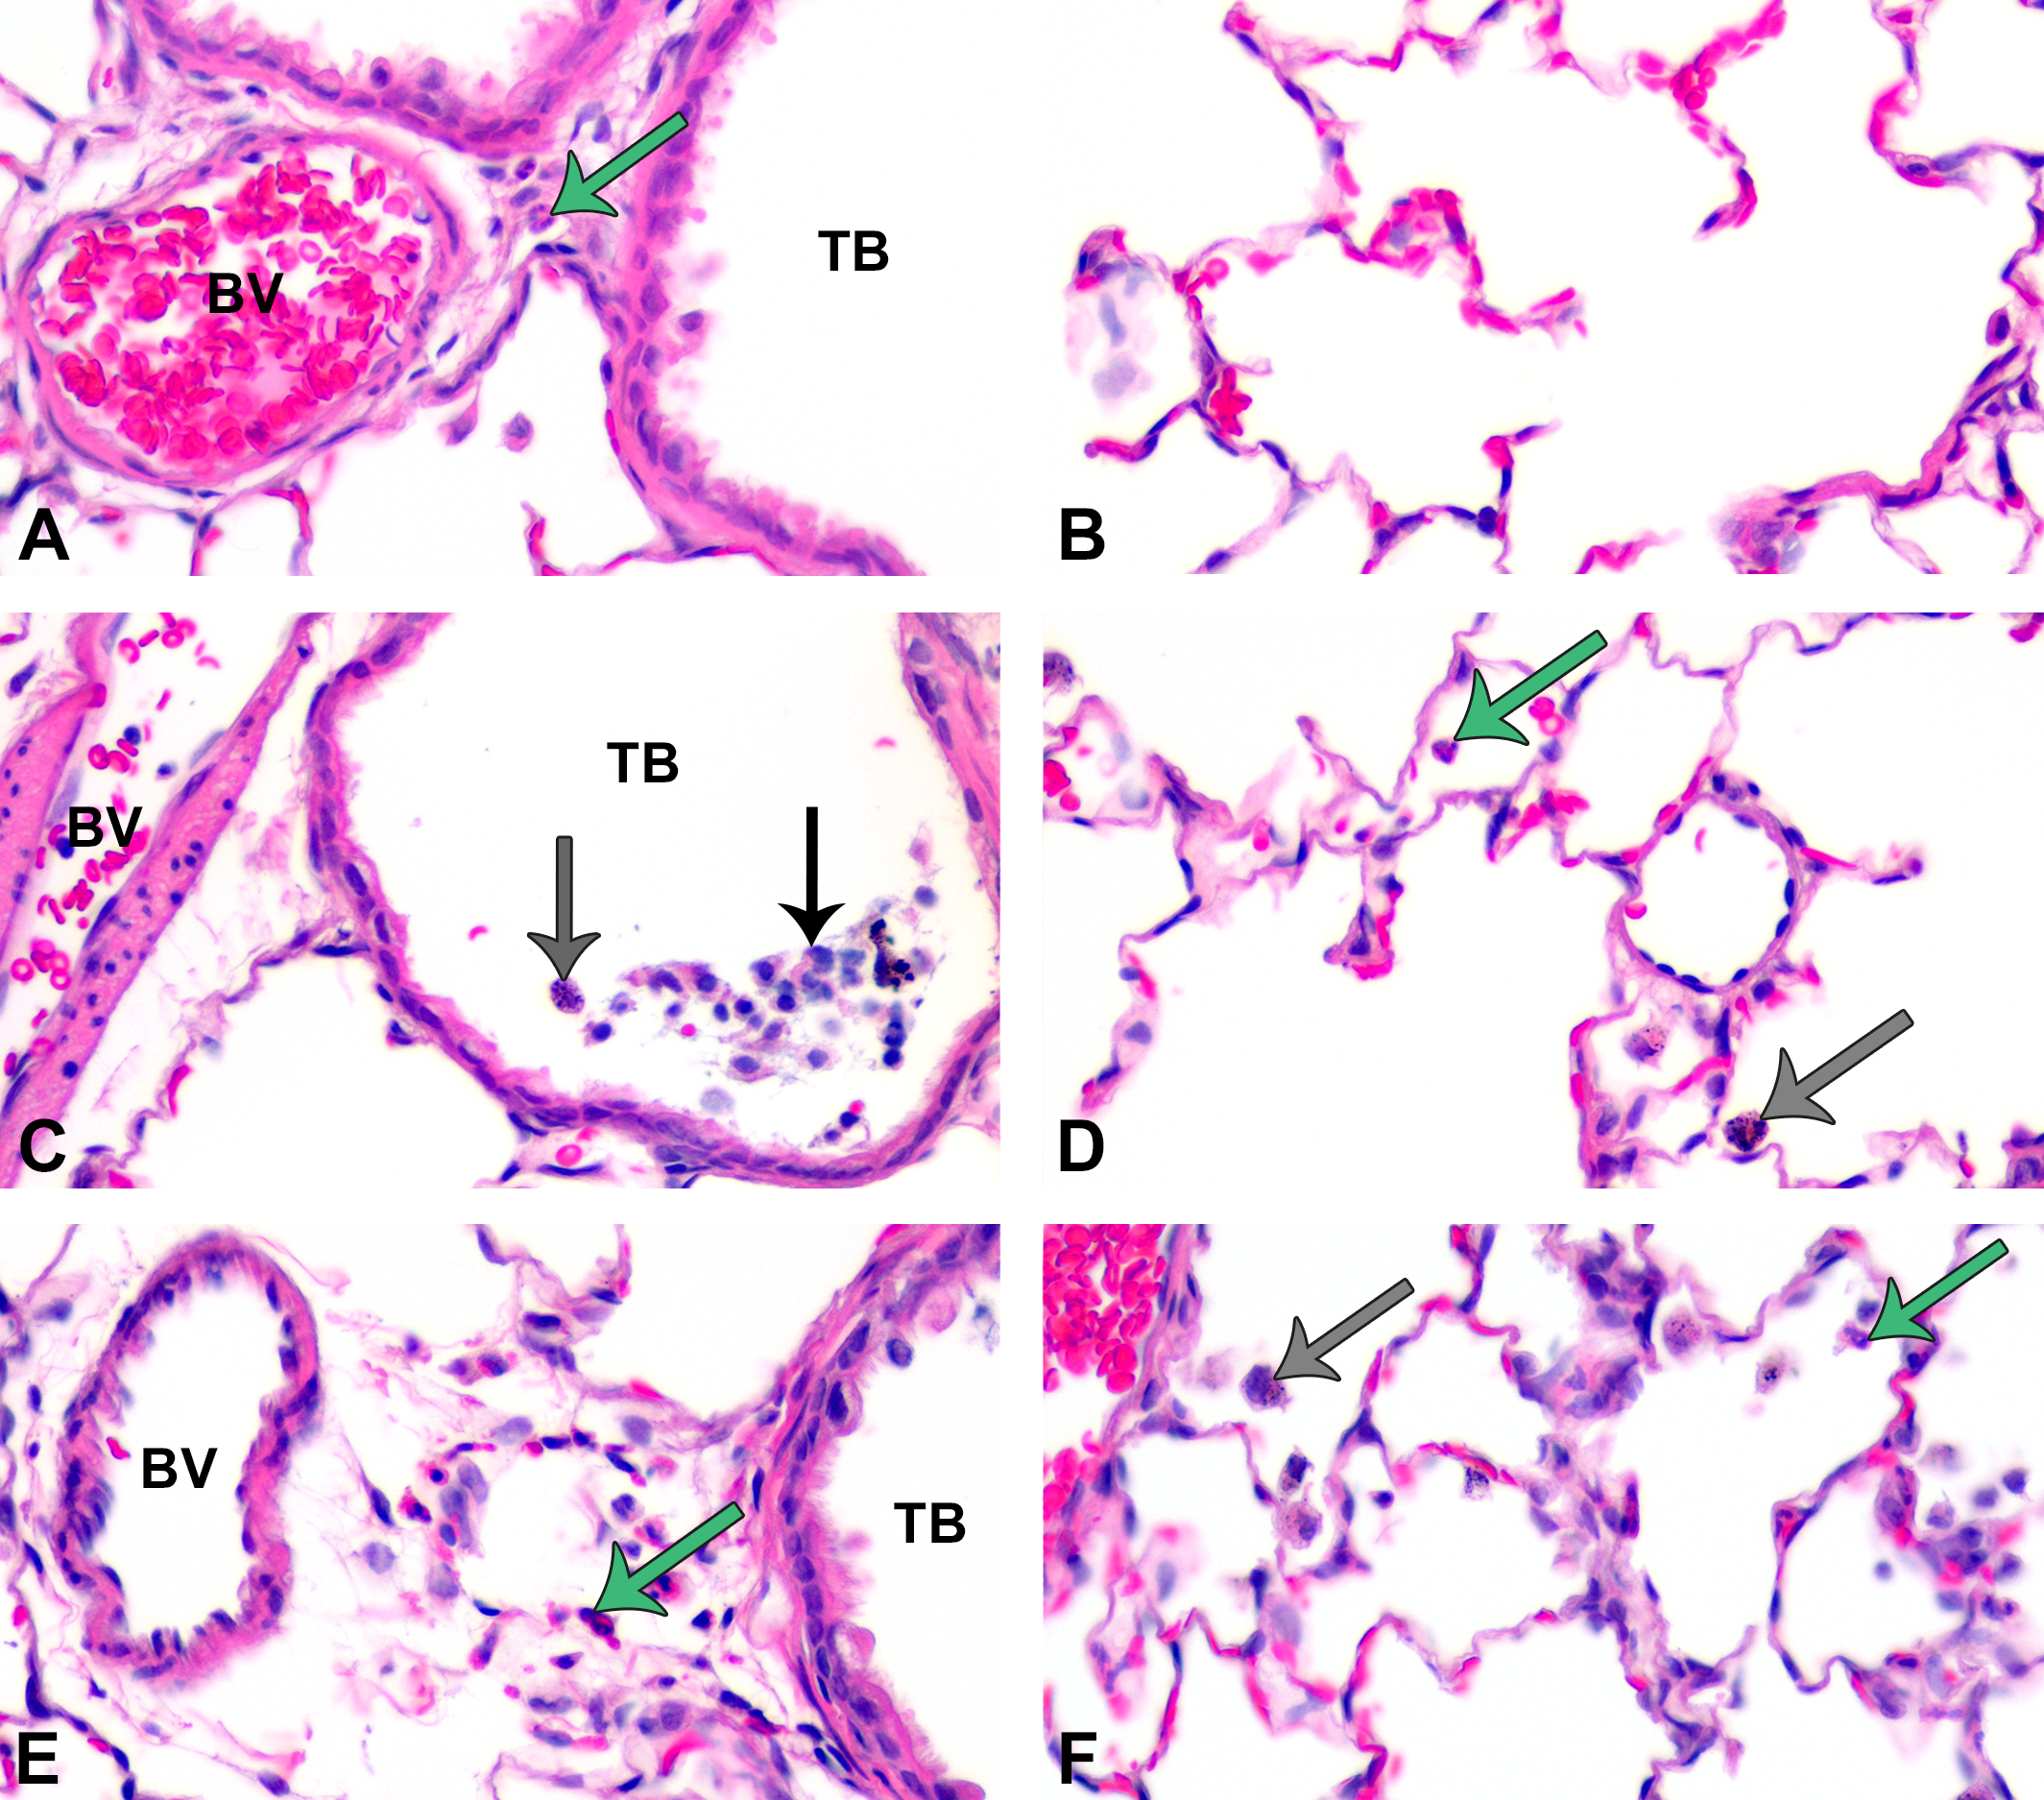
At postinhalation day 1, particle-laden macrophages and a mild influx of polymorphonuclear cells (PMNs) were noted in centriacinar regions. Panels are brightfield microscopy images of typical responses in H&E-stained tissue sections from rats after inhalation of citrate buffer (sham control [A and B]), C20 (C and D), or C110 (E and F). Gray arrows indicate particle-laden macrophages. Green arrows indicate PMNs. Black arrow shows epithelial sloughing. Panels show cellular influx from blood vessels (BV) to subepithelial regions of the terminal bronchioles (TB [A, C, and E]) or collecting in alveolar airspaces (B, D, and F).
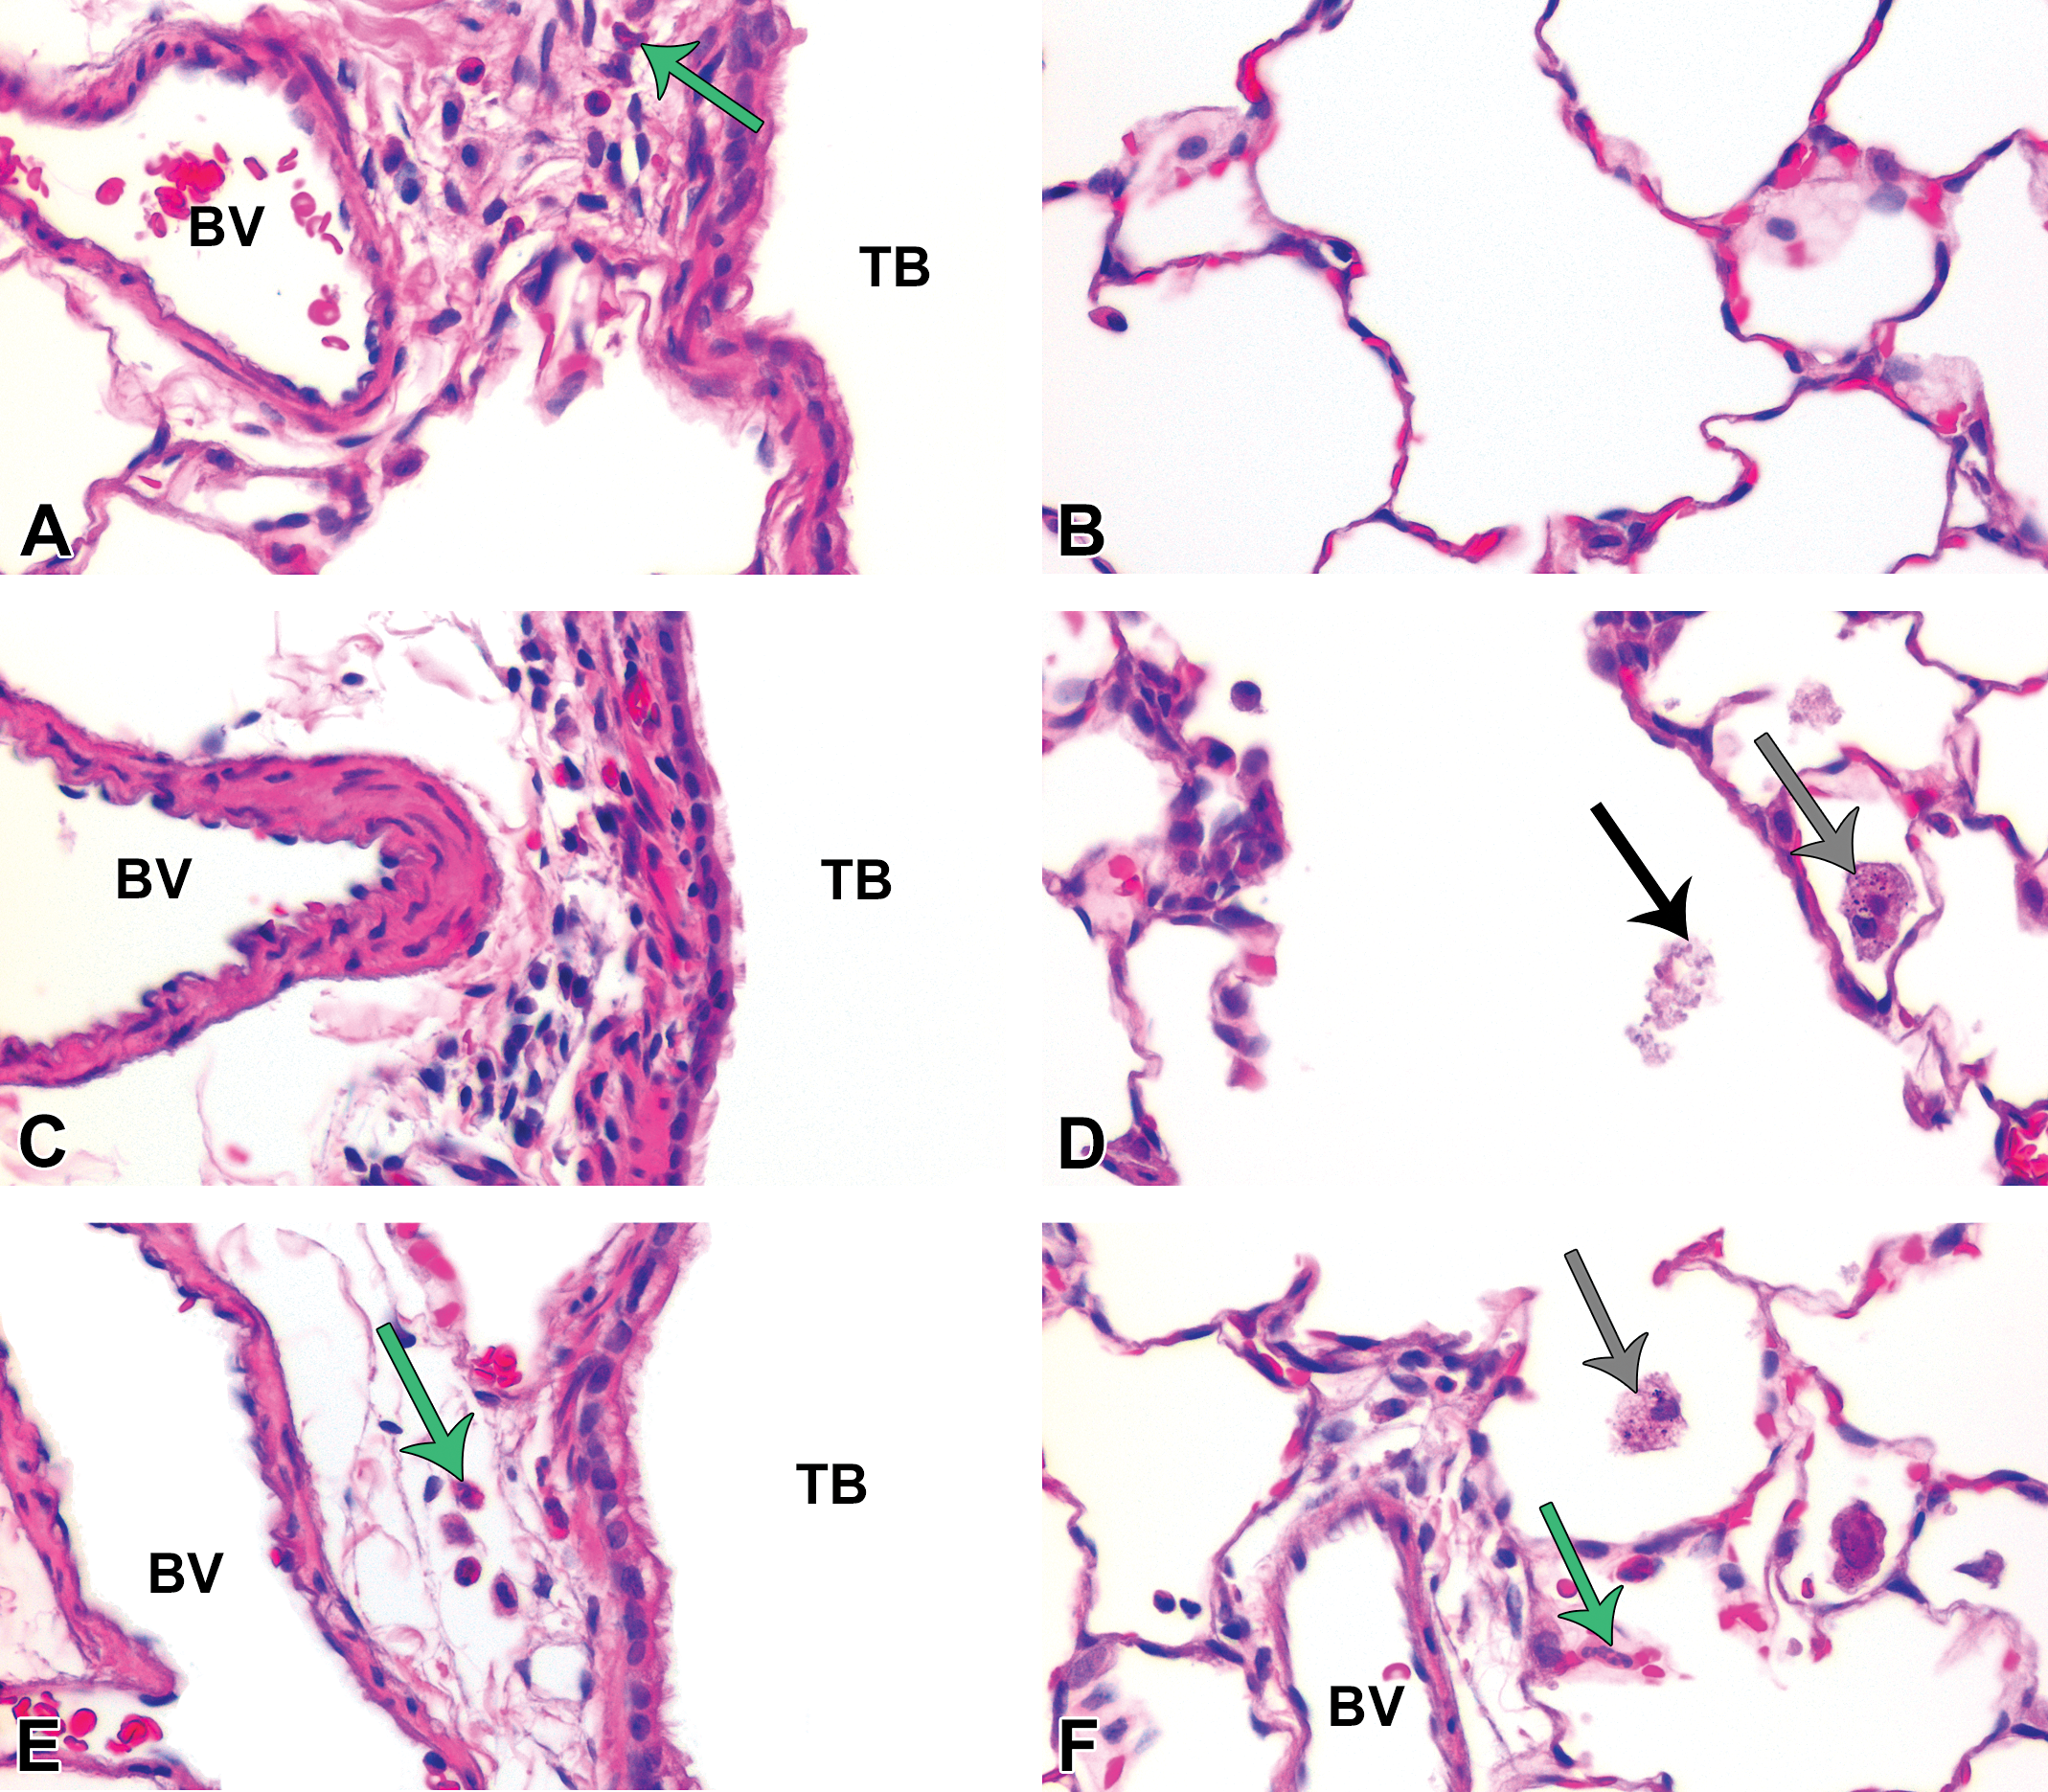
At postinhalation day 7, cellular exudate was prevalent in alveolar airspaces. Panels are brightfield microscopy images of typical responses in H&E-stained tissue sections from rats after inhalation of citrate buffer (sham control [A and B]), C20 (C and D), or C110 (E and F)]. Gray arrows indicate particle-laden macrophages. Green arrows indicate polymorphonuclear cells. Black arrow shows cellular debris. Panels show cellular influx from blood vessels (BV) to subepithelial regions of the terminal bronchioles (TB [A, C, and E]) or collecting in alveolar airspaces (B, D, and F).
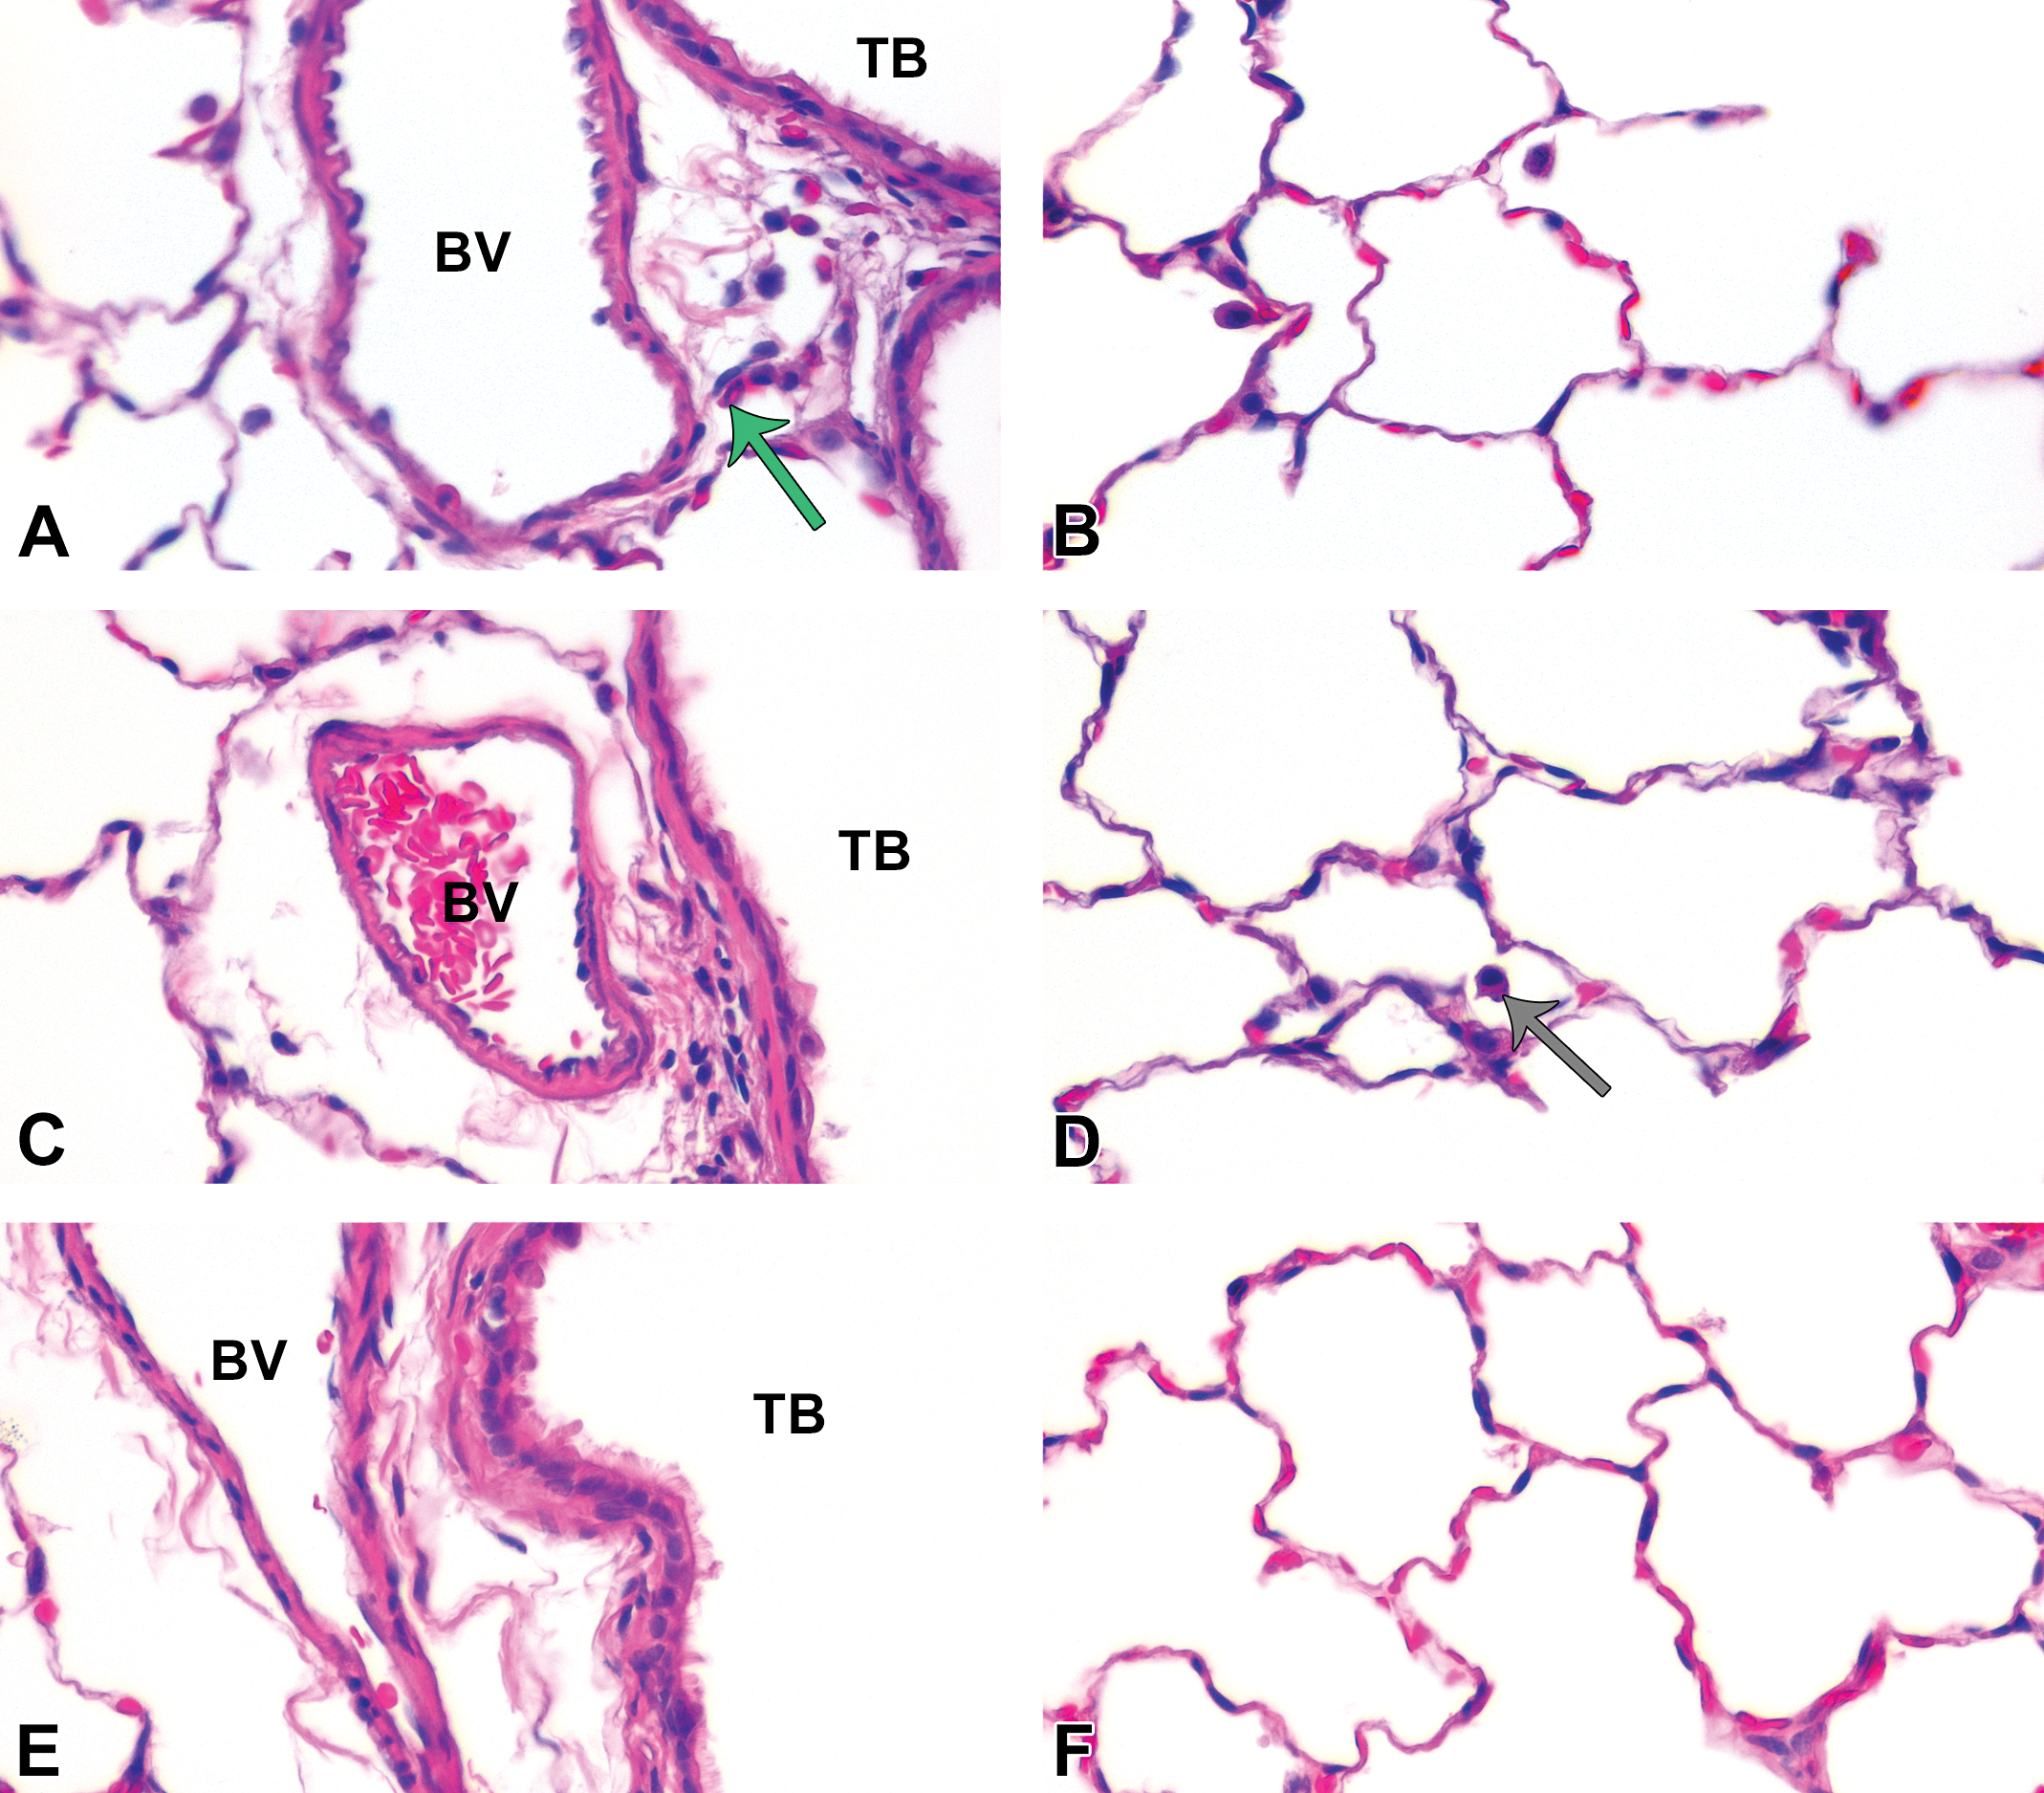
At postinhalation day 21, minimal cellular exudate and some cellular infiltrates were observed in lung tissue sections. Panels are brightfield microscopy images of typical responses in H&E-stained tissue sections from rats after inhalation of citrate buffer (sham control [A and B]), C20 (C and D), or C110 (E and F). Green arrow indicates polymorphonuclear cells . Gray arrow indicates particle-laden macrophage. Panels show minimal (if any) cellular influx from blood vessels (BV) to subepithelial regions of the terminal bronchioles (TB [A, C, and E]) or collecting in alveolar airspaces (B, D, and F).
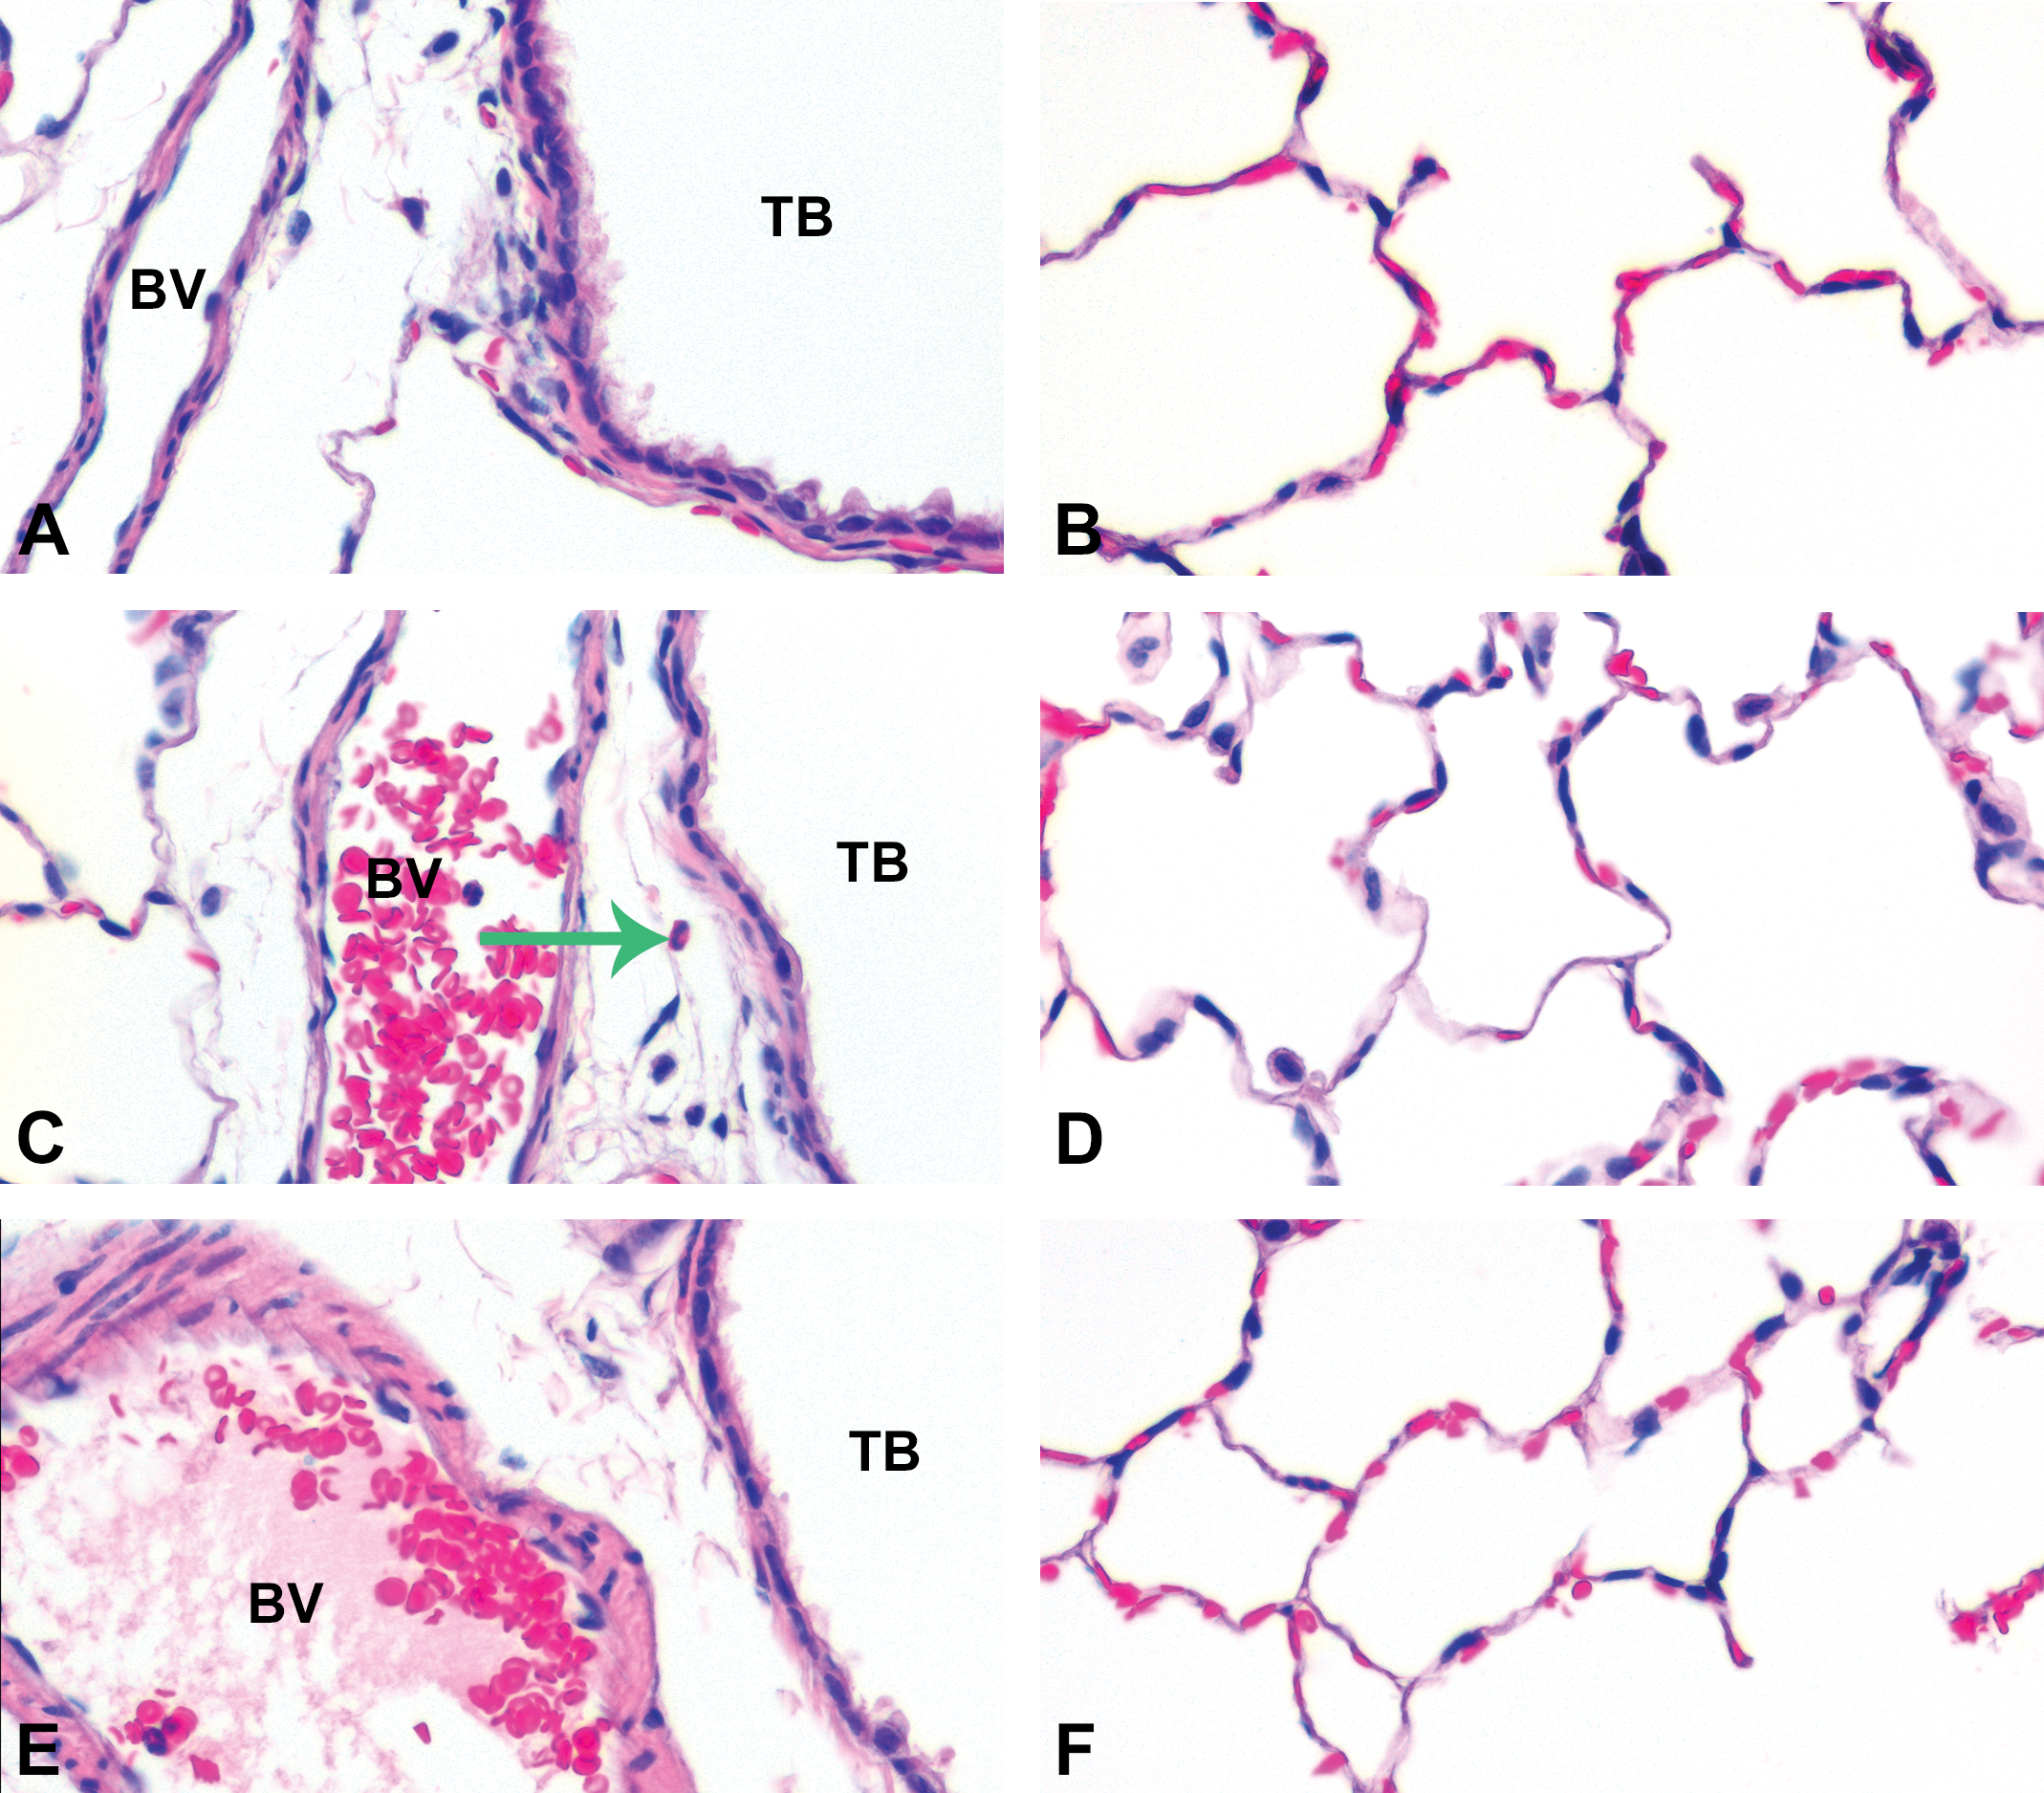
At postexposure day 56, inflammation was largely resolved. Panels are brightfield microscopy images of typical responses in H&E-stained tissue sections from rats after inhalation of citrate buffer (sham control [A and B]), C20 (middle— D), or C110 (E and F). Green arrow indicates PMN. Panels show minimal (if any) cellular influx from blood vessels (BV) to subepithelial regions of the terminal bronchioles (TB [A, C, and E]) or collecting in alveolar airspaces (B, D, and F).
Although tissues were stained with AB/PAS and analyzed for changes in the number of goblet cells and/or types of mucosubstances being secreted in the airways, no differences were observed irrespective of the treatment or postexposure time point.
Examination of araldite-embedded lung tissue sections revealed inflammation and sloughing of the airway epithelium along with increased presence of macrophages and enlarged Type II cells in the alveolar region at post-Ag NP exposure day 1 (Figure 8). Ag NPs were clearly visible in macrophages, which were variably enlarged and/or vacuolated. At day 7, there was a clear septal wall response to Ag NPs. Alveolar Type II cells appeared more prominent in Ag NP versus citrate buffer exposed animals as did bronchiolar airway epithelia hypertrophy (Figure 9).
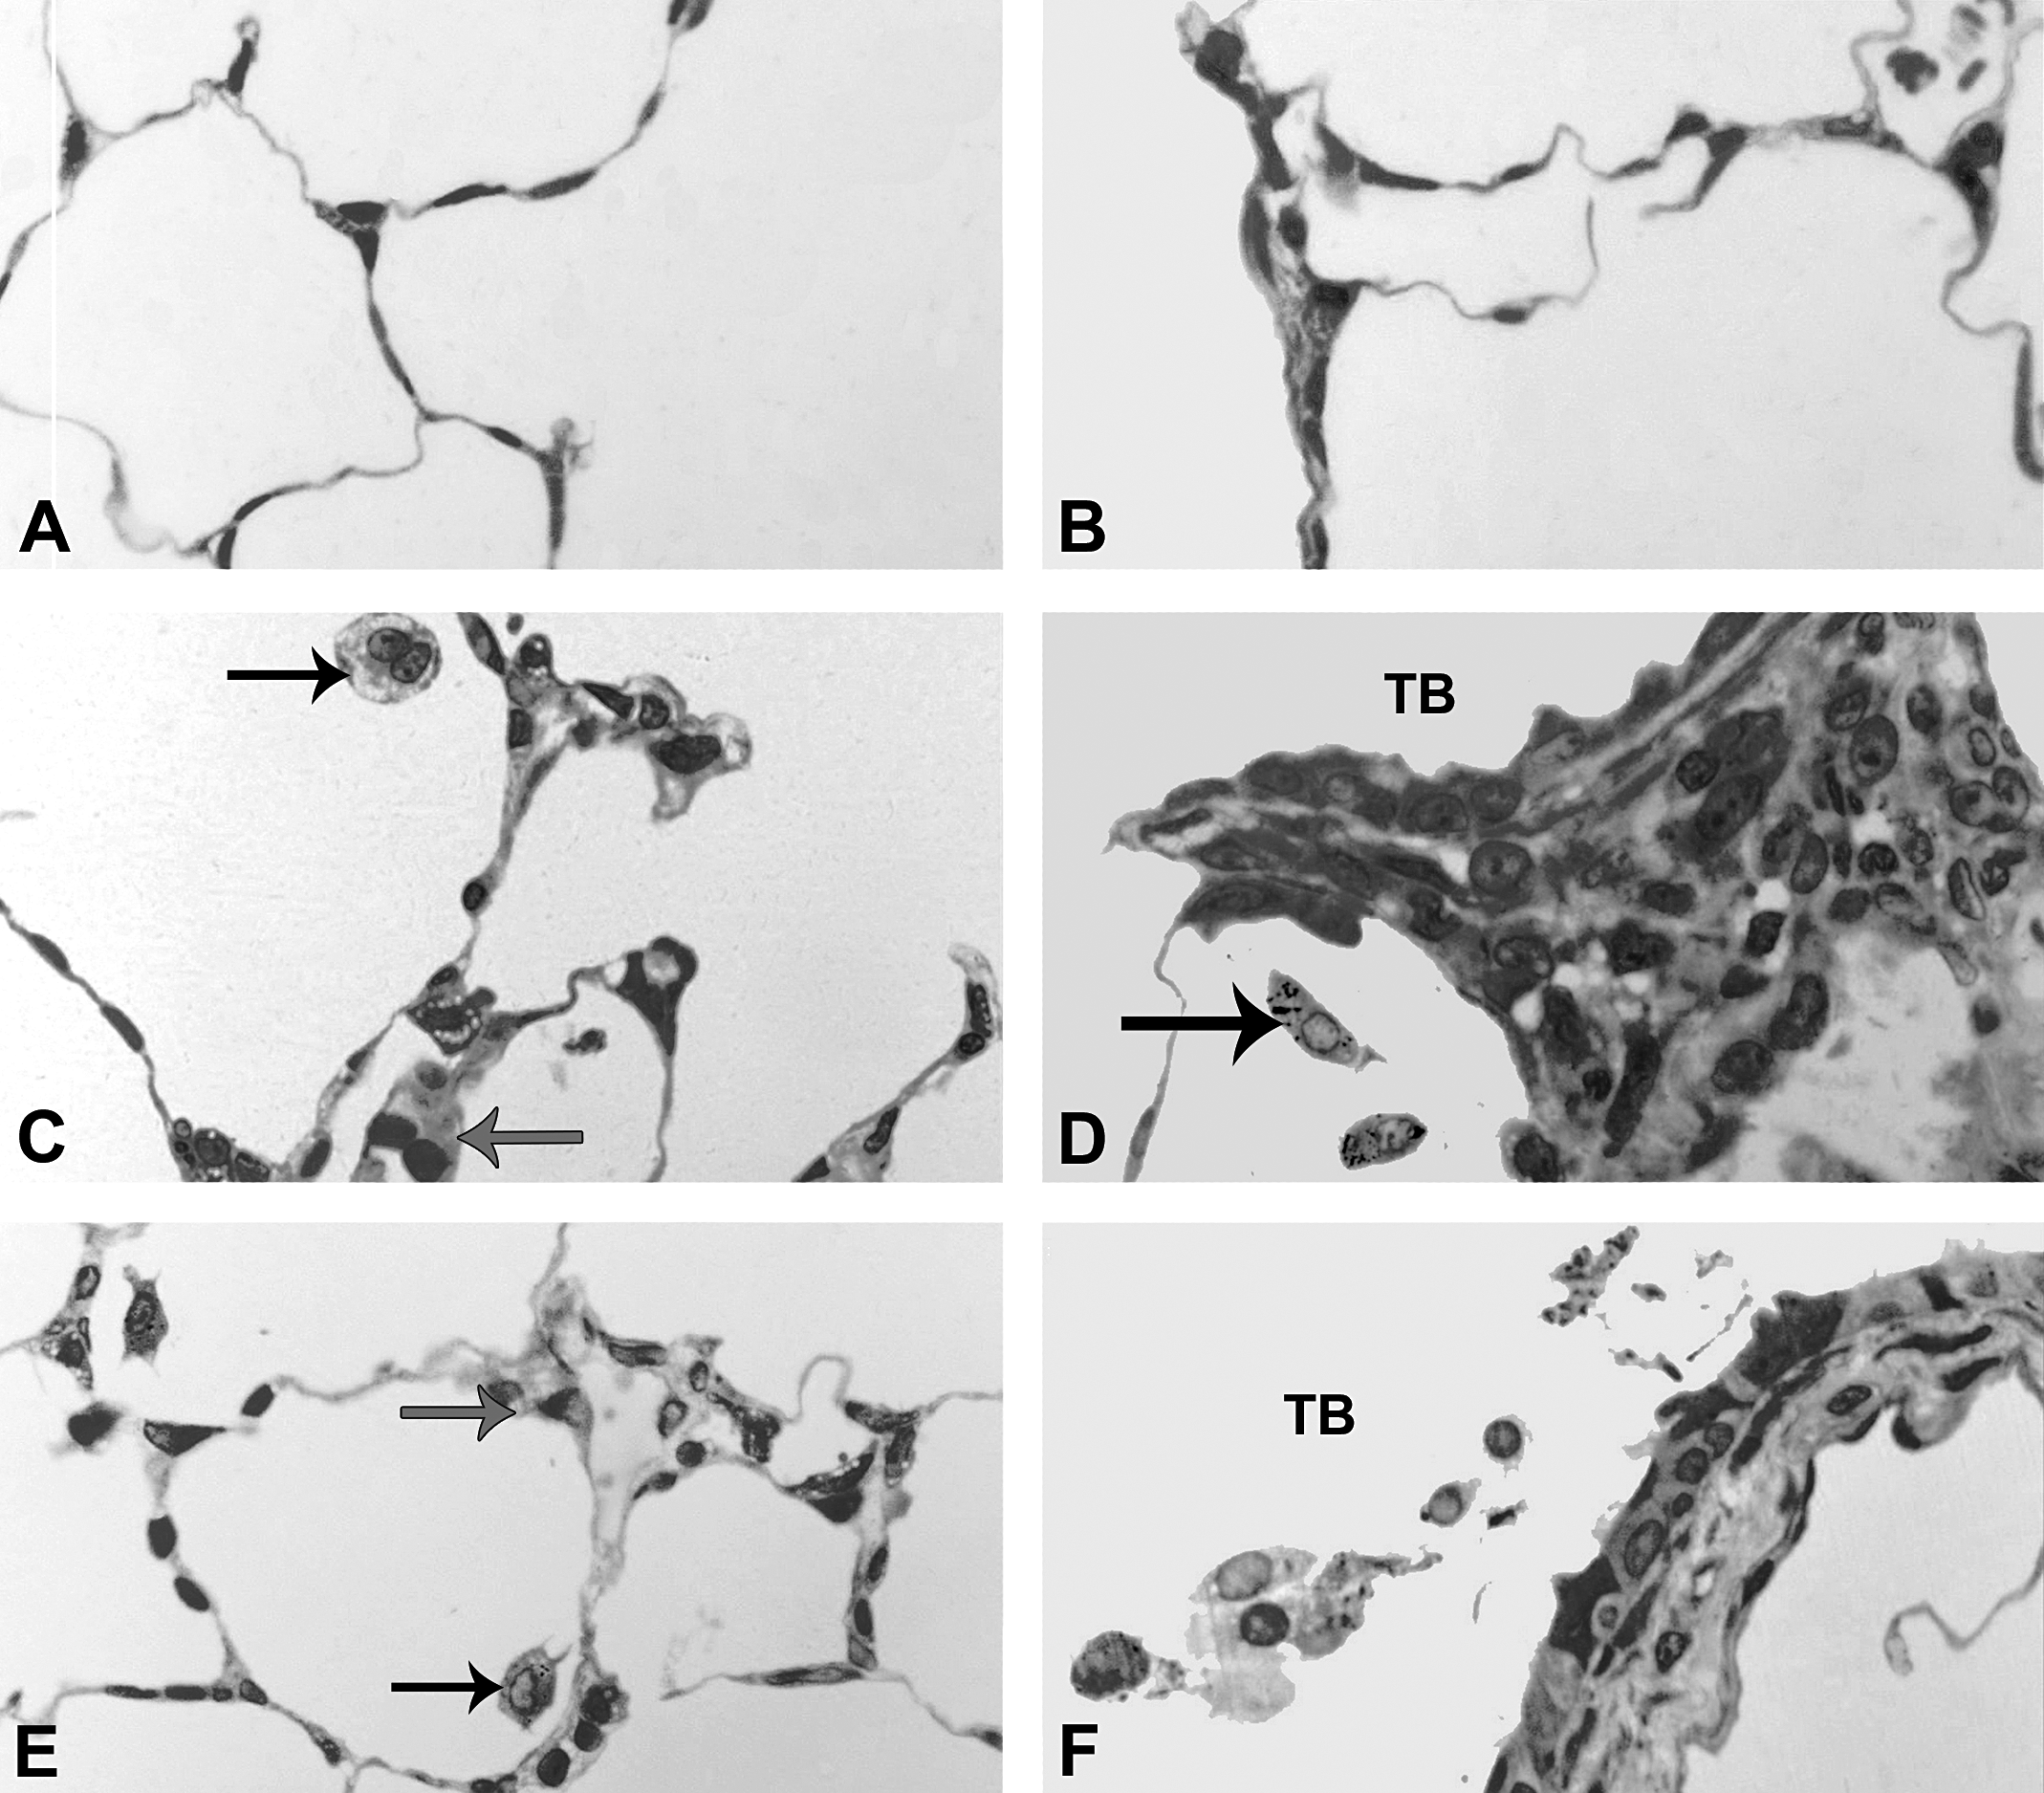
At postinhalation day 1, alveolar Type II cells appear enlarged (hypertrophied) with the thickened septal walls. Panels are brightfield microscopy images of typical responses in araldite-embedded tissue sections from rats after inhalation of citrate buffer (sham control [A and B]), C20 (C and D), or C110 (E and F). Black arrows indicate enlarged and/or particle-laden macrophages. Gray arrows indicate thickened septal walls. Panels A, C, and E show the alveolar regions, while panels B, D, and F show the epithelial regions of the terminal bronchioles (TB).
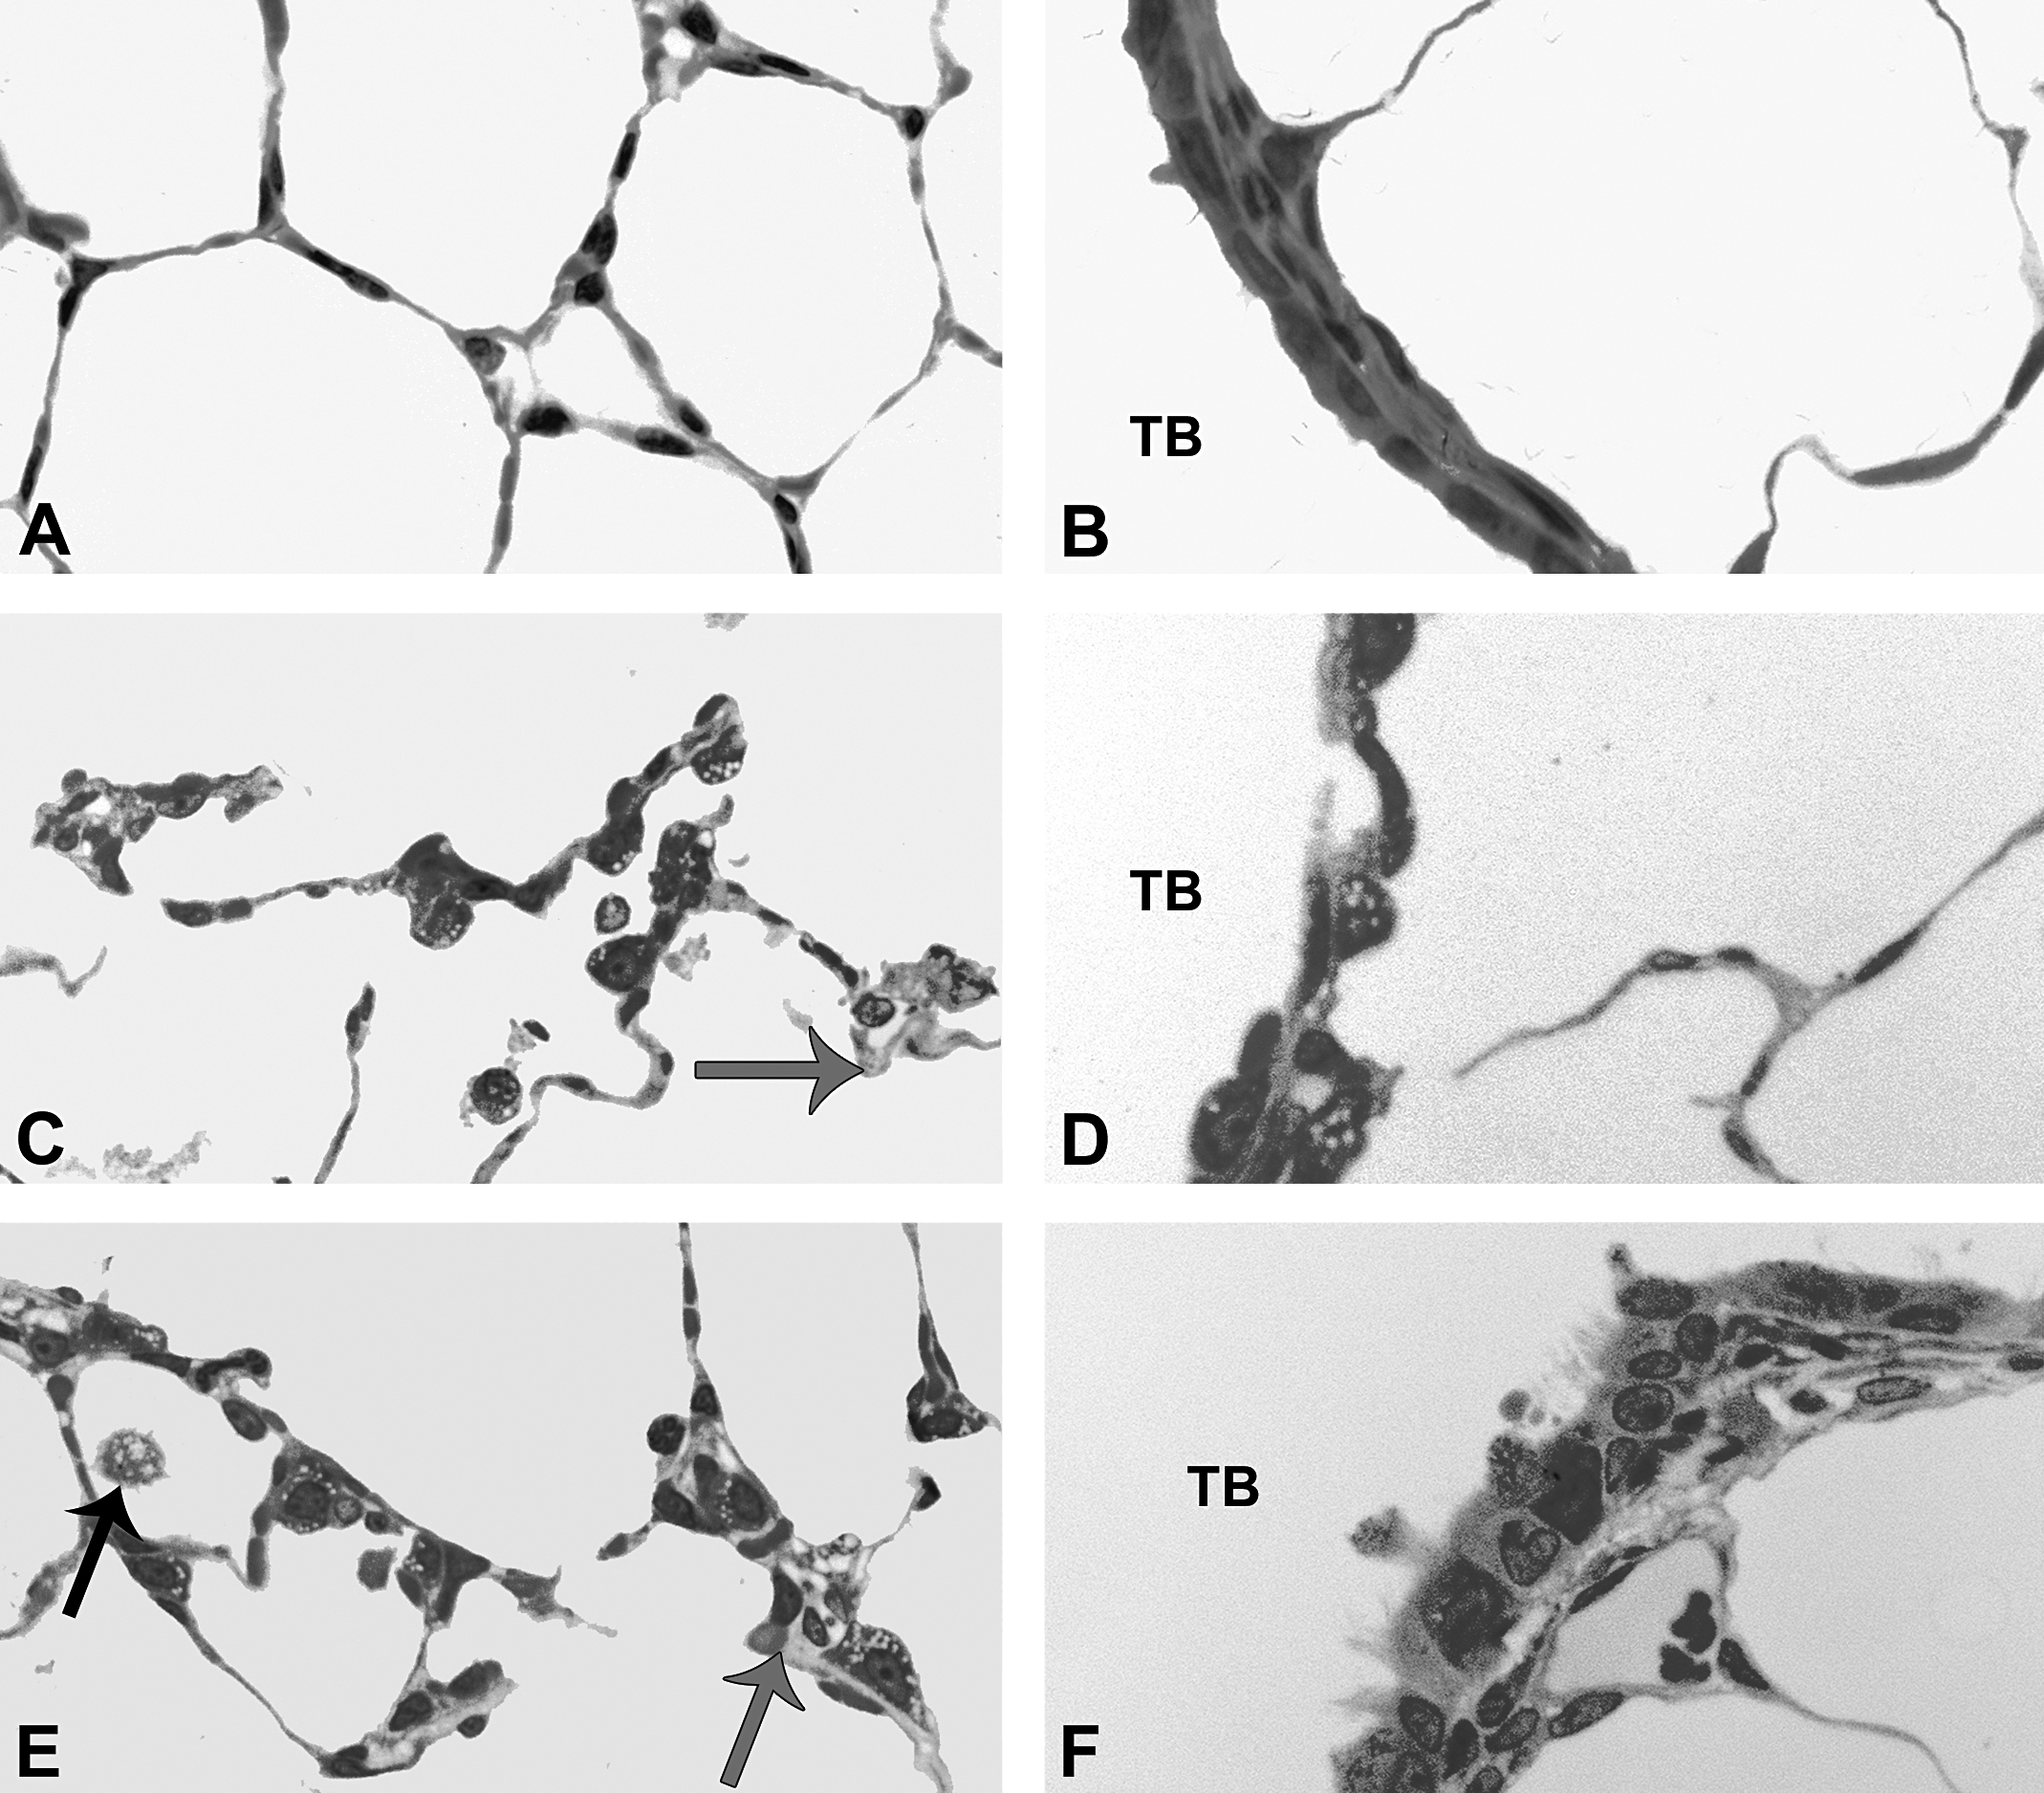
At postinhalation day 7, alveolar Type II cells appear to be undergoing mild hypertrophy, while the epithelia of the most distal airways also demonstrate visible hypertrophic changes, relative to controls. Panels are brightfield microscopy images of typical responses in araldite-embedded tissue sections from rats after inhalation of citrate buffer (sham control [A and B]), C20 (C and D), or C110 (E and F). Black arrows indicate enlarged and/or particle-laden macrophage. Gray arrows indicate thickened septal walls. Panels A, C, and E show the alveolar regions, while panels B, D, and F show the epithelial regions of the terminal bronchioles (TB).
Discussion
Most of the current research regarding the pulmonary health effects of Ag NPs has been done in vitro. Some more recent in vivo health studies are available, but of these, only a dozen use low dose rate inhalation as the method of Ag NP administration (Hyun et al. 2008; Sung et al. 2008; Sung et al. 2009; Stebounova et al. 2011; Sung et al. 2011; Kwon et al. 2012; Cho et al. 2013; Chuang et al. 2013; Roberts et al. 2013; Song et al. 2013; Su et al. 2013; Braakhuis et al. 2014). Route and method of delivery can have significant effects on physicochemical particle characteristics and physiological responses (U.S. Environmental Protection Agency 2010) postexposure to NPs, and inflammation can be relatively less robust upon exposure to NPs at a low/steady rate versus a large bolus (Baisch et al. 2014; Silva et al. 2014). Considering only the published inhalation studies measuring pulmonary health end points, only two have been completed using nose-only exposure systems (Kwon et al. 2012; Braakhuis et al. 2014). This study and its companion study on Ag NP clearance are the first to be completed using coated Ag NPs. Nose-only exposure systems can be considered the “gold standard” for measuring particle-size-dependent efficiencies (Phalen, Mendez, and Oldham 2014). They are also ideal for examining pulmonary health effects by inhalation, specifically, because they limit exposure via other routes (e.g., oral by grooming), which may occur in whole-body inhalation chambers. Therefore, the current study is important to the existing body of literature regarding the effects of inhaled Ag NPs in general, and, specifically, coated Ag NPs.
In this study, the aerosolized silver concentrations (7.2 ± 0.8 mg/m3 and 5.3 ± 1.0 mg/m3 for C20 and C110, respectively) yielded estimated deposition in the alveolar and tracheobronchial regions (86 µg and 53 µg for C20 and C110, respectively) that overlaps with the instilled dose range previously reported (Anderson, Patchin, et al. 2015; Silva et al. 2015) and approximates worst-case exposure scenarios. The Occupational Safety and Health Administration (1988) and the European Commission (1993) set enforceable 8-hr time-weighted exposure limits for silver at 0.01 mg/m3. Personal (breathing level) occupational exposures (Lee et al. 2011, 2012) to Ag NPs have been measured at well below these limits (2.43 µg/m3 and 1.02 µg/m3, respectively) in nano silver manufacturing plants. At the same time, area sampling yielded a maximal time-weighted average Ag NP concentration of 289 µg/m3 of air. Particles ranged in aerodynamic diameter from 15 nm to 710.5 nm (Lee et al. 2012). Workers were not directly exposed to the 289 µg/m3 concentration in the study reported by Lee and colleagues (2012), but it can be used to correlate the inhaled doses herein to potentially high exposures that may occur in settings lacking proper exposure safeguards. Given the experimentally measured Ag NP concentration in the air and size range (Lee et al. 2012), a (human lung) deposition fraction of approximately 10 to 40% (Geiser and Kreyling 2010; Bair 1995), a ventilation rate of 20 L/min (Galer et al. 1992), and a human alveolar epithelium surface area of approximately 102 m2 (Stone et al. 1992), occupational exposure to 289 μg/m3 Ag NPs would produce approximately 11, 55, and 218 μg Ag NPs/m2 alveolar epithelium maximally after 1 day, 1 week, and 1 month, respectively. The alveolar epithelium of an SD rat has a surface area of approximately 0.4 m2 (Stone et al. 1992), so alveolar deposition of 69 µg of C20 or 41 µg of C110, which was estimated for the current study, would result in 172.5 or 102.5 μg C20 or C110 Ag NPs/m2 alveolar epithelium, respectively, for an average 350 g rat. These doses approximate human occupational exposures to Ag NPs between 2 weeks and 1 month in a light-work environment.
Findings in this study suggest delayed peak and short-lived inflammatory and cytotoxic effects due to C20 or C110 inhalation (Figures 2 and 3) and potential for greater responses due to smaller Ag NPs (C20; Figures 2 –6 and 8). These latter results are consistent with a recent study (Braakhuis et al. 2014) showing greater responses (increased PMNs and pro-inflammatory cytokines) to small versus large (15 vs. 410 nm) Ag NPs after nose-only inhalation of similar mass concentrations (179 and 167 µg/m3, respectively). In the current study, examination of BALF showed that at postexposure day 7, total cell and PMN numbers were significantly greater in animals exposed to aerosolized Ag NPs versus citrate buffer (Figure 2A and C). Total cell numbers (Figure 2A) in C20- or C110-exposed animals peaked at day 7 and remained slightly but significantly elevated in contrast to day 1 through day 21 (C20 exposed) or day 56 (C110 exposed). Significantly higher numbers of BALF PMNs were also noted for C20- but not C110-exposed animals at day 7 versus all other days (Figure 2C). This peak in total BALF cells and/or PMNs correlated to a concomitant increase in the BALF concentration of LDH (Figure 2D), an intracellular enzyme, as well as tissue inflammation (Figure 3).
Presence of extracellular LDH in BALF supernatant is indicative of cell membrane permeability and cell necrosis. This LDH finding correlated with the visual confirmation of cellular exudate in the alveolar airspaces at post exposure day 7 for C20 and C110 exposures (Figure 5, panel D and Figure 9, panels C, E).
Anderson, Patchin, et al. (2015) noted that in spite of a lack of significant differences between Ag NP- and citrate-exposed animals, the number of BALF macrophages in Ag NP–exposed animals was significantly elevated at days 21 and 56 in contrast to day 1. Therefore, high numbers of PMNs (C20-exposed animals only) and/or macrophages in Ag NP–exposed animals contributed to the greater number of total cells noted at postexposure days 21 and 56 versus day 1 (Figure 2A). Observations of delayed-onset and/or peak inflammation in BALF and tissues suggest that inhalation studies examining effects only up to 1-day postexposure may miss peak responses (Kwon et al. 2012), which in the current study occurred at day 7. Although histopathological scoring (Figure 3) showed that tissue inflammation peaked at day 7 for animals exposed to C20 or C110, only those exposed to C20 exhibited a concurrent influx of PMNs in contrast to control (Figure 2C). Given that histopathology scores considered the presence of macrophages, monocytes, and PMNs, and total BALF cell numbers were the highest at day 7 postexposure to C20 or C110, results suggest that C20- but not C110-induced histopathology was driven to a large extent by PMN influx.
Significantly more BALF protein was noted upon inhalation of C20 versus C110 at postexposure days 1 and 7 (Figure 2B). A similar pattern was noted for BALF PMNs on days 7 and 21 (Figure 2C) and histopathology at day 21 (Figure 3). Protein levels in the BALF often correlate with the degree of cellular inflammation in the lungs (Drent et al. 1996). Differences in responses could be due to the far greater number of C20 (∼1,955 × 109 particles) delivered to the alveolar and tracheobronchial regions of the lungs versus C110 (∼7 × 10⁹ particles) and/or a relatively faster rate of Ag+ leaching from inhaled parent C20.
The release rate of soluble or ionic silver (Ag+) depends on multiple factors (e.g., Ag NP size and surface area, as well as ambient conditions; Gliga et al. 2014; Kim and Shin 2014; Wang et al. 2013; Hamilton, Buckingham, and Holian 2014). Previous reports (Wang et al. 2013; Hamilton, Buckingham, and Holian 2014) testing the same Ag NPs used in this study (C20 and C110) suggest that small Ag NPs shed Ag+ faster than large ones. Wang and colleagues (2013) showed by ICP-optical emission spectrometry that 20-nm citrate or PVP-coated Ag NPs suspended in water or bronchial epithelial cell growth medium shed Ag+ at significantly faster rates 0 to 24 hr postincubation. Hamilton and colleagues (2014) showed by TEM imaging that intracellular (phagolysosomal) dissolution of 20-nm citrate or PVP-coated Ag NPs was more rapid than that of similar 110-nm Ag NPs. In vitro exposure to C20 (but not C110) produced increased IL-1β, a measure of NLRP3-inflammasome activation, in several human and murine lung macrophage cell lines. NLRP3-inflammasome activation influences inflammation and apoptosis, and at postexposure day 1 in the Hamilton study, NLRP3-inflammasome activation correlated with increased extracellular LDH and decreased cell viability (Hamilton, Buckingham, and Holian 2014). Overall, the investigators’ findings were consistent with Ag+-mediated toxicity, which correlated with more robust inflammatory responses due to C20 inhalation (vs. C110) in the current study (Figures 2B, C, and 3). Quantification of Ag NPs and other silver species in tissues may be accomplished with single-particle ICP-MS (Gray et al. 2013), atomic absorption spectrometry (Gliga et al. 2014), or X-ray microprobe analysis (Gilbert et al. 2012). Quantification is recommended for future Ag NP exposure studies because several researchers have shown that in vitro or acellular (media-based) Ag NP dissolution studies cannot duplicate the complexity and variability of the environ in vivo (Stebounova et al. 2011; Scanlan et al. 2013).
Collaborative research by Davidson and colleagues (2015) has been performed to better understand the dominant silver species in lung tissues upon inhalation of C20 and C110. X-ray absorption spectroscopy was performed at 0, 1, 3, and 7 days postinhalation. Immediately after the 6-hr exposure (day 0), C20 were significantly modified in contrast to the largely unchanged C110. These findings correlate to those by Wang, Zhang, and their respective colleagues, who showed that C20 can undergo more rapid dissolution (into Ag+) than C110 (Wang et al., 2013; Zhang, Yao, Sullivan, and Chen, 2011). However, Davidson and colleagues (2015) also illustrated that over the 7-day postexposure day period, changes in C110 were markedly greater than C20. Despite this, results suggested that metallic silver (not silver oxide or solvated silver cations) was most prevalent in the lung. The authors stated that if Ag+ ions are responsible for toxic responses, such as reported here, then Ag+ must be short-lived. They speculated that Ag NPs undergo continuous cyclic evolution until all Ag species are cleared from the lung. In this process, transiently high concentrations of Ag+ ions are produced locally (near parent Ag NPs). These ions are then reduced to metallic Ag atoms that are reformed into smaller Ag NPs. Their findings confirm in vivo differences in the chemical fates of inhaled C20 and C110 Ag NPs, which have been shown to produce distinct pulmonary responses (Anderson, Patchin, et al. 2015).
Overall, it is unclear whether Ag NPs and/or their coatings will adversely affect human health. The purpose of this study was to better understand the health effects of inhaling citrate-coated Ag NPs with consideration to recovery over time and Ag NP size. No other studies to date have looked at pulmonary health effects after nose-only inhalation of coated Ag NPs. Thus, the data presented here are critical for future promulgation of laws, statutes, and regulations, creation and alteration of recommended exposure limits, and calculation of risks associated with Ag NP exposure.
Footnotes
Acknowledgments
Grant support (U01 ES020127 [UCD] and U01 ES0200126 [NYU]) and silver nanomaterials used in this study are procured, characterized, and provided by the National Institute of Environmental Health Sciences Centers for Nanotechnology Health Implications Research (NCNHIR) Consortium.
Authors’ Note
All authors have read the final manuscript, and they wish to thank A. Castañeda, J. Claude, I. Espiritu, K. Johnson, and A. Pham for their assistance during the course of this study. Special thanks to Dr. N. Willits at the UC Davis Statistical Laboratory and Dr. S. Smiley-Jewell at the Center for Health and the Environment.
Authors’ Contribution
Authors contributed to conception or design (DA, TGu, TGo, LC, LV, and KP); data acquisition, analysis, or interpretation (RS, DA, JP, PE, EP, and XS); drafting the manuscript (RS); and critically revising the manuscript (RS, DA, JP, PE, EP, TGu, TGo, LC, XS, LV, and KP). All authors gave final approval and agreed to be accountable for all aspects of work in ensuring that questions relating to the accuracy or integrity of any part of the work are appropriately investigated and resolved.
Declaration of Conflicting Interests
The author(s) declared no potential conflicts of interest with respect to the research, authorship, and/or publication of this article.
Funding
The author(s) received no financial support for the research, authorship, and/or publication of this article.