
Abstract
Nevirapine (NVP) is associated with hepatotoxicity in 1–5% of patients. In rodent studies, NVP has been shown to cause hepatic enzyme induction, centrilobular hypertrophy, and skin rash in various rat strains but not liver toxicity. In an effort to understand whether NVP is metabolized differently in a transiently inflamed liver and whether a heightened immune response alters NVP-induced hepatic responses, female brown Norway rats were dosed with either vehicle or NVP alone (75 mg/kg/day for 15 days) or galactosamine alone (single intraperitoneal [ip] injection on day 7 to mimic viral hepatitis) or a combination of NVP (75/100/150 mg/kg/day for 15 days) and galactosamine (single 750 mg/kg ip on day 7). Livers were collected at necropsy for histopathology, matrix-assisted laser desorption/ionization imaging mass spectrometry and gene expression. Eight days after galactosamine, hepatic fibrosis was noted in rats dosed with the combination of NVP and galactosamine. No fibrosis occurred with NVP alone or galactosamine alone. Gene expression data suggested a viral-like response initiated by galactosamine via RNA sensors leading to apoptosis, toll-like receptor, and dendritic cell responses. These were exacerbated by NVP-induced growth factor, retinol, apoptosis, and periostin effects. This finding supports clinical reports warning against exacerbation of fibrosis by NVP in patients with hepatitis C.
Introduction
Nevirapine (NVP) is a nonnucleoside inhibitor of the HIV polymerase enzyme and acts by binding to and disrupting the active catalytic site of the viral polymerase causing a conformational change in the three-dimensional structure of the enzyme. NVP is a potent inhibitor of HIV replication and is a major component of highly active antiretroviral therapy (HAART) commonly being given in combination with one or two nucleoside reverse transcriptase inhibitors. Therapy with NVP is associated with significant elevations in alanine aminotransferase (ALT) levels (above 5× the upper limit of normal [ULN]) in 4–20% of patients and symptomatic elevations in 1–5% of patients. Risk factors for ALT elevations include preexisting liver disease due to hepatitis C virus (HCV) or hepatitis B virus and possibly female sex (Ofotokun and Pomeroy 2003). A large proportion of patients have features of immunoallergic hepatitis (NVP hypersensitivity syndrome) with rash, fever, and eosinophilia. Autoantibodies are not common. Most instances have cholestatic features, but initial serum enzyme elevations may be hepatocellular in pattern, particularly in severe cases. HAART regimens including NVP have been reported (Pineda and Macías 2005; Pineda et al. 2010) to be associated with faster liver fibrosis progression in HIV-infected patients with chronic HCV. The contribution of NVP to the progression of fibrosis in these patients has been somewhat controversial in that reports of protection from fibrosis based on NVP exposure have also been presented (Berenguer et al. 2008). Preclinical testing of nonnucleoside reverse transcriptase inhibitor drugs does not typically involve animal regimens that mimic the population of patients with HIV much less than the population with HIV/HCV coinfection.
Materials and Methods
Pharmaceuticals, Animals, and Animal Husbandry
Dosing Regimen and Number of Animals Evaluated at Each Time Point.a
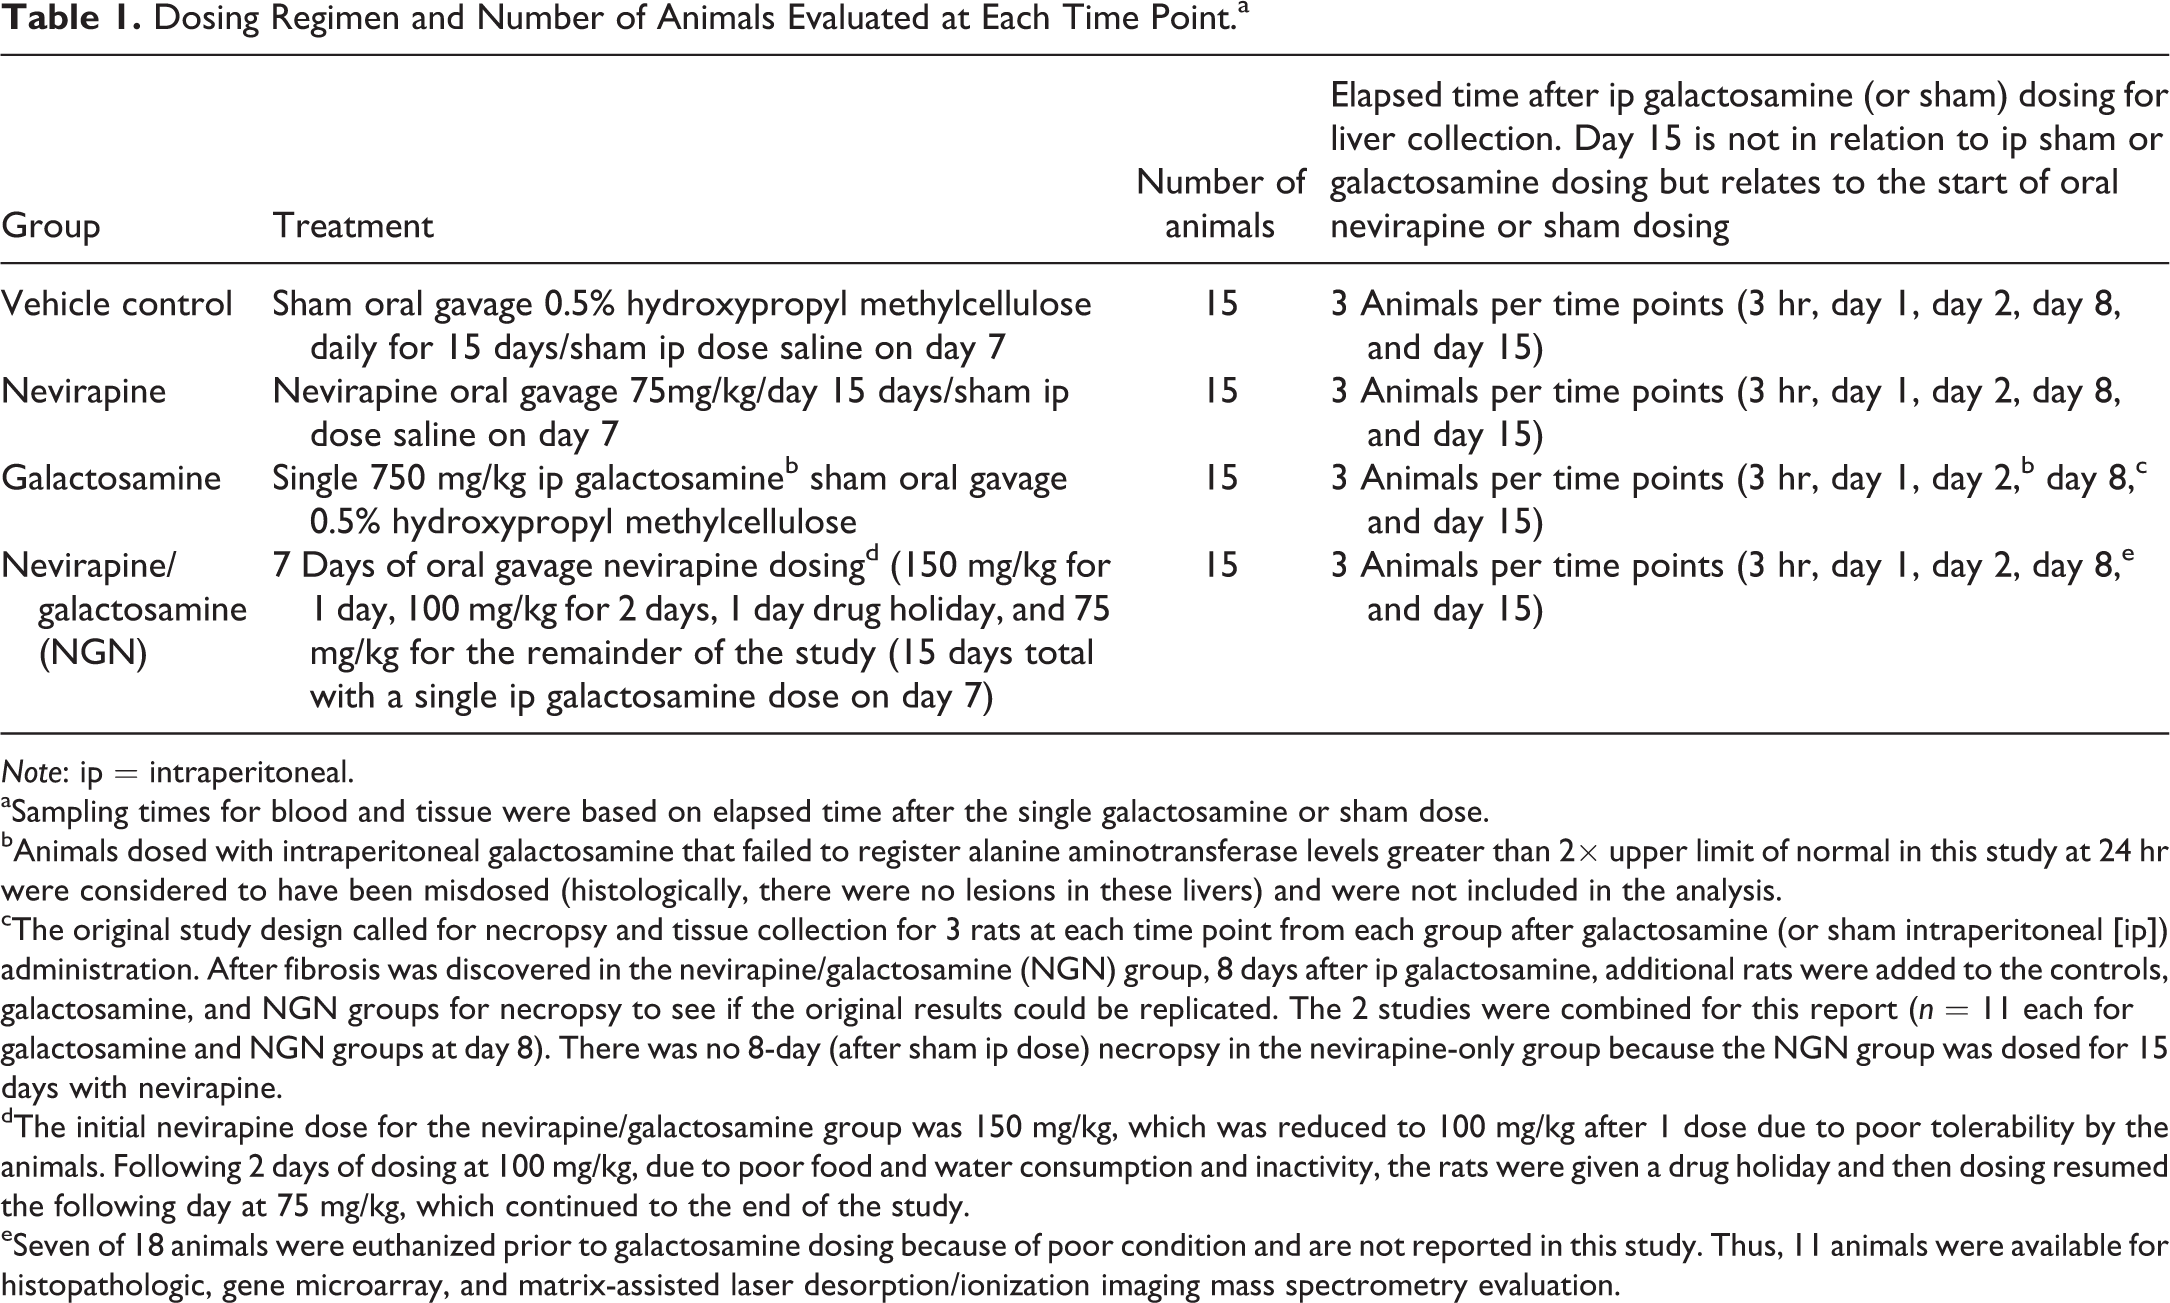
Note: ip = intraperitoneal.
aSampling times for blood and tissue were based on elapsed time after the single galactosamine or sham dose.
bAnimals dosed with intraperitoneal galactosamine that failed to register alanine aminotransferase levels greater than 2× upper limit of normal in this study at 24 hr were considered to have been misdosed (histologically, there were no lesions in these livers) and were not included in the analysis.
cThe original study design called for necropsy and tissue collection for 3 rats at each time point from each group after galactosamine (or sham intraperitoneal [ip]) administration. After fibrosis was discovered in the nevirapine/galactosamine (NGN) group, 8 days after ip galactosamine, additional rats were added to the controls, galactosamine, and NGN groups for necropsy to see if the original results could be replicated. The 2 studies were combined for this report (n = 11 each for galactosamine and NGN groups at day 8). There was no 8-day (after sham ip dose) necropsy in the nevirapine-only group because the NGN group was dosed for 15 days with nevirapine.
dThe initial nevirapine dose for the nevirapine/galactosamine group was 150 mg/kg, which was reduced to 100 mg/kg after 1 dose due to poor tolerability by the animals. Following 2 days of dosing at 100 mg/kg, due to poor food and water consumption and inactivity, the rats were given a drug holiday and then dosing resumed the following day at 75 mg/kg, which continued to the end of the study.
eSeven of 18 animals were euthanized prior to galactosamine dosing because of poor condition and are not reported in this study. Thus, 11 animals were available for histopathologic, gene microarray, and matrix-assisted laser desorption/ionization imaging mass spectrometry evaluation.
Sampling and Histopathology
At each designated time point, 3 rats were euthanized and livers were collected and uniformly sampled so that the left and median lobes were sectioned with matching faces fixed in 10% neutral-buffered formalin for the distal section and snap frozen in liquid nitrogen for MALDI IMS analysis in the proximal section from the hilus. Prior to euthanasia, blood samples were collected from the abdominal vena cava for serum clinical chemistry and plasma drug concentration analysis. Sections snap frozen in liquid nitrogen from the left lobe were also taken for microarray gene expression. Sections fixed in formalin were dehydrated and processed to paraffin blocks and sectioned for H&E staining, picric acid sirius red staining or were retained for immunohistochemistry. H&E-stained sections of liver were evaluated by a board-certified veterinary pathologist. Fibrosis was staged using the Metavir scoring system (Bedossa and Poynard 1996) as follows: no fibrosis (F0), mild fibrosis (F1), moderate fibrosis (F2), moderate–severe fibrosis (F3), and severe fibrosis/cirrhosis (F4). Other lesions in the liver were subjectively scored on the same 4-point system tailored for each (nonfibrotic) individual lesion. The severity of selective lesions was charted over the 8-day time course for comparison between treatments and controls.
Immunohistochemistry, in situ Hybridization, and Gene Expression
Formalin-fixed, paraffin-embedded (FFPE) tissue sections from representative animals from each treatment group were prepared. Sections were cut at 5 µm and mounted on positively charged microscope slides (Fisherbrand Superfrost Plus; Fisher Scientific, Pittsburgh, PA). Sections were air-dried overnight at room temperature and then placed in a 60°C oven for 1 hr prior to running assays. Probes against rat CD163, mannose receptor 1 (Mrc1), and postn messenger RNA (mRNA) and the RNAscope VS 2.0 FFPE brown assay kit were purchased from Advanced Cell Diagnostics (Hayward, CA). A semiautomated protocol was performed on the Ventana Ultra Discovery instrument (Ventana Medical, Tucson, AZ) following the manufacturer’s instructions. Briefly, FFPE sections were treated with the supplied, off-line-heated pretreatment reagent (100°C for 15 min) followed by the online steps of the mRNA detection kit that included, protease digestion, probe hybridization, preamplifier, and amplifier and horseradish peroxidase (HRP) detection using 3, 3-diaminobenzidine (DAB). Positive signal was identified as brown, punctuate dots and clusters. For CD163 and Mrc1 probes, RNAscope method was followed by CD68 IHC on the Ventana Ultra using anti-rat CD68 antibody. The primary antibody was applied and detected using a biotinylated horse anti-mouse antibody that was adsorbed against rat (BA-2001; Vector Laboratories, Burlingame, CA). Positive macrophages were stained red using the RedMap detection kit (Ventana Medical). Nuclei were stained blue with hematoxylin. For CD163 and α-smooth muscle actin (α-SMA) immunohistochemistry, sections were deparaffinized and hydrated with deionized water. Slides were placed in Diva antigen retrieval solution (Biocare Medical, Concord, CA) and processed in the Decloaking Chamber (Biocare Medical) for 30 sec at 125°C. The slides were rinsed well in running tap water then loaded on the Intellipath FLX automated immunostainer (Biocare Medical). Peroxidase block was applied followed by endogenous rat IgG blocking in rodent block R for 15 min. Primary antibody was applied and incubated for 30 min then detected using mouse on rat HRP polymer (Biocare Medical) for 30 min. DAB was applied and produced a brown precipitate at antibody localization. The brown staining was enhanced using a DAB Sparkle reagent (Biocare Medical). Nuclei were stained blue using hematoxylin. For gene expression, the tissues were snap frozen in liquid nitrogen and stored at −80°C until isolation. Tissues were homogenized with a rotor homogenizer with trizol lysis buffer. Chloroform was used for organic extraction of samples, and the aqueous fraction was recovered. The lysate was then mixed with ethanol and passed through Qiagen RNeasy Mini columns according to the protocol. The recovered RNA was then measured on a Nanodrop spectrophotometer. The RNA was then used in the Affymetrix 3’ IVT Express protocol to produce the labeled target cRNA (complementary RNA). The resulting cRNA was loaded onto the Genechip, passed through the stain and wash protocol, and then scanned. CEL files were analyzed using Ingenuity Pathway Analysis report.
MALDI IMS
All reagents were purchased from Sigma-Aldrich (St. Louis, MO) unless otherwise stated. 2,5-Dihydroxybenzoic acid (DHB, purity 98%) was purchased from Sigma Aldrich and purified by recrystallization prior to use. Indium tin oxide (ITO)-coated glass microscope slides were purchased from Bruker (Billerica, MA). Thin sections (6 µm) from the midline of the liver tissues were collected in a cryostat (−20°C) and mounted onto ITO-coated glass microscope slides. Sections serial to those collected for MALDI IMS were taken for H&E staining to enable correlated histological analysis. Prior to DHB matrix application, all tissue sections were collected for MALDI IMS, and all H&E-stained sections were scanned at high magnification (×20–40) using an Aperio Scanscope CS (Leica, Buffalo Grove, IL). For the MALDI IMS experiments, DHB was applied using a custom-built sublimation apparatus. The sublimation system was operated under vacuum (∼300 mTorr) and a heating mantle was used to heat the chamber containing DHB to ∼130°C for approximately 15 min. Based on weight, approximately 12 mg of DHB was applied to the ITO slides. Following sublimation, the slides were incubated in a chamber saturated with methanol for approximately 20 min. All MALDI IMS experiments were conducted using a Bruker Solarix 7 T Fourier transform-ion cyclotron resonance mass spectrometer. Mass spectra were acquired in full-scan mode (m/z 200–1000) with a minimum of 512 K real data points and a spectral resolution of 33,000 (m/z 400). Images were acquired at spatial resolutions ranging from 10 to 25 µm. All ion images were generated using FlexImaging v4.0 software from the raw data. Unless specified otherwise, all ion images are displayed with a mass tolerance of ± 0.0005 Da, minimum intensity threshold of 5%, and a maximum intensity threshold of 75%.
Clinical Pathology and Plasma NVP Concentrations
ALT and total bilirubin (Tbili) were analyzed on an automated clinical chemistry analyzer (Olympus AU640e; Beckman Coulter, Inc., Brea, California) by routine methods using reagents from Beckman Coulter). Rat plasma (50 µL) was extracted once with 250 µL of acetonitrile. After centrifugation (1600 g, 10 min), the supernatants were removed and diluted 2× with water prior to injection (100 µL) and analysis by liquid chromatography–mass spectrometry (serial) (LC–MS n ). NVP stock solution (1 mg/ml) was prepared in dimethyl sulfoxide. A portion of the NVP stock solution was diluted in blank rat plasma extracts to obtain calibration standards containing NVP at 1 and 5 µg/ml. Plasma stock solutions were injected onto LC–MS system at various volumes (10–100 uL) to produce plasma calibration curves for NVP. Calibration curves were performed prior to and post sample analysis. Samples were run in duplicate and separated on a Kinetex C18 reverse-phase column (3.5 µm, 4.6 × 150 mm; Phenomenex, Torrance, CA) at a temperature of 35°C. Mobile phase A was 100% water with 0.1% formic acid, and mobile phase B was 100% acetonitrile with 0.1% formic acid and the following gradient was used: 0–3 min, held at 5% of B; 3–60 min, linear gradient from 5–95% B; 60–65 min, isocratic at 95% B; 65–67 min, ramping from 95–5% B; and 67–70 min, isocratic at 5% B for column reequilibration. The total high-performance LC flow rate was 1 ml/min, which was split postcolumn so that approximately 0.2 ml/min was introduced to the ion source of the MS. Accurate mass measurements were conducted on an LTQ Orbitrap XL mass spectrometer (Thermo Fisher Scientific, Waltham, MA). The MS and MS n data were generated in positive electrospray ionization mode with the following conditions: capillary temperature at 275°C, spray voltage at 5.0 kV, capillary voltage at 46 V, and cone voltage at 40 V. The full-scan MS spectra were obtained from m/z 150–800. The MSn spectra were obtained with the collision energy at 35% using the collision-induced dissociation collision cell. Samples were analyzed by collection of full-scan data at 30,000 and 15,000 resolutions for MSn. MSn fragmentation was performed on selected m/z ions of interest observed in the full-scan data to aid in the identification of NVP.
Statistical Analysis
Analysis of microarray data was performed using Ingenuity® iReports. Probeset intensities were summarized and normalized using robust multiarray average, and significant differential expression was determined by a moderated t test (limma). Fold changes were charted based on sampling at 3 hr, 24 hr, 48 hr, and 8 days after galactosamine. False discovery rate (FDR)-adjusted p values were cutoff at p ≤ .05 and genes with significant fold changes at various times were charted using the following chart indicators: *p ≤ .05, **p ≤ .01, and ***p ≤ .001. For completeness over the time course, all fold changes were included even if the (Q) FDR p value was not significant. The data discussed in this publication have been deposited in National Center for Biotechnology Information’s Gene Expression Omnibus (GEO) and are accessible through GEO Series accession number GSE72076 (http://www.ncbi.nlm.nih.gov/geo/query/acc.cgi?acc=GSE72076).
Results
In-life Observations and Clinical Pathology
Rats dosed with the single 750 mg/kg
Animals dosed with NVP alone at 75 mg/kg/day had no elevations in ALT or Tbili at 24 hr after sham ip dosing of saline (to mimic galactosamine dosing) or at termination of the study. Rats receiving ip injections of galactosamine either as monotherapy or in combination with NVP had elevations in both ALT and Tbili as compared with controls. However, mean ALT and Tbili elevations were much reduced when NVP was orally predosed for 7 days prior to the ip galactosamine administration using the high initial dose paradigm described above. Results are presented in Table 2. All elevated values of ALT or Tbili had returned to within normal range usually by 48 hr postdose but always by 7 to 15 days after the galactosamine dosing in all groups receiving galactosamine including the NVP pretreated group with fibrosis.
Alanine Aminotransferase (ALT) and Total Bilirubin (Tbili) Mean Values 24 Hr after Galactosamine or Sham Dosing.
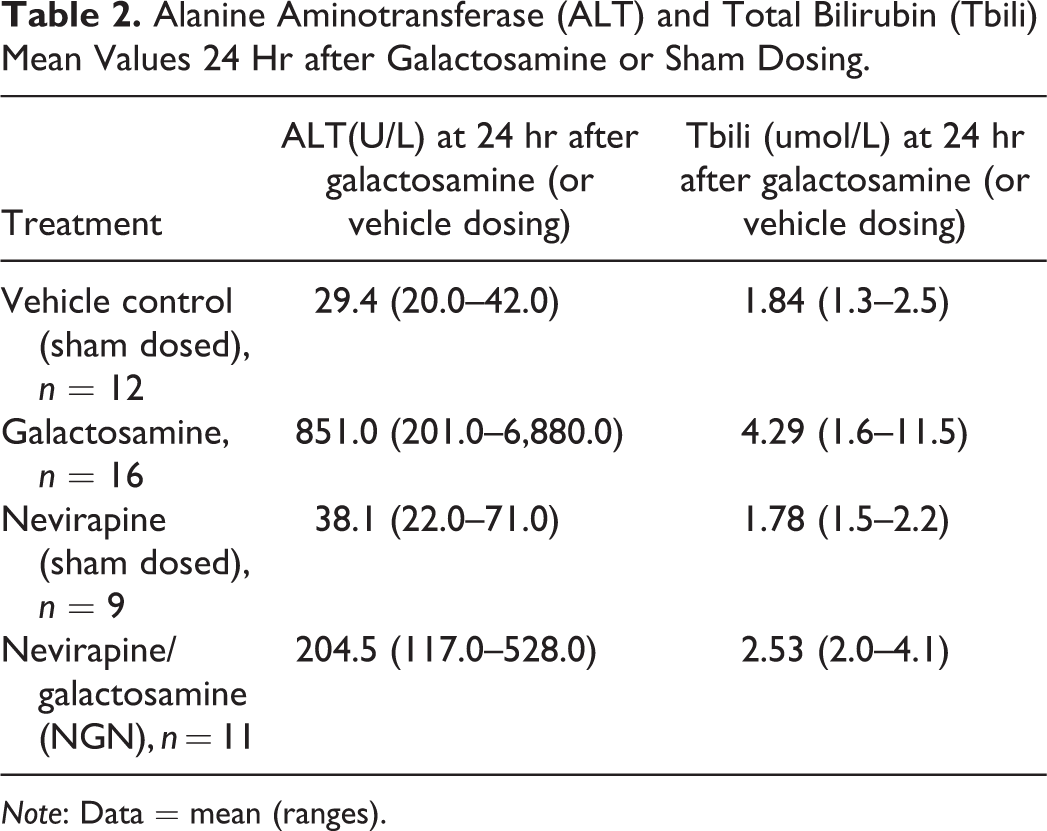
Note: Data = mean (ranges).
NVP Exposure Data and MALDI IMS
In general, plasma exposure to NVP was lower in the NGN-treated animals than in those treated with NVP alone (Table 3). One explanation for this may be the enzyme induction seen with NVP, which would lower parent levels over time. Because the NGN group had a 7-day run-in dose prior to galactosamine dosing, there was ample time for this induction to occur, resulting in lower NVP levels. NVP alone markedly elevated Cyp3a4, sulfotransferase family 1E (Sult1e1), and cytochrome p450 2B6 (rat2b2) gene expression (Figure 1) and the addition of galactosamine enhanced these further, resulting in increased metabolite formation. MALDI IMS revealed the distribution of NVP to be lobular with greater concentrations in centrilobular locations and some focal high-intensity pixels close to sublobular veins (Figure 2A and 2B). The bands of fibrosis seen 8 days after galactosamine dosing were shown by MALDI-IMS to be high in sphingomyelin (d18:0/16:1(9Z)(OH)), a component of peripheral nerve sheaths and some cell membranes (Figure 2C and 2D). Taurocholic acid was also detected within bile ducts, but the pattern of distribution was sporadic and not suggestive of a canalicular pattern of distribution as might be seen with cholestasis but did appear to involve small bile ducts trapped within the fibrous septa of fibrotic livers (Figure 2D).
Nevirapine Plasma Concentrations after Galactosamine or Sham Dosing.
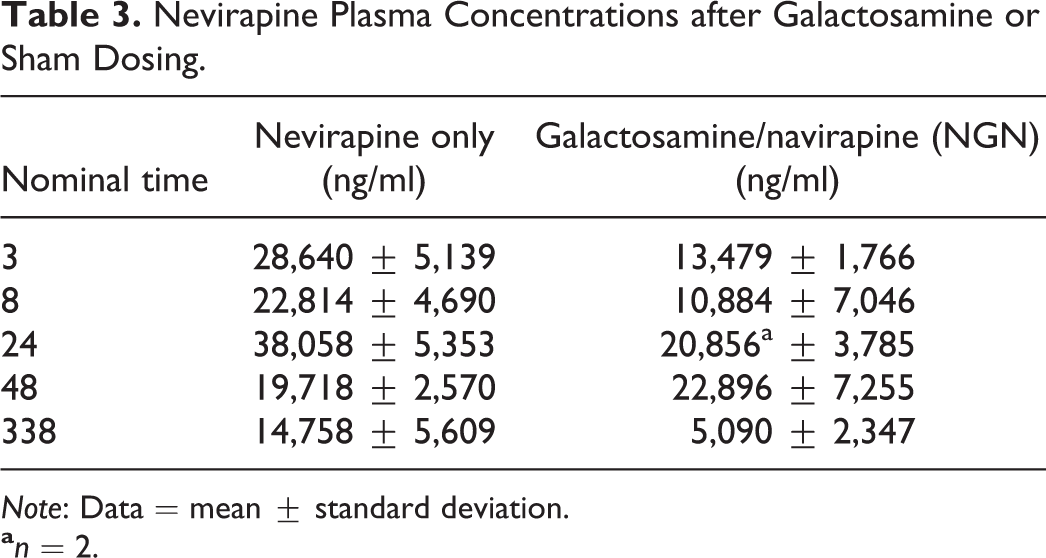
Note: Data = mean ± standard deviation.
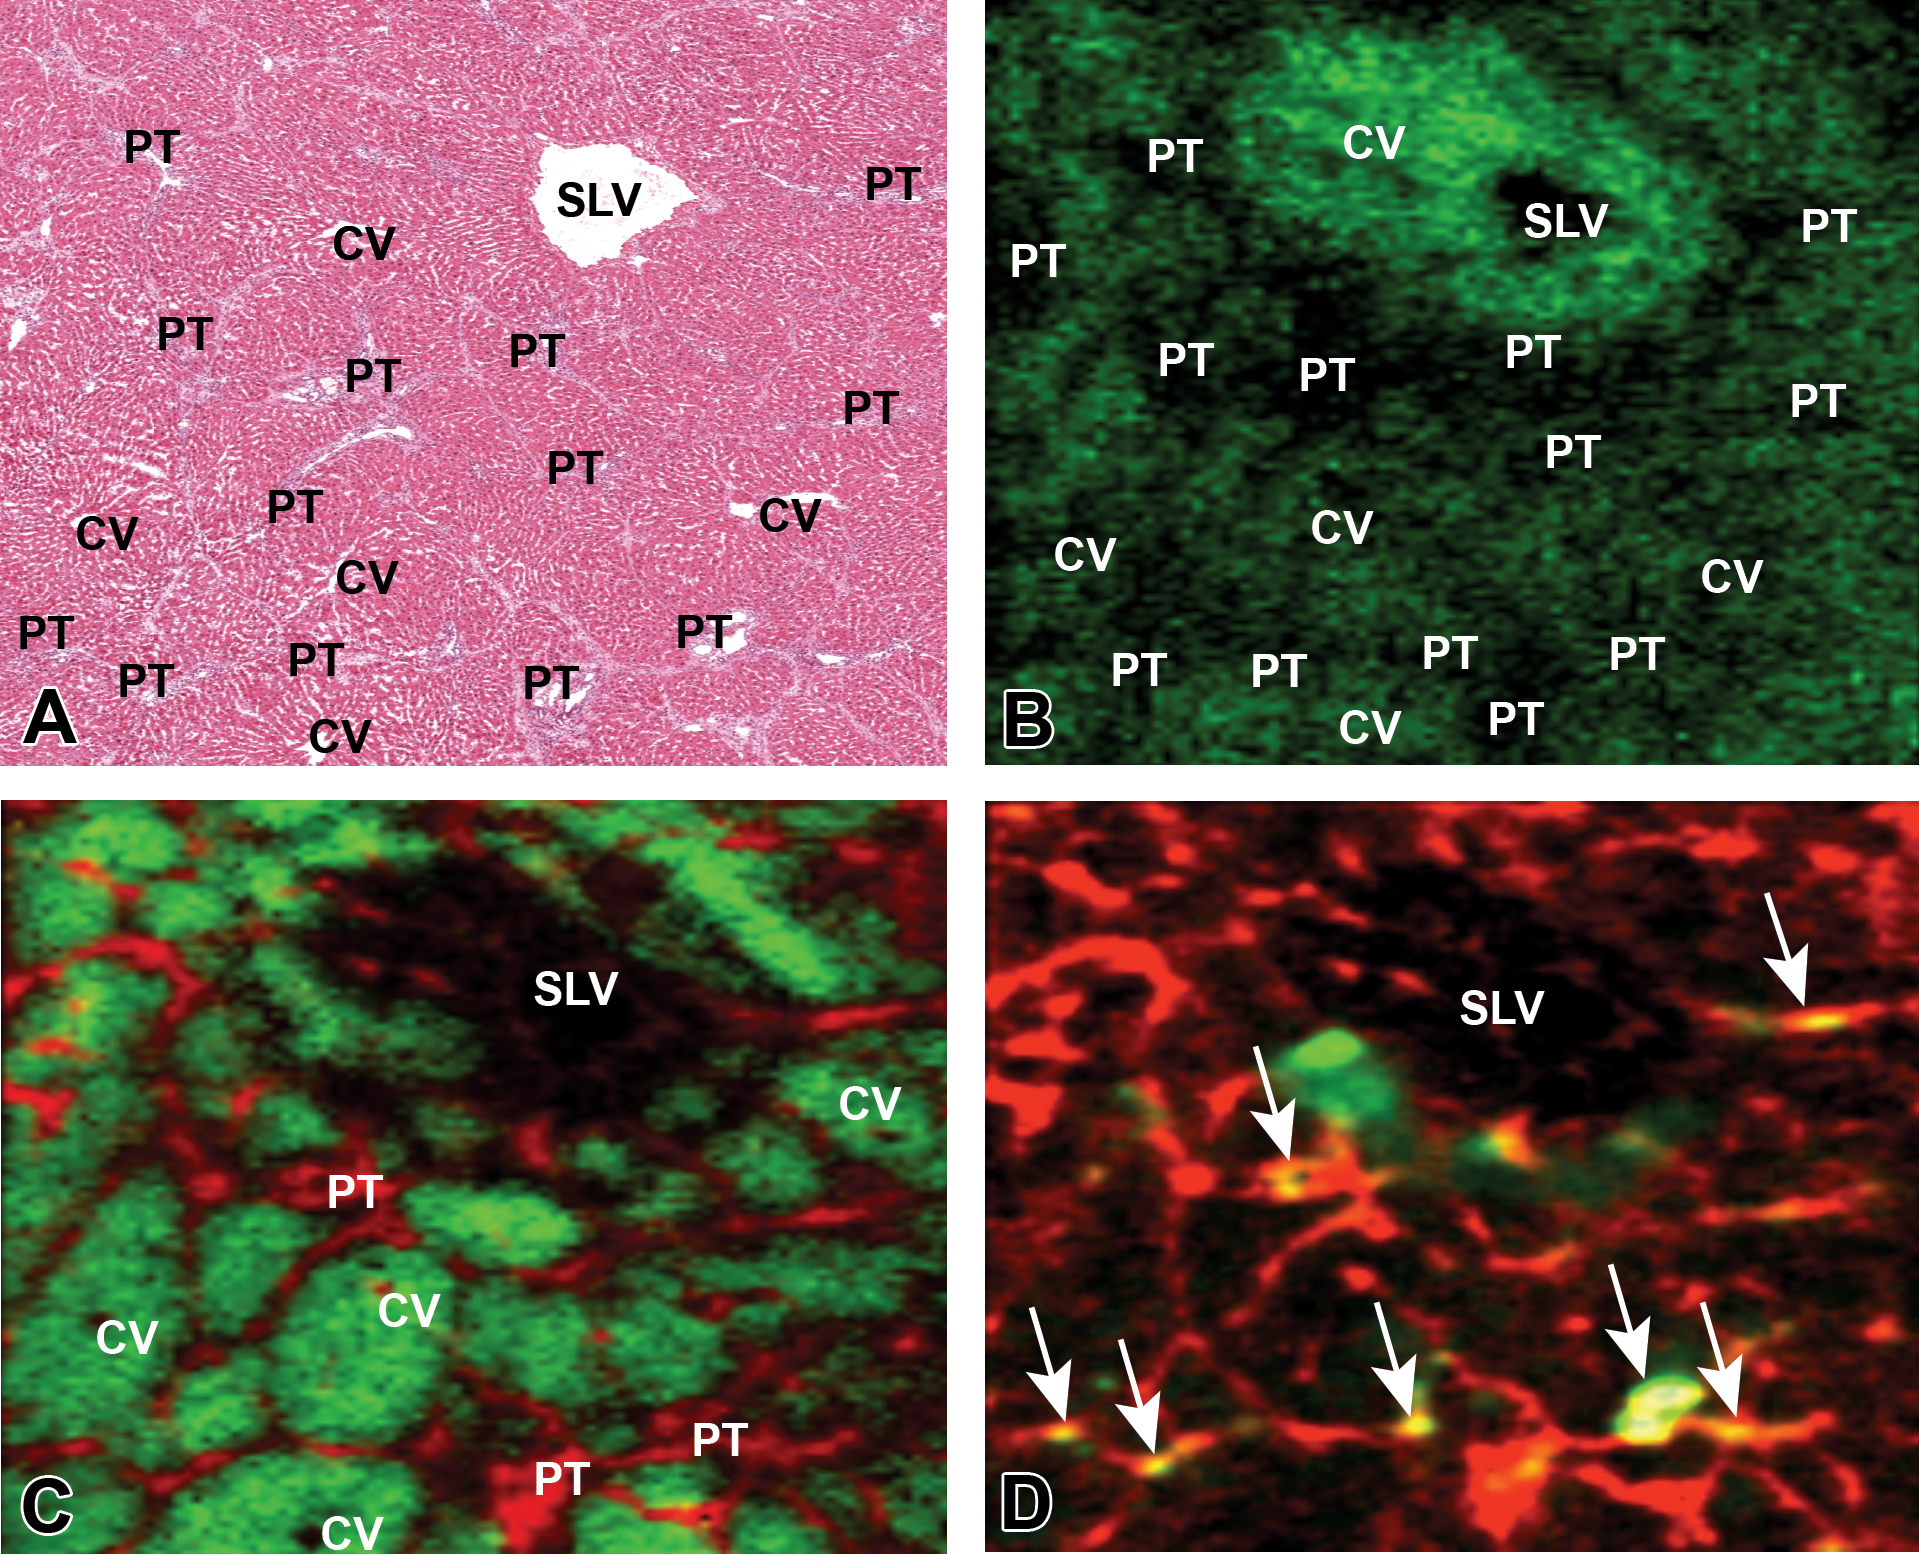
Frozen H&E stained and matrix-assisted laser desorption/ionization (MALDI) ion images of nevirapine (NVP) distribution and selected endogenous molecule changes 8 days after galactosamine administration in an nevirapine/galactosamine-treated fibrotic liver. (A) H&E-stained frozen section showing location of portal triads (PTs), central veins (CVs), and sublobular veins (SLVs). (B) Sequential frozen section of the previous image after matrix application and MALDI imaging mass spectrometry, showing distribution of NVP (green) with a centrilobular distribution and higher concentration around the sublobular vein. (C) MALDI ion image of the above fibrotic liver showing a specific sphingomyelin ((d18:0/16:1(9Z)(OH)) (red)) tracking with connective tissue bands surrounding hepatic lobules (green) and dividing them into pseudolobules. The green pseudocolor depicts the distribution of phosphatidylcholine (PC(38:4)) in hepatocyte membranes. Central veins (CVs) can be seen in some lobules. (D) MALDI ion images of sphingomyelin ((d18:0/16:1(9Z)(OH)) (red)) and the bile acid, taurocholic acid (green). Discreet yellow dots (arrows) depict bile ducts trapped within fibrous connective tissue bands.
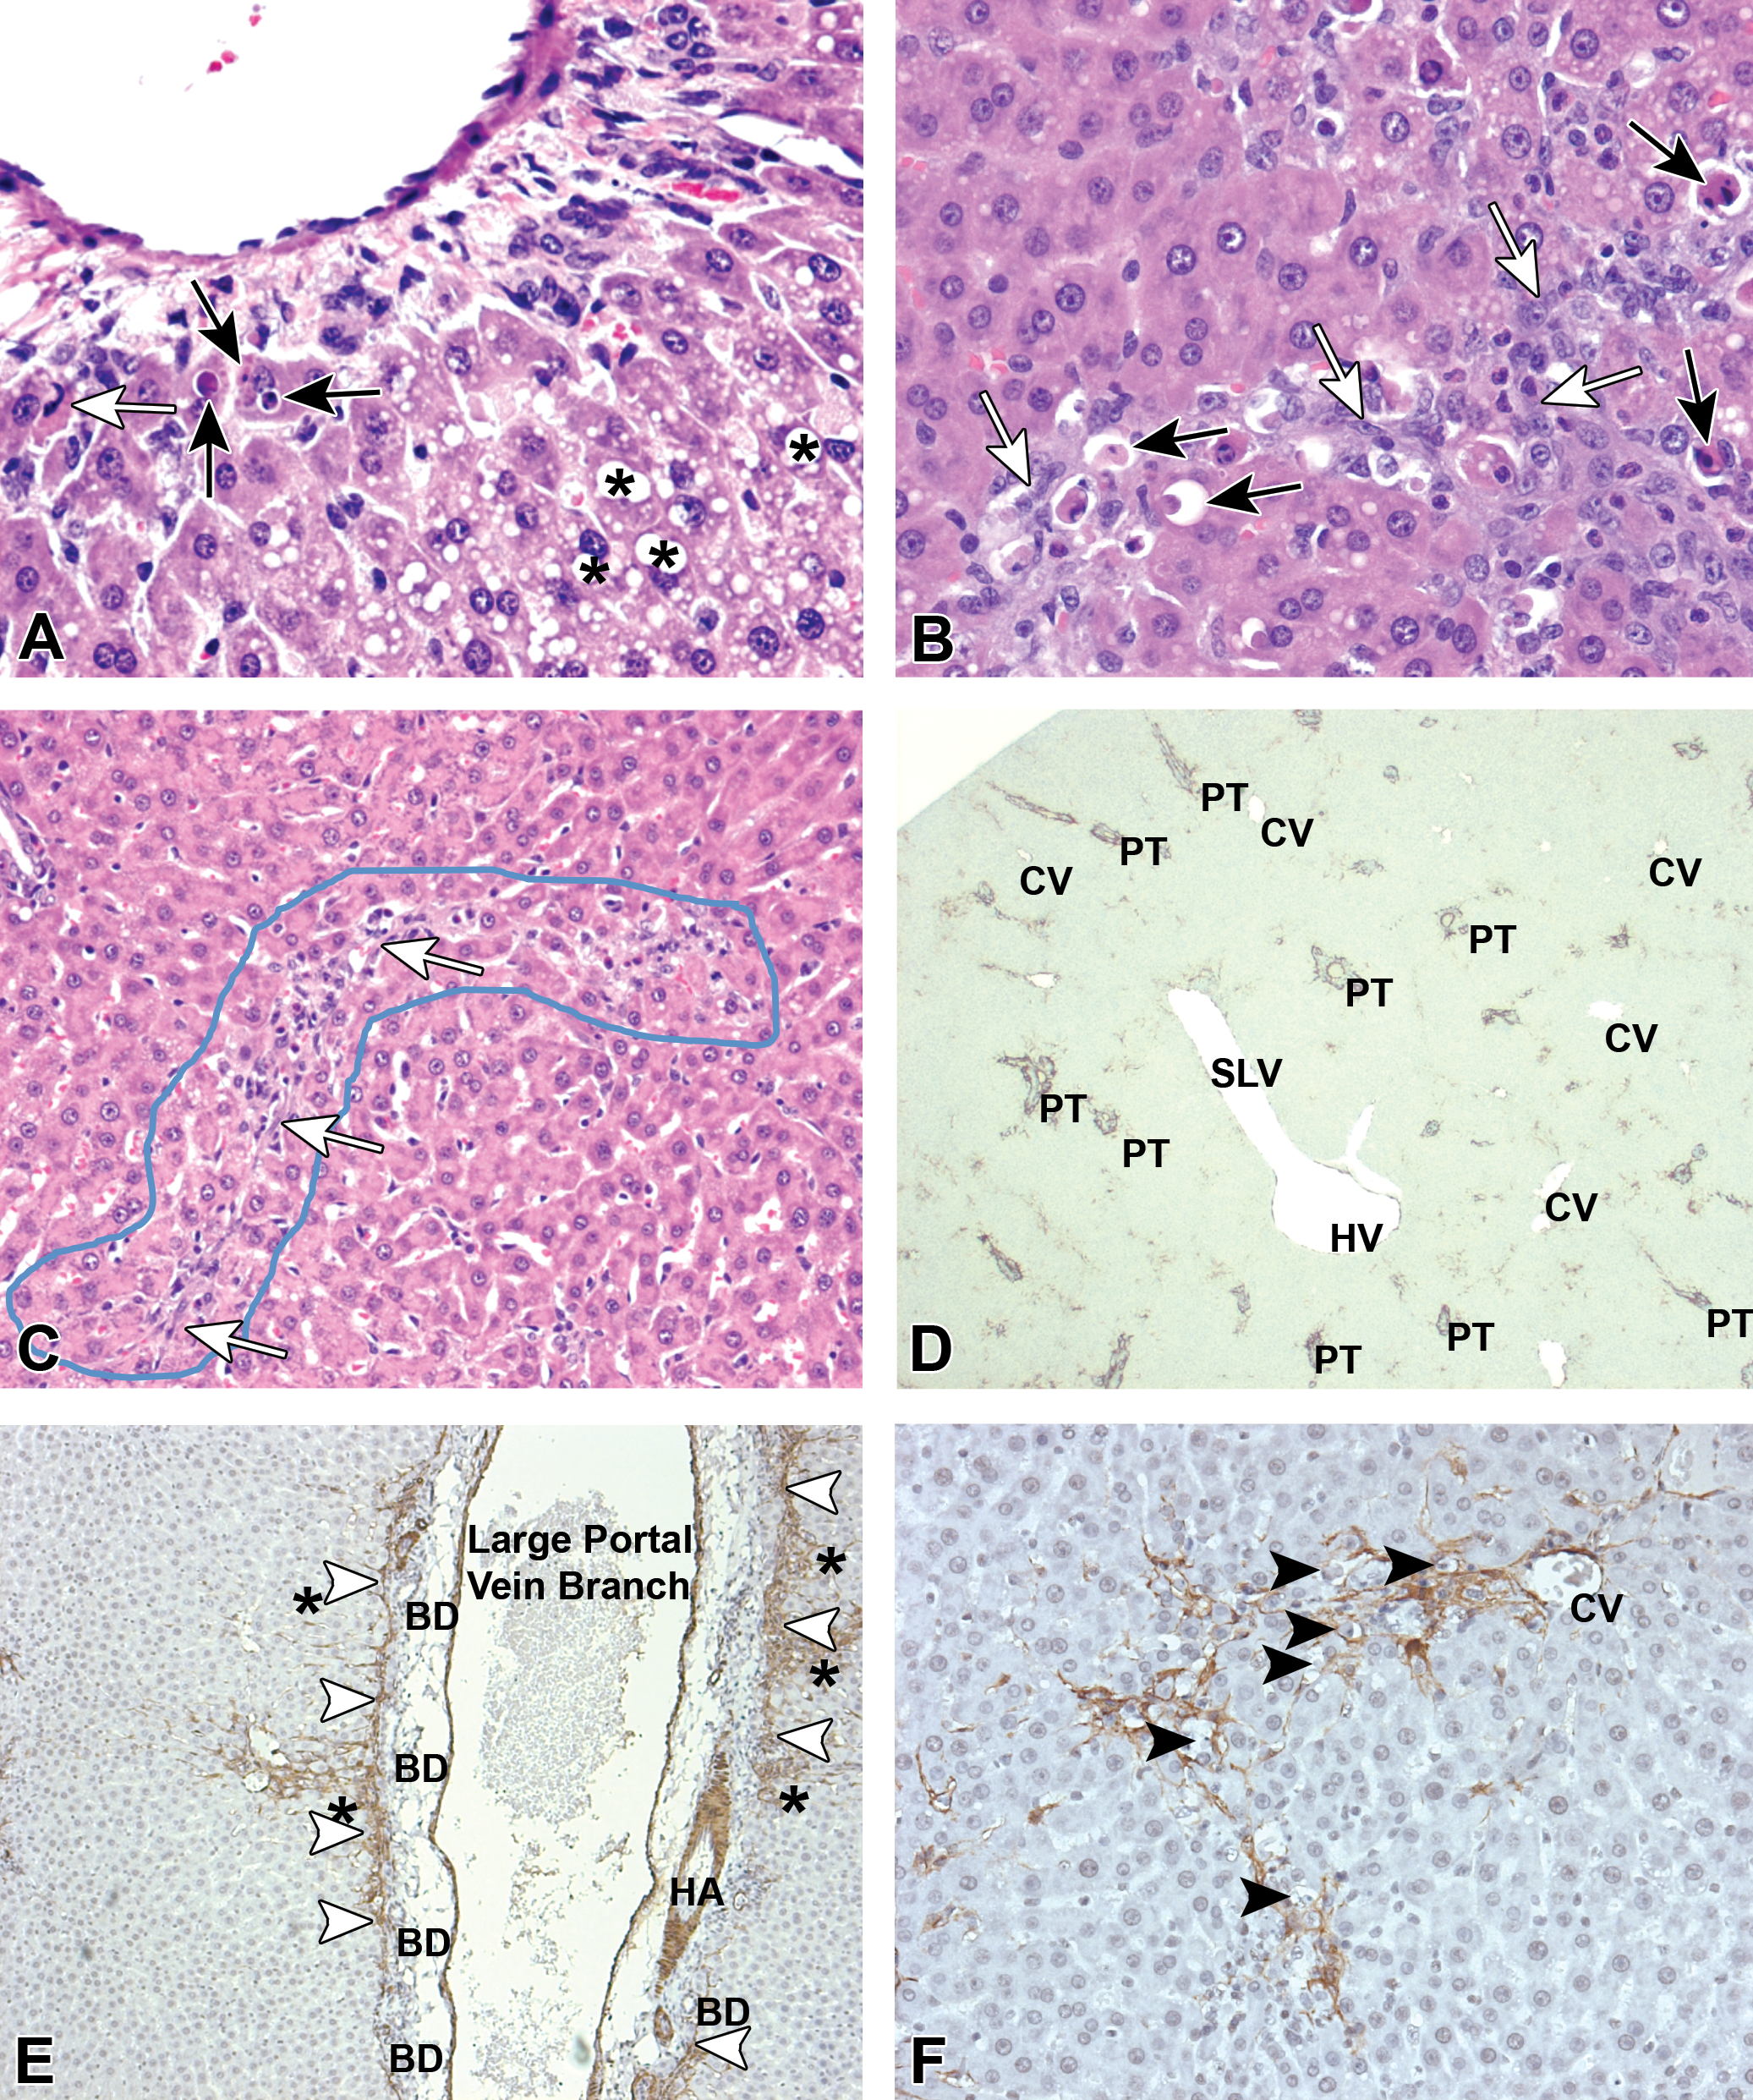
Liver: Sequential changes over the first 48 hr after 750 mg/kg intraperitoneal galactosamine administration in the nevirapine/galactosamine (NGN) group. (A) Scattered apoptotic bodies (ABs; arrows) appear along the limiting plate of a portal triad at 3 hr after galactosamine administration. Oncotic cell death (open arrow) is also present. * = lipidosis in hepatocytes. (B) Groups of ABs (black arrows) radiate from portal tracts and central veins at 8 hr after galactosamine administration in the NGN treatment group and are accompanied by fibrohistiocytic cells, which presumably are activated stellate cells (open arrows). (C) Bands (blue outline) of early fibrohistiocytic cells (open arrows) can be seen at 24 hr after galactosamine administration associated with macrophages and eosinophils in the NGN treatment group. (D) Stellate cell activation (alpha smooth muscle actin antibody—dark brown) at 48 hr after galactosamine administration in the galactosamine-alone-dosed group. The staining is along the portal limiting plate predominantly. PT = portal triad; CV = central vein; SLV = sublobular vein; and HV = hepatic vein. (E) Stellate cell activation (alpha smooth muscle actin antibody—dark brown) at 48 hr after galactosamine administration in the NGN-dosed group. The limiting plate of a large portal tract cut longitudinally is outlined (arrowheads) by activated stellate cells and stellate cells radiate into the parenchyma (asterisks). HA = hepatic artery; BDs = bile ducts. (F) A central vein and band of activated stellate cells (brown) follow a band of apoptotic hepatocytes (arrowheads).
Histopathology
Histologic changes after ip galactosamine administration begin within 3 hr after dosing. Initial changes included increased apoptotic bodies (ABs), often near or involving the limiting plate (Figure 3A) and scattered near the central vein (CV). By 8 hr, a clear lymphohistiocytic inflammatory response to clusters of apoptotic cells (Figure 3B) or cells undergoing oncotic cell death were observed and the frequency of both types of cell death increased in both the galactosamine and the NGN-treated groups compared with the 3-hr sampling. These findings are consistent with previous reports (Decker and Keppler 1974; D. O. Keppler, Pausch, and Decker 1974; Okano, Shiota, and Kawasaki 1997). Over the time course of the experiment, the pattern of apoptosis in the NGN group, although similar between the galactosamine alone and NGN treatments, was more linear and lobular in the NGN group. Reactive stellate cells and histiocytes were seen as early as 3 hr after galactosamine dosing in the NGN group. At 8 hr, these cells revealed a more linear pattern (Figure 3B) and had a biphasic response, which remained elevated until termination, 8 days later. In the NGN group, as early as 24 hr after galactosamine, the response tended to be multifocal but lobular, which began to outline the pattern of portal–central, central–central, and portal–portal bridging seen at later time points (Figure 3C). A more scattered pattern with orientation around both central and portal veins was observed with galactosamine alone, which peaked at 48 hr and then subsided. Immunostaining at 48 hr with antibodies to α-smooth muscle actin (α-SMA; Figure 3D and 3E) confirmed the reactive cells to be stellate cells and demonstrated the response in the galactosamine-only group at the limiting plate (Figure 3D) to emanate from around bile ducts and the plate margin, comparable with the NGN group (Figure 3E). The severity of initial stellate cell activation may have had some correlation with severity of ALT elevation at 24 hr for galactosamine alone but not so for the NGN group where inflammation and ALT elevation were reduced in the first 48 hr compared with galactosamine alone. The striking change with NGN was the association of activated stellate cells with linear bands of apoptosis (Figure 3F) that sometimes extended from CVs to portal triads, portal triads to or from CV to CVs. At 48 hr, focal lesions were distributed near the larger portal tracts and vessels, but in some animals early bridging had occurred.
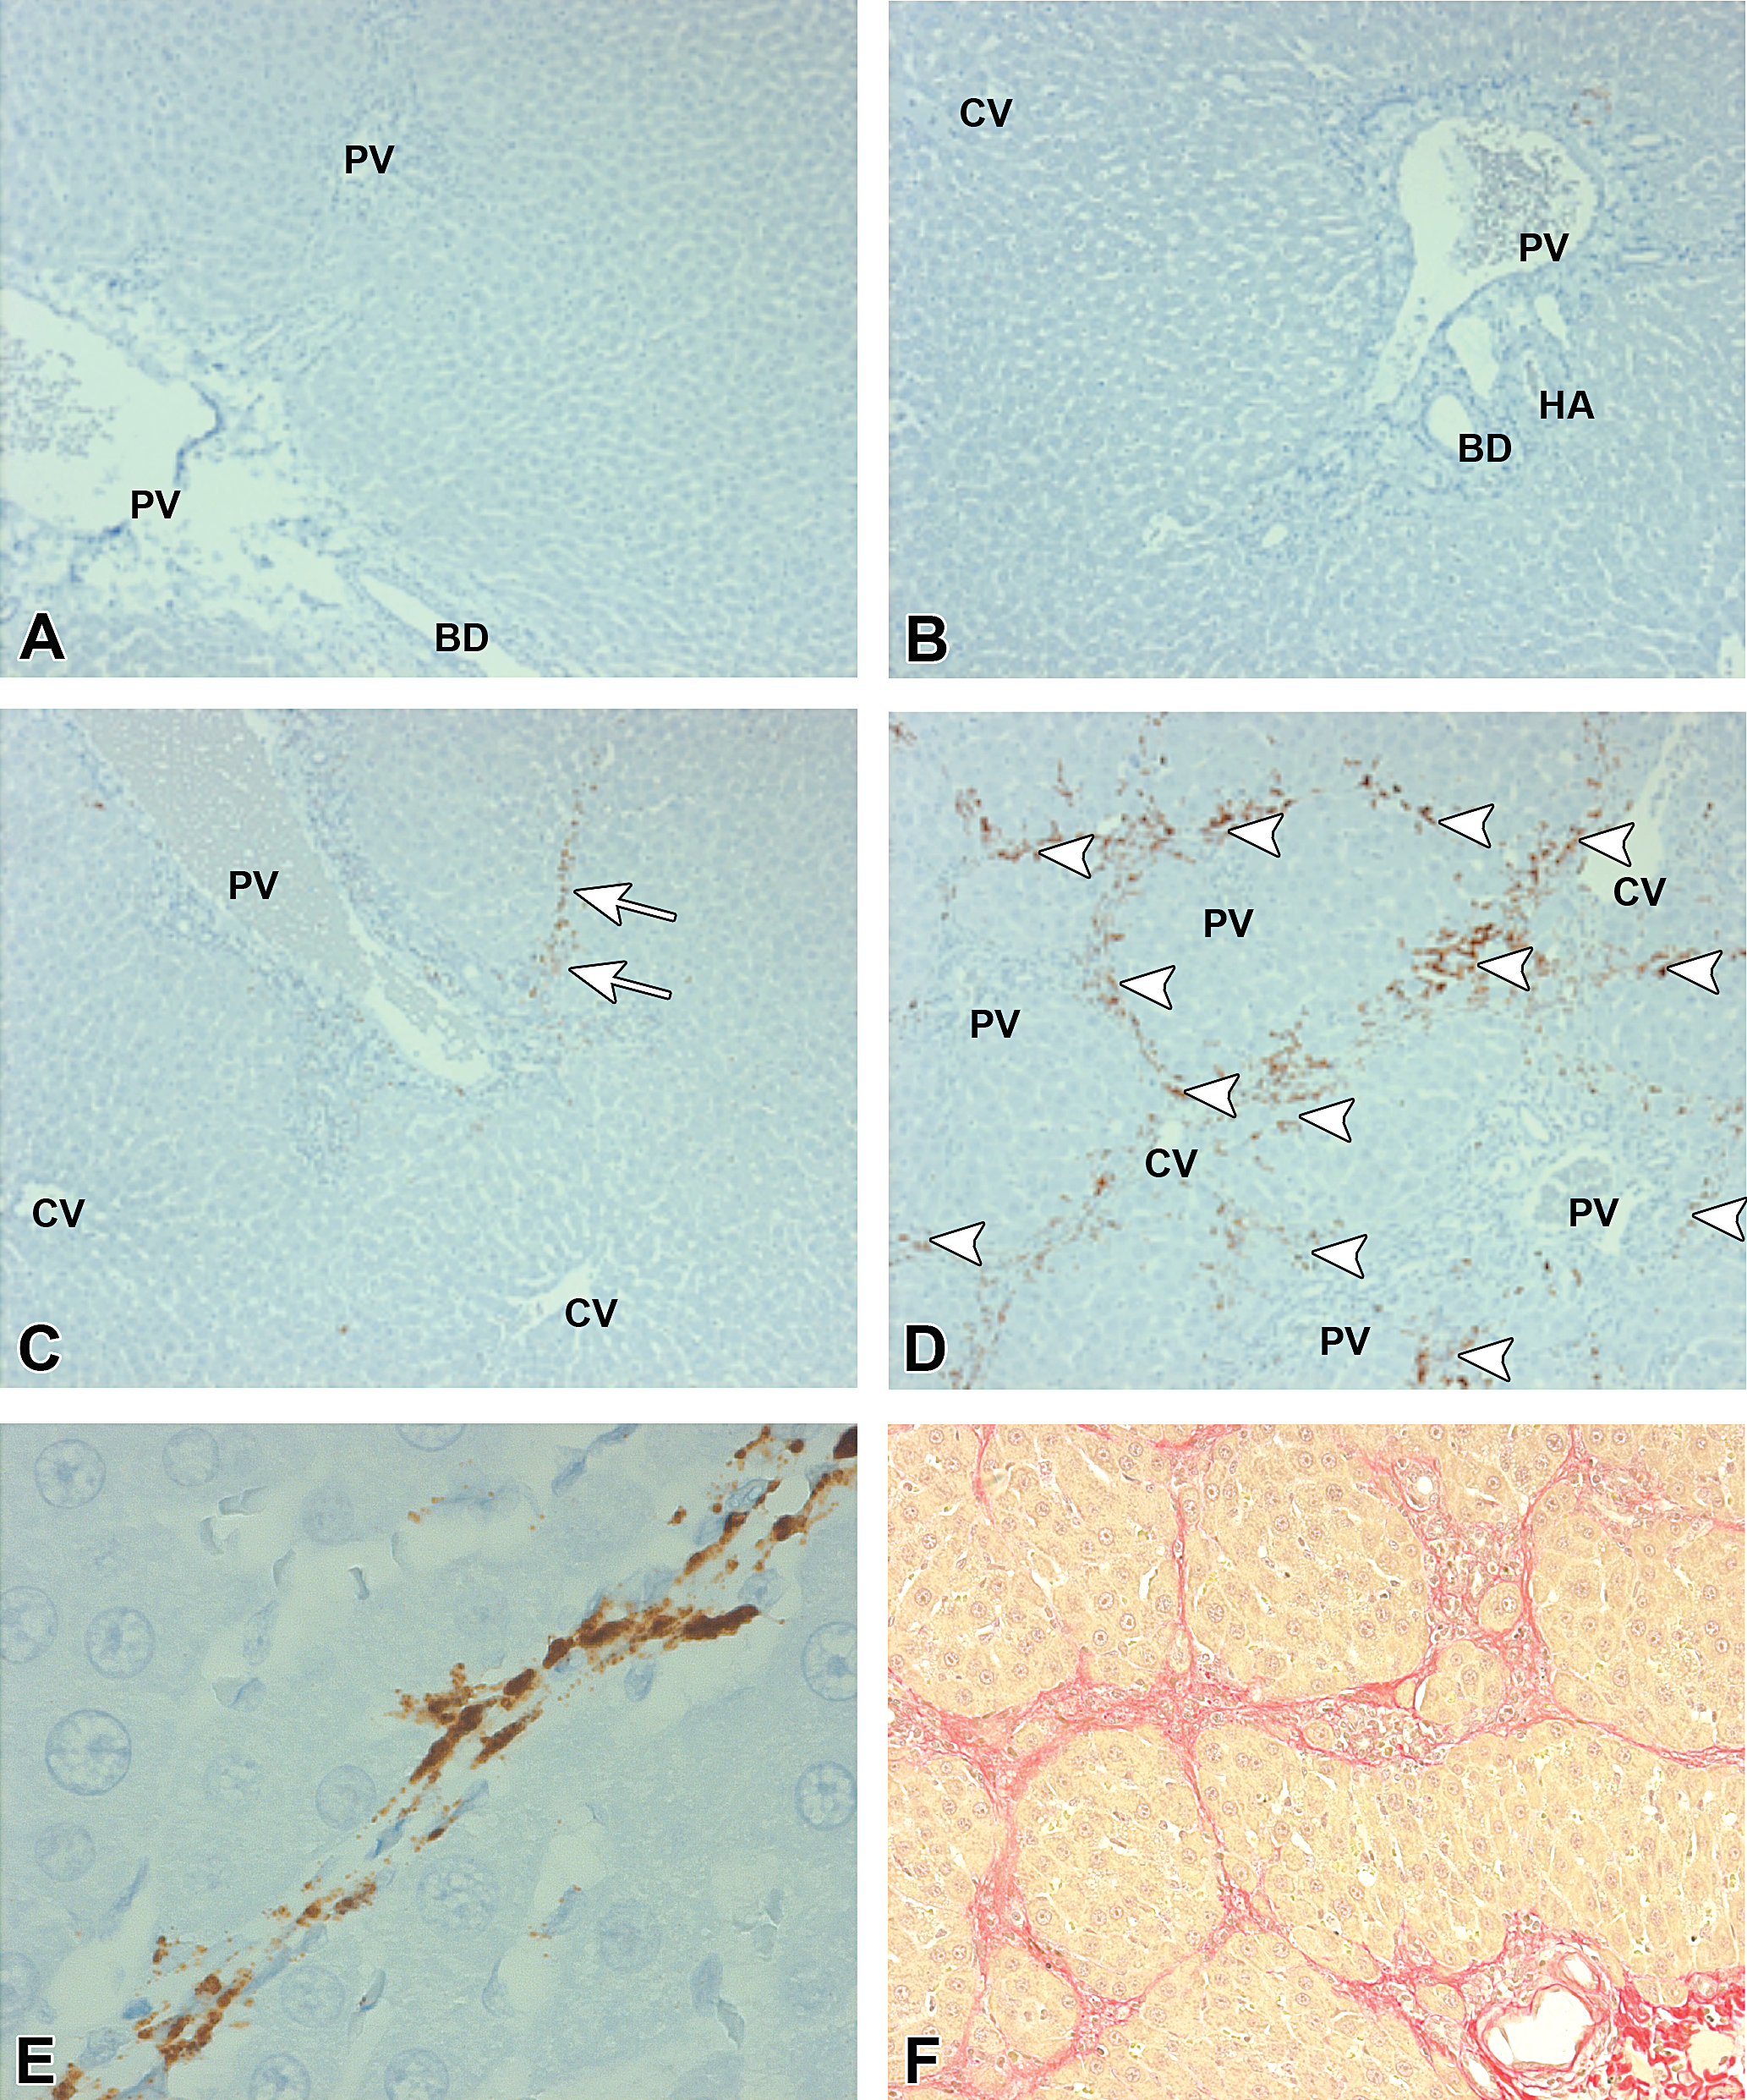
Liver. Induction of periostin (postn) mRNA expression as determined by RNAscope in situ hybridization, 8 days after 750 mg/kg intraperitoneal (ip) galactosamine or sham dosing. (A) Vehicle control sham ip and sham orally dosed. No postn signal is detected. PV = portal vein and BD = bile duct. (B) Nevirapine-alone-treated group with sham ip dosing. No postn signal is detected. PV = portal vein; BD = bile duct; HA = hepatic artery; and CV = central vein. (C) Galactosamine-alone-treated group. A single small linear band of fibrosis with postn staining (open arrows) was detected. PV = portal vein and CV = central vein. (D) NGN-treated group with bands of bridging fibrosis heavily stained for postn mRNA (arrowheads), PV = portal vein and CV = central vein. (E) Clear association of postn mRNA (brown stain) with stellate cells within the fibrous bands. (F) Picric acid Sirius red staining of connective tissue bands paralleling the distribution of postn expression.
Eight days after galactosamine administration, bridging fibrosis advanced in many NGN group animals but was absent in the galactosamine-alone and the NVP-alone groups. Metavir scoring for the NGN group rats is presented in Table 4. Advanced fibrosis was oriented around the path of the large portal vessels and also extended from the liver capsule and the CVs. Based on gene expression results (discussed later), specific mRNA probes from RNAscope were used for postn in situ hybridization. NGN group enhanced-expression in a pattern aligned with collagen deposition and bridging fibrosis was observed (Figure 4A-4F). Mechanistic explanations based on the difference in morphologic signals for the fibrotic responses between the treatments are suggested by the general reduction in various types of inflammation and necrosis that accompanied NGN treatment in the first 48 hr after galactosamine administration. Portal infiltrates of eosinophils and areas of necrosis with necrotic centers surrounded by eosinophils and ringed peripherally by macrophages were increased to a much greater extent in the galactosamine-alone group than in the NGN group. Interestingly, although the eosinophilic inflammation persisted in both groups, at 7 days the severity was approaching background (control) levels. Because of the apparent anti-inflammatory influence of NVP on galactosamine-induced inflammation, in situ hybridization for the alternative activated macrophages (M2) markers, CD163, and Mrc1, was undertaken using RNAscope anti-mRNA probes specific for each marker (Figure 5A and 5B). Slides were costained for the general monocyte/macrophage protein marker CD68 with an antibody targeting CD68. The pattern of M2 macrophages in relation to fibrosis as shown by immunohistochemistry and RNAscope in situ hybridization revealed Mrc1 mRNA-positive macrophages (brown) along the limiting plate of a portal area in an NGN-treated liver at 48 hr after galactosamine administration (Figure 5A). Most cells had dual staining (CD68 is red). Mrc1 is also expressed on stellate cells. CD163 is a lineage-specific hemoglobin–haptoglobin scavenger receptor expressed exclusively on monocytes and macrophages and upregulated in conditions associated with viral hepatitis (Hiraoka et al. 2005) and M2 macrophage activation. CD163 expression, like Mrc1, revealed some CD163 expressing cells to costain for CD68. The pattern of CD163-expressing cells, in the NGN group at 48 hr, closely correlated with the pattern of fibrosis seen 6 days later (Figure 5B).
Metavir Fibrosis Score in the Nevirapine/Galactosamine (NGN) Group in Relation to the Individual Animal Alanine Aminotransferase (ALT) and Total Bilirubin (Tbili) Values.
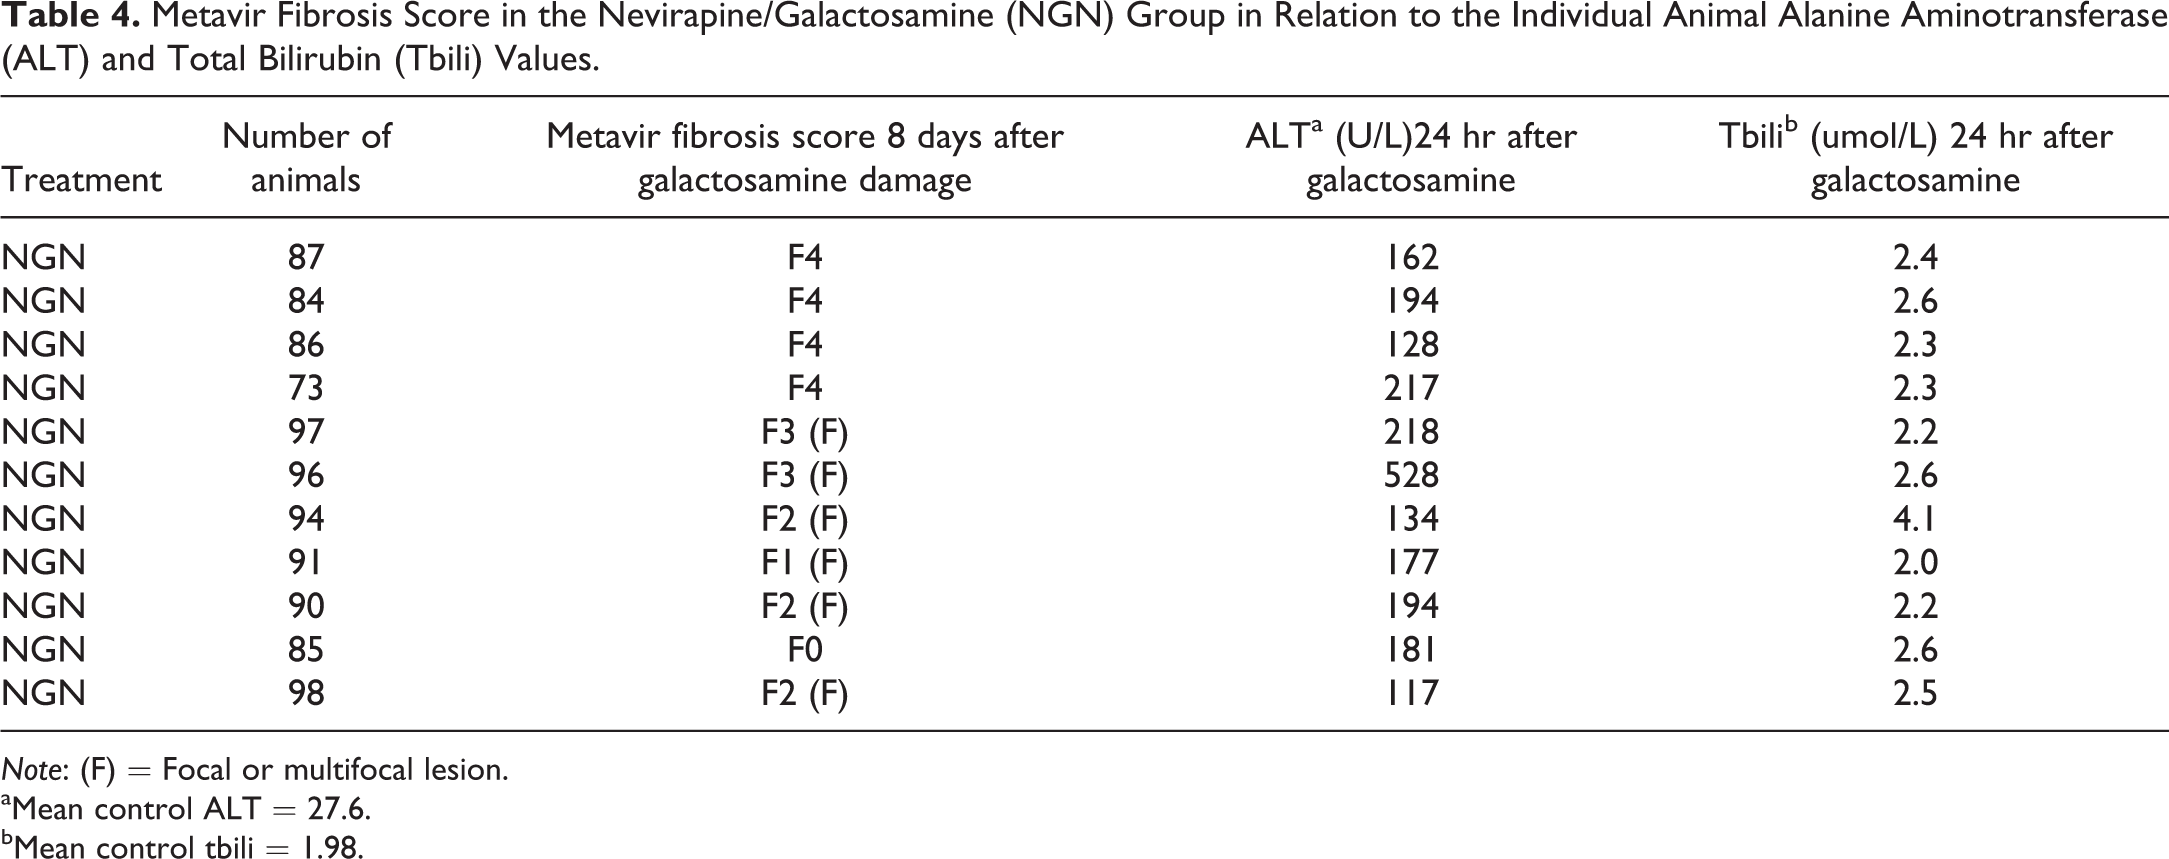
Note: (F) = Focal or multifocal lesion.
aMean control ALT = 27.6.
bMean control tbili = 1.98.
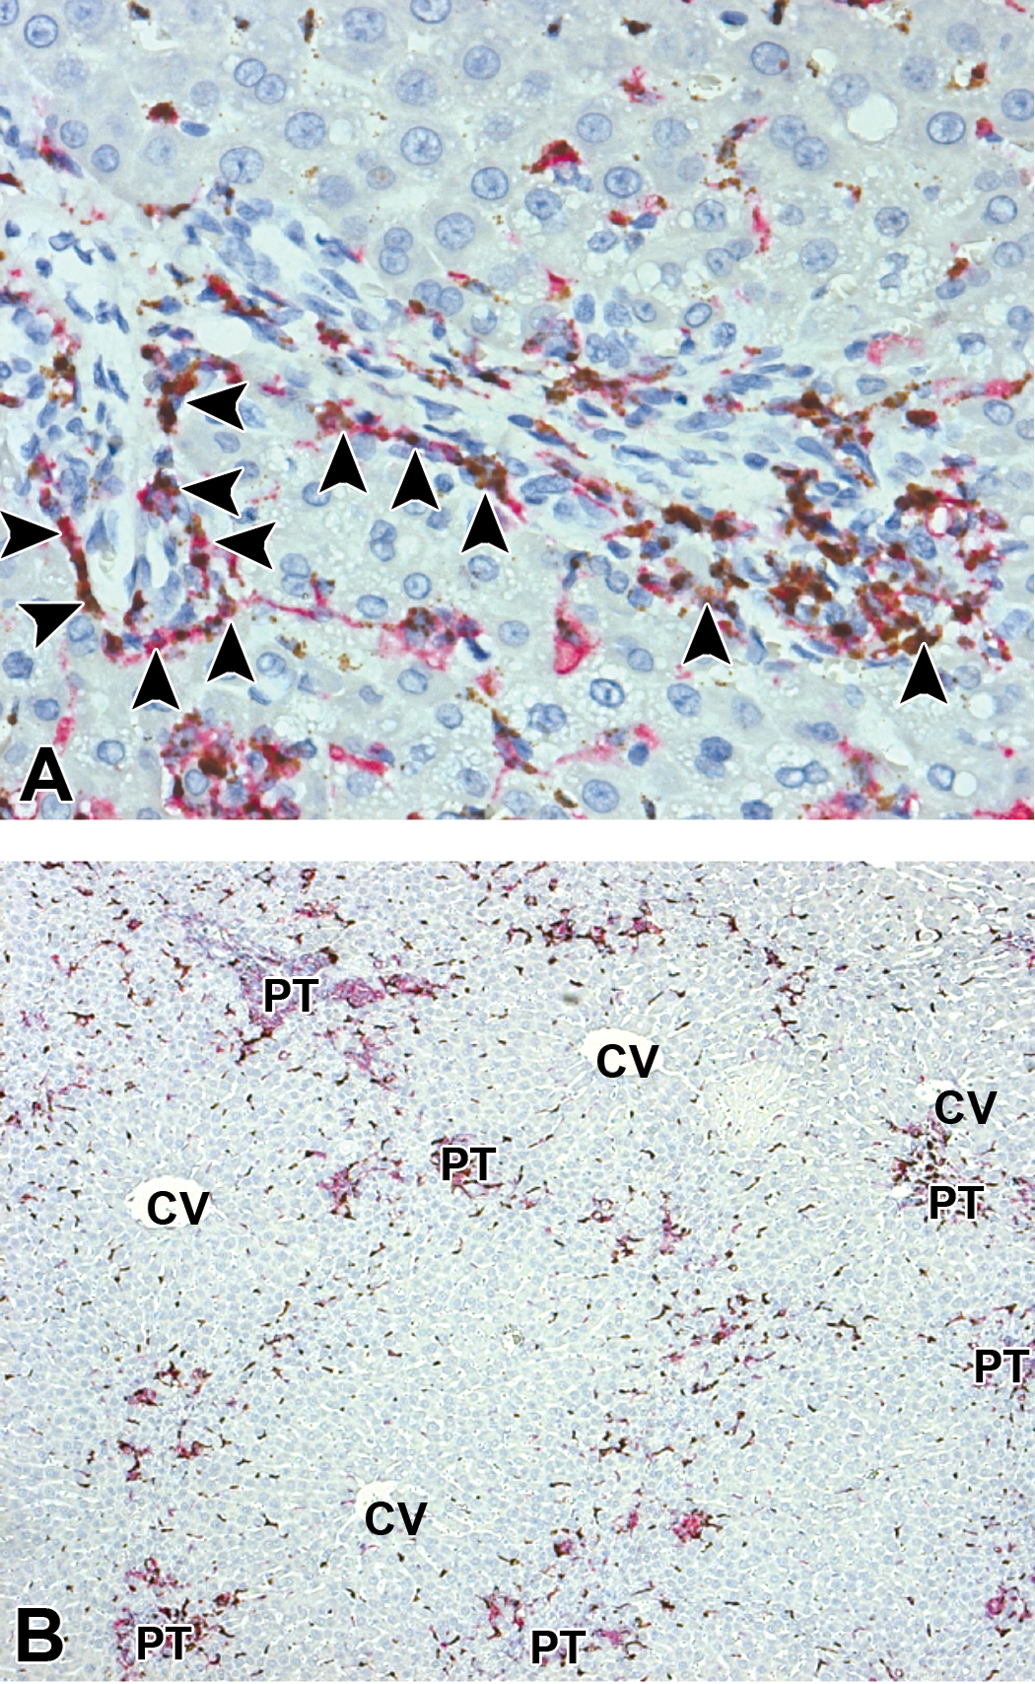
Liver. (A) NGN-treated rat liver at 48 hr after 750 mg/kg intraperitoneal galactosamine. In situ hybridization for macrophage mannose receptor 1 mRNA-positive cells (brown) clustering along the limiting plate (arrowheads) of a portal tract. Red staining represents CD68-positive cells detected by an antibody against CD68 protein. Some cells stain positively for both markers. (B) NGN-treated rat liver at 48 hr after 750 mg/kg ip galactosamine. In situ hybridization (brown) for CD163 messenger RNA. Red staining represents CD68-positive cells detected by an antibody against CD68 protein. Some cells stain positively for both markers. There is a distinctive orientation of these cells around portal tracts in a manner which portends the pattern of fibrosis seen at 8 days after dosing galactosamine in this group. PT = portal triad and CV = central vein.
Time course depiction of messenger RNA fold changes for genes involved in the metabolism and elimination of nevirapine and for genes associated with retinol/retinoic acid metabolism and for RNA sensing molecules.
Biliary and vascular changes were present in both the galactosamine-alone and NGN-treated groups. Biliary changes consisted of biliary epithelium hypertrophy with some biliary epithelial hyperplasia. The severity of these changes was minor and peaked with both treatments at the 48-hr time point. Tbili was elevated by galactosamine-alone treatment by 24 hr while Tbili in the NGN group was comparable with controls at these same time points. Occasional multifocal hepatic lobular hemorrhagic necrosis and vascular wall inflammation were increased in the NGN and galactosamine-alone groups at a comparable incidence and severity. Vascular inflammation was particularly prominent at the hilus, but again, both galactosamine alone and the NGN treatment were affected suggesting that vascular damage alone did not account for the fibrosis although its contribution deserves further study.
Gene Expression
Plotting gene expression fold changes over time revealed distinct patterns of expression with galactosamine and NVP each having unique gene signatures and with a few genes uniquely expressed with NGN. In the NGN group, where fibrosis was seen, most early gene changes were under the influence of galactosamine with proinflammatory M1 responses predominating over the first 24–48 hr but peculiarly resulting in less inflammation than with galactosamine alone. A smaller subset of genes followed the NVP profile and another set, distinctive for fibrosis, varied from either the galactosamine-alone or NVP-alone pattern. These results suggest the interaction of reactive metabolites with an immune-mediated transformation to a fibrotic state in the NGN group.
NVP-influenced Genes
Upregulated genes that were only or predominantly influenced by NVP administration were most apparent for the genes whose products involved phase 1 and phase 2 metabolism of NVP and the possible generation of reactive metabolites, particularly via the Cyp3a4/Sult1e1 pathway. This was particularly prominent for Sult1e1, Cyp2b2 (CYP2B6), and Cyp3a2 (CYP3A4) but was also seen for glutathione S-transferase mu 3 (Gstm3). In all cases, the NGN combination increased expression to a greater extent than for NVP alone (Figure 1). Similarly, genes associated with retinol and retinoic acid metabolism were also dysregulated by NVP alone and by NGN (Figure 1). These included Cyp26a1, aldehyde dehydrogenase family 1, subfamily A7 (Aldh1a7), and alcohol dehydrogenase 7 (figure not shown). Similarly for these genes, the NGN treatment tended to be more upregulated compared with NVP alone. Other genes upregulated by NVP include connective tissue growth factor (Ctgf; Figure 6), caspase-3 (Casp3), and sphingosine-1-phosphate lyase 1 (Sgpl1; Figure 7). Casp3 activation in endothelial cells is a novel inducer of Ctgf release and fibrogenesis, whereas Sgpl1 elevates stress-induced ceramide production and apoptosis although some protection has been shown by overexpression of this gene in bleomycin models (L. S. Huang and Natarajan 2015).
Time course depiction of messenger RNA fold changes for Psmb9, a gene for a catalytic subunit of the immunoproteasome and for genes involved in lectin, galectin, and RNA sensing and pattern recognition molecules. Other genes are associated with hepatitis C virus activation of DNA repair or suppression of stellate cell activation (Ns5-Atp9).
Time course depiction and molecules associated with M2 or alternatively activated macrophages or stellate cell receptors and antigen processing and presentation. The gene TMEM173, an ER adaptor protein that physically interacts with retinoic acid-inducible gene 1and major histocompatibility complex type II genes, is also presented. Although increased expression is induced by galactosamine alone, the nevirapine/galactosamine regimen consistently elevates and prolongs the response. Connective tissue growth factor is an extracellular matrix heparin binding major connective tissue mitoattractant secreted by vascular endothelial cells. TMEM173 = transmembrane protein 173.
Galactosamine-influenced Genes
The majority of gene expression changes observed in this study seem to occur in response to galactosamine alone. The difference in the NGN-treated group is that the response generally seems to be greater and more prolonged with NGN than with galactosamine alone. Significantly, genes associated with innate immune-mediated processes are the most striking gene expression changes seen and many of the most strongly dysregulated of these are associated with dendritic cell interactions with lectins (C-lectins and galactoside-binding soluble lectins), which are involved with foreign antigen presentation to major histocompatibility complex (MHC) classes I and II molecules. Among these are C-type lectin domain family 7, member A (Clec7a; Dectin 1), lectin, galactoside-binding, soluble, 3 (Figure 8), and Mrc1 (Figure 6). Since lectin receptors have been found on mast cells, it is interesting that mast cell proteases 2 (Mcpt2) and carboxypeptidase A3 (Cpa3) are also upregulated but only become markedly elevated at the termination of the study once fibrosis is evident (Figure 9). Proteasome subunit beta 9 (Psmb9) is also strongly upregulated in the first few hours after galactosamine administration, in the NGN group primarily, but to a lesser extent with galactosamine alone (Figure 8). As noted with several other genes, Psmb9 tends to remain elevated longer in the NGN than with galactosamine alone. Psmb9 codes for catalytic subunits of the immunoproteasome and has been linked to fibrosis stage and HCV infection (Bieche et al. 2005; Vasuri et al. 2010). These changes are paralleled by changes in genes involved in antigen processing and presentation of exogenous peptide antigen via MHC class II genes such as Rt1-db1, Rt1-da, Rt1-ba, and Rt1-Bb (Figure 9). Similarly, the stellate cell receptor for macrophage migration inhibitory factor (glycosylation-inhibiting factor) Cd74 shows similar patterns of regulation with galactosamine and NGN (Figure 6), emphasizing the higher and more prolonged expression with NGN. Cd74 plays a critical role in MHC class II antigen processing by stabilizing peptide-free class II alpha/beta heterodimers in a complex soon after their synthesis and directing transport of the complex from the endoplasmic reticulum to the endosomal/lysosomal system where the antigen processing and binding of antigenic peptides to MHC class II take place. For all of these antigen presenting and processing genes, galactosamine may increase expression but NGN produces a greater and more prolonged response.
Time course depiction of messenger RNA fold changes for key genes controlling collagen secretion and collagen cross-linking. Periostin, in particular, is a secreted protein bound to the extracellular matrix and key to activation of lysyl oxidase and the making of insoluble collagen by cross-linking. Other genes are associated with ceramide production and apoptosis (sphingosine-1-phosphate lyase 1 and caspase-3).
Time course depiction of messenger RNA fold changes for type II major histocompatibility molecules and mast cell proteases.
Similarly, genes activated by galactosamine and involved in the alternative macrophage activation pathway (anti-inflammatory but profibrotic M2 macrophages) are upregulated but with NGN, again this upregulation is in the same pattern of higher and/or more prolonged expression. Genes in this group include Cd163, Mrc1, and Lcn2 (Figure 6). In the case of Lcn2, NGN treatment massively increases this elevation to more than 25-fold in the first 48 hr before declining and recent articles (Lech and Anders 2013; Guo, Jin, and Chen 2014) clearly link it with M2 polarization. Finally, genes depicting the transition to a fibrotic state (postn, lox, Col1a1, and Col1a2) in the NGN group 7 days after galactosamine show very similar patterns (Figure 7) and very high fold changes in expression (over 30-fold for postn and over 8-fold for lox). Other genes such as toll-like receptor 2 (Tlr2), and RNA sensors and effectors (Ddx60, Ns5atp9, and transmembrane protein 173 [Tmem173]), which orchestrate antiviral responses (including HCV ), are also upregulated in the first 48 hr by galactosamine alone but tend to decline thereafter (Figures 8 and 6). In the NGN group, the rate of decline appears to be slower.
Discussion
Hepatic fibrosis is classically considered to be a chronic process, occurring over weeks or months in response to a lingering or repeated inflammatory insult. HCV-induced fibrosis is characterized by viral protein-mediated prolonged hepatocellular dysfunction and apoptosis accompanied by a macrophage and stellate cell phagocytosis of ABs resulting in pattern recognition and immune-mediated profibrotic phenotypes. Altered gut permeability to endotoxin (lipopolysaccharide) is also a feature of both HCV and galactosamine administration (not presented in this article) and may contribute to fibrosis via immune mechanisms. In attempting to look at the effects of a transient acute inflammatory process (single-dose galactosamine administration) on drug metabolism (NVP), we discovered a rapid bridging fibrosis in response to a single-galactosamine dose when it was administered to female brown Norway rats pretreated for 7 days with initial high doses of NVP followed by lower daily doses. Reduced acute inflammation (as compared with galactosamine alone) and increased macrophages with M2 markers characterized this response. Neither 14 days of dosing NVP alone nor a single dose of galactosamine alone after 7 days, produced fibrosis. More frequent dosing of galactosamine with constant lower-dose NVP administration failed to produce the same degree of fibrosis (not presented in this article). We repeated the original regimen in female brown Norway rats of high-dose NVP to lower dose NVP with a drug holiday on day 3 followed by continued NVP for a total of 14 days with a single-galactosamine dose on day 7 and again achieved marked fibrosis in most of the animals. We believe that galactosamine-induced apoptosis in the presence of reactive metabolites produces altered proteins and profibrotic immune responses with M2 macrophage activation leading to fibrosis with some similarities to HCV-induced fibrosis. These pathways are highlighted below.
Galactosamine is metabolized to UDP hexosamines and UDP-N-acetylhexosamines in hepatocytes. Within minutes, this results in the depletion of UTP in parenchymal cells, causing a transient block in transcription and protein synthesis in these cells. Galactosamine did not increase parent NVP exposure but instead lowered plasma levels. Upregulation of Gstm3 may have significance in that previous investigators have shown reactive metabolites from SULT activation of 12-hydroxy NVP (Antunes et al. 2010) to interact with and form haptens with GSTpi both in vitro and in NVP-treated patient’s serum (Meng et al. 2013), the suggestion here being that Gstm3 may also be a target for haptan formation and perhaps enzymatic inactivation in this model. There are numerous reports of reactive metabolites derived from NVP (Marinho et al. 2014) and as evidenced by gene expression, key routes of reactive metabolite production were clearly dysregulated (Cyp3a4 and Cyp2b6) after NGN treatment, which exhibited fairly similar elevations in treatment with NVP alone. However, Sult1e1 was markedly increased in expression in the NGN group as compared with the NVP-alone group. Preliminary in vitro experiments in our laboratory have demonstrated the rapid conversion of the 12-hydroxy NVP metabolite by Sult1e1 to the sulfate conjugate. The consequence to12-hydroxy NVP reactive metabolite pathways will be the subject of a future article.
Apoptotic histologic responses indicated that both galactosamine and NGN increased apoptosis over the first 48 hr after galactosamine administration and then subsided. Gene expression for Casp3 indicates that NVP may also influence expression of this gene (although apoptosis is not elevated histologically with NVP alone) and both NGN and NVP show low-level but sustained Casp3 gene expression elevation. Apoptosis results in the generation of ABs, which are subsequently cleared by phagocytosis. Several studies have shown that hepatic stellate cells have the ability to engulf ABs through phagocytosis, which can trigger a profibrogenic response (Zhan et al. 2006; Jiang et al. 2008). The unusual MALDI IMS tissue distribution of specific sphingomyelins suggests that increased ceramide formation may occur, which also contributes to apoptosis and that conversion of ceramide to Sgp may contribute to fibrosis (Takuwa et al. 2013). It has been shown that degradation of sphingomyelin results in the generation of ceramide and Sgp, important molecules in apoptosis and in the initiation of fibrosis (Takuwa et al. 2013). Interestingly, Sgpl1, a gene in the Sgp degradation pathway (Van Veldhoven and Mannaerts 1991), is upregulated by NVP alone and by NGN in a pattern similar to Casp3 expression and would serve the function of removing profibrogenic Sgp. Thus, the absence of cell damage and a source of sphingomyelin degradation in the NVP group may negate any effects of increased Casp3 as seen in the NGN group.
The number of myofibroblasts, histiocytes, or stellate cells was increased after 24 hr in the NGN group compared with the galactosamine-alone group. The decline in myofibroblasts, histiocytes, or stellate cells in the galactosamine-only group after the first 48 hr suggests that without the NVP stimulus (perhaps reactive metabolites) and other growth factors or chemokines driving the process, no fibrosis occurs. Other immune modifiers may be drivers for the fibrosis observed in the NGN group. Notably, pretreatment with NVP modified the inflammatory response, dampening the initial M1 inflammatory response to galactosamine presumably via upregulation of lipocalin 2 (Borkham-Kamphorst et al. 2013), which pushes macrophage polarization toward the M2 pathway and slightly elevates the apoptotic response. Lipocalin 2 is a soluble secreted protein that binds iron and is protective against hepatic inflammation. Recently, it has been shown to drive M2 polarization by modulating a feed-forward activation of the nuclear factor kappa-B-signal transducer and activator of transcription 3 loop. Other genes driving the transition to M2 responses include Cd74, its ligand Mif, and Sting (TMEM173). CD74, in addition to its role in MHC class II responses, is the receptor for Mif and a soluble truncated form of Cd74 has been found, which binds Mif and neutralizes its proinflammatory effects (Heinrichs et al. 2011). The ratio of CD74 to Mif is associated with the development of autoimmune hepatitis in humans (Assis et al. 2014). Similarly, Sting (TMEM173), a pattern recognition receptor that detects cytosolic nucleic acids, transmits signals that activate type I interferon responses and plays a role in apoptotic signaling by associating with type II MHC (Yi et al. 2013). Sting (TMEM173) was also upregulated in the first 24–48 hr after galactosamine. The anti-inflammatory response of the NGN treatment was reflected by both histopathologic evaluation showing reduced inflammation and the marked reduction in ALT at 24 hr when compared with galactosamine-alone dosing. Similar anti-inflammatory findings with progression of fibrosis have also been reported for another animal model of hepatic fibrosis produced in mice injected with Taenia crassiceps larvae (López-Navarrete et al. 2011). The consequences of the early M1 response followed by the late term M2 macrophage response point to the formation of reactive metabolites and antiviral signaling pathways in the generation of an immune-mediated fibrosis.
It is clear from our gene expression results that galactosamine alone initiates an antiviral response in the first 3–24 hr after dosing, partially via signaling involving viral sensors and RNA helicases (DEAD (Asp-Glu-Ala-Asp) Box Polypeptide [DDX60]) important for the production of type I interferon and other inflammatory cytokines but also by a variety of pattern recognition molecules. DDX60 is an uncharacterized DEXD/H box RNA helicase similar to Saccharomyces cerevisiae Ski2, a cofactor of RNA exosome, which is a protein complex required for the integrity of cytoplasmic RNA. Expression of DDX60 increases after viral infection, and the protein localizes at the cytoplasmic region binding to endogenous retinoic acid inducible gene I (RIG-I) protein. DDX60 is required for RIG-I-dependent type I interferon and interferon-inducible gene expression (Miyashita et al. 2011) in response to viral infection (including HCV infection) but as the time course gene expression shows, the interferon and TLR responses seen with both galactosamine and with the combined NGN treatment are transient. Other fibrosis-associated proteins, which respond to virus proteins like the HCV structural protein Ns5, were also upregulated by galactosamine but return to normal over 7 days, including Ns5atp9, which has a sustained elevation in the NGN treatment group. Recently, Ns5atp9 has been reported to have an antifibrotic function by suppressing activation of stellate cells (Zhang et al. 2015). Other pattern recognition responses such as the lectin and galectin responses, although transient when initiated by galactosamine alone, appear to be biphasic and more prolonged in the NGN group. The production of reactive NVP metabolites in proximity to proteins normally sequestered in nondamaged cells, but available as new epitopes in galactosamine-damaged hepatocytes, may alter the transient response seen with galactosamine alone. Late apoptotic cells expose internal membranes with heavily altered glycocalyx (Hesse 2010). This altered glycocalyx is the target for sugar-epitope-recognizing proteins such as lectins, collectins, and galectins. These bind to late apoptotic as well as to primary and secondary necrotic cells. Dectin-1 (Clec7a) is a small C-type lectin receptor for fungal cell wall beta-glucan (Kato, Adachi, and Ohno 2008) that interacts with TLR2. It is a marker for M2 macrophage polarization. Ligand binding to Clec7a/Dectin-1 initiates dendritic cell maturation, ligand uptake by endocytosis and phagocytosis, a respiratory burst, and the production of arachidonic acid metabolites, which trigger the release of multiple cytokines and chemokines. Clec7a may not bind the altered glycocalyx per se, but acting via TLR2, may modify the immune response to recognize as foreign: new molecules modified by NVP-reactive metabolites, immunoproteasomally processed (psmb9), and presented by antigen presenting cells.
“Foreignness” triggered by galactosamine is transient if damaged cells are not presenting new reactive metabolite-modified epitopes; however, if apoptosis is prolonged and daily NVP dosing is generating new reactive metabolites and protein adducts, the MHC response may change. Class II MHC gene expression responses (rt1-ba, rt1-Bb, rt1-da, and rt1-dba) appear to be transient (first 48 hr) with galactosamine alone, which skews the immune response toward Th1 responses. In the NGN group, MHC gene expression peaks earlier, at 3 hr, but remains slightly elevated throughout the production of fibrosis, perhaps driven by sustained Th2 responses. The 3-hr MHC peak could represent the initial M1 macrophage response to NVP metabolite-altered apoptotic epitopes, which as mentioned above is transformed by lipocalin to become M2 responses. The more sustained MHC response may represent the influx of macrophages and dendritic cells (mrc1 and cd163) sustaining antigen presentation in a periportal pattern, which we observed to match the histologic pattern of fibrosis observed in NGN-treated rats. Recent human studies demonstrated that polymorphisms in MHC class II alleles (e.g., major histocompatibility complex, class II, DR beta 1*01 and major histocompatibility complex, class II, DQ beta 1*05) were found to be associated with NVP-induced hepatic reactions. Furthermore, NVP adducts have been reported to bind to specific amino acids in albumin and hemoglobin, while 12-sulfoxyl-NVP has been shown to selectively bind to histidine and cysteine residues on human GSTpi (Caixas et al. 2012; Chen et al. 2008). Thus, the strong evidence in humans for interaction of reactive NVP metabolites with MHC class II proteins and a sustained M2 response appears to be reproduced under the conditions of our experiment in brown Norway rats.
Patterns seen with the MHC, lectin, and galectin gene expression responses were also present for CTGF, lox, postn, and collagen (col1a1 and col1a2). Just as lipocalin 2 seems to be the switch for M2 macrophage responses, postn may be the key to chronicity in fibrotic responses (Y. Huang et al. 2015). Postn is a secreted 90 kDa extracellular matrix (ECM) protein that can bind collagen type I and regulate collagen I fibrillogenesis (Horiuchi et al. 1999; Kudo 2011; Norris et al. 2007). Although postn has been shown to be produced by myofibroblasts in dermal wound healing (Elliott et al. 2012) and to promote fibrosis in idiopathic pulmonary fibrosis in the lung (Naik et al. 2012), it has only recently been shown to be expressed by activated stellate cells or myofibroblasts in the liver as well as liver fibroblasts in hepatosteatosis (Wu, Wu, and Ouyang 2014; Lu et al. 2014; Y. Huang et al. 2015). Postn, acting through bone morphogenetic protein-1-mediated proteolytic activation of lox on the ECM, promotes collagen cross-linking (Maruhashi et al. 2010) contributing to the maturation and insoluble nature of the collagen produced, leading to its retention and accretion. In addition to these key drivers of fibrosis, postn is associated with amplification and chronicity of allergic inflammation (Masuoka et al. 2012). This allergic chronicity for postn has been reported in the skin and a similar role has not yet been demonstrated for postn in the liver. In our study, however, NGN treatment-induced expression of postn closely paralleled mast cell protease expression (mcpt2, mcpt8, and Cpa3). These same mast cell proteases are all dysregulated by galactosamine treatment alone but subside after 48 hr, whereas NGN treatment prolongs and/or elevates their expression in the same biphasic pattern seen for postn and lox. Mast cells have long been associated with late progression of liver fibrosis (Armbrust et al. 1997). In this study, no effort was made to quantify the mast cells in portal areas and fibrous septae in fibrotic livers, but scattered mast cells were observed in portal areas from controls and all treatment groups with no obvious changes in mast cell numbers. The extent of mast cell degranulation may have been increased slightly in the galactosamine and NGN treatment groups (data not shown).
The other notable pathway that was altered by NVP alone and by NGN treatment was the retinol/retinoic acid metabolism pathway, which is a well-documented contributor to hepatic fibrosis (Lee and Jeong 2012). All-trans-retinoic acid (atRA), the active metabolite of vitamin A (retinol), is synthesized from retinol via retinaldehyde by alcohol and aldehyde dehydrogenases and eliminated by the CYP26 family (Napoli 2012). The enzymes of the CYP26 family form the hydroxylated metabolites 4-OH-atRA, 18-OH-atRA, and perhaps 16-OH-atRA (Topletz et al. 2015). CYP26A1, the predominant atRA hydroxylase in the adult human liver (Thatcher, Zelter, and Isoherranen 2010), is highly inducible by atRA via a retinoic acid receptor-mediated mechanism (Tay et al. 2010) leading to autoinduction of CYP26A1 by atRA. In our study, NVP alone increased expression of Cyp 26a1 as well as the aldehyde dehydrogenase, Aldh1a7, early in the time course and progressing out to 7 days. This implies that if autoinduction is involved, then the atRA was dysregulated during the progression to fibrosis. Another explanation is that the pronounced upregulation of Cyp26a1 by NVP alone could have led to depletion of atRA, allowing for progression of fibrosis once galactosamine damage further depleted retinoic acid stores. This response was heightened in the NGN group, possibly because there had been 7 days pretreatment with NVP before galactosamine was given, allowing for longer induction. A recent review of retinoic acid effects in liver fibrosis concluded that, at moderate doses, atRA was beneficial in reducing liver fibrosis (Zhou, Drummen, and Qin 2012). MALDI-IMS generated images at our 8-hr time point with a periportal distribution of retinaldehyde in an NGN-treated rat (data not shown), very much mimicking the distribution of type 2 macrophages that are associated with the locations of the bridging fibrosis. That being said, vitamin A fluorescence is known to be more concentrated in periportal regions than pericentral regions (Zou, Ekataksin, and Wake 1998) and thus this distribution may not in itself indicate a link to fibrosis.
In summary, we have produced a rat model of apparent immune-mediated hepatic fibrosis with a drug that is essentially nontoxic in standard rat toxicology testing but which is associated with progression of fibrosis in human patients. We hypothesize that the initial high dose of NVP, when given to naive animals, leads to shunting of 12-hydroxynevirapine into the sulfation pathway leading to methide imine adducts that bind with cytoplasmic proteins that are poorly antigenic in an immunologically quiescent liver. After galactosamine-induced damage, the liver expresses enhanced antigen presenting and processing in macrophages and dendritic cells. NVP-reactive metabolites presented bound to endogenous proteins in this environment may elicit an antiviral/antifungal fibrotic response driven by MRC1 and CD163 M2 macrophages that prolong stellate cell activation and produce bridging fibrosis through postn and lox upregulation. The initial high dose of NVP may simply provide a more extensive and prolonged source of protein-reactive metabolite-bound epitopes.
Footnotes
Acknowledgments
The authors wish to thank Beth Mahler at National Institute Environmental Health Sciences, Research Triangle Park, North Carolina and Jamie Fornek at Ingenuity Systems (a Qiagen company) for technical support during the preparation of this manuscript. We also wish to thank the laboratory animal services, necropsy, and clinical chemistry laboratories at GlaxoSmithKline, Research Triangle Park, North Carolina. Finally, we wish to thank Beth Romach for support during the completion of these experiments.
Author Contributions
Authors contributed to conception or design (HB, SC, KM, LA, VS, DB, RM); data acquisition, analysis, or interpretation (HB, SC, RG, CE, KM, LY, LG, DK, NC, LA, TT, SF, VS, RM); drafting the manuscript (HB, SC, RG, LY, LG, DK, VS, RM). All authors critically revised the manuscript, gave the final approval, and agreed to be accountable for all aspects of work in ensuring that questions relating to the accuracy or integrity of any part of the work are appropriately investigated and resolved.
Declaration of Conflicting Interests
The author(s) declared no potential conflicts of interest with respect to the research, authorship, and/or publication of this article.
Funding
The author(s) received no financial support for the research, authorship, and/or publication of this article.