
Abstract
Intrduction:
Rapamycin is an mTOR inhibitor and a prominent inducer of autophagy in cancer cells and tumor interstitial cells. Macrophages are the primary type of immune cells observed in the tumor microenvironment and serve varying roles in the progression of cancer by polarizing into distinct phenotypes. However, whether rapamycin-induced macrophage autophagy influences bladder cancer remains unclear.
Methods:
THP-1 cells were successfully polarized into M1 or M2 macrophages, which were identified by detecting CD86 (M1) or CD206 (M2) expressions using flow cytometry and measuring M1/M2-related mRNA expressions using reverse transcription-quantitative PCR. Rapamycin was employed for inducing autophagy, and then the influences of enhanced autophagic M1 and M2 macrophages on migration and invasion of bladder cancer cells were confirmed by wound healing and Transwell assay in the co-culture model. Furthermore, the gene and protein expressions of IL-10 and the underlying role are still unclear.
Results:
Rapamycin significantly increased autophagy levels in M1 and M2 macrophages, while only autophagy-enhanced M2 macrophages facilitated the migration and invasion of bladder cancer cells. Furthermore, rapamycin increased IL-10 secretion from M2 macrophages, which mediated the effects of M2 macrophages on migration and invasion of bladder cancer.
Conclusion:
Rapamycin induces M2 macrophage autophagy and promotes the migration and invasion of bladder cancer by increasing IL-10 secretion, suggesting that M2 macrophage autophagy is an underlying target of rapamycin in treating bladder cancer.
Introduction
Bladder cancer is a commonly observed malignant tumor of the urinary system, the incidence of which is second to that of prostate cancer. 1 In patients with muscle-invasive bladder cancer (MIBC), there is a significant risk of recurrence and metastasis, which is difficult to control, and thus forms an important characteristic of bladder cancer. The 5-year recurrence rate is 30%–70% based on the different pathological stages, and 10–25% of patients develop distant metastases. 2 The 5-year survival rate of patients with metastasis is <10%, and the median survival time is only 14 months. 3 However, progress in the development of treatments for patients with bladder cancer has been very slow in the past 30 years, and platinum-based systemic chemotherapy is still the primary treatment used for patients with advanced and metastatic bladder cancer. 4 Although PD-1(Programmed Death 1)/PD-L1 (Programmed Death-Ligand 1) inhibitors exhibit some improvements in survival prognosis of bladder cancer patients, the response rate to these drugs is still <25%. 5 In addition, the application of molecular targeted therapies in bladder cancer requires further study. The occurrence of bladder cancer is closely associated with the high mutational rate. Studies have shown that >40% of gene mutations are associated with members of the mTOR signaling pathway,6,7 which suggests that the mTOR pathway serves an important role in the occurrence and development of bladder cancer. Preclinical studies in vivo and in vitro have demonstrated that while mTOR inhibitors exhibit a negative effect on bladder cancer cells,8,9 these inhibitors do not prolong survival in patients. 10
The tumor microenvironment may be one of the factors that influences the failure of translation from the bench side to the bed. Macrophages are important immune cells present in the tumor microenvironment, and they serve a key role in regulating inflammation and tumorigenesis. M1 and M2 macrophages, which are the two primary phenotypes of macrophages, inhibit and promote the progression of cancer, respectively. M1 or M2 macrophages are influenced by mTOR inhibitors administration in addition to cancer cells, when used as a therapeutic. However, whether rapamycin regulates the activity of M1 and M2 macrophages, thus in-turn affecting bladder cancer cells, and the nature of the underlying mechanism remain to be determined. The present study investigated the effects of rapamycin-induced M1 and M2 macrophage autophagy on the migratory and invasive capacity of bladder cancer cells and the underlying molecular mechanism, providing a basis for the use of mTOR inhibitors to treat bladder cancer. Additionally, the present results may have important theoretical implications and clinical significance.
Materials and methods
Materials
Rapamycin, three-methyladenine (3-MA), lipopolysaccharide (LPS), penicillin, streptomycin, and Fetal Bovine Serum (FBS) were obtained from sigma (St. Louis., MO, US). IL-4 was purchased from R&D (Minneapolis, MN, US). Lysis buffer radioimmunoprecipitation assay (RIPA), phenylmethanesulfonyl fluoride (PMSF), and bicinchoninic acid (BCA) protein assay kit were obtained from Beyotime Institute of Biotechnology (Shanghai, China). Trizol reagent and cDNA reverse transcription kit were purchased from Invitrogen (Carlsbad, CA, US). The following antibodies were purchased: anti-LC3 antibody from Cell Signaling Technology (Danvers, MA, US), β-actin antibody from Bioworld Technology (Louis, MN, US), and CD206-APC and CD86− APC for flow cytometry from BD Biosciences (San Jose, CA, US). Alexa Fluor 488 conjugated goat anti-rabbit IgG second antibodies and Alexa Fluor 594 conjugated goat anti-rat IgG second antibodies from Thermo Scientific (Hudson, NH, US).
Cell culture and macrophage polarization
Human monocyte THP-1 cells were cultured in RPMI-1640 medium containing 10% FBS, 100 U/ml penicillin, and 100 U/ml streptomycin in humidified incubator with 5% CO2 at 37°C. Subsequently, THP-1 cells were treated with 10 ng/mL PMA for 72 h to stimulate differentiation into macrophages (M0). Treatment with 100 ng/mL LPS or 20 ng/mL IL-4 for 24 h was used to promote differentiation of M0 macrophages to M1 or M2 macrophages. M1 and M2 macrophages were treated with rapamycin (100 nM) or 3-MA (2 mM) to induce and inhibit autophagy for 24 h.
Identification of M1 and M2 macrophages
The differentiation into M1 or M2 macrophages was identified as follows: M1 macrophages were identified by detecting CD86 expression using flow cytometry and measuring M1-related mRNA expression of TNF-α, iNOS, IL-1β, and IL-6 by reverse transcription-quantitative PCR. M2 macrophages were identified by detecting CD206 expression using flow cytometry and measuring M2-related mRNA expression of Arg-1, IL-10, VEGF, and MGL-1.
Flow cytometry analysis
M1 and M2 macrophages were digested with trypsin and washed twice with PBS. The cells were incubated with CD68-phycoerythrin (PE) and CD206-allophycocyanin (APC) or CD68-PE and CD86-APC (dependent on the type of macrophage being detected) at 4°C for 1 h. The cells were washed with PBS and analyzed using a flow cytometer.
Immunofluorescence assay
Tissues were fixed and embedded. The sections were deparaffinized, rehydrated, and blocked. The cell slides were fixed with paraformaldehyde. Subsequently, both tissue and cell slides were incubated with anti-CD86, anti-CD206, and anti-LC3 primary antibodies overnight at 4°C. After washing, the sections were incubated with fluorescent secondary antibodies for 1 h at room temperature. Finally, the specimens were stained with DAPI to visualize the nuclei. Images were taken under a fluorescent microscope or laser scanning confocal microscope.
Immunohistochemical staining
Tissues were fixed and embedded. The sections were deparaffinized, rehydrated, and blocked. After incubation with primary antibodies, a horseradish peroxidase-conjugated secondary antibody was added to the slides and incubated with a streptavidin-biotin complex (SABC) solution according to the manufacturer’s protocol. The sections were observed under a light microscope.
Western blotting
Equal quantities of protein from M1 and M2 macrophages were loaded on a 15% gel, resolved using SDS-PAGE, and transferred to a PVDF membrane. After blocking, the membranes were incubated with anti-LC3 antibody overnight at 4°C. Subsequently, membranes were washed, and secondary antibody was added to the membranes for 1h at room temperature. Finally, the bands were visualized using an enhanced chemiluminescence detection kit. Images were captured using a Fusion Chemical Imaging System.
Quantitative reverse transcription PCR (RT-qPCR)
Total RNA was isolated from M1 or M2 macrophages using TRIzol® reagent, and reverse transcription was performed using a Takara cDNA reverse transcription kit according to the manufacturer’s protocol (Takara Bio, Inc.). PCR was performed using SYBR Green real-time PCR Master Mix in a Light Cycler 480 Real-Time PCR system. Relative gene expression was calculated using the 2−ΔΔCq method. Samples were normalized to GAPDH, which was used as the endogenous control. The design and synthesis of the primers were completed by company (Sangon Biotech, Shanghai). The sequences of the primers were as follows: TNF-α forward, 5′-CCCTCACACTCAGATCATCTTCT-3′ and reverse, 5′-GCTACGACGTGGGCTACAG-3′; IL-1β forward, 5′-GCAACTGTTCCTGAACTCAACT-3′ and reverse, 5′-ATCTTTTGGGGTCCGTCAACT-3′; Il-6 forward, 5′-CACATGTTCTCTGGGAAATCGTGGA-3′ and reverse, 5′- TCTCTCTGAAGGACTCTGGCTTTGT-3′; iNOS forward, 5′-GTTCTCAGCCCAACAATACAAGA-3′ and reverse, 5′-GTGGACGGGTCGATGTCAC-3′; Arg-1 forward, 5′-CTCCAAGCCAAAGTCCTTAGAG-3′ and reverse, 5′-AGGAGCTGTCATTAGGGACA-3′; Il-10 forward, 5′-GCTCTTACTGACTGGCATGAG-3′ and reverse, 5′-CGCAGCTCTAGGAGCATGTG-3′; MGL-1 forward, 5′-TGAGAAAGGCTTTAAGAACTGGG-3′ and reverse, 5′-GACCACCTGTAGTGATGTGGG-3′; VEGF forward, 5′-GCAGAATCATCACGAAGTGG-3′ and reverse, 5′-ATCAGGGGCACACAGGAT-3′; MMP2 forward, 5′- TGATCTTGACCAGAATACCATCGA-3′ and reverse, 5′- GGCTTGCGAGGGAAGAAGTT-3′; MMP9 forward, 5′- CCTGGAGACCTGAGAACCAATC-3′ and reverse, 5′- CCACCCGAGTGTAACCATAGC-3′; and GAPDH forward, 5′-AGGTCGGTGTGAACGGATTTG-3′ and reverse, 5′-TGTAGACCATGTAGTTGAGGTCA-3′.
Cytokine detection
M2 macrophages were treated with or without rapamycin, and the cell culture supernatants were collected. The levels of M2-related cytokines, such as TGF-β, VEGF, IL-10, Arg-1, MMP2, and MMP9, were detected using enzyme linked immunosorbent assay (ELISA) kits according to the manufacturer’s protocol.
Tissue sample collection
A total of 20 paired bladder cancer specimens and matched adjacent tissues were collected during radical cystectomy surgery at the Department of Urology of The First Affiliated Hospital of Bengbu Medical College between January 2019 and December 2019. There were 17 males and 3 females, with ages ranging from 43–78 years old (mean age, 63.6 ± 8.42 years). All patients had no history of autoimmune diseases and had not received chemotherapy or radiotherapy prior to surgery. The protocol used in the present study was approved by The Ethics Committee of Bengbu Medical College (approval no. 2017-008), and written informed consent was obtained from the patients or their guardians.
Electron microscopy
Treated M1 or M2 macrophages were collected by centrifugation and fixed using 2.5% glutaraldehyde. Subsequently, the cells were sent to the electron microscopy department at Shanghai Jiaotong University School of Medicine for further treatment and observation of autophagosomes.
Coculture model of M1/M2 macrophages with bladder cancer cells
M1 or M2 macrophages were seeded in the lower chambers of a Transwell insert with a semipermeable membrane (pore size, 0.4 μm). After M1 or M2 macrophages had adhered to the wells, T24 human bladder cancer cells were cultured in the upper chamber.
Wound healing assay
Longitudinal scratch wounds were created in T24 cells with a sterile 10 μL pipette tip 48 h after coculture with M1/M2 macrophages, and the cells were cultured in serum-free medium after washing. Typical wound healing images were observed and captured at 0 and 24 h under a light microscope.
Transwell assay
After 48 h of coculture with M1/M2 macrophages, T24 cells were seeded into the upper chambers of Transwell inserts with or without Matrigel coating for the invasion assay or migration assay, respectively. The bottom chamber was filled with 800 μL media supplemented with 10% FBS. After 24 h, migrating/invading cells underneath the chamber were fixed with 4% polyoxymethylene for 5 min, and stained with 0.1% crystal violet solution for 10 min at room temperature. The cells were counted in five randomly selected fields under a light microscope.
Statistical analysis
The data are presented as the mean ± standard deviation. Data were analyzed using a Student’s t-test. All analyses were performed using SPSS version 22.0 (IBM, Corp.). p < 0.05 was considered to indicate a statistically significant difference.
Results
Stimulation of THP-1 cells to differentiate and polarize into M1 and M2 macrophages. THP-1 cells were induced to differentiate into M1 and M2 macrophages for further study. As shown in Figure 1(a), the growth of cells changed from suspended to adherent after stimulation with Phorbol-12-myristate-13-acetate (PMA), while the cell morphology also changed from round to irregular with the presence of pseudopods observed. In addition, the macrophage marker CD68 was expressed in almost all cells (99.24% ± 0.16%; Figure 1(b)), which demonstrated that the THP-1 cells differentiated into macrophages (M0). Furthermore, LPS or IL-4 was used to polarize M0 cells into M1 or M2 macrophages, respectively. The presence of pseudopods was significantly increased and elongated following stimulation by LPS; however, the cell morphological changes were not obvious after IL-4 stimulation (Figure 1(a)). Flow cytometry analysis showed that 90.12%±3.32% of LPS-stimulated cells were CD68+CD86+ cells, and CD68+CD206+ cells accounted for 57.44%±6.58% after IL-4 stimulation (Figure 1(b)). These results demonstrate that LPS or IL-4 promoted M0 polarization to M1 or M2 macrophages, respectively. To confirm the flow cytometry data, immunofluorescence staining and RT-qPCR were utilized to identify M1 or M2 polarization using CD86 or CD206 and related markers. The results showed that CD86 expression was significantly increased in M1 macrophages and that CD206 expression was notably increased in M2 macrophages (Figure 1(c)). Gene expression of M1-related mediators, such as TNF-α, iNOS, IL-1β, and IL-6, was increased after LPS stimulation. Gene expression of M2-related markers, including IL-10, VEGF, and MGL-1, was increased (Figure 1(d)). Taken together, these results suggest that THP-1 cells were stimulated successfully to differentiate and polarize into M1 or M2 macrophages. Successful induction of M1 and M2 macrophages. (a) Kinetic changes in cell morphology during THP-1 cell differentiation into macrophages (M0) and polarization to M1 and M2 macrophages. Scale bar, 50 μm. (b) Expression of the M0, M1, and M2 markers CD68, CD86, and CD206, respectively, were examined by flow cytometry to determine successful polarization. (c) Immunofluorescence staining was utilized to detect CD86 and CD206 expression in M1 and M2 macrophages, respectively. Scale bar, 20 μm. Expression of (d) M1- and (e) M2-related cytokines was detected using RT-qPCR. RT-qPCR, reverse transcription-quantitative PCR.
Rapamycin-induced M2 but not M1 macrophage autophagy promotes the migration and invasion of bladder cancer cells. To determine the effect of rapamycin on M1/M2 macrophage autophagy, several common methods were used to examine autophagy levels. Electron microscopy was used to monitor the number of autophagic lysosomes. As shown in Figure 2(a), there were a significantly increased number of autolysosomes observed in the rapamycin-treated M1 and M2 macrophages. To further confirm that rapamycin induced autophagy, Western blotting and immunofluorescence were used to measure the protein expression levels of LC3, a marker of autophagy. The results showed that LC3 expression was increased following rapamycin treatment in both M1 (Figure 2(b)) and M2 (Figure 2(c)) macrophages. Furthermore, 3-MA, a specific inhibitor of autophagy, significantly decreased LC3 expression in the two types of macrophages (Figure 2(d)). Effects of rapamycin-induced M1 and M2 macrophage autophagy on the migration and invasion of bladder cancer cells. (a) Electron microscopy was utilized to observe autophagosomes in M1 and M2 macrophages with or without rapamycin treatment. Scale bar, 1 μm. (b and c) Protein expression levels of the autophagy marker LC3 were detected in (b) M1 and (c) M2 macrophages treated with rapamycin or 3-MA. Untreated M1 or M2 macrophages were used as the control. (d) Immunofluorescence staining and confocal microscopy were used to confirm the effects of rapamycin or 3-MA on LC3 expression in M1 and M2 macrophages, with untreated M1 or M2 macrophages used as the control. Scale bar, 10 μm. (e and f) A wound healing assay was performed to observe the migration of bladder cancer cells after coculture with rapamycin-treated (e) M1 and (f) M2 macrophages treated with or without 3-MA, and untreated M1 or M2 macrophages were used as the control. Scale bar, 200 μm. Transwell (g) migration assay and (h) Matrigel invasion assays were performed to examine the migratory and invasive capacities of bladder cancer cells after coculture with rapamycin-treated M1 and M2 macrophages with or without 3-MA. Untreated M1 or M2 macrophages were used as the control. Scale bar, 50 μm. Rap: rapamycin-treated cells; Con: untreated control cells; 3-MA: three-methyladenine.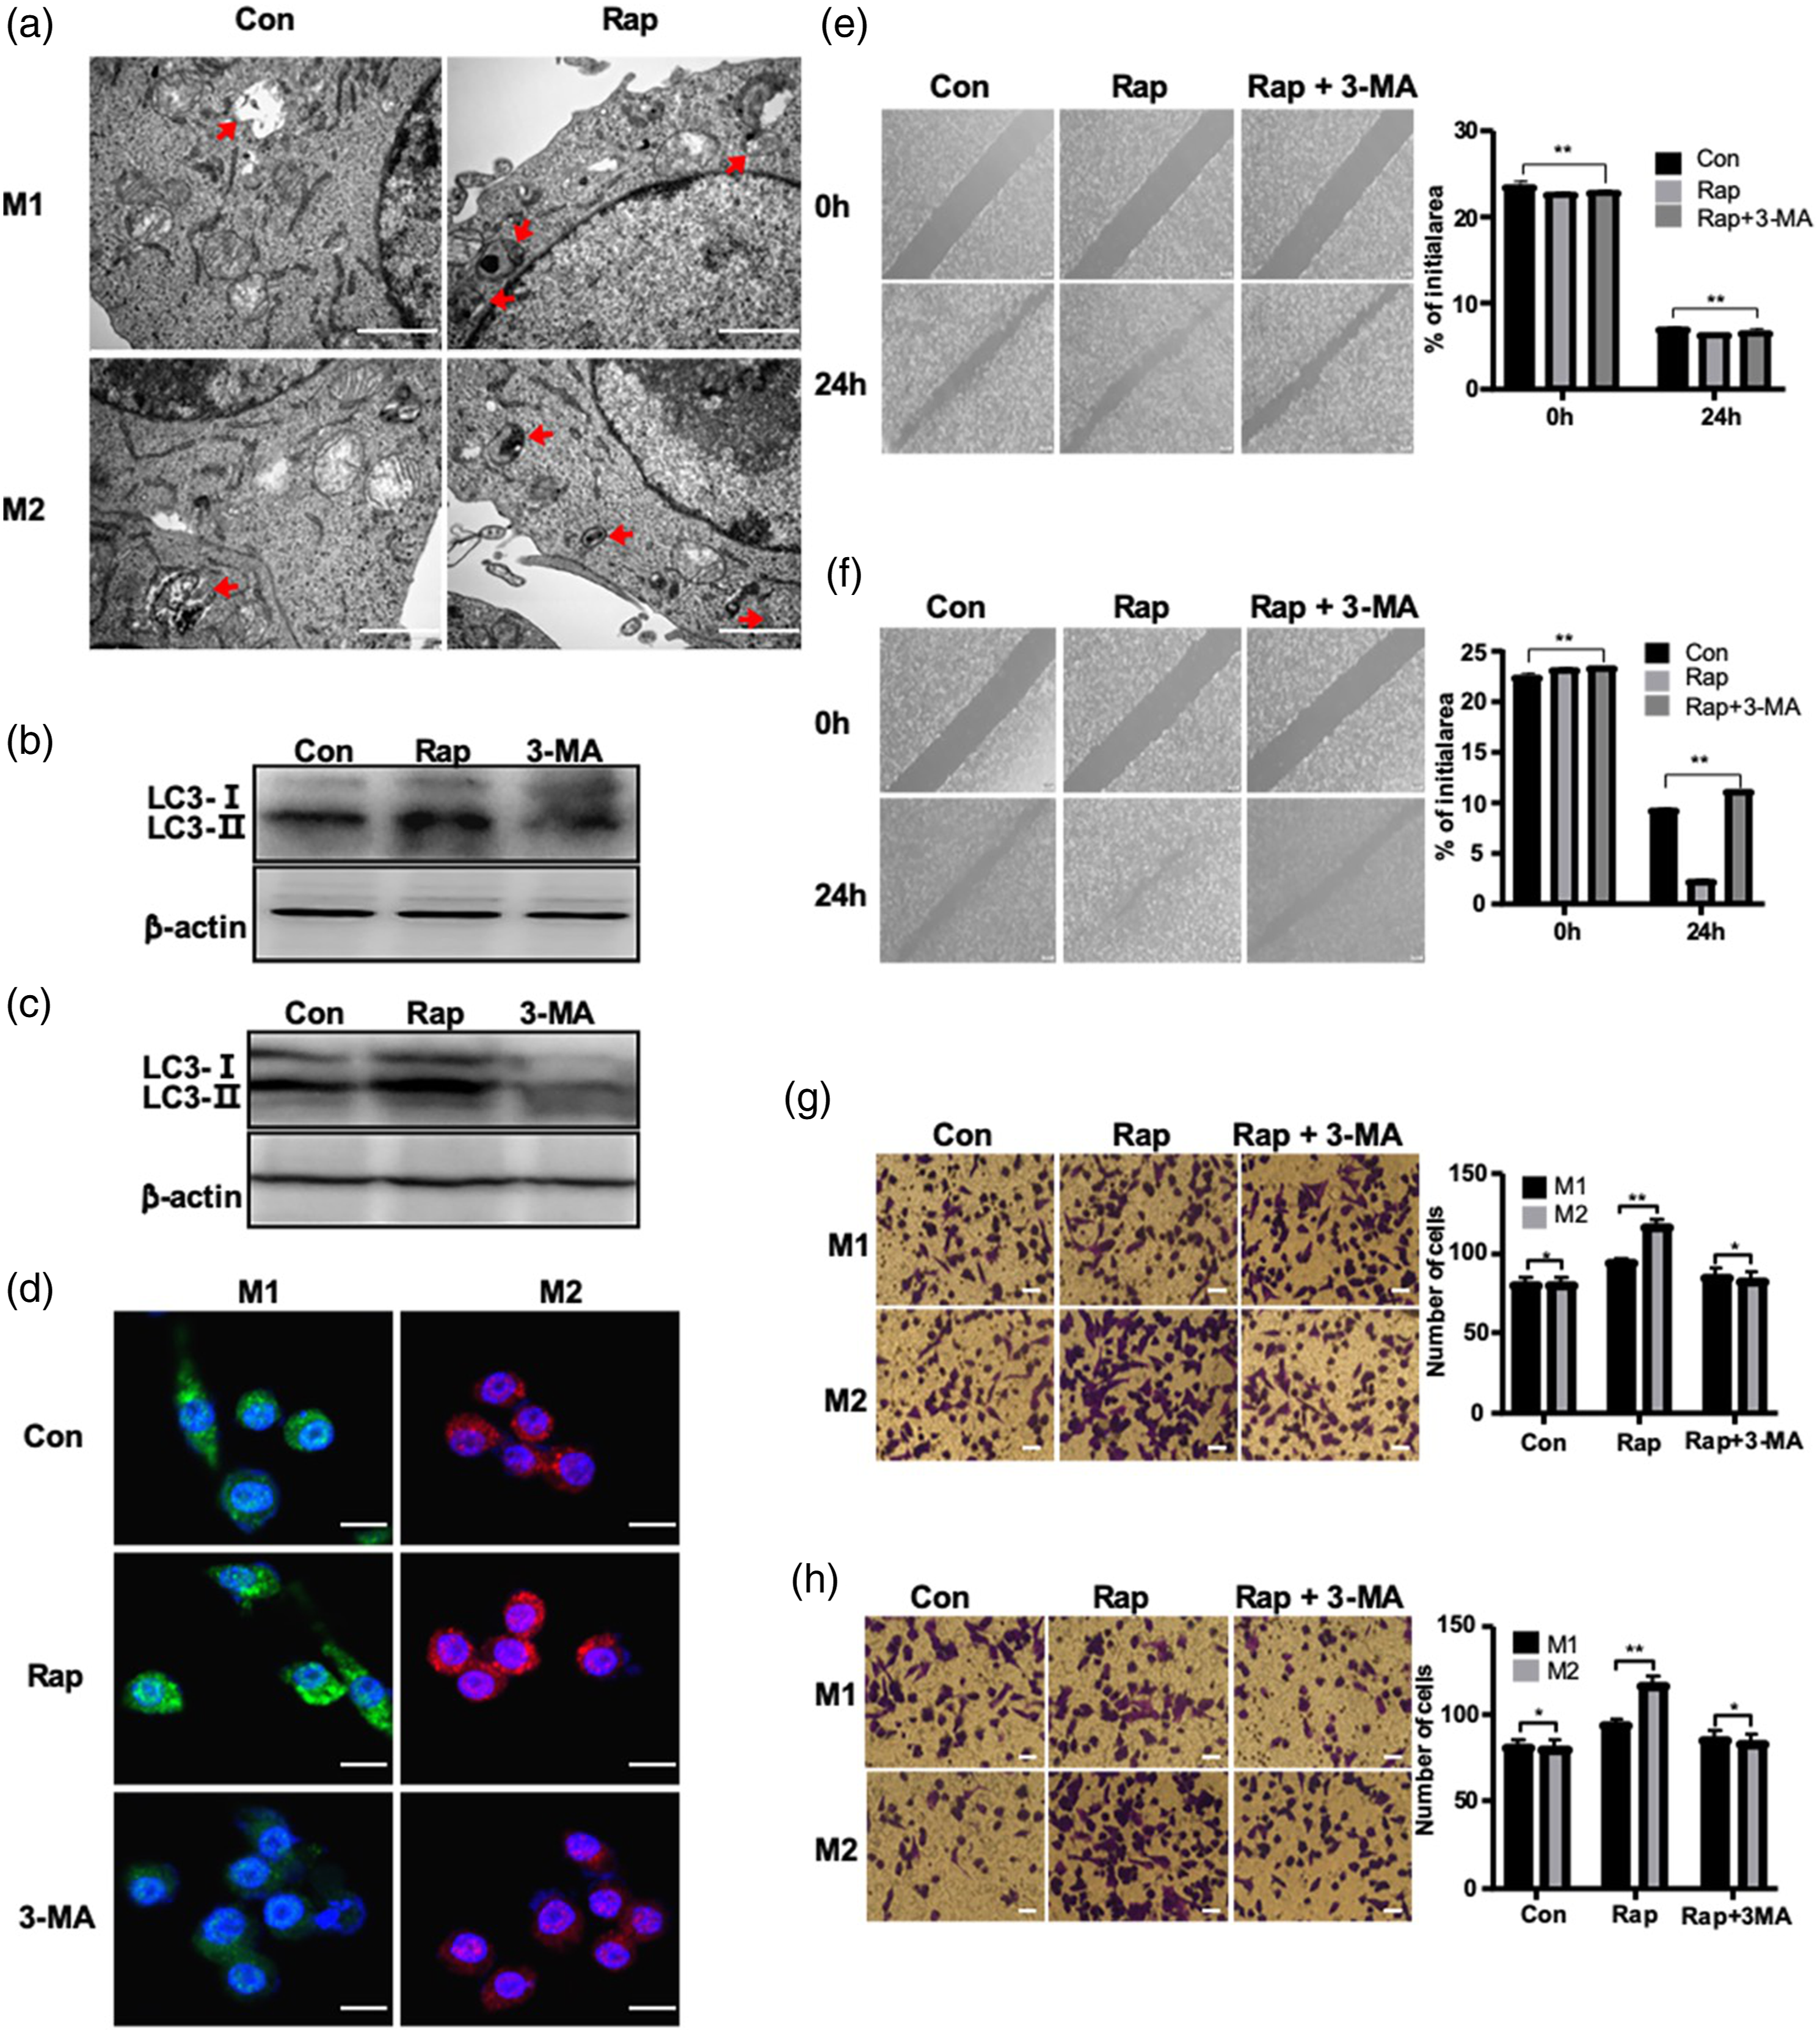
To determine whether autophagy-enhanced M1/M2 macrophages promoted the migration and invasion of bladder cancer cells, rapamycin-treated M1/M2 macrophages were cocultured with T24 bladder cancer cells, and then the migration and invasion of T24 cells were assessed using wound healing and Transwell assays. Rapamycin-treated M1 macrophages did not increase the migration of T24 cells (Figure 2(e) and (g) upper row); whereas rapamycin-treated M2 macrophages significantly increased the migration of T24 cells. Rapamycin-mediated mTOR pathway inhibition not only induced cells to undergo autophagy but also affected cell proliferation and metabolism through signaling cascades. Therefore, whether rapamycin-treated M2 macrophages enhanced T24 migration in the presence of 3-MA was further confirmed. Three-methyladenine blocked the effects of rapamycin on M2 macrophages, which suggests that rapamycin-enhanced M2 macrophage autophagy promoted the migration of T24 cells (Figure 2(f) and (g) lower row). Similarly, M2 but not M1 macrophages enhanced the invasion of T24 cells by rapamycin-induced autophagy (Figure 2(h)).
Rapamycin-treated M2 macrophages promote the migration and invasion of T24 cells by increasing IL-10 secretion. To elucidate the mechanism by which rapamycin-treated M2 macrophages influence T24 cells, the gene expression levels of M2-related mediators and protein levels in the cell culture supernatant were determined using RT-qPCR and ELISA, respectively. As shown in Figure 3(a) and (b), rapamycin significantly increased the gene expression and secretion of IL-10 in M2 macrophages, suggesting that IL-10 is a critical mediator of the effects of M2 macrophages on T24 cells. It was shown that IL-10 promoted the migration of T24 bladder cancer cells by adding recombinant human IL-10 to the T24 cell culture medium, and the influence of recombinant IL-10 on T24 was similar to that of rapamycin-treated M2 macrophages. However, the effect of M2 macrophages was inhibited by adding an IL-10 neutralizing antibody into a coculture model of rapamycin-treated M2 macrophages and T24 cells (Figure 3(c)). Furthermore, IL-10 increased the invasion of T24 cells, and an IL-10 neutralizing antibody blocked M2 macrophage-mediated promotion of T24 cell invasion (Figure 3(d)). Taken together, these results showed that rapamycin enhanced autophagy in M2 macrophages, promoting the migration and invasion of bladder cancer cells by IL-10 secretion. Rapamycin-treated M2 macrophages promote migration and invasion by increasing IL-10 secretion. (a) RT-qPCR was performed to examine the gene expression of several mediators in M2 macrophages with or without rapamycin treatment. (b) ELISA was performed to detect the protein expression levels of cytokines in the cell culture supernatant of M2 macrophages with or without rapamycin treatment. (c) A wound healing assay was performed to observe the migration of bladder cancer cells after coculture with M2 rapamycin-treated macrophages that were treated with or without an IL-10 neutralizing antibody, and untreated M2 macrophages were used as the control. Scale bar, 200 μm. (d) Transwell assays were used to examine the invasive capacity of bladder cancer cells after coculture with rapamycin-treated M2 macrophages treated with or without an IL-10 neutralizing antibody. Untreated M2 macrophages were used as the control. Scale bar, 50 μm. Rap, rapamycin-treated cells; Con, untreated control cells; RT-qPCR, reverse transcription-quantitative PCR.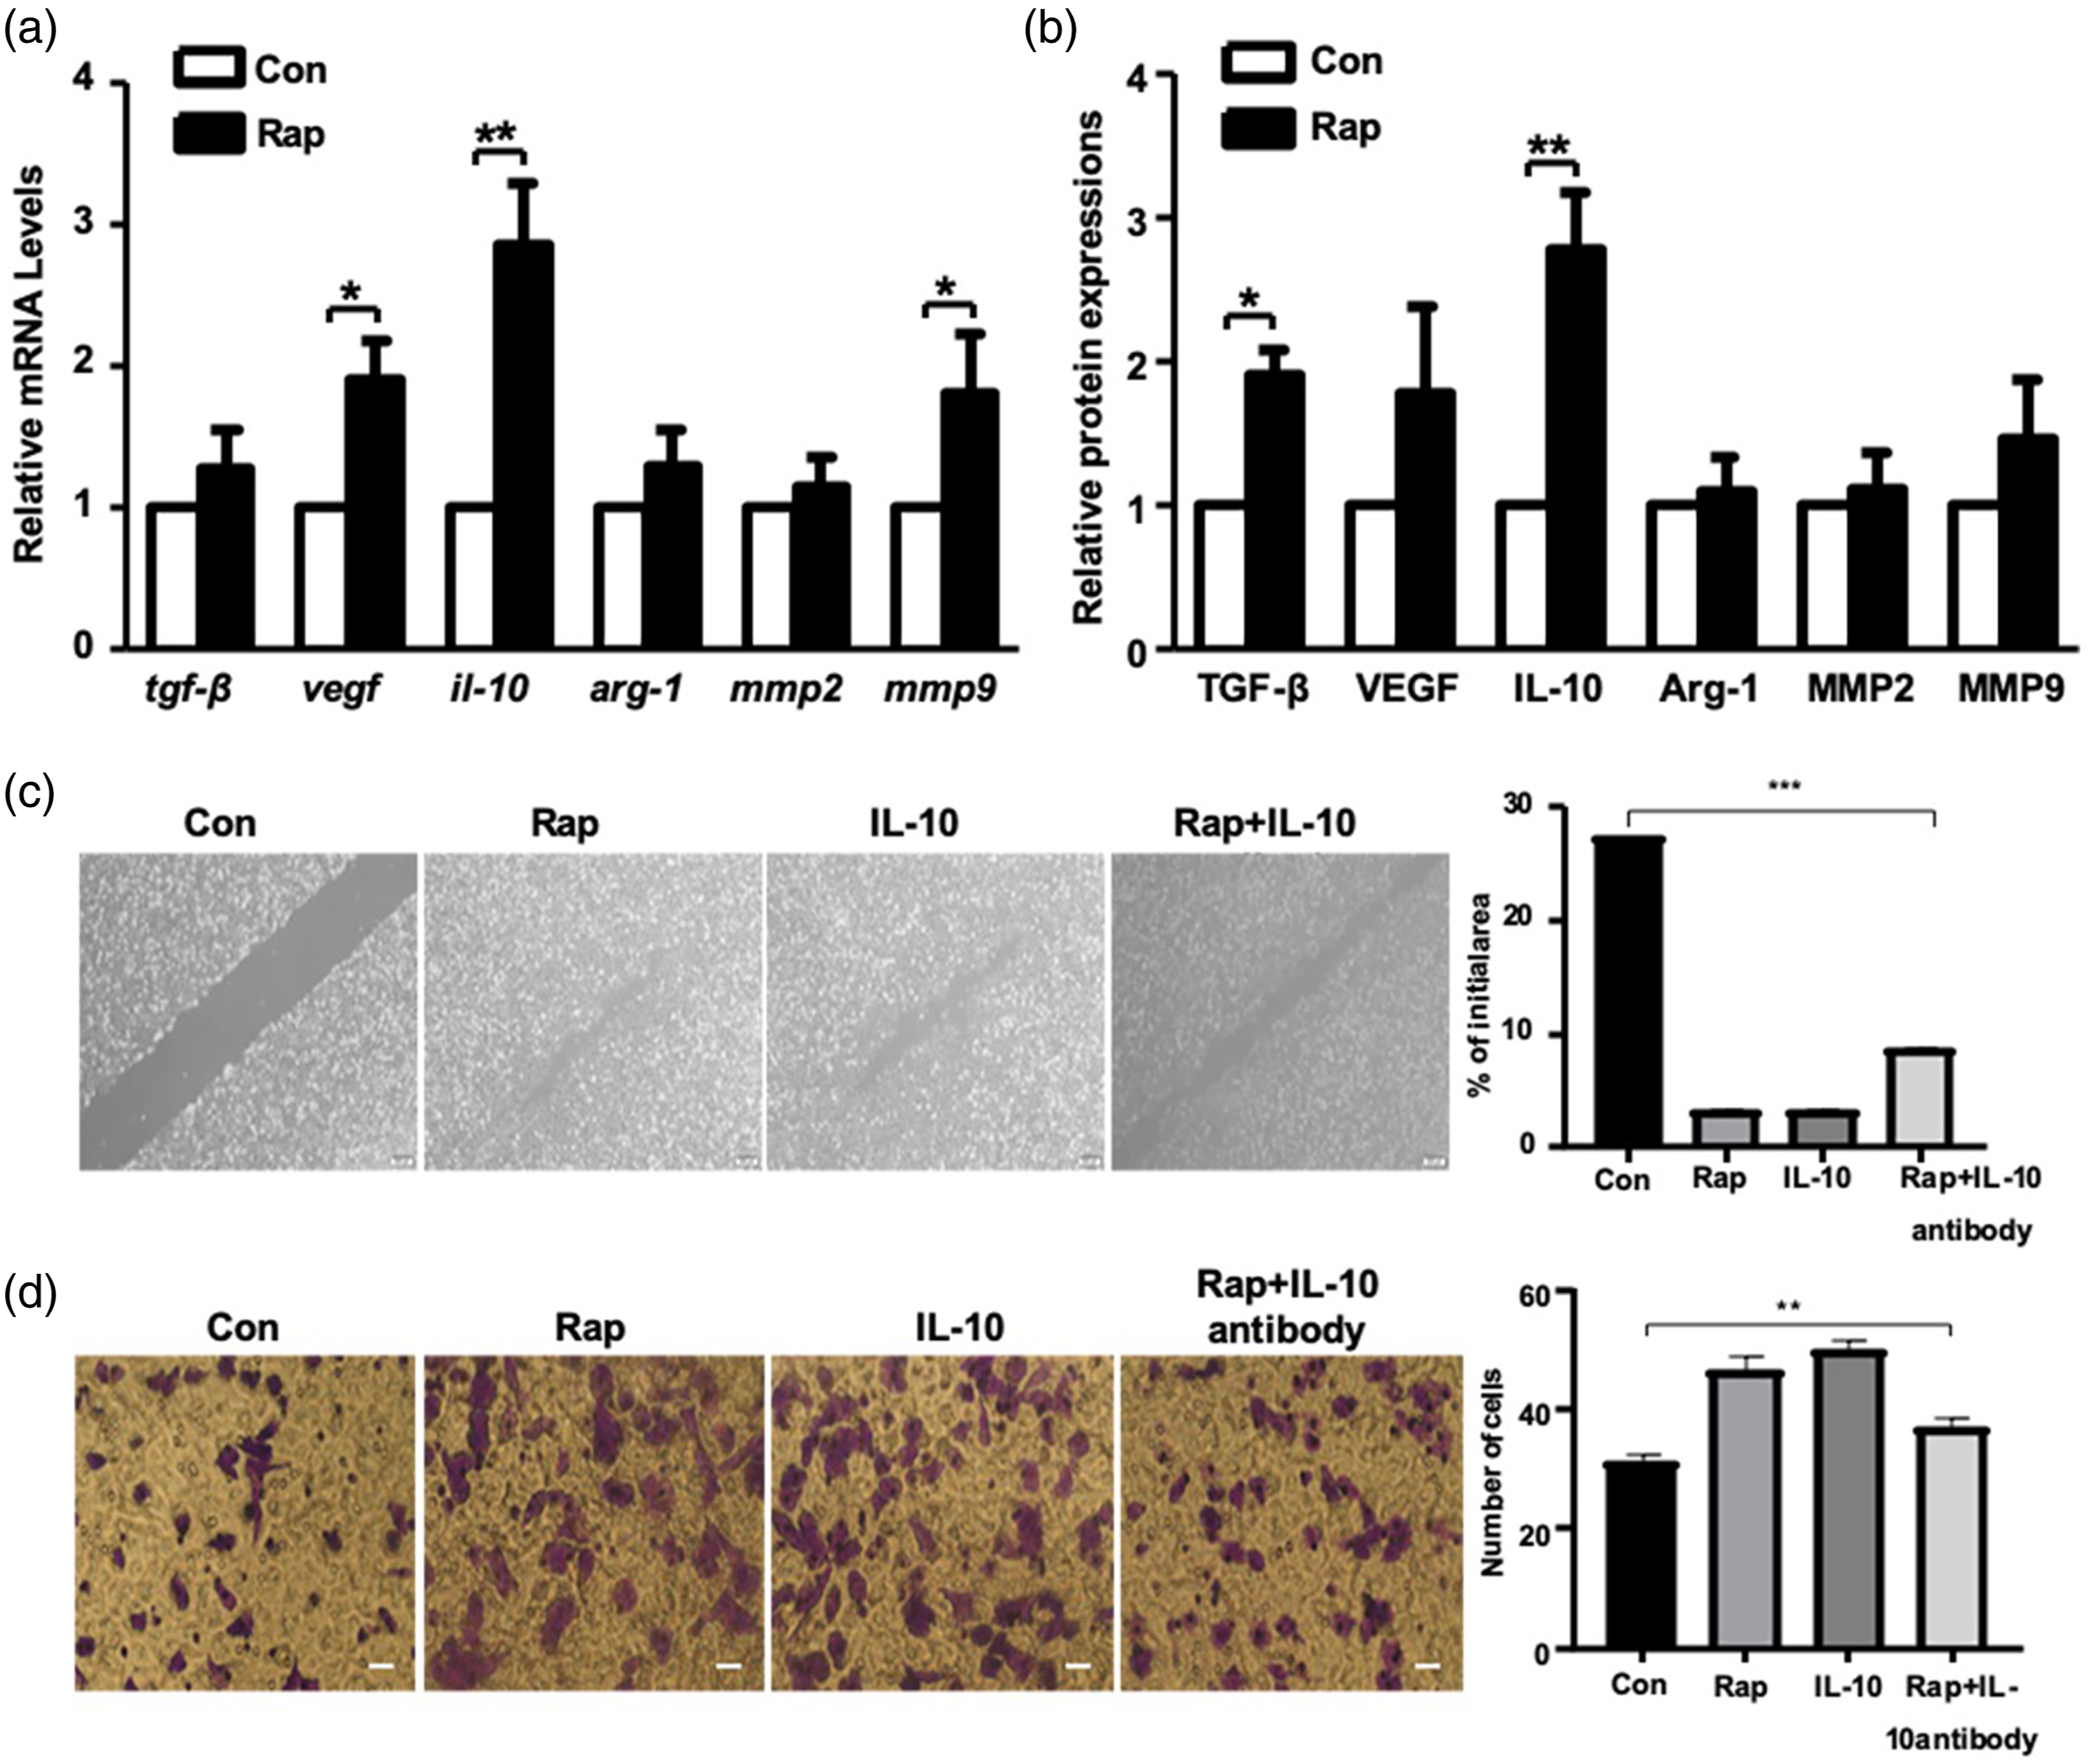
Expression of M1/M2 macrophage and autophagy markers in bladder cancer and adjacent paracancerous tissues. The expression of the M1 macrophage marker CD86 and M2 macrophage marker CD206 in bladder cancer and paracancerous tissues was determined. The results showed low expression of both CD86 and CD206 in paracancerous tissues; there was no obvious CD86 expression in bladder cancer tissues, but the expression of CD206 was significantly increased in bladder cancer tissues compared with that of the paracancerous tissues (Figure 4(a)). Furthermore, immunofluorescence staining was used to detect LC3 expression in bladder cancer and paracancerous tissues. The results showed that LC3 expression was significantly increased in bladder cancer tissues compared with that of the paracancerous tissues, suggesting that autophagy is increased in bladder cancer tissues. Furthermore, the majority of the autophagic cells were CD206-positive cells (Figure 4(b)), indicating that M2 macrophages accounted for the majority of cells undergoing autophagy in bladder cancer tissues. These data suggest that the presence of M2 macrophages is increased in bladder cancer tissues, and they exhibited enhanced autophagic activity in these tissues. Expression of M1/M2 macrophage and autophagy markers in bladder cancer and adjacent paracancerous tissues. (a) Immunohistochemical staining was utilized to examine the expression of the M1 macrophage marker CD86 and the M2 macrophage marker CD206 in BC and PC tissues. (b) Expression of the M2 macrophage marker CD206 (red) and the autophagy marker LC3 (green) in BC and PC tissues was visualized by multiple immunofluorescence staining. Scale bar, 100 μm. BC: bladder cancer, PC: paracancerous.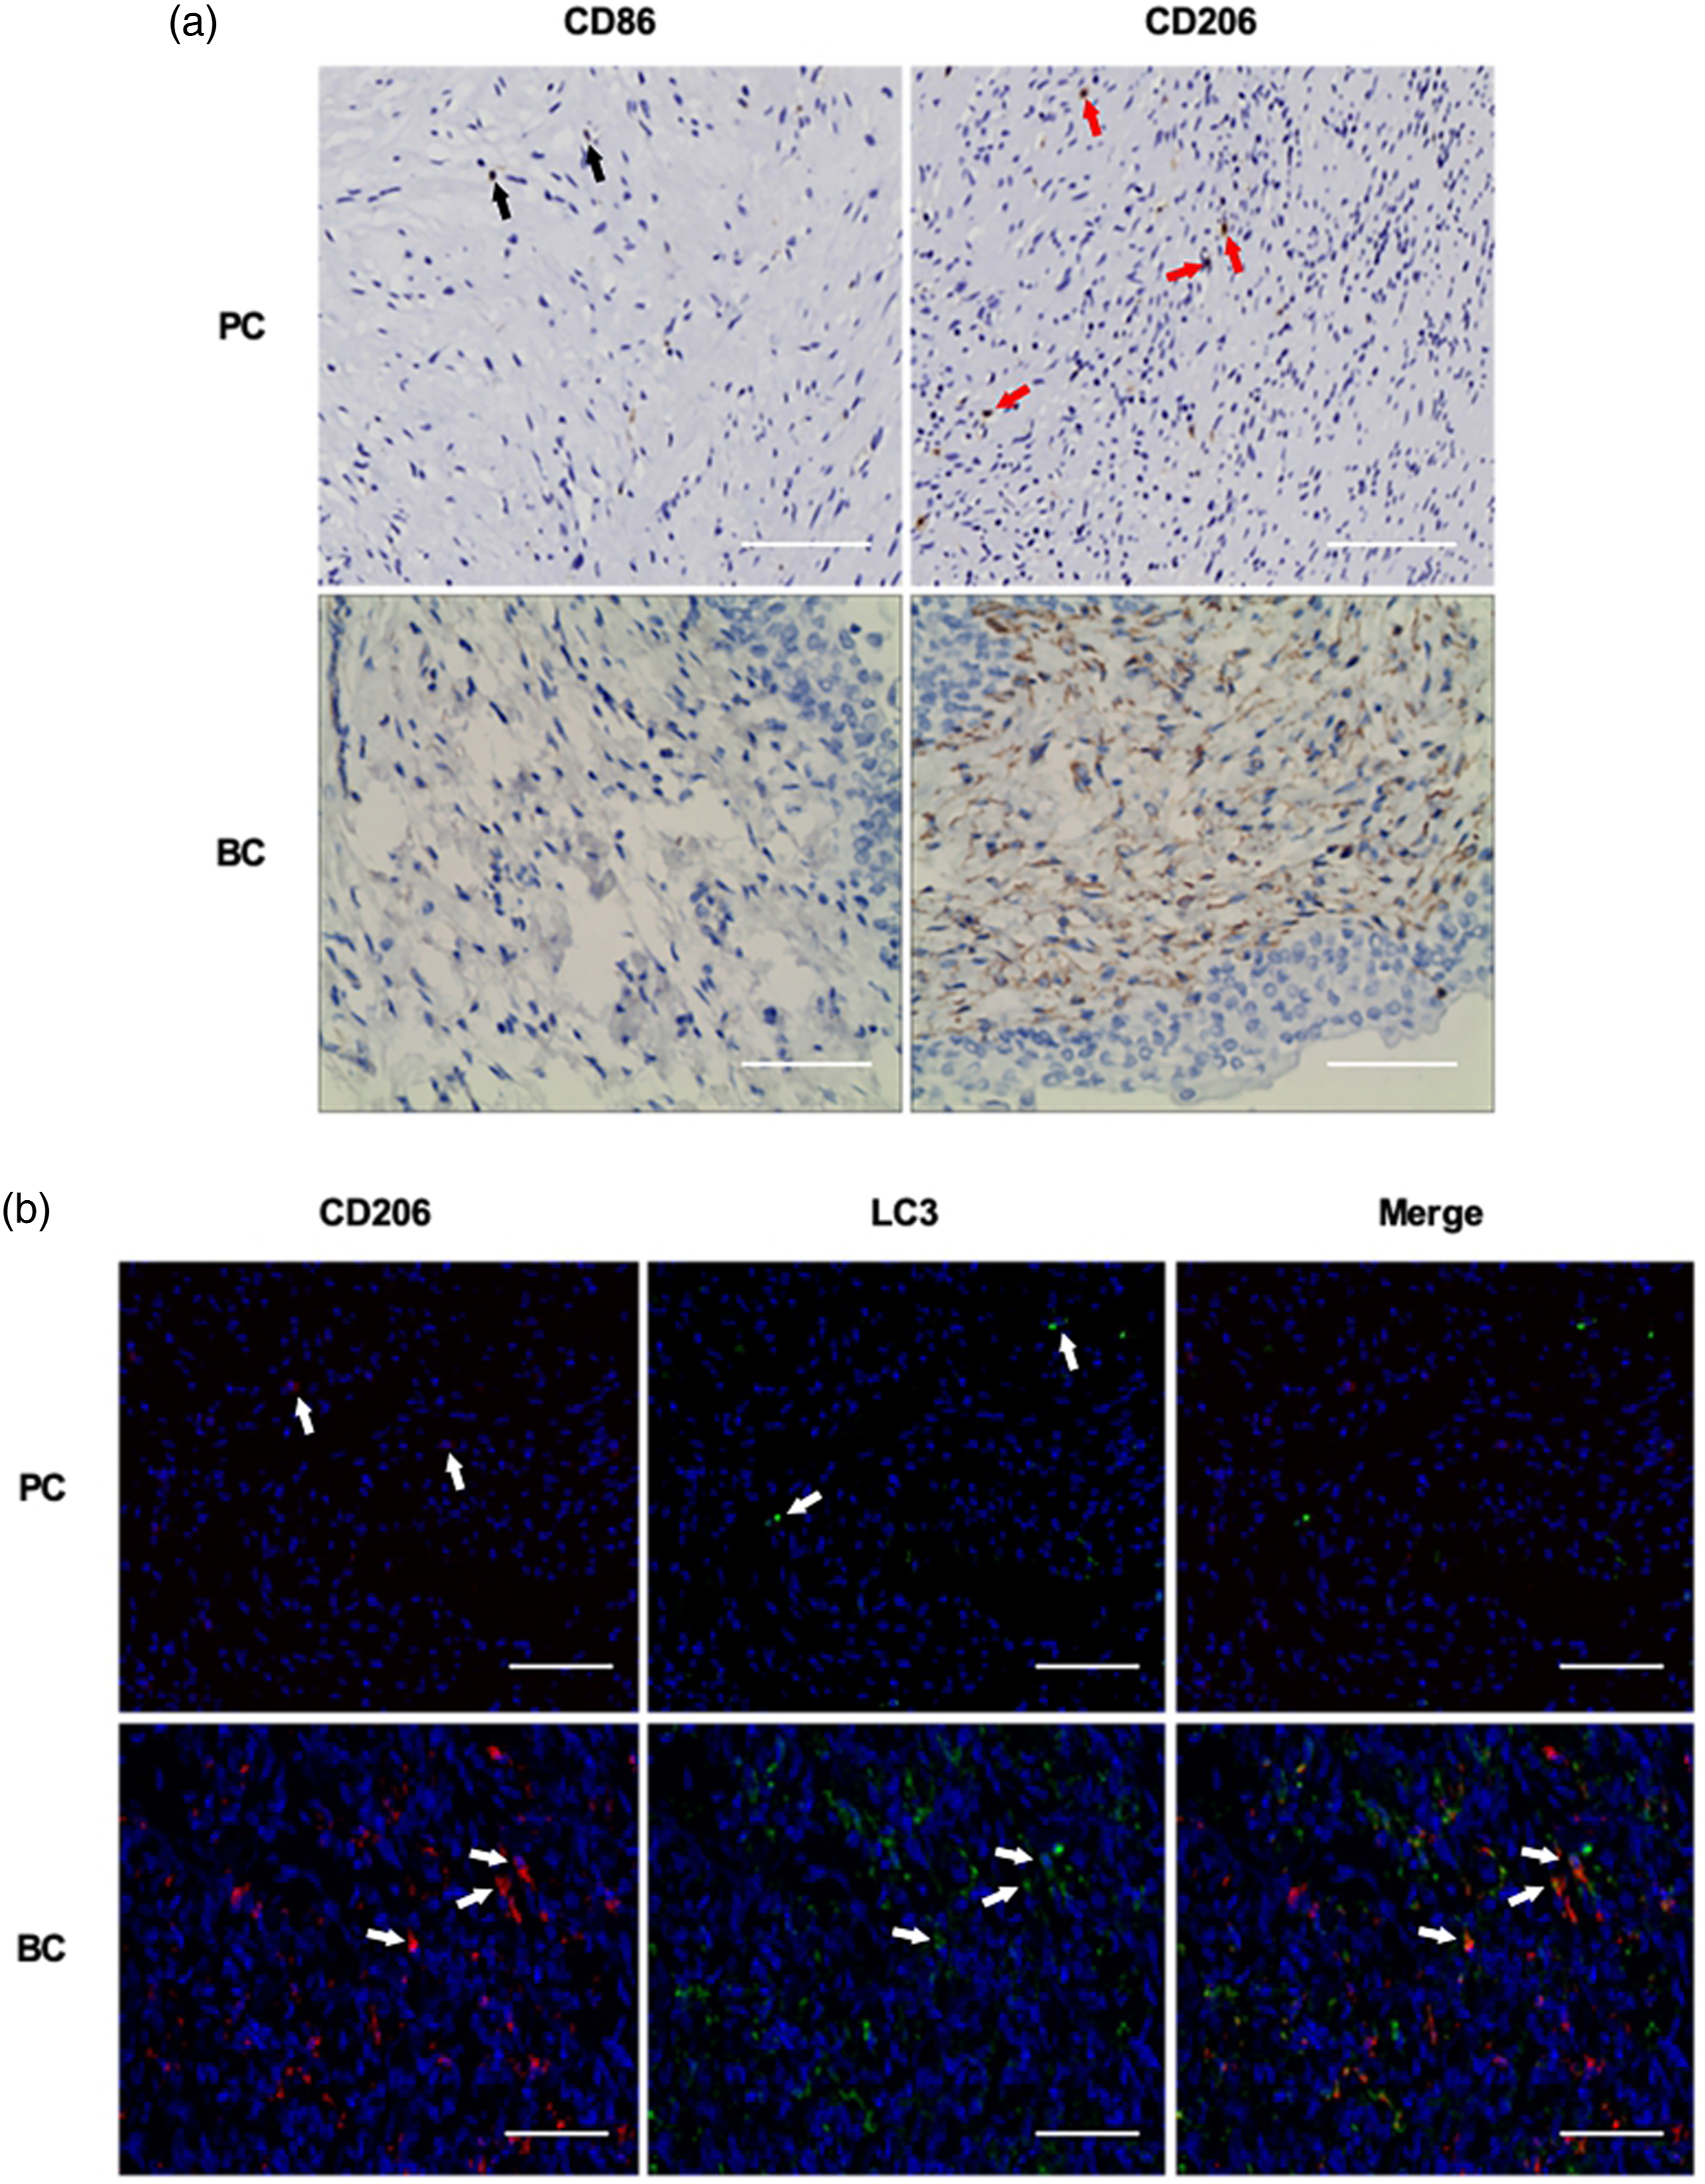
Discussion
The effect of the mTOR inhibitor, rapamycin, on the tumor immune microenvironment and the underlying mechanisms of its actions in bladder cancer remain unclear. In the present study, the results showed that rapamycin induced M1 and M2 macrophage autophagy; however, only M2 macrophages, which exhibited increased autophagy, promoted the migration and invasion of bladder cancer cells. Furthermore, it was shown that IL-10 mediated the effects of rapamycin-treated M2 macrophage on T24 cells. The presence of M2 macrophages that exhibited increased autophagy was increased in bladder cancer tissues compared with their presence in the paracancerous tissues. Based on these observations, the present study showed for the first time that rapamycin induced M2 macrophage autophagy, and that IL-10 secretion facilitated the migration and invasion of bladder cancer cells.
The tumor immune microenvironment is an important environment that regulates tumorigenesis and progression. As the primary type of interstitial cells, macrophages serve different roles in bladder cancer progression by polarizing into two distinct phenotypes, M1 and M2. A recent study found that M2 macrophages were the most commonly observed infiltrating immune cells in bladder cancer tissues, which was closely associated with the clinical stage, histological grade, and survival prognosis of patients. 11 In addition, M2 macrophage polarization stimulated by BMP4 accelerated the progression of bladder cancer in vivo and in vitro, 12 whereas M1 macrophages inhibited proliferation and induced apoptosis of bladder cancer cells by increasing phagocytosis and M1-related cytokines. 13 The present study demonstrated that the presence of M2 macrophages was increased in bladder cancer tissues, and that rapamycin-induced M2 macrophage autophagy promoted the migration and invasion of bladder cancer cells. Conversely, the presence of M1 macrophages was decreased, and enhanced autophagy in these cells did not exhibit any notable effects on the bladder cancer. This lack of effect may underlie the disappointing clinical efficacy of rapamycin for treatment of bladder cancer.
As one of the mechanisms by which cells maintain homeostasis, autophagy is a downstream target of the mTOR pathway. Previous studies have reported that starvation-induced autophagy promotes the epithelial–mesenchymal transition through the TGF-β1/SMAD3 pathway and enhances resistance to gemcitabine by activating HIF-1α in bladder cancer.14,15 In addition, inhibition of autophagy by chloroquine induces cell apoptosis and enhances sensitivity to radiotherapy. 16 Autophagy occurring in tumor-associated macrophages (TAMs) influences cancer cells. A study showed that autophagy in TAMs inhibited the proliferation of colorectal cancer cells, and that apoptosis and sensitivity to radiotherapy were enhanced. 17 In contrast, there are some controversial results showing that macrophage autophagy induces polarization to the M2 phenotype and thus increases the proliferation and metastasis of SL4 colon cancer cells. 18 Therefore, it remains unclear whether macrophage autophagy enhances or inhibits migration and invasion in bladder cancer. The present study showed that M2 macrophages were the primary type of macrophage present in cancer tissues, and that they exhibited increased autophagy. Furthermore, it was shown that rapamycin enhanced autophagy in M2 macrophages and promoted the migration and invasion of bladder cancer cells.
IL-10 is an important cytokine that participates in the immune response. Several studies have shown that IL-10 is associated with the occurrence and development of malignant tumors. IL-10R2 expression is upregulated at both the gene and protein level in colorectal cancer tissues, and overexpression of IL-10R2 promotes tumorigenesis by activating the IL-22/STAT3 signaling pathway in HT29 colorectal cancer cells. 19 Another study demonstrated that bladder cancer progression was significantly inhibited by treatment with an IL-10R1 monoclonal antibody combined with BCG compared with that of BCG alone (22% vs 6%) in mouse orthotopic transplantation models of bladder cancer; encouragingly, the rate of lung metastasis was significantly decreased (0% vs. 53%). 20 Additionally, a very recent study demonstrated that IL-10 derived from M2 macrophages promoted stem cell characteristics in non-small cell lung cancer through the JAK1/STAT1/NF-κB/Notch1 signaling pathway, which resulted in enhanced invasion of cancer cells. 21 Given that M2 macrophages are the major type of cells that secrete IL-10, whether IL-10 mediated M2 macrophage autophagy and influenced the migration and invasion of bladder cancer was investigated. The results showed that rapamycin-induced M2 macrophage autophagy facilitated the migration and invasion of bladder cancer cells via IL-10 secretion.
However, this study still has certain limitations, it is impossible to make statistics on clinical data because there are not enough patients and sample sizes. However, this study has confirmed that TAMs and their autophagy levels have changed in bladder cancer tissues, which suggests that, to a certain extent, TAMs autophagy may become an important factor for judgment of prognosis of patients with bladder cancer.
Conclusion
The results of the present study showed for the first time that rapamycin induced M2 macrophage autophagy and promoted the migration and invasion of bladder cancer cells by increasing IL-10 secretion. These results suggest that M2 macrophage autophagy is essential for the progression of bladder cancer, and that IL-10 secretion is involved in the underlying molecular mechanism. M2 macrophage autophagy is another target of rapamycin in treating bladder cancer, and mTOR inhibitors combined with autophagy inhibitors may be useful for treatment of patients with bladder cancer.
Supplemental Material
sj-pdf-1-eji-10.1177_20587392211049878 – Supplemental Material for Rapamycin-induced M2 macrophage autophagy promotes the migration and invasion of bladder cancer cells via increased IL-10 secretion
Supplemental Material, sj-pdf-1-eji-10.1177_20587392211049878 for Rapamycin-induced M2 macrophage autophagy promotes the migration and invasion of bladder cancer cells via increased IL-10 secretion by Yuanyuan Guo, Zhong Li, Zhenxue Cao, Tantu Ma, Juan Mei, Wei Sun, Wuyue Gao, Beibei Liu, Jianmin Liu and Rui Wang in European Journal of Inflammation
Footnotes
Author’s contributions
RW and YYG participated in the study design, data interpretation, and manuscript drafting. WS and WYG participated in the collection of clinical samples. ZXC, TTM, and JM performed the experiments. LQL and BBL revised the article critically for important intellectual content. All authors reviewed and approved the final manuscript.
Declaration of conflicting interests
The author(s) declared no potential conflicts of interest with respect to the research, authorship, and/or publication of this article.
Funding
The author(s) disclosed receipt of the following financial support for the research, authorship, and/or publication of this article: This study was supported by the National Natural Science Foundation of China (grant no. 81702495), the Natural Science Foundation of Anhui Province (grant no. 1808085QH279), The University Natural Science Research Project of Anhui Province (grant no. KJ2018A0214), The University Outstanding Youth Talent Support Program of Anhui Province (grant no. gxyqZD20190308), The First Affiliated Hospital of Bengbu Medical College Science Fund for Outstanding Young Scholars (grant no. 2019byyfyyq01), and the Natural Science Research Project of Bengbu Medical College (grant nos. BYKY1723ZD and BYKY1738ZD).
Ethics approval and consent to participate
The protocol used in the present study was approved by The Ethics Committee of Bengbu Medical College (approval no. 2017-008), and written informed consent was obtained from the patients or their guardians.
Supplemental material
Supplemental material for this article is available online.
References
Supplementary Material
Please find the following supplemental material available below.
For Open Access articles published under a Creative Commons License, all supplemental material carries the same license as the article it is associated with.
For non-Open Access articles published, all supplemental material carries a non-exclusive license, and permission requests for re-use of supplemental material or any part of supplemental material shall be sent directly to the copyright owner as specified in the copyright notice associated with the article.