
Abstract
Colitis induced by 2,4,6-Trinitrobenzenesulfonic acid (TNBS) has been used as a model for Crohn’s disease (CD) of inflammatory bowel disease (IBD). Lipocalin-2 (Lcn-2) is an emerging and clinically relevant biomarker of IBD. We investigated the performance of serum and fecal Lcn-2 in the TNBS model of colitis. Female, 7-week-old, BALB/c mice were administered intrarectally phosphate-buffered saline/water or 30% ethanol (vehicle control groups) for 5 days or TNBS for 5 days followed by a 28-day recovery phase. Serum and fecal levels of Lcn-2 were quantified, and effects on body weight, clinical scores, colon weight and length, gross pathology, and histopathology were investigated. Increased serum Lcn-2 levels correlated only with marked to severe inflammation. A clear differentiation in Lcn-2 fecal levels between TNBS-treated and vehicle-treated control mice was most noticeable on days 2 and 3. There was a strong correlation between body weight change, histopathologic scores of inflammation, and/or fecal Lcn-2 levels on days 2 and 5. Both serum and fecal Lcn-2 levels declined over time as the colonic mucosa recovered. Fecal Lcn-2 was found to be a more sensitive biomarker (vs. serum Lcn-2) and was able to discriminate mild, moderate, and severe colonic inflammation.
Inflammatory bowel disease (IBD) is a chronic inflammatory disease of the gastrointestinal (GI) tract affecting over a million Americans (Kappelman et al. 2013). The disease is characterized by relapsing inflammation, which is associated with diarrhea and abdominal pain. While environmental exposures such as smoking (Mahid et al. 2006) and antibiotic usage (Shaw, Blanchard, and Bernstein 2010; Hviid, Svanstrom, and Frisch 2011) play a role, there has been an increased focus recently on contributions from genetics and the gut microbiome. Genetic polymorphisms involved with innate immunity, such as NOD2 (Cho et al. 2007) and TLR4 (Franchimont et al. 2004), Th17 (Stallhofer et al. 2015) and autophagy, such as ATG16L1 (Hampe et al. 2007) and IRGM (Parkes et al. 2007; McCarroll et al. 2008), have been shown in epidemiologic studies to be associated with an increased risk of IBD. Recently, it has been shown that changes in the gut microbiome and “dysbiosis,” such as loss of bacterial diversity or disturbance of the bacterial composition, can be associated with IBD severity and recurrence (Walker et al. 2011; Aomatsu et al. 2012; Sha et al. 2013). Thus, while the exact etiology of IBD is not known, it is thought that IBD is a multifactorial disease and is characterized by an exaggerated host immune response to the normal gut microflora in genetically susceptible individuals (Danese and Fiocchi 2006).
Crohn’s disease (CD) and ulcerative colitis (UC) are the two main forms of IBD and have distinct immunological and histopathological characteristics. CD can occur anywhere in the GI tract and is associated with transmural inflammation and granuloma formation (Nagaoka and Radi 2012). Histopathologically, there is discontinuous chronic inflammation and irregular crypt cell architecture and an increased amount of intraepithelial lymphocytes (Laass, Roggenbuck, and Conrad 2014). Immunologically, CD is characterized by IL-12-mediated TH1 response with elevated levels of IFN-γ, IL-12, and TNF-α (Nagaoka and Radi 2012). UC is generally restricted to the colorectal area of the GI tract, where inflammation is superficial and associated with ulceration and crypt abscesses. Immunologically, UC is characterized by loss of goblet cells and is mediated through TH2 cytokines, IL-5, and IL-13 (Nagaoka and Radi 2012).
The 2,4,5-trinitrobenzenesulfonic acid (TNBS) colitis model uses rectal instillation of TNBS in susceptible strains of mice, such as SJL and BALB/c. TNBS haptenates colonic proteins with a trinitrophenyl group, which ultimately results in excessive IL-12 production leading to activation and differentiation of colonic T cells into TH1 cells and the concurrent elevation of various cytokines, such as IFN γ, TNF-α, IL-1β, and IL-6 (Scheiffele and Fuss 2002). It has been demonstrated that administration of antibodies for IL-12 early or late in the disease model is able to improve or reverse disease progression (Neurath et al. 1995). Furthermore, immunopathologically, the TNBS model is used as a preclinical CD model and has been used to assess efficacy of various pharmacologic therapeutics (Elson et al. 1996; Scheiffele and Fuss 2002; Radi et al. 2011).
Lipocalin-2 (Lcn-2), also known as neutrophil gelatinase–associated lipocalin (NGAL), is a biomarker shown to be expressed in normal tissues and is markedly increased when inflammation occurs, such as in colonic epithelial tissue from IBD patients, and in various cancers, such as lung adenocarcinomas and pancreatic cancer, or ischemic renal injury (Nielsen et al. 1996; Mishra et al. 2005). Additionally, as its name suggests, Lcn-2 is found in neutrophils but not in other leukocytes (Kjeldsen, Cowland, and Borregaard 2000). There have been several studies in humans with UC and CD showing a correlation between disease severity and NGAL levels. While there is a positive trend associating serum NGAL levels with disease severity, there is a statistically significant relationship between disease severity and fecal NGAL levels (Nielsen et al. 1996; Oikonomou et al. 2012; Yesil et al. 2013). In rodent models of dextran sulfate–induced (DSS) colitis, a strong association has been shown between elevated levels of Lcn-2 and colitis severity (Vijay-Kumar et al. 2007; Chassaing et al. 2012). It was also demonstrated that Lcn-2 is induced in both T-cell dependent and T-cell-independent mouse models of IBD (Cayatte et al. 2012).
Although there are data on Lcn-2 in the DSS model, there are no published data, to the best of our knowledge, on the performance or usefulness of serum and/or fecal Lcn-2 in the TNBS model of IBD, which is commonly used to assess efficacy of various pharmacologic therapeutics. In addition, not all biomarkers behave consistently across different IBD models. Therefore, the novelty of the current study concerns the following: (1) testing the performance and usefulness of serum and fecal Lcn-2 in this commonly used IBD model of CD, (2) establishing the baseline and variability levels of fecal and serum Lcn-2 in this CD model at our facility because it is known that there could be a significant amount of variability among various IBD models, and (3) correlating the in-life parameters such as body weight and clinical scores, and histopathology with serum and fecal levels of Lcn-2 to assess if we could use the in-life parameters along with a Lcn-2 biomarker alone without needing to euthanize the animals, collect tissues, and do histopathologic assessment. Not having to euthanize the animals and do histopathologic examination would enable fast- and high-throughput assessment of novel therapeutics, and also it would be more cost effective to use the in-life parameters without having to wait for the histopathological examination. Therefore, the objectives of this study were to (1) measure and investigate the disease relevance of serum and fecal Lcn-2 as a sensitive and noninvasive biomarker, (2) examine the correlation of Lcn-2 with clinical scores and changes in body weight along with gross pathology and histopathology, and (3) investigate the performance of Lcn-2 during a 3-week mucosal healing recovery phase in the TNBS model of colitis and CD.
Methods
Animal Model
Female, 7-week-old BALB/c mice, weighing between 18 and 23 g from Jackson Laboratories (Bar Harbor, ME) were used in this study and acclimated for 7 days. This study was reviewed and approved by Pfizer’s Institutional Animal Care and Use Committee, which is fully accredited by the Association for Assessment and Accreditation of Laboratory Animal Care, International. During acclimation, dosing, and recovery phases of the study, animals were individually housed in conventional, polycarbonate cages with solid bottoms and Alpha-dri® bedding. Standard procedures and conditions were applied for animal care, feeding, and maintenance of room, caging, and environment. Animals were fed LabDiet® 5053 Irradiated Rodent Diet (Brentwood, MO) ad libitum, and autoclaved reverse osmosis water was supplied ad libitum in Techniplast bottles (Allentown, PA). Automatically controlled environmental conditions were set to maintain temperature at 21°C ± 2°C with 50% ± 5% relative humidity, 12:12 hr light:dark cycle. Environmental conditions were monitored daily. The BALB/c strain of mouse was chosen, as it is susceptible to TNBS-induced colitis and as a CD preclinical animal model (Radi et al. 2011).
Experimental Design Outline and Drug Treatments
Details of the experimental design, experimental study dosing, and end points measured are outlined in Table 1. Groups 1 and 2 were intrarectally (IR) administered with phosphate-buffered saline (PBS)/water or 30% ethanol, respectively, only once on day 0, using a 3.5 French catheter inserted 1.5 cm proximal to the anus. All animals in groups 3 and 4 (group 3, TNBS treated; group 4, TNBS treated with mucosal recovery phase) were administered IR TNBS (1.5 mg of pure TNBS [catalog number P2297, CAS number 2508-19-2; Sigma–Aldrich] dissolved in 10 ml of 30% ethanol) once on day 0. We have used 2 vehicle controls in our experiment for the following reasons. First, TNBS is typically dissolved in 30% ethanol, where ethanol serves as a solvent and can aid in breaking the mucosal barrier, which may cause slight irritation. Thus, we wanted to make sure our experiment is well controlled especially when trying to assess Lcn-2 as a sensitive biomarker. Second, we have used the PBS as a procedural control, as the insertion of the catheter itself can potentially cause slight inflammation. Group 4 was allowed to have intestinal mucosal healing recovery phase for 28 days without any additional TNBS exposure. The IR dosing volume in all groups was 5 ml/kg.
Study Detailed Experimental Design.
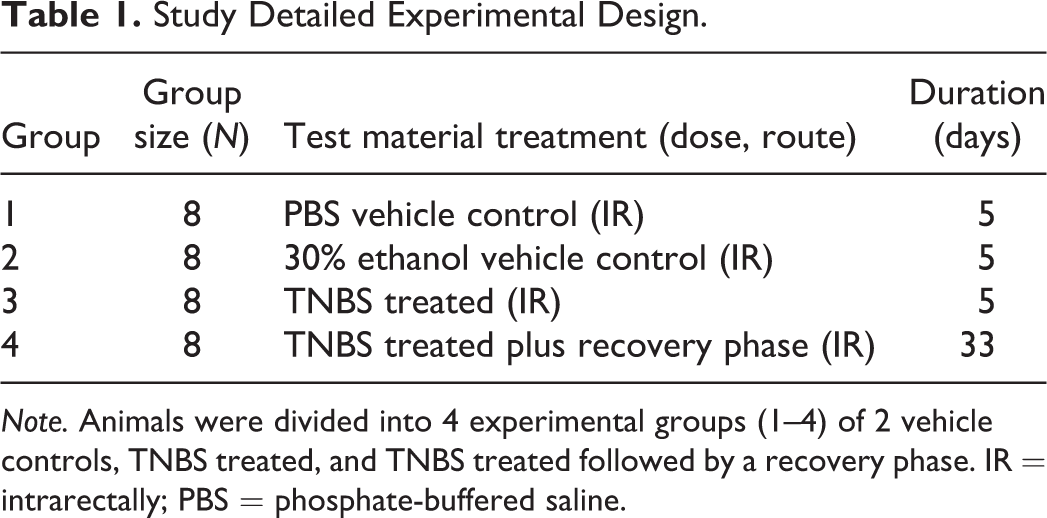
Note. Animals were divided into 4 experimental groups (1–4) of 2 vehicle controls, TNBS treated, and TNBS treated followed by a recovery phase. IR = intrarectally; PBS = phosphate-buffered saline.
Survival and Clinical Signs
During the first 5 days of the study, daily clinical examination was performed for all treatment groups 1 to 4 and involved examination for survival and any changes in skin, fur, eyes, mucous membranes, occurrence of secretions or excretions, and autonomic activity similar to previously reported literature (Radi et al. 2011). Any changes in posture, gait, or response to handling or other unusual behavior (tremors, convulsions, and/or coma) were also noted. For group 4, weekly observations were made after day 5 of the study until the end of study.
Body Weight Assessment
Initial body weights were made before study start (on day −1) to ensure that mice weighed at least 18 g. Individual body weights at baseline were made on study day 0 before the start of the study which commenced with the IR TNBS administration. Body weight was recorded daily for the first 5 days and weekly thereafter (recovery phase group). To calculate percentage changes in weight, weight on study day 0 served as a baseline.
Clinical Scores Assessment of Colitis
Body weight loss, stool consistency, and rectal bleeding along with animal fur coat and abdomen staining were all recorded daily and used to calculate in-life clinical score for disease severity (Table 2), and this was done similar to previously reported literature (Radi et al. 2011). If the score was greater than 11, it means that the animal was either found dead or humanely euthanized. If weight loss was greater than 20% from baseline, or animals were displaying signs of severe distress, the animal was humanely euthanized. Animals that were found dead or were euthanized before the end of study did not have their data included in the final analysis.
Assessment Parameters of Clinical Scores of Colitis.
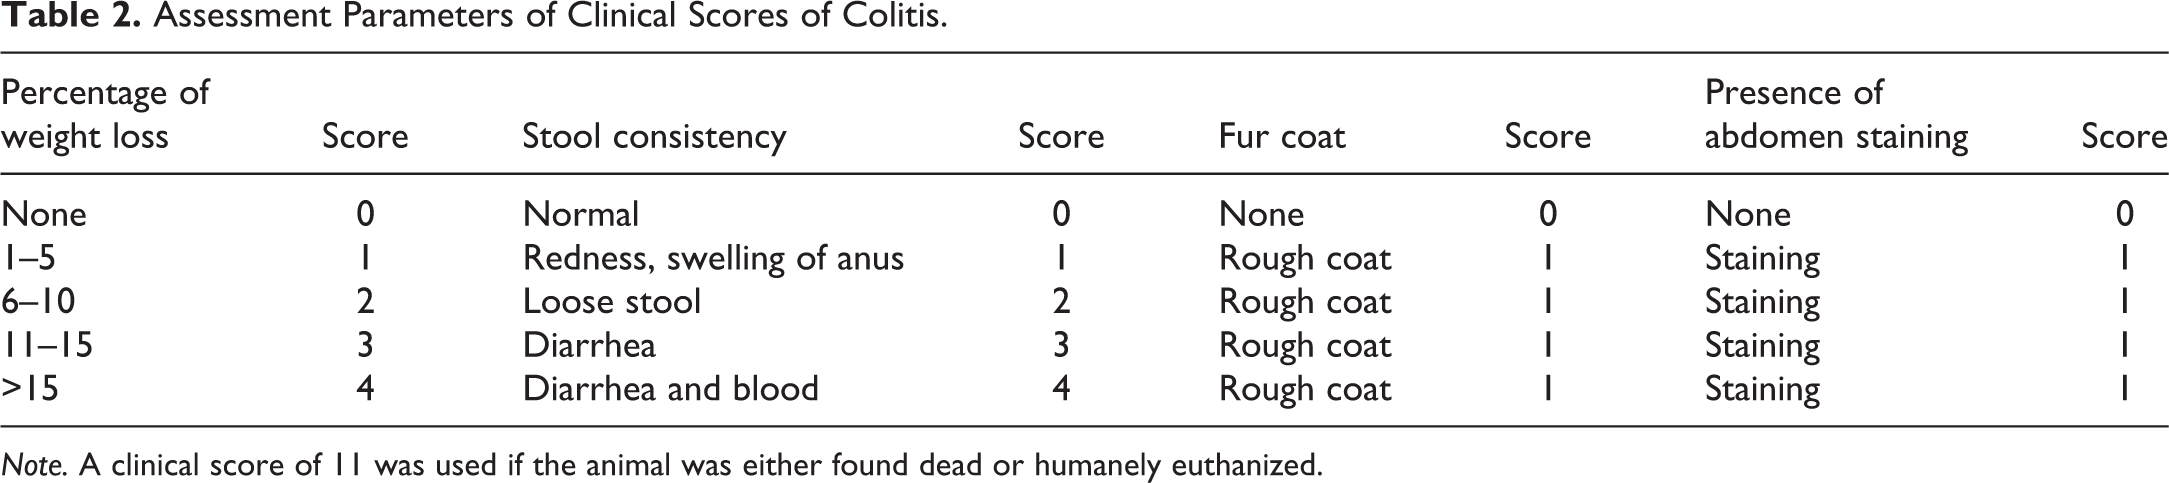
Note. A clinical score of 11 was used if the animal was either found dead or humanely euthanized.
Fecal and Serum Samples Collection
For fecal sample collection, mice were placed in clean polycarbonate cages without bedding until they defecated or for 1 hr, whichever came first. Fecal samples were collected in clean polypropylene tubes. Fecal samples were reconstituted in PBS containing 0.1% Tween 20 at a concentration of 100 mg feces/ml and vortexed for 30 min to yield a homogenous suspension. The samples were centrifuged at 12,000 rpm at 4°C for 10 min using a Beckman Coulter Microfuge 22R. Clear supernatant was collected in a clean polypropylene tube and stored at −20°C until analysis. Fecal samples were collected every day from dosing until day 5 and then weekly until end of study. For serum samples, blood was collected in Capiject gel/clot activator tubes (Terumo, Somerset, NJ) and allowed to sit at room temperature for 30 min. Tubes were then centrifuged at 6,000 rpm at room temperature for 10 min. Serum samples were collected in clean polypropylene tubes and stored at −20°C until analysis. Blood serum samples were collected on days 2, 5, 13, 20, 27, and 33.
Quantification of Lcn-2 by ELISA
Lcn-2 levels were quantified using Mouse Lipocalin-2/NGAL ELISA kit (R&D Systems, Minneapolis, MN). Supernatant from fecal samples was diluted 4-fold to 100,000-fold depending on severity of inflammation, while serum was diluted 1,000-fold to 100,000-fold using kit-recommended reagent diluent (1% BSA in PBS). Plates were read on Spectramax Plus 384 (Molecular Devices) at 450 nm.
Necropsy and Gross Pathology Examination
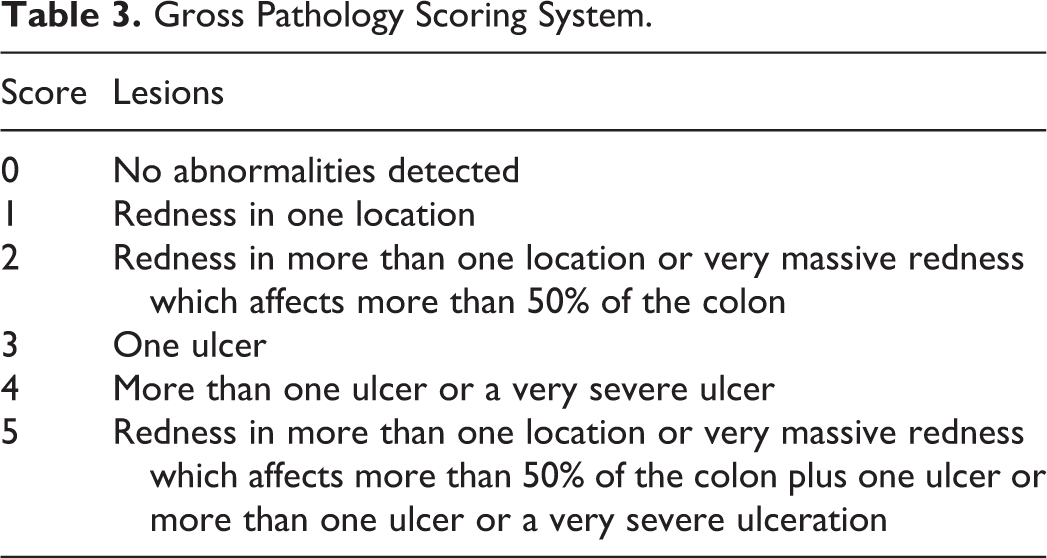
On the last day of the study, mice were necropsied and colons were removed for gross pathologic evaluation and scored as described in Table 3 and similar to previously reported in the literature (Radi et al. 2011). In addition, colon weights and lengths from all groups were recorded.
Gross Pathology Scoring System.
Histopathology
Colon tissues from all animals in all groups including those that died early were collected and fixed in formalin, embedded in paraffin, sectioned at 4 µm, and stained with hematoxylin and eosin for light microscopic analysis by a toxicologic pathologist. Histopathological scoring of inflammation conducted by the pathologist was on a scale of 0 to 4 based on the following criteria: score 0 = no inflammation or erosion/ulceration, 1 = minimal mixed cell inflammation with or without erosion/ulceration involving approximately less than 25% of the mucosal surface, 2 = mild mixed cell inflammation with or without erosion/ulceration involving approximately 25% to 50% of the mucosal surface, 3 = moderate mixed cell inflammation with erosion/ulceration involving approximately 50% to 75% of the mucosal surface, and 4 = marked to severe mixed cell inflammation with erosion/ulceration involving approximately more than 75% of the mucosal surface.
Statistical Analysis
Statistical analysis was performed using GraphPad Prism 6. Results presented are means and standard error of the mean. Analysis of variance was performed to demonstrate significant differences at p < .05. The association of histopathology scores with fecal Lcn-2 and body weight changes was measured using Spearman’s correlation coefficients.
Results
Survival and Mortality
Mice survival data are summarized in Table 4. High incidence of mortality is common in the TNBS CD model (Radi et al. 2011). Survival began to decline by day 4. In the TNBS-treated group (group 3), the survival rate dropped to 88% by day 5 of the study (Table 4). The recovery phase group (group 4) experienced a decrease in survival rate down to 88%, 75%, and 63% on days 4, 5, and 12, respectively. In group 4, 5 mice survived to end of study and 3 mice died prematurely. This decline in survival rate did not continue after day 12 and stayed at 63%. In both the PBS-treated and 30% ethanol-treated vehicle control groups (groups 1 and 2), there was 100% survival until end of study (Table 4).
Survival Percentages.
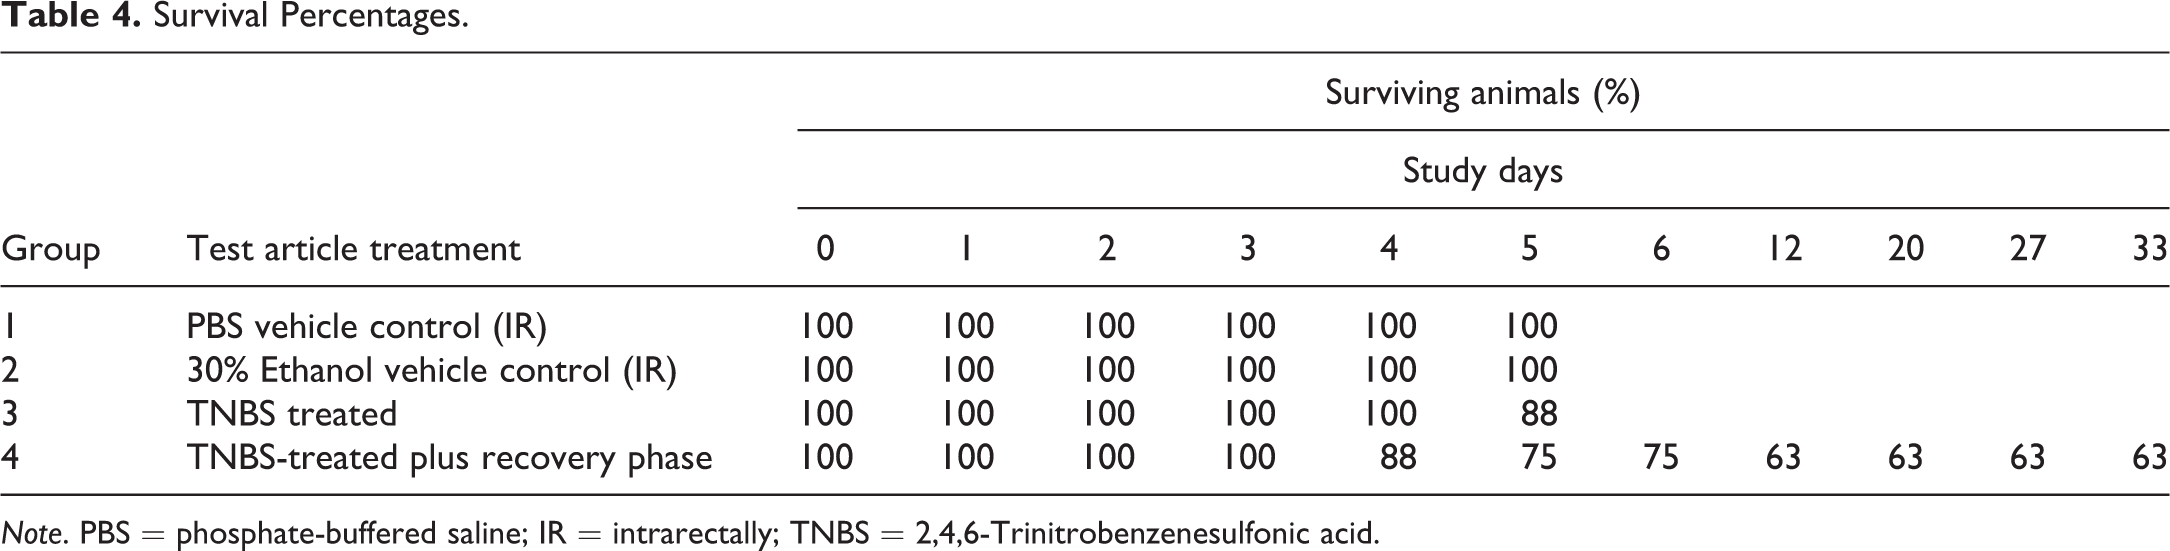
Note. PBS = phosphate-buffered saline; IR = intrarectally; TNBS = 2,4,6-Trinitrobenzenesulfonic acid.
Body Weight
Data on body weight changes that followed the TNBS administration are summarized in Figure 1. On day 1, there was a statistically significant body weight loss in the TNBS-treated groups (groups 3 and 4) when compared with PBS-treated vehicle control group and 30% ethanol-treated vehicle control groups (groups 1 and 2). The TNBS-treated groups (groups 3 and 4) had the highest body weight loss on day 2 which ranged from 10% to 15% (Figure 1). Both the TNBS-treated groups (groups 3 and 4) showed statistically significant differences in body weight compared with both the PBS-treated and 30% ethanol-treated vehicle control groups (groups 1 and 2, respectively) on day 2 after dosing (Figure 1). In all mice that received the TNBS, the largest and maximum change in body weight was observed on day 2 with a gradual recovery in body weight in subsequent days (Figure 1). On day 3, there was a statistically significant body weight loss in the TNBS-treated groups (groups 3 and 4) when compared with 30% ethanol-treated vehicle control group (group 2). On day 4, there was a statistically significant body weight loss in the TNBS-treated recovery group (group 4) when compared with 30% ethanol-treated vehicle control group (group 2). No significant differences were noted on day 5. In the recovery phase group, a 7% body weight loss was noted on day 6, and animals started gaining weight (1-4%) on subsequent days (days 12, 20, and 27; Figure 1).
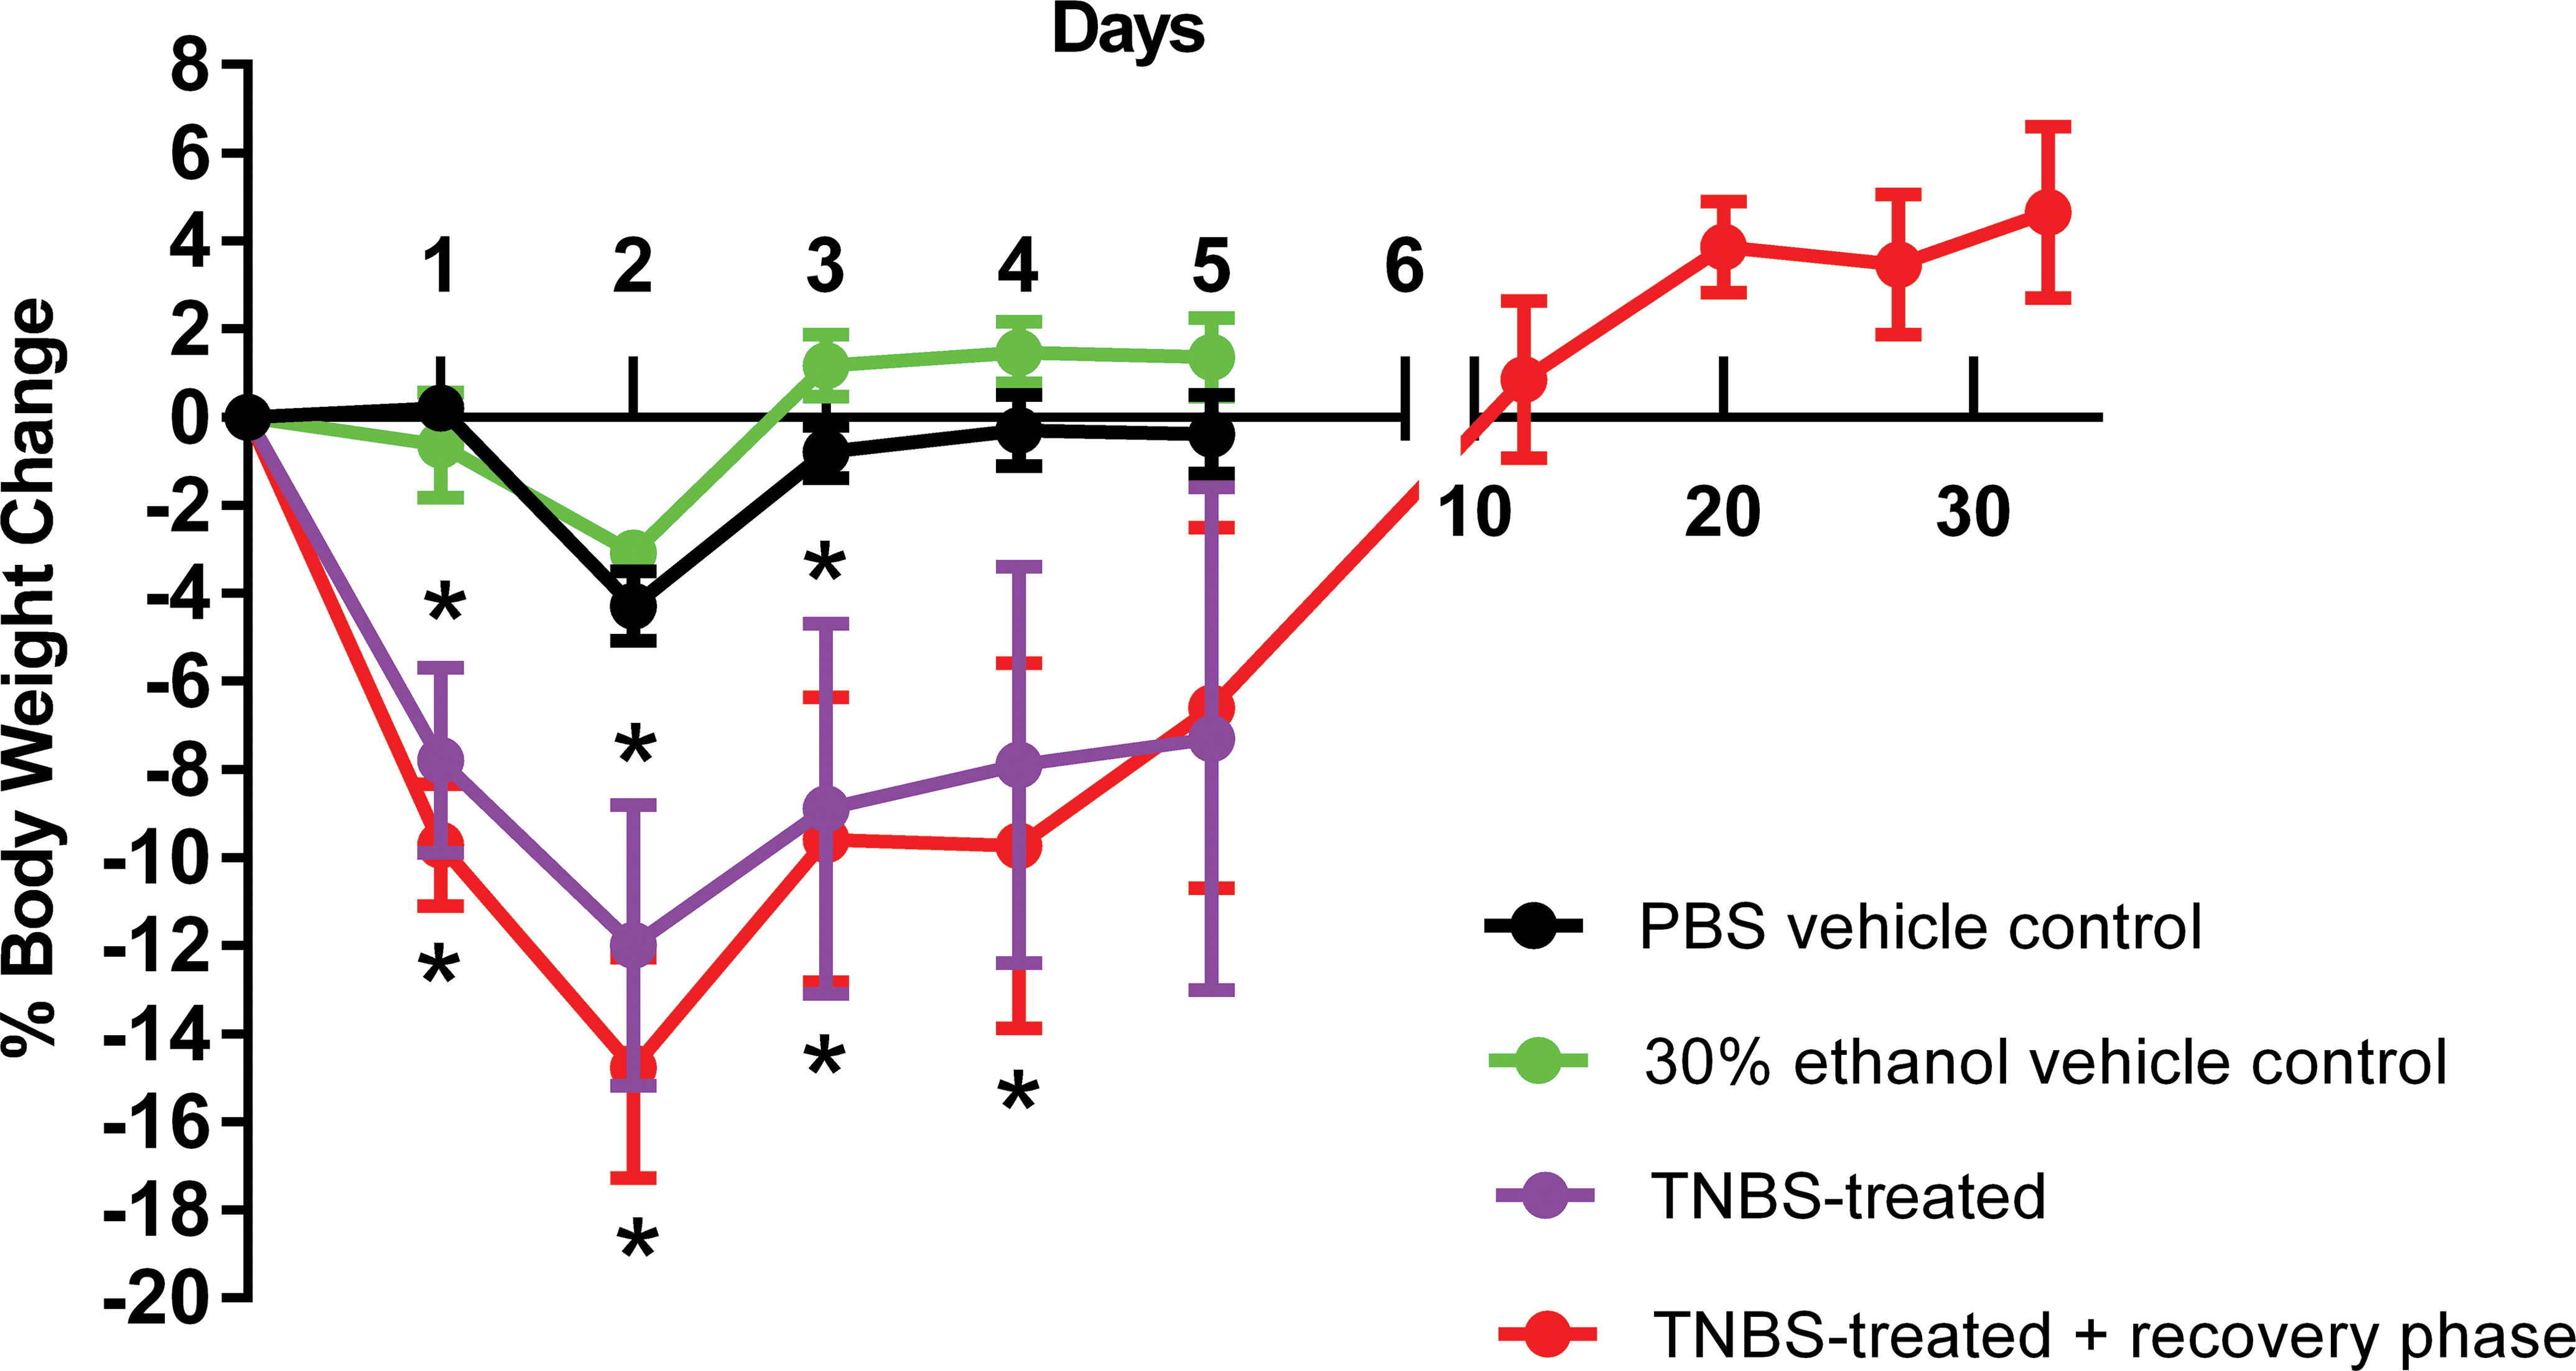
Body weight change (percentage of baseline) on days 1 to 5 and during the recovery phase for the TNBS-treated group (group 4). Asterisks indicate statistically significant differences (p < .05).
Clinical Scores Assessment of Colitis
Clinical scores of colitis data are summarized in Table 5. Clinical scores included body weight loss, stool consistency, fur coat appearance, and abdomen staining. The scores were calculated as described in Table 2 by analyzing the stool consistency and weight change scores (0–4) in addition to changes in the coat and abdomen (0 or 1) with a maximum score of 11 for dead or moribund mice that were taken down. When compared with the vehicle controls (groups 1 and 2), statistically significant changes were observed on day 1 in all TNBS-treated groups (groups 3 and 4; Table 5). This trend of high clinical scores of colitis continued to persist in the TNBS-treated and the TNBS-treated recovery phase groups (groups 3 and 4) until day 4. The clinical scores plateaued after day 2 in groups 3 and 4 (Table 5). No changes in stool consistency or body weight loss >5% were observed in any of the vehicle-treated control mice (groups 1 and 2). Mice exhibited higher clinical scores of colitis on day 1 due to the highly irritant nature of TNBS coupled with reduction in food and water intake, whereas on day 4 they had severe colonic lesions and diarrhea. The continued high clinical score in the TNBS-treated recovery phase group (group 4) after day 5 was driven by animals that died contributing a score of 11 being added to the mean. In group 4, 5 mice survived to end of study and 3 mice died prematurely. The surviving mice after day 13 all had clinical scores of 0 and had shown body weight gain and normal stool.
Clinical Scoring of Colitis.
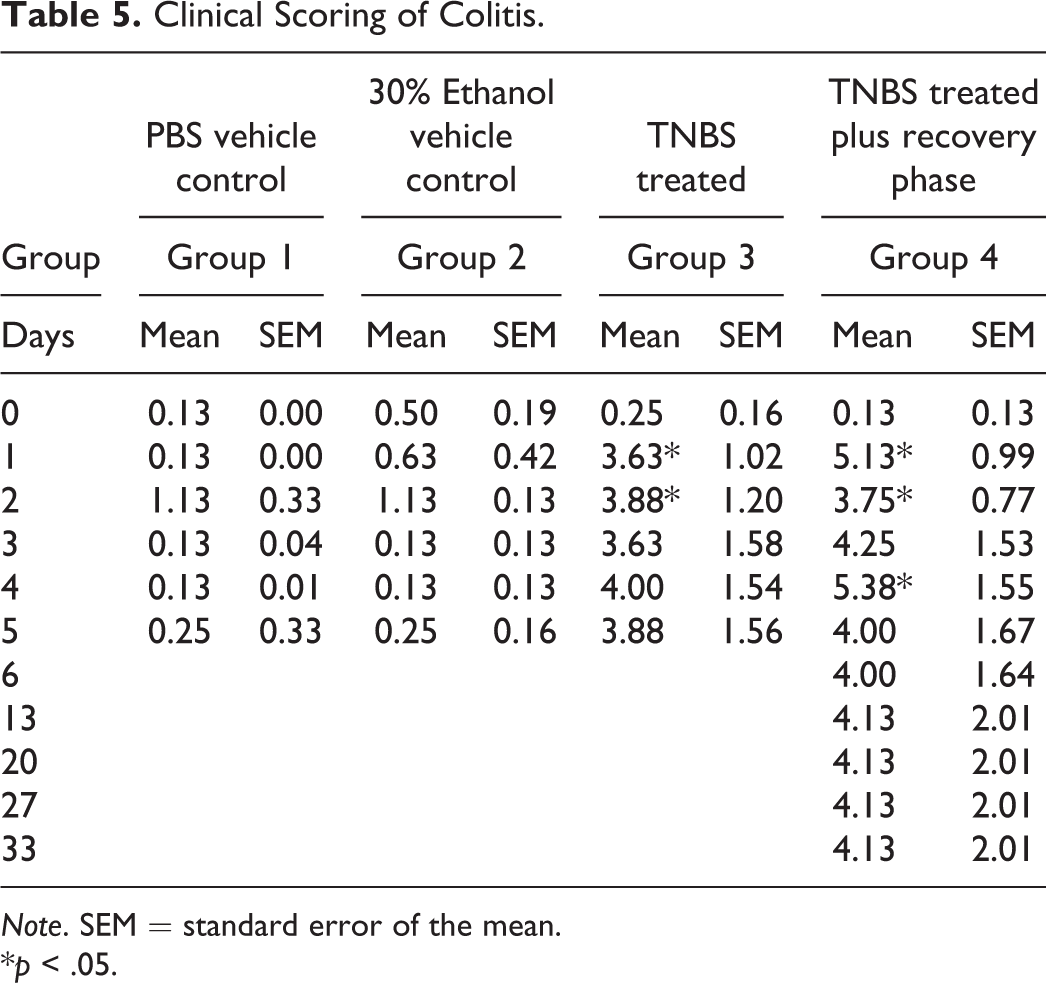
Note. SEM = standard error of the mean.
*p < .05.
Gross Pathology Scores
Gross pathology scores for all groups measured at the end of the study on days 5 and 33 are summarized in Table 6. No or very minimal gross pathological findings were observed in the vehicle control groups (PBS and 30% ethanol). The very minimal gross pathology score noted in the 30% ethanol group was related to a focal minimal redness area in 1 animal, as ethanol can induce minimal mucosal irritation. A score mean range of 1.38 to 1.63 of the colon was observed in the TNBS-treated groups on day 5 (Table 6). There were statically significant differences between the vehicle control groups (groups 1 and 2) and the TNBS-treated group (TNBS-treated plus recovery phase) that had the highest score. The high gross pathology score in the TNBS-treated recovery phase group (TNBS-treated plus recovery phase) on day 33 was driven by early death of animals (5 mice survived to end of study, and 3 mice died prematurely) that had gross pathology scores of 3 and 4. The remaining mice all had gross pathology scores of 0.
Gross Pathology Score Means.
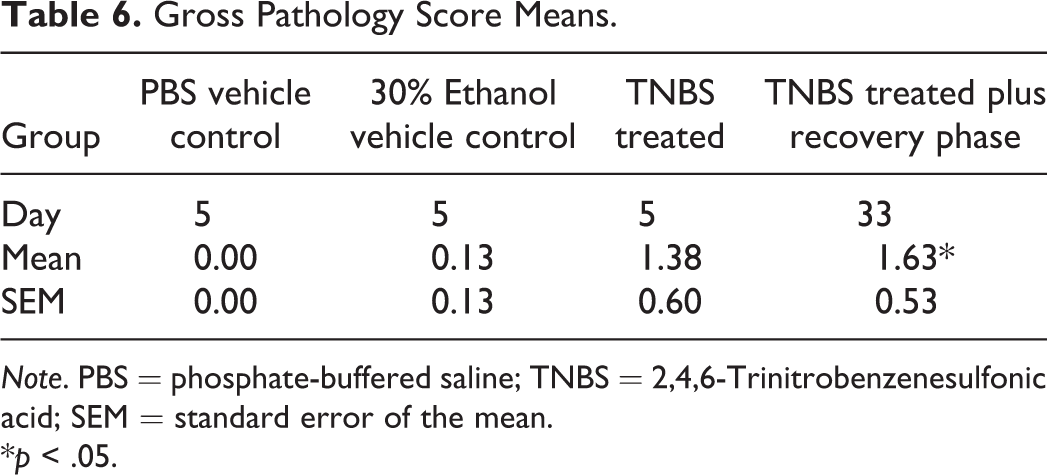
Note. PBS = phosphate-buffered saline; TNBS = 2,4,6-Trinitrobenzenesulfonic acid; SEM = standard error of the mean.
*p < .05.
Colon Weights and Lengths
Colon weights and lengths measured at the end of the study on days 5 and 33 are summarized in Table 7. Colon lengths were shorter in the TNBS-treated compared with the PBS vehicle-treated and 30% ethanol-treated control groups, but none of the colon lengths were statistically significant. The TNBS-treated groups (TNBS-treated and TNBS-treated plus recovery phase) had higher colon weights compared with the PBS vehicle–treated and 30% ethanol-treated control groups. The colonic weights of the TNBS-treated group (group 3) showed a statistically significant difference compared with the PBS vehicle–treated control groups (Table 7).
Colon Weights (mg), Lengths (cm), and Means (SEM).
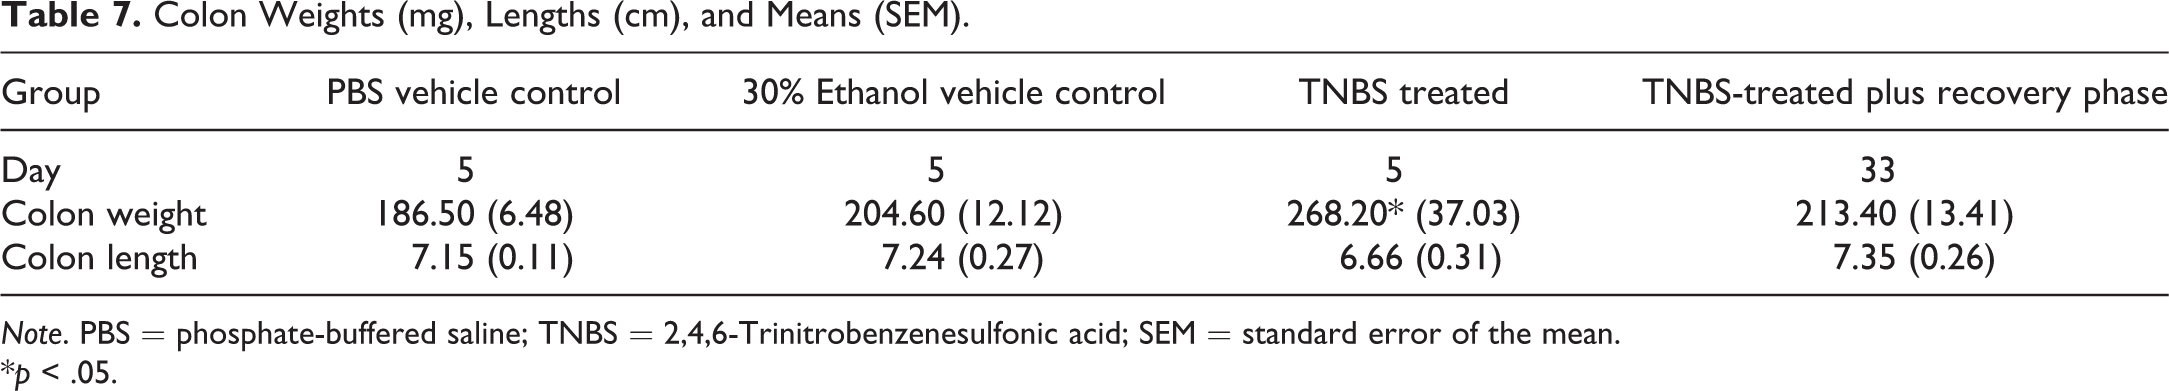
Note. PBS = phosphate-buffered saline; TNBS = 2,4,6-Trinitrobenzenesulfonic acid; SEM = standard error of the mean.
*p < .05.
Histopathology
The results of the histopathologic evaluation of the colon at the end of the study on days 5 and 33 are summarized in Table 8. No inflammation was observed in tissues from the vehicle control groups (PBS and 30% ethanol vehicle groups). On day 5, the mean histopathologic score in the TNBS-treated group was statistically and significantly higher than the 2 vehicle-treated control groups (PBS and 30% ethanol vehicle groups; Table 8). In the TNBS-treated plus recovery phase, 5 mice that survived to end of study on day 33 had no colonic inflammation, while the 3 mice which died prematurely had grades of 3 to 4 inflammation. Representative examples of grades 0, 2, and 4 are shown in Figure 2A–D along with an example of a colon from the recovery group which was collected on day 33.
Colon. (A) No inflammation (grade 0), (B) mild inflammation (grade 2), and (C) severe inflammation (Grade 4) from TNBS-treated mice, and (D) colon from the TNBS-treated plus recovery phase group collected on day 33 showing full recovery and lack of inflammation (grade 0).
Histopathology Score Means.
Note. PBS = phosphate-buffered saline; TNBS = 2,4,6-Trinitrobenzenesulfonic acid; SEM = standard error of the mean.
*p < .05.
Quantitation of Fecal and Serum Lcn-2
Data of fecal and serum Lcn-2 levels from the start (day 0) to the end of the study (day 5) were measured and shown in Figures 3 and 4, respectively. There were low levels of Lcn-2 in feces at baseline before TNBS treatment. No statistically significant differences were noted in the levels of fecal Lcn-2 on day 0 among groups. Overall, Lcn-2 levels were elevated in each of the TNBS-treated group (groups 3 and 4), although there was a spread of Lcn-2 level, due to the inherent variability of the model. On day 1, statistically significant differences in the levels of fecal Lcn-2 were noted between the PBS-treated vehicle control group (group 1) and 30% ethanol-treated vehicle control group (group 2) when compared with the TNBS-treated groups (groups 3 and 4; Figure 3). In the 30% ethanol-treated vehicle control group (group 2), there was a slight elevation in Lcn-2 fecal levels on day 1 compared with the PBS-treated vehicle control group (group 1). This increase is likely related to the minimal mucosal irritation of the ethanol used as a vehicle. However, by day 2 and thereafter, Lcn-2 fecal levels in the 30% ethanol-treated vehicle control group returned to those observed in the PBS-treated vehicle control group. A statistically significant and clear differentiation in Lcn-2 fecal levels between TNBS-treated and vehicle-treated control mice was most noticeable on days 2 and 3. In the TNBS-treated groups (groups 3 and 4), there was a noticeable increase in Lcn-2 fecal levels, and this increase was most pronounced on day 2 (Figure 3). On day 3, the differences reached statistical significance only for the TNBS-treated recovery group (group 4) when compared with the PBS-treated vehicle control group (group 1) and 30% ethanol-treated vehicle control group (group 2; Figure 3). On day 4, no statistically significant differences were noted in the levels of fecal Lcn-2 among the 4 groups.
Fecal lipocalin-2 levels over time (days 0–5).
Serum lipocalin-2 levels over time (days 0–5).
Serum Lcn-2 levels were measured at two time points, on days 2 and 5. Compared with the vehicle control groups, the TNBS-treated groups (groups 3 and 4) showed statistically significant differences in the levels of serum Lcn-2. However, there was high variability in the data within each of these groups (Figure 4). On day 2, there was a statistically significant difference between the 30% ethanol-treated vehicle control group (group 2) compared with the TNBS-treated group (group 3; Figure 4). On day 5, there was a statistically significant difference between 30% ethanol-treated vehicle control group (group 2) compared with the TNBS-treated group (group 3) and TNBS-treated recovery group (group 4; Figure 4). The mean Lcn-2 values in the TNBS-treated groups decreased with time, and day 5 levels were lower than those seen on day 2.
Fecal and serum Lcn-2 levels for the TNBS-treated recovery phase (group 4) are shown in Figures 3 and 4, respectively. The data reflect gut mucosal recovery after the induction of colitis. For fecal Lcn-2 levels, the average levels were elevated on days 2 and 3, began to decline on day 4, and plateaued on day 5 (Figure 3). This decrease may have been due to the premature death of 2 mice on days 3 and 4 which had significant colitis. Possible causes of death include diarrhea, dehydration, and decreased food intake leading to body weight loss and wasting. The spike in fecal Lcn-2 levels from days 5 to 12 (Figure 5) was due to the sudden worsening of health condition of a third mouse which was euthanized moribund on day 12 due to significant weight loss and associated poor body condition and moribundity. Subsequently, there was a significant drop in Lcn-2 fecal levels on day 20 which continued to decline until the end of study. These dramatic changes were not observed in the serum Lcn-2 levels, which only show a steady decline in Lcn-2 levels over time (Figure 5).
Fecal and serum lipocalin-2 levels during gut mucosal healing.
Correlation among Gut Inflammation, Fecal Lcn-2 Levels, and Body Weight Changes
The correlation between histopathologic severity grades of colitis (regardless of the group) and both fecal Lcn-2 levels and body weights were examined. The Spearman’s correlation between the histopathologic scores and fecal Lcn-2 levels was high (.81, p < .0001) on the day the respective group animals were euthanized on day 5 (Figure 6). As the severity of histopathologic inflammation increased, the fecal Lcn-2 levels also increased. Also, fecal Lcn-2 levels were elevated at mild (grade 2) and higher grades of inflammation severity score. For animals in groups 1 to 3, which were euthanized on day 5, the strongest correlation was seen between the histopathologic inflammation score and the day 2 body weights with the Spearman’s correlation coefficient of −.82, p < .0001 (Figure 6).
Temporal changes in fecal lipocalin-2 levels and correlation between inflammation histopathologic score and body weight change on day 2.
Discussion
Animal models are critical not only to test novel biomarkers but also to optimize methods of biomarker detection and assay development. In the present study, we investigated the usefulness of fecal and serum Lcn-2 as a sensitive and noninvasive biomarker of colitis and mucosal healing in the preclinical mouse model of TNBS-induced colitis and CD. IBD is a complex, multifactorial disorder characterized by chronic relapsing intestinal inflammation, the pathogenesis of which involves genetic factors, epigenetic factors, environment, microbiota, and immune response (Loddo and Romano 2015). The immune response to hapten in the TNBS model depends on T-cell recognition, expansion, and cytokine release. Mucosal immune dysregulation and inflammation occur with excessive TH1 cell response. The TNBS model is commonly used to study the pathophysiology of colitis and CD in which elevated levels of proinflammatory cytokines including IL-12, IFN γ, and TNF-α are seen (Loddo and Romano 2015). As demonstrated previously, the TNBS model is often associated with high morbidity and mortality when a high dose of TNBS is used (Radi et al. 2011). Therefore, to minimize mortalities in our study, we used a lower dose of TNBS. In addition, because susceptibility to TNBS colitis varies between different strains of mice, we used BALB/c mice, which have intermediate susceptibility to colitis and are unlike the SJL mice, which are known to be highly susceptible to colitis (Te Velde, Verstege, and Hommes 2006; Radi et al. 2011). No mortalities were observed in the first 3 days following dosing. We began seeing approximately 12% mortality in the TNBS-treated mice by day 5.
The recovery group experienced mortality of 12%, 25%, 25%, and 37% on days 4, 5, 6, and 12, respectively. No further decline in the mortality was noted in the recovery groups after day 12. Thus, the mortality during the first 6 days in our study was lower than that reported previously, where a mortality of up to 33% occurred on days 4 and 5 (Radi et al. 2011). An approximately 20% to 30% mortality rate is not uncommon, as a TNBS dose that induces colitis and can be close to the ED50 (Scheiffele and Fuss 2002).
The TNBS-treated groups had the most significant body weight loss on day 2 in our study and ranged from 10% to 15% with the highest reduction from baseline noted in the recovery group. Weight loss of up to 20% to 30% by day 7 can be seen in the TNBS model (Te Velde, Verstege, and Hommes 2006). The vast majority of mice showed significant recovery and started gaining body weight on day 3 and continued to gain weight until the end of study. This body weight gain matched the general improvement in clinical scores. The clinical scores of colitis in vehicle-treated control and TNBS-treated groups in our study are similar to those reported in the TNBS model (Radi et al. 2011). Colon lengths do not appear to be sensitive measures to use in the TNBS model. During the recovery phase after day 6, animals started gaining weight, which indicated gut mucosal recovery.
Biomarkers are objective measures of normal or pathologic processes or, in the case of pharmacodynamics markers, of response to therapeutic intervention (DeVoss and Diehl 2014). There is a need for reliable and noninvasive biomarkers for IBD (DeVoss and Diehl 2014). There has been an emerging interest in Lcn-2 as a biomarker of IBD. This is because Lcn-2, also called NGAL, is a highly stable and potent bacteriostatic protein stored in neutrophil granules and released at sites of inflammation (Goetz et al. 2002). Also, Lcn-2 plays a role in the innate immune system by serving as a siderophore-binding protein that prevents bacteria from acquisition of siderophore-bound iron and limits bacterial growth (Flo et al. 2004). In addition, in the inflamed gut epithelium from IBD patients, there are high expression levels of Lcn-2 (Nielsen et al. 1996). Therefore, we investigated the performance of fecal and serum Lcn-2 as a sensitive and noninvasive biomarker of colitis and mucosal healing in a CD IBD model, the TNBS.
Lcn-2 is increasingly and routinely being measured in preclinical and clinical laboratories as a serum and urine biomarker for the diagnosis of acute kidney injury (AKI; Mishra et al. 2005; Haase et al. 2009), which makes it an attractive and readily available biomarker to use in preclinical IBD efficacy models and for monitoring response to IBD therapy in clinical settings. In our study, serum Lcn-2 levels were measurable in the vehicle-treated and PBS-treated control groups and were higher and increased after induction of colitis. This is consistent with data from human patients with CD, where significantly higher serum Lcn-2 levels were noted in colonic CD than in ileal or ileocolonic CD (Yesil et al. 2013). Significantly, higher serum levels of Lcn-2 were observed in patients with active IBD and CD in comparison with those with inactive IBD and healthy controls (Oikonomou et al. 2015). Recently, the role of serum Lcn-2 as a disease activity marker in a phenotypically well-characterized European IBD cohort was investigated. It has been shown that serum levels of Lcn-2 in CD patients are significantly modulated by IBD-associated IL 23R polymorphisms (Stallhofer et al. 2015). In our experiment in a preclinical model, there was a significant variability within each of the TNBS-treated groups and only a 10-fold change in serum Lcn-2 levels between vehicle-treated control groups and animals sustaining severe colitis. This lack of dynamic range and sensitivity for low-grade colitis reduces the utility of serum Lcn-2 as a reliable serum biomarker for colitis, at least in the TNBS model.
In our study, fecal Lcn-2 was more than 10,000-fold elevated in mice with colitis and was a much more sensitive biomarker compared with its serum counterpart. Our data are consistent with other data in the DSS-induced colitis model, where fecal Lcn-2 was demonstrated to be a sensitive and broadly dynamic biomarker for intestinal inflammation (Chassaing et al. 2012). We found fecal Lcn-2 levels to be more sensitive than those in the serum levels possibly due to localized inflammatory response in the colon and subsequent release of Lcn-2 by granulocytes at the site of inflammation. There is known variability in IBD models among different institutions and vivaria, and models of chemically induced colitis have a higher degree of variability than genetic models (DeVoss and Diehl 2014). Although it is possible that fecal Lcn-2 levels could be directly proportional to the degree of intestinal damage and inflammation regardless of the IBD model, we have not tested this in our experiments. In addition, our data show a strong correlation between the histopathologic scores even at lower grades of inflammation severity and fecal Lcn-2 levels. Although we have not assessed AKI in the mice in our experiment, comorbidities and other pathological manifestations such as AKI, as was reported in rats following TNBS administration (Hosohata, Ando, and Fujimura 2014), need to be considered for biomarker sensitivity. In a study in CD patients with pure colonic involvement, fecal Lcn-2 levels strongly correlated with CD Endoscopic Index of Severity (CDEIS) and were significantly higher in patients with active CD than in patients with inactive CD (Buisson et al. 2014). Furthermore, fecal Lcn-2 levels declined as mucosal healing occurred providing another avenue to assess in real-time mucosal recovery in IBD models. Finally, in-life parameters, such as body weight loss, had a strong correlation with histopathologic scores of inflammation. By combining fecal Lcn-2 with these in-life measurements, it is possible to test the response to therapeutic modalities to ameliorate colonic inflammation in the TNBS preclinical model with a much higher level of sensitivity.
Footnotes
Acknowledgments
The authors would like to thank Robert Mauthe, Karen Percival, Chris Leonard, and Mary Payette for all of their assistance.
Authors’ Contribution
All authors (HH, JM, CF, RV, SL, and ZR) contributed to conception or design; data acquisition, analysis, or interpretation; drafting the manuscript; and critically revising the manuscript. All authors gave final approval and agreed to be accountable for all aspects of work in ensuring that questions relating to the accuracy or integrity of any part of the work are appropriately investigated and resolved.
Declaration of Conflicting Interests
The author(s) declared no potential conflicts of interest with respect to the research, authorship, and/or publication of this article.
Funding
The author(s) disclosed receipt of the following financial support for the research, authorship, and/or publication of this article: This work was funded and supported by Pfizer Worldwide Research and development.