
Abstract
Histopathologic examination of the testis from juvenile rats is often necessary to characterize the safety of new drugs for pediatric use and is a required end point in male pubertal development and thyroid function assays. To aid in evaluation and interpretation of the immature testis, the characteristic histologic features of the developing rat testis throughout postnatal development are described and correlated with published neuroendocrine parameter changes. During the neonatal period (postnatal day [PND] 3–7), seminiferous tubules contained gonocytes and mitotically active immature Sertoli cells. Profound proliferation of spermatogonia and continued Sertoli cell proliferation occurred in the early infantile period (PND 8–14). The spermatogonia reached maximum density forming double-layered rosettes with Sertoli cells in the late infantile period (PND 15–20). Leptotene/zygotene spermatocytes appeared centrally as tubular lumina developed, and individual tubules segregated into stages. The juvenile period (PND 21–32) featured a dramatic increase in number and size of pachytene spermatocytes with the formation of round spermatids and loss of “infantile” rosette architecture. In the peri-pubertal period (PND 32–55), stage VII tubules containing step 19 spermatids were visible by PND 46. The presented baseline morphologic and endocrinologic information will help pathologists distinguish delayed development from xenobiotic effects, determine pathogenesis when confronted with nonspecific findings, and identify sensitive time points for targeted study design.
Keywords
Introduction
Male rats are sexually mature at 10 weeks of age (Ojeda and Skinner 2006) or at greater than 9 weeks of age (Lanning et al. 2002). Examination of the immature rat testis may be required in prenatal and postnatal development (segment III) and one- and two-generation developmental and reproductive toxicity (DART) studies, male pubertal development and thyroid function assays, juvenile toxicity studies, and when early deaths occur in routine regulatory preclinical safety studies. Depending on the specific study design, microscopic examination of reproductive tissues may be performed for the scheduled termination animals or may be limited to unscheduled deaths. Evaluation of testes from immature rats is routinely required in the male pubertal development and thyroid function assay (a Tier I assay in the Endocrine Disruptor Screening Program [EDSP]) since microscopic examination of the testes at PND 53/54 is an end point (U.S. Environmental Protection Agency [US EPA] 2009). However, evaluation of the testis in this assay is limited to this peri-pubertal time frame, unless there are unscheduled deaths requiring examination of testes from the juvenile period (PND 21–32). In routine regulatory safety studies, animals may be placed on study as early as 6 to 8 weeks of age (during the peri-pubertal time frame), and early deaths of these animals would require examination of testes prior to complete reproductive maturation (i.e., >9 weeks in rats; Lanning et al. 2002).
Pathologists also evaluate immature rat tissues in juvenile toxicity studies, which are becoming a higher priority with recent regulatory changes. Unless waived, a pediatric plan is required for every new drug application (NDA) in North America and for every Marketing Authorization Application (MAA) in Europe when the product has a new indication, active ingredient, formulation, dosing regimen, or route of administration (Food and Drug Administration [FDA] 2007; Barrow, Barbellion, and Stadler 2011; Tassinari et al. 2011). The juvenile toxicity study is one test commonly conducted as part of this pediatric plan, and the FDA (2006) and the European Medicines Agency (EMA 2008) have issued guidance documents addressing their appropriate conduct (EMA 2008; FDA 2006; Bailey and Marien 2011). The juvenile toxicity studies may require the dosing of animals from birth through the neonatal, infantile, and juvenile periods. Dosing very young animals can lead to a high rate of unscheduled deaths, and the pathologist may not have age-matched controls for these early deaths. Given the rapidly changing organ systems during these early developmental time frames, the pathologist must rely on personal experience and published information to detect and interpret xenobiotic-related changes. For this reason, the histomorphologic development of the testis as provided in this report would be useful. At present, a detailed and illustrated morphological review of the normal testicular development is lacking.
To assist with design of targeted juvenile toxicity studies and to appropriately evaluate testes in sexually immature animals, whether this evaluation is a scheduled end point in juvenile studies or prepubertal assays, or is a result of unscheduled deaths in routine toxicity studies, the pathologist must understand the normal development of the testes, be able to identify time-sensitive points in development, and differentiate delayed development from direct toxicity.
In the first part of this article, the characteristic histologic features of the rat testis through the postnatal developmental periods are described and illustrated. The second part of this article provides a summary of the pertinent neuroendocrine dynamics and reproductive physiology occurring during development of the male rat reproductive system. This summary is based on an extensive review of published literature and correlates these changes to morphologic features. This second part may help formulate a proposed mechanism of action when a pathologist is confronted with histopathologic changes in the prepubertal testis.
Part I: Morphologic Study of the Developing Rat Testis
Materials and Methods
Animals
Male Sprague-Dawley rats (Charles River Laboratories, Inc., Crl:CD (SD) rats) ranging from postnatal day (PND) 3 to 61 were used. The rats were randomly selected from the pool of clinically normal rats available in the WIL Research stock colony and did not undergo any treatment regimen. All study procedures and animal handling techniques were performed in compliance with WIL Research’s Institutional Animal Care and Use Committee (IACUC) and the Public Health Service Policy on Humane Care and Use of Laboratory Animals.
Necropsy and Histology
Three male SD rats per day from separate litters, beginning at PND 3 and progressing through PND 61 for a total of 177 rats, were selected for scheduled necropsy. Prior to necropsy, clinical observations and final body weight to the nearest 0.1 g were recorded for each animal. Animals were euthanized by decapitation without anesthesia on PND 3 through PND 12 or by carbon dioxide inhalation on PND 13 through PND 61 and subjected to gross necropsy examination. At the time of necropsy, left and right testes weights were recorded to the nearest 0.1 mg for all animals PND 10 and older. The left and right testes were collected and placed in modified Davidson’s fixative (Latendresse et al. 2002). After approximately 20 to 24 hr, the testes were rinsed and stored in 70% ethanol until histological processing.
The fixed tissues were trimmed, subjected to routine histologic processing, and paraffin-embedded. Two 3-μm cross sections were collected from the upper one-third of the right testis, and the serial sections were stained with hematoxylin and eosin (H&E) and Periodic Acid-Schiff–Hematoxylin (PAS-H). Additional unstained cross sections of the right testis were obtained as needed for immunohistochemistry (IHC).
IHC
Apoptotic spermatogonia were identified using immunohistochemical staining with anti-caspase 3 antibody (abcam, ref. no. ab4051, Cambridge, MA) on a subset of testis sections that either were representative for the various developmental stages and/or had microscopic features of apoptosis. Initial antigen retrieval was accomplished with incubation in mild cell conditioning 1 (CC1) at 95°C (Ventana, CC1, EDTA, pH 8.0, ref. no. 950-500, Tucson, AZ) followed by Inhibitor D incubation for 4 min (Ventana, ref. no. 760-4157, Tucson, AZ). Primary antibody was applied at 1:75 dilution for 24 min on Ventana Discovery XT automated stainer (Tucson, AZ). Primary antibody incubation was followed by incubation with goat anti-rabbit secondary antibody at 1:500 dilution for 16 min (Jackson ImmunoResearch, ref no. 111-066-003, West Grove, PA), followed by Blocker D (Ventana, ref. no. 760-4261, Tucson, AZ), SA-HRP D (Ventana, ref. no. 760-4162, Tucson, AZ), and DAB D/DAB H2O2 D (Ventana, ref. nos. 760-4158 and 760-4159, Tucson, AZ) incubation for 4, 16, and 8 min, respectively. Following rinsing in reaction buffer, Copper D (Ventana, ref. no. 760-4160, Tucson, AZ) was applied for 4 min and rinsed off. Slides were counterstained with hematoxylin for 4 min (Ventana, ref. no. 760-2021, Tucson, AZ), followed by a bluing reagent for 4 min (Ventana, ref. no. 760-2037, Tucson, AZ), and then rinsed with reaction buffer prior to dehydrating and coverslipping.
Sertoli cells were identified using immunohistochemical staining with anti-transcription factor expressed in Sertoli cells (GATA-4) antibody (abcam, ref. no. ab84593, Cambridge, MA) on a subset of testis sections that were representative for the various developmental stages. GATA-4 is predominantly expressed in somatic cells within the testis including Sertoli cells, Leydig cells, and other interstitial cells, and its expression remains constantly abundant in all stages of testicular development from the primordial gonad to the adult testis (Li, Zheng, and Yan 2011). Initial antigen retrieval was accomplished with incubation in mild RiboCC at 95°C (Ventana, RiboCC, citrate based buffer, pH 6.0, ref no. 760-107, Tucson, AZ). Primary antibody was applied at 1:25 dilution for 60 min on Ventana Discovery XT automated stainer (Tucson, AZ). Primary antibody incubation was followed by OmniMap anti-rabbit HRP secondary antibody incubation for 32 min (Ventana, ref no. 760-4310, Tucson, AZ), followed by DAB CM and DAB H2O2 CM incubation for 8 min (Ventana, ref. no. 760-159, Tucson, AZ). Following rinsing in reaction buffer, Copper CM (Ventana, ref. no. 760-159, Tucson, AZ) was applied for 4 min and rinsed off. Slides were counterstained with hematoxylin for 8 min (Ventana, ref. no. 760-2021, Tucson, AZ), followed by a bluing reagent for 4 min (Ventana, ref. no. 760-2037, Tucson, AZ), and then rinsed with reaction buffer prior to dehydrating and coverslipping.
Pathology
Detailed microscopic examination of the prepared testicular sections was performed by a board-certified anatomic veterinary pathologist.
Developmental Time Periods
Five to six developmental time periods, indicated in PNDs, are recognized in the male rat and were referenced when characterizing microscopic changes. These stages include the neonatal (PND 0–7), infantile (PND 8–20), juvenile (PND 21–32), peri-pubertal (PND 33–55), and late pubertal (PND 56–70) periods (Ojeda, Advis, and Andrews 1980; Ojeda and Skinner 2006). These periods loosely correlate with similar developmental stages in humans (Barrow, Barbellion, and Stadler 2011; FDA 2000). For the purposes of this article, we subdivided the infantile period into early infantile (PND 8–14) and late infantile (PND 15–20). An age comparison of developmental stages in rats and humans is summarized in Table 1.
Age comparison of developmental stages in rat and human.
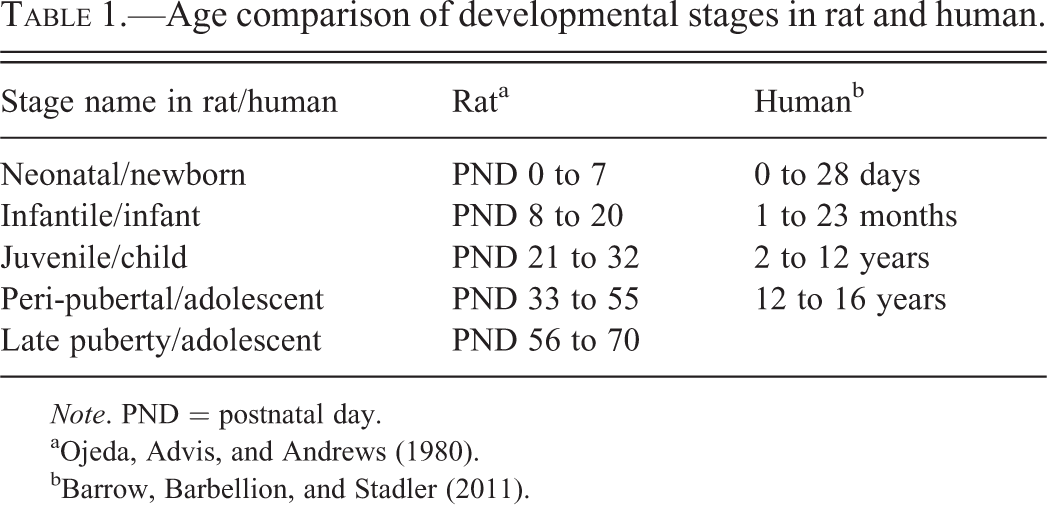
Note. PND = postnatal day.
These developmental stages depend on physiologic developmental changes in a rat and are not defined solely by reproductive changes, except for the peri-pubertal and pubertal periods. The peri-pubertal period is the time spanning the onset of puberty. The onset of puberty (or middle of the peri-pubertal period) is generally regarded to be the time when balanopreputial separation (BPS) occurs, which usually falls between PND 40 and 50 in the rat with an average age of BPS of PND 43 (Stoker et al. 2000). In the WIL Research historical control database, the mean age of BPS for SD rats is PND 45, which falls within the published range. This onset of puberty also corresponds to the time of release of mature sperm into the head of the epididymis (Korenbrot, Huhtaniemi, and Weiner 1977). After the peri-pubertal period, the pubertal process continues for approximately 2 weeks thereafter until the adult testis size and quantity of spermatozoa are reached, generally by PND 70.
Results
Testes Weights
Final body weight and left and right testis weight increased continuously from PND 10 through PND 61 (Table 2; Figure 1). From PND 10 to 18, the increases in final body weight and testis weights were gradual with slopes of 2.24, 5.65, and 5.83 for final body weight, left testis weight, and right testis weight, respectively. From PND 18 to 61, the increases in final body weight and testis weights were accelerated with slopes of 8.65, 39.38, and 39.79 for final body weight, left testis weight, and right testis weight, respectively. The accelerated increase in testis weights following PND 18 generally corresponded with formation of luminal spaces in seminiferous tubules and rapid expansion of the seminiferous tubular diameters after PND 20. From PND 53 to 61, the mean testis weights increased from 1,262.1 mg and 1,248.6 mg to 1,578.0 mg and 1,600.7 mg with slopes of 36.61 and 42.04 for the left and right testis, respectively, indicating continued growth of the testes after PND 53, the end point of the male pubertal development and thyroid function assay.
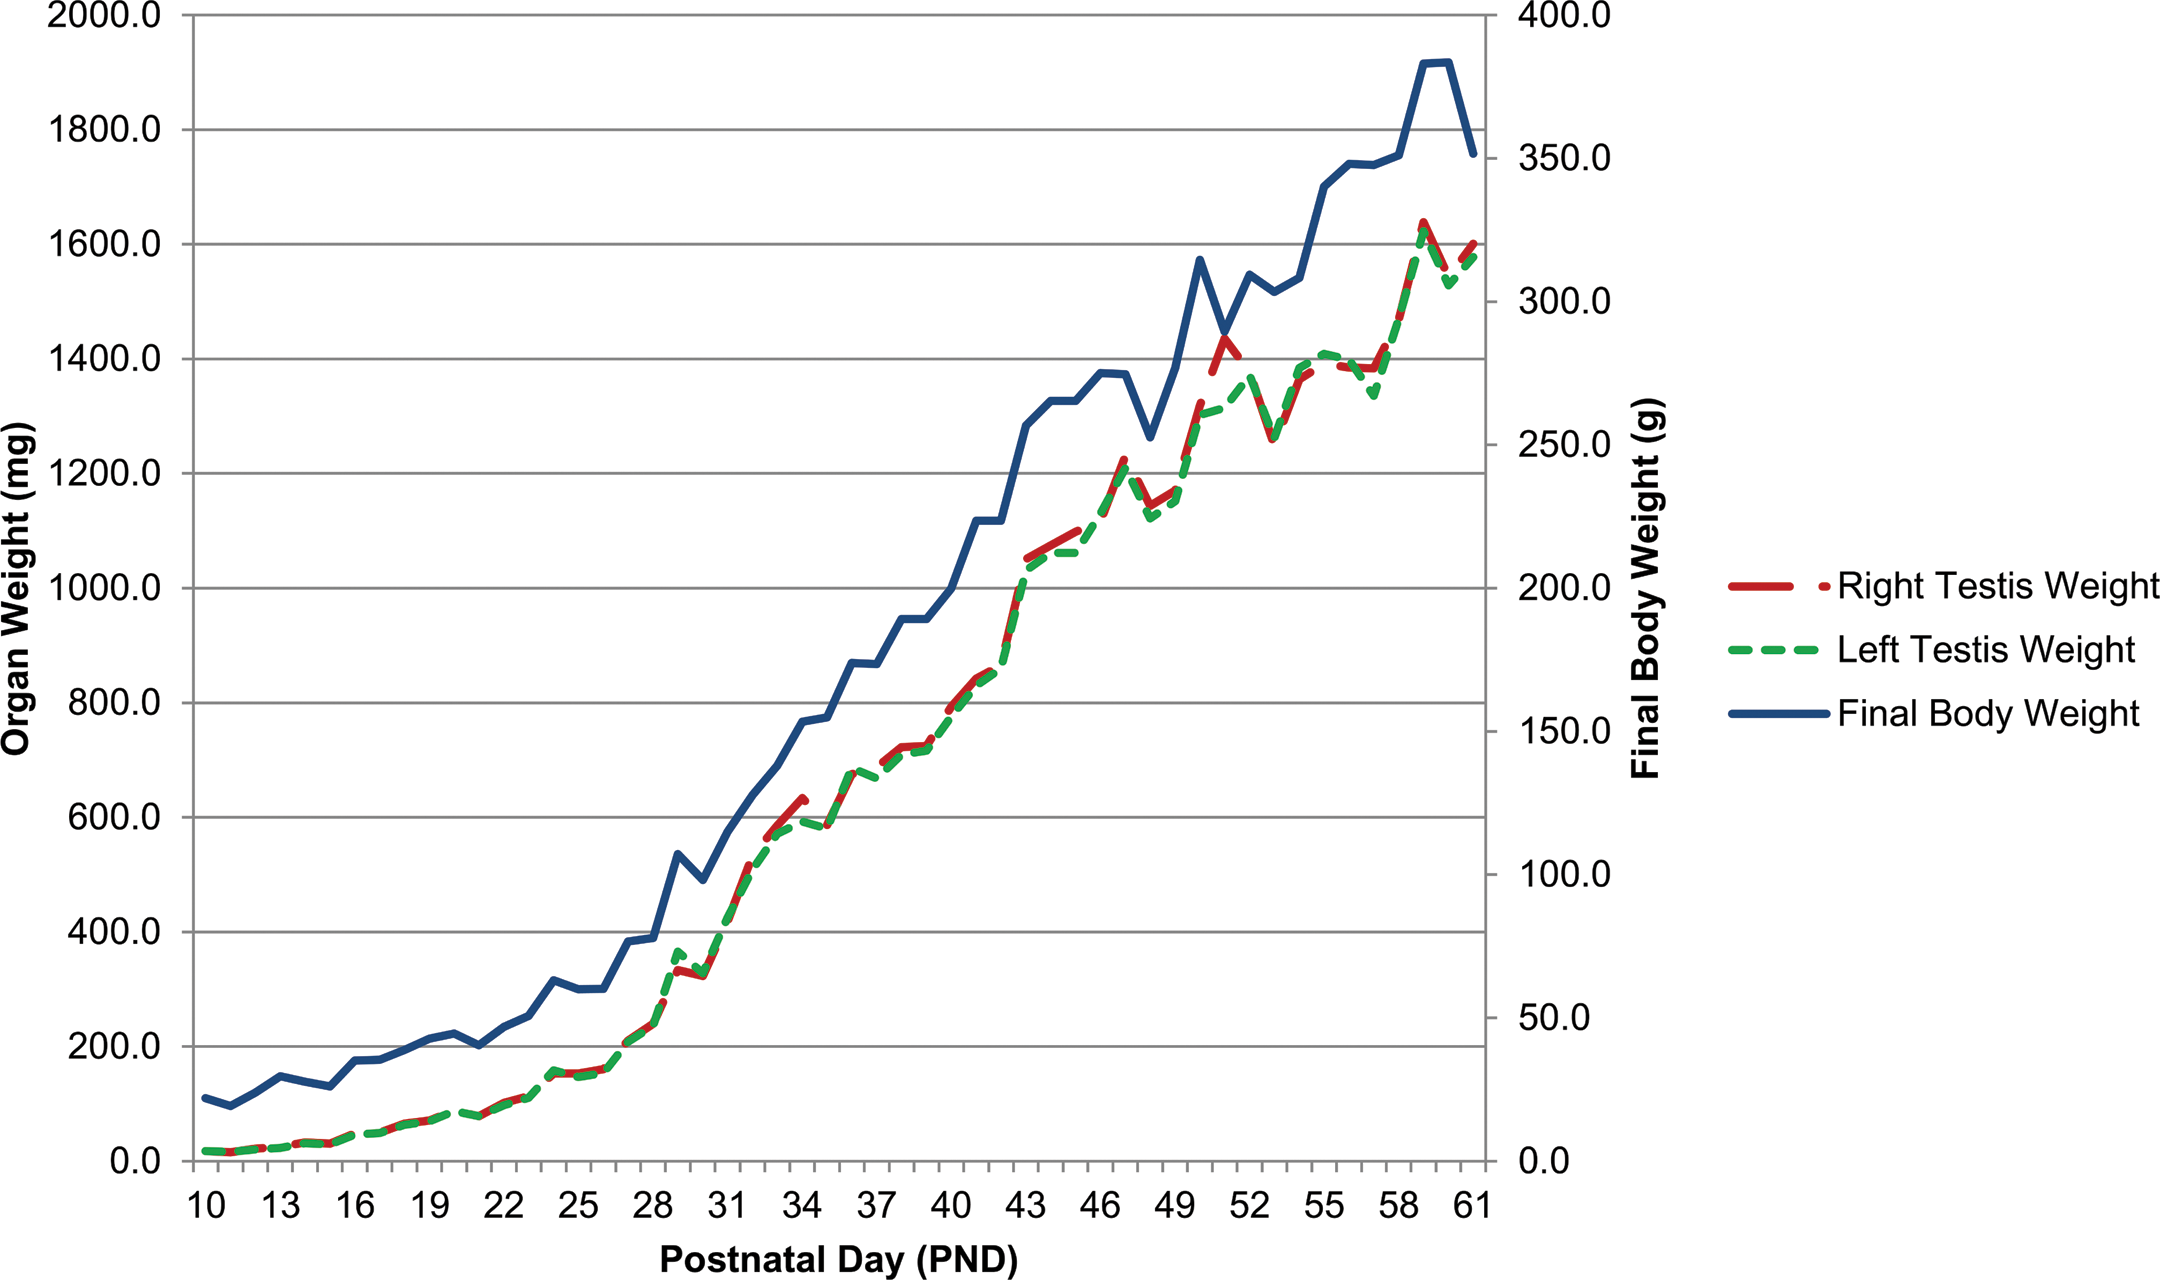
Graphical presentation of mean final body weight (right-hand vertical axis), mean left testis weight (left-hand vertical axis), and mean right testis weight (left-hand vertical axis) in normal Sprague-Dawley rats from postnatal day (PND) 10 to 61. Number of animals per PND = 3.
Final body and testes weights in normal Sprague-Dawley rats from PND 10 to 61.
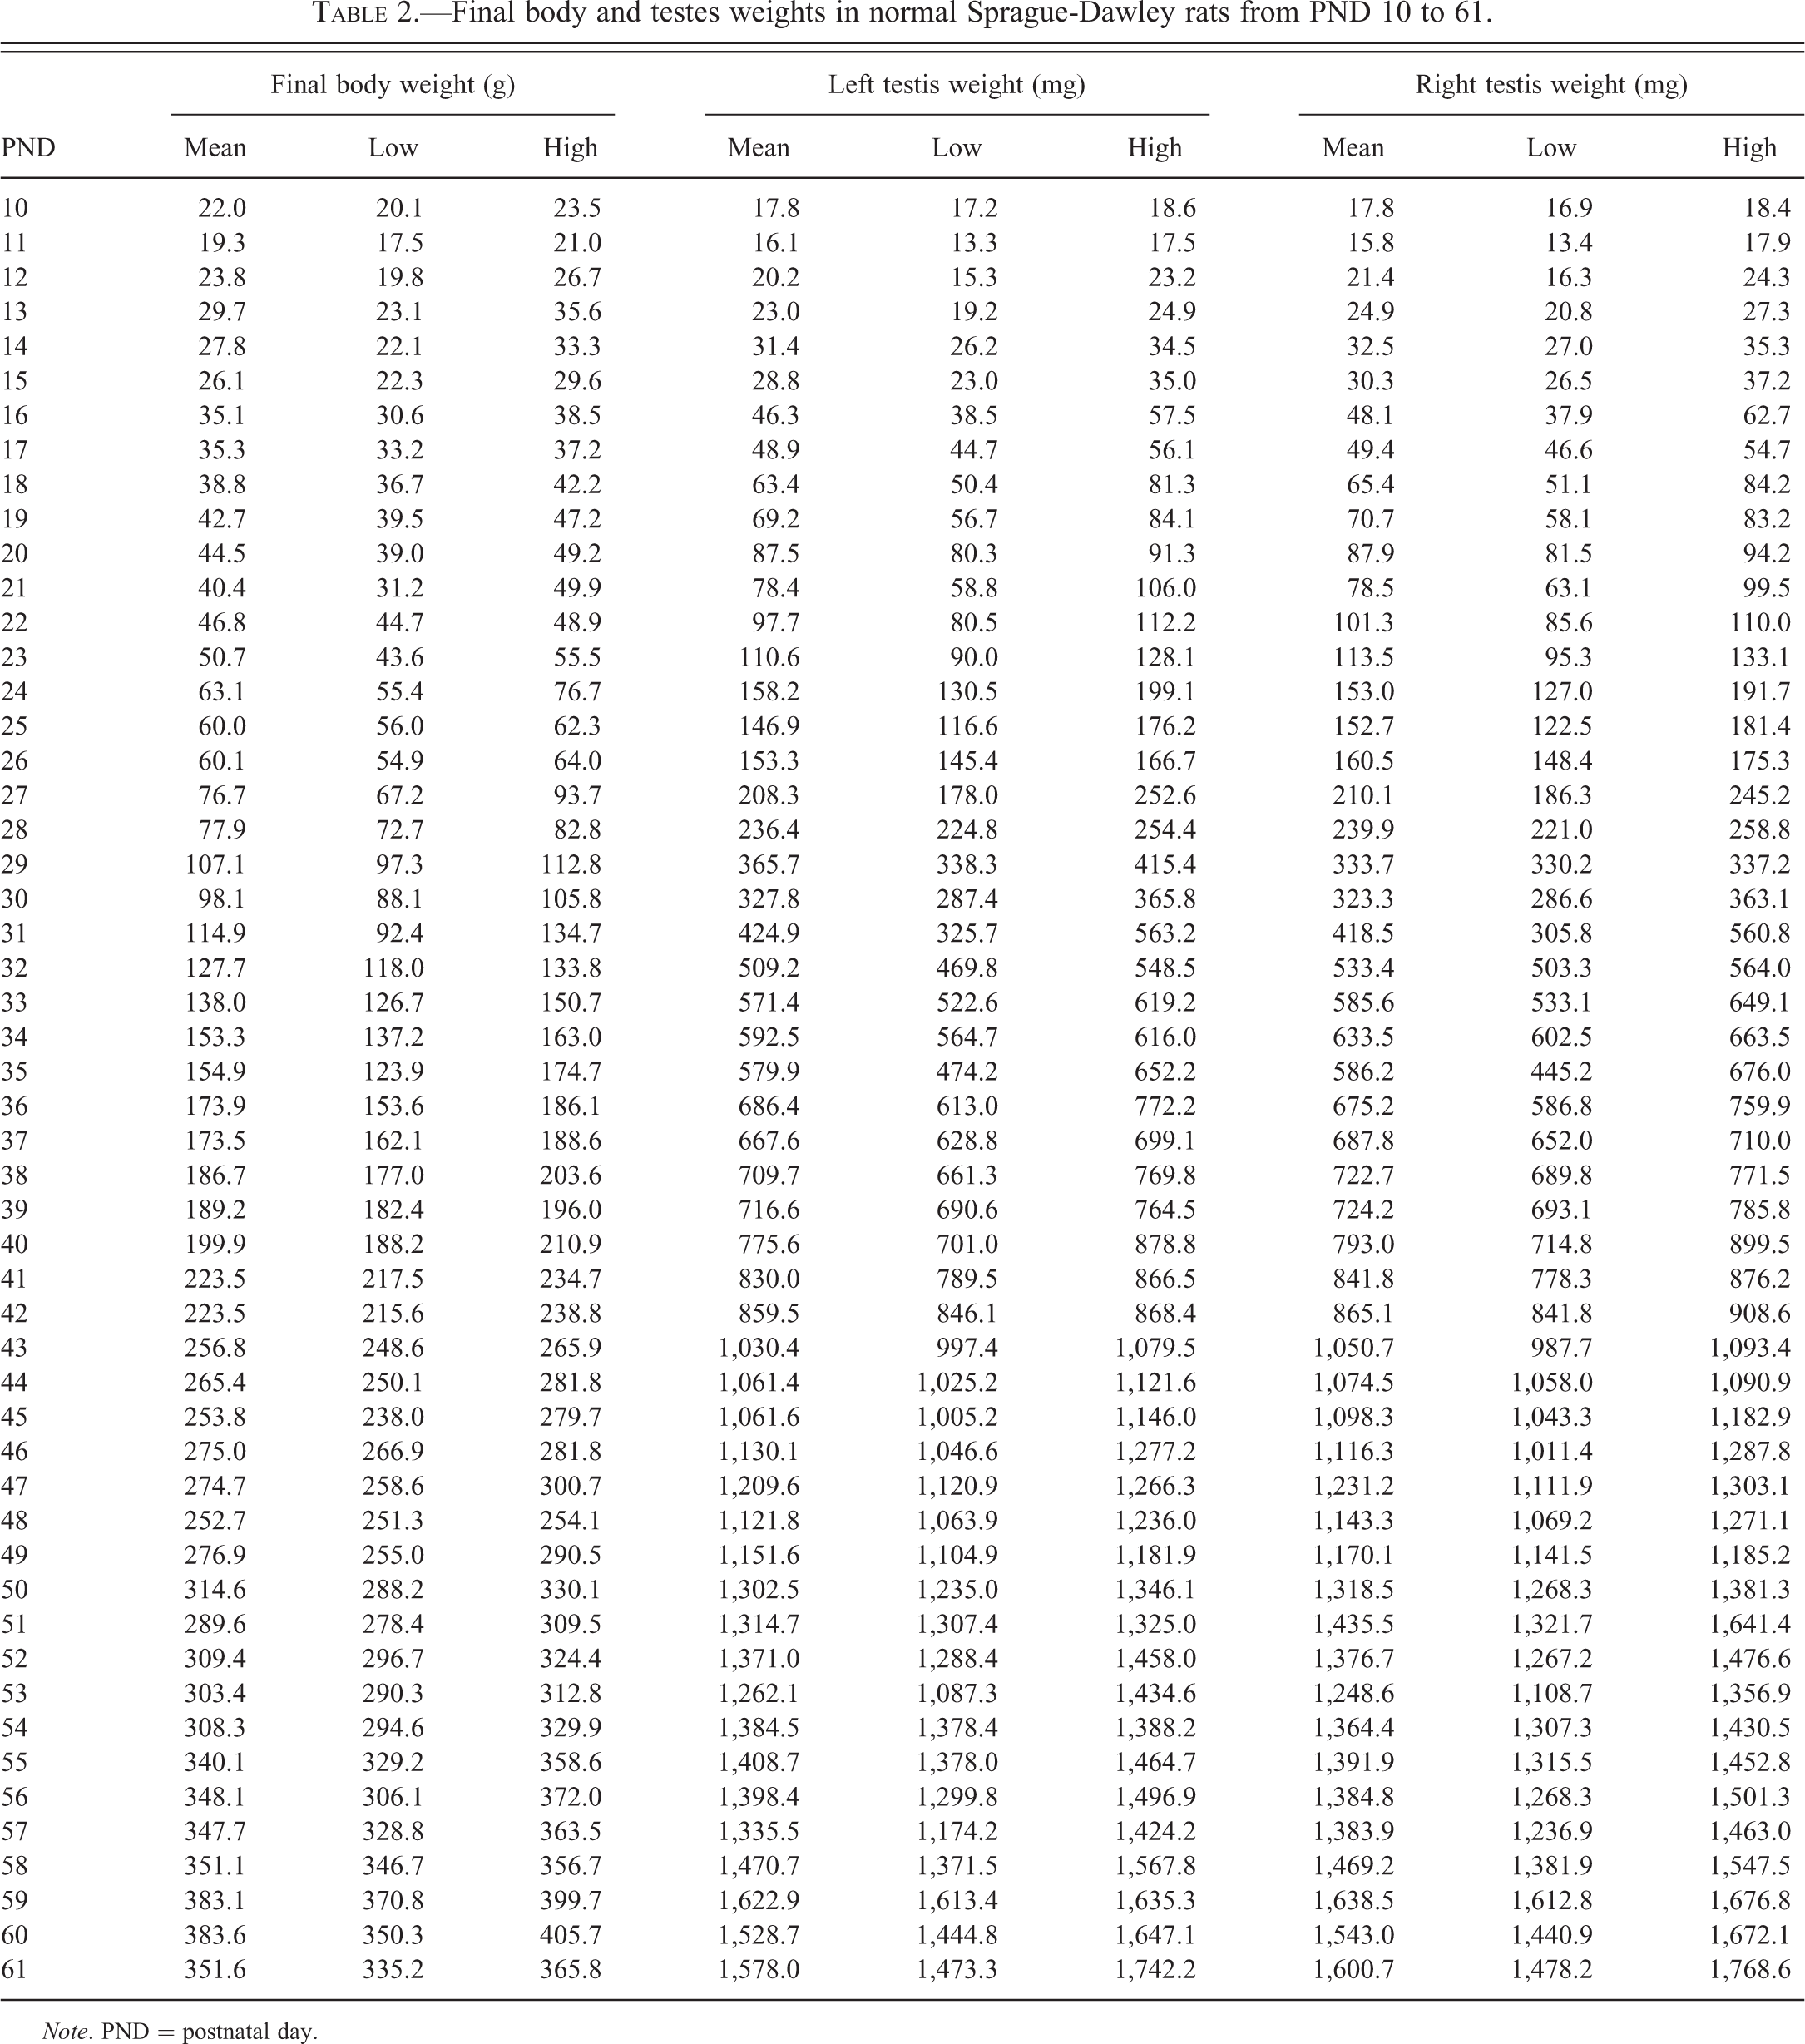
Note. PND = postnatal day.
Mean PND group values and low and high individual animal values for final body weight, left testis weight, and right testis weight at each time point are provided in Table 2.
Microscopic Features of the Developing Testis
The salient features of the morphologic parameters during the neonatal, early and late infantile, juvenile, and peri-pubertal periods are summarized in Table 3.
Features of postnatal testicular development.
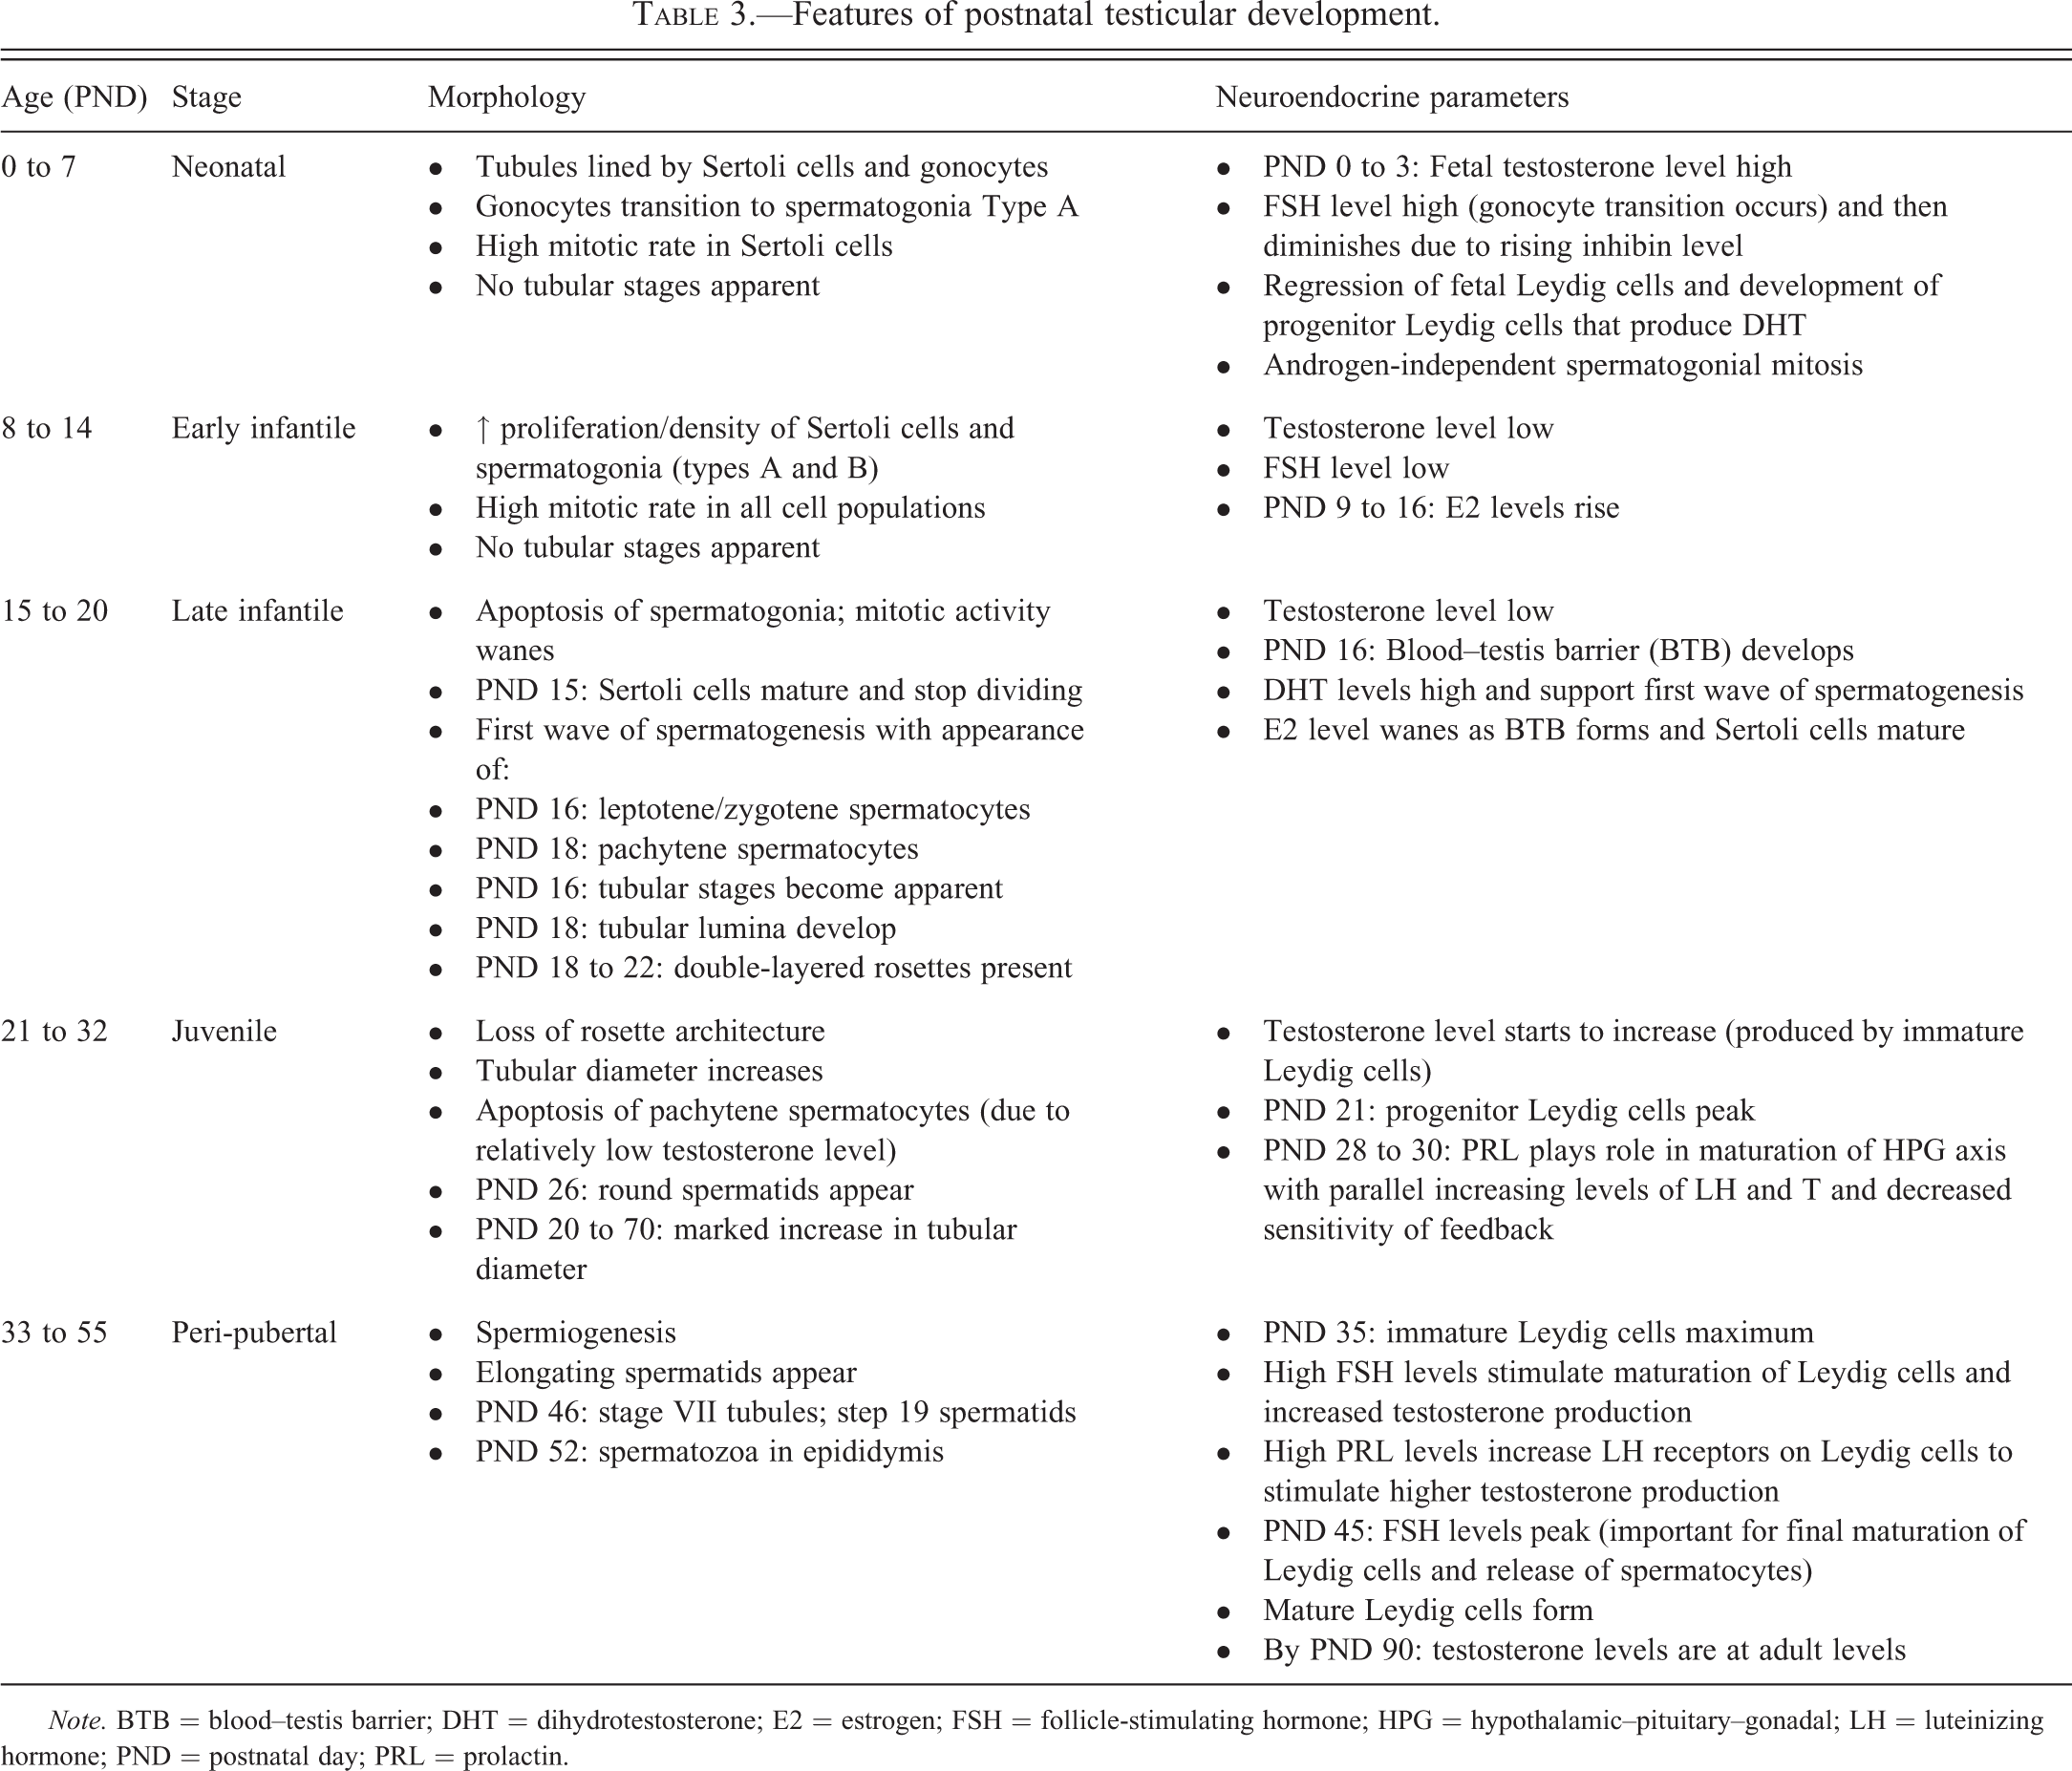
Note. BTB = blood–testis barrier; DHT = dihydrotestosterone; E2 = estrogen; FSH = follicle-stimulating hormone; HPG = hypothalamic–pituitary–gonadal; LH = luteinizing hormone; PND = postnatal day; PRL = prolactin.
Neonatal Period: Birth to PND 7
The neonatal period is the time of (1) transition from fetal gonocytes to mitotically active spermatogonia, (2) a high rate of Sertoli cell mitosis and maturation, and (3) regression of fetal Leydig cells (FLC) and replacement by progenitor Leydig cells (PLC). At PND 3, the testes consist of tubules lined by gonocytes and mitotically active Sertoli cells (Figure 2A and B). The Sertoli cells, which have distinct oval to elongated nuclei, tombstone along the basement membrane. The numerous gonocytes, or fetal germ cells, are mitotically inactive and present as large round cells with a nucleus containing dispersed chromatin and a prominent nucleolus. The nucleus of these gonocytes is located in the center of the tubules. Regressing FLC are mitotically inactive, so mitotic activity in the Leydig cell population is rare. Any mitotic activity during this stage would be due to the development of PLC from mesenchymal stem cells. Aside from mitotic activity, FLC cannot be differentiated histologically from PLC. As the neonatal period progresses, mitotic activity wanes and becomes less evident in the spermatogonial cell population, yet the mitotic rate stays high in the Sertoli cell population.
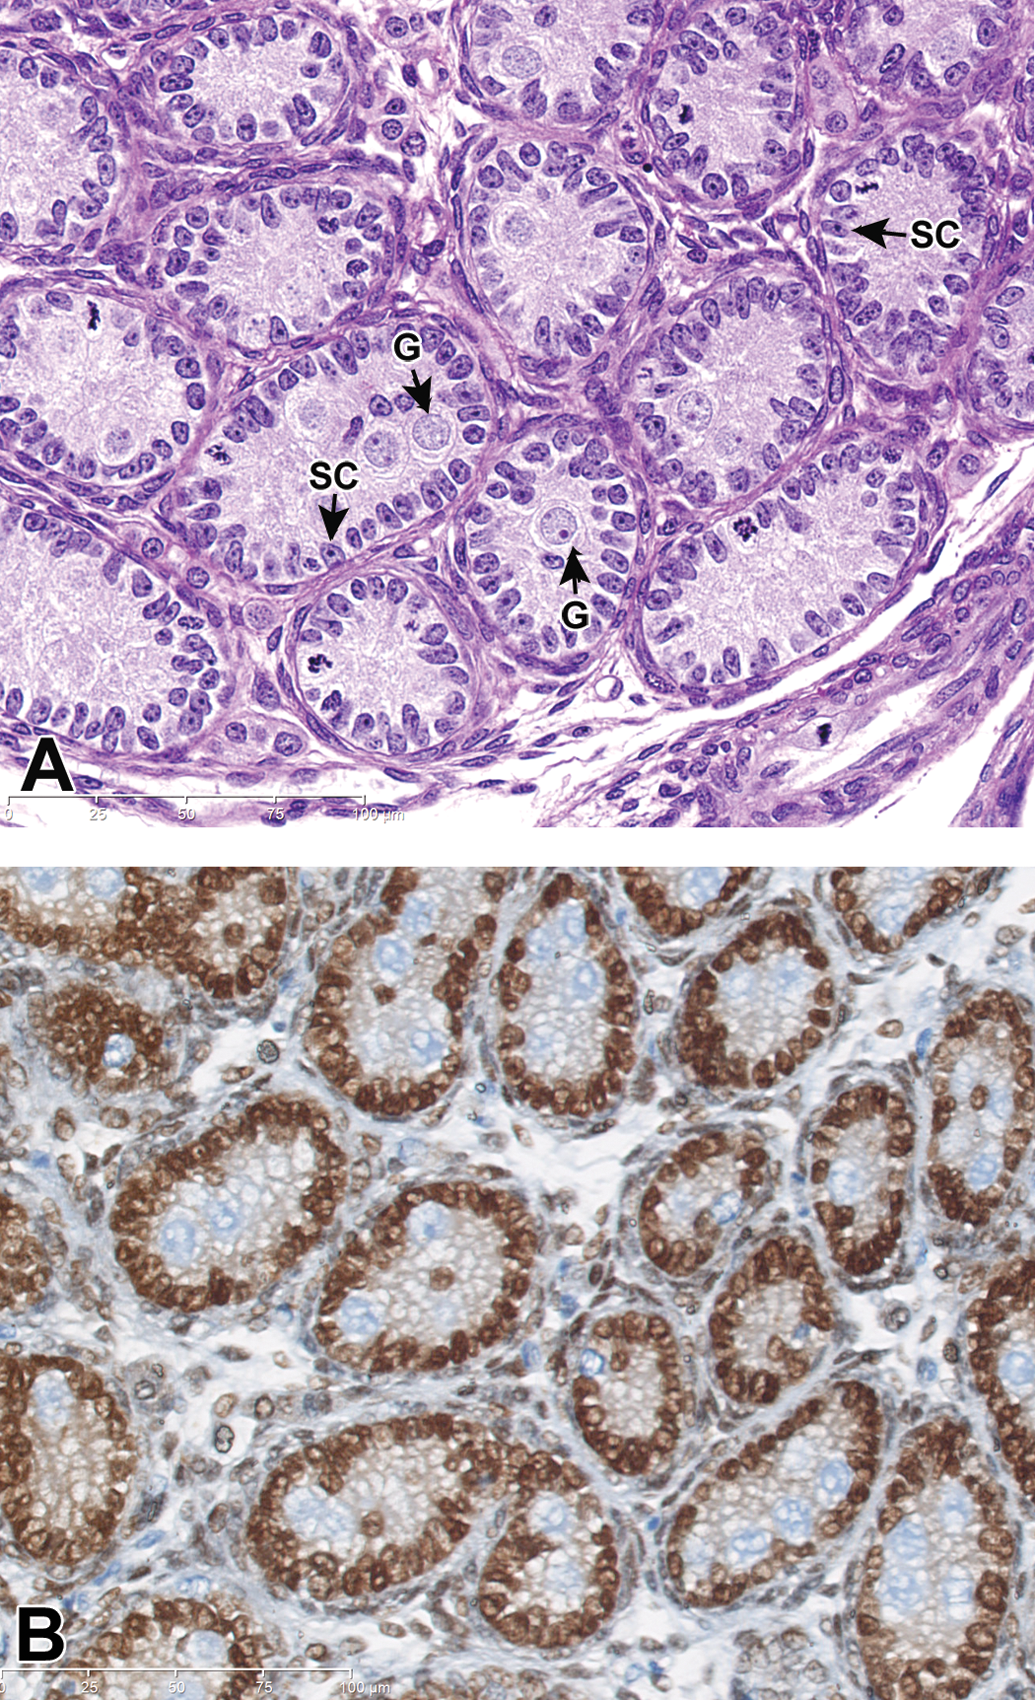
Testis, PND 3 (neonatal). (A) Note the tubules lined by numerous mitotically active Sertoli cells (SC) that tombstone on the basement membrane. Gonocytes (G) are numerous, mitotically inactive, and have a large round nucleus centrally placed within the tubules. H&E stain. (B) The Sertoli cell nuclei (brown stained) reside in a single layer on the basement membrane, and large pale blue nuclei of gonocytes reside in the center of the tubules. Spermatogonia are not apparent along the basement membrane. GATA-4 IHC stain.
Early Infantile Period: PND 8 to PND 14
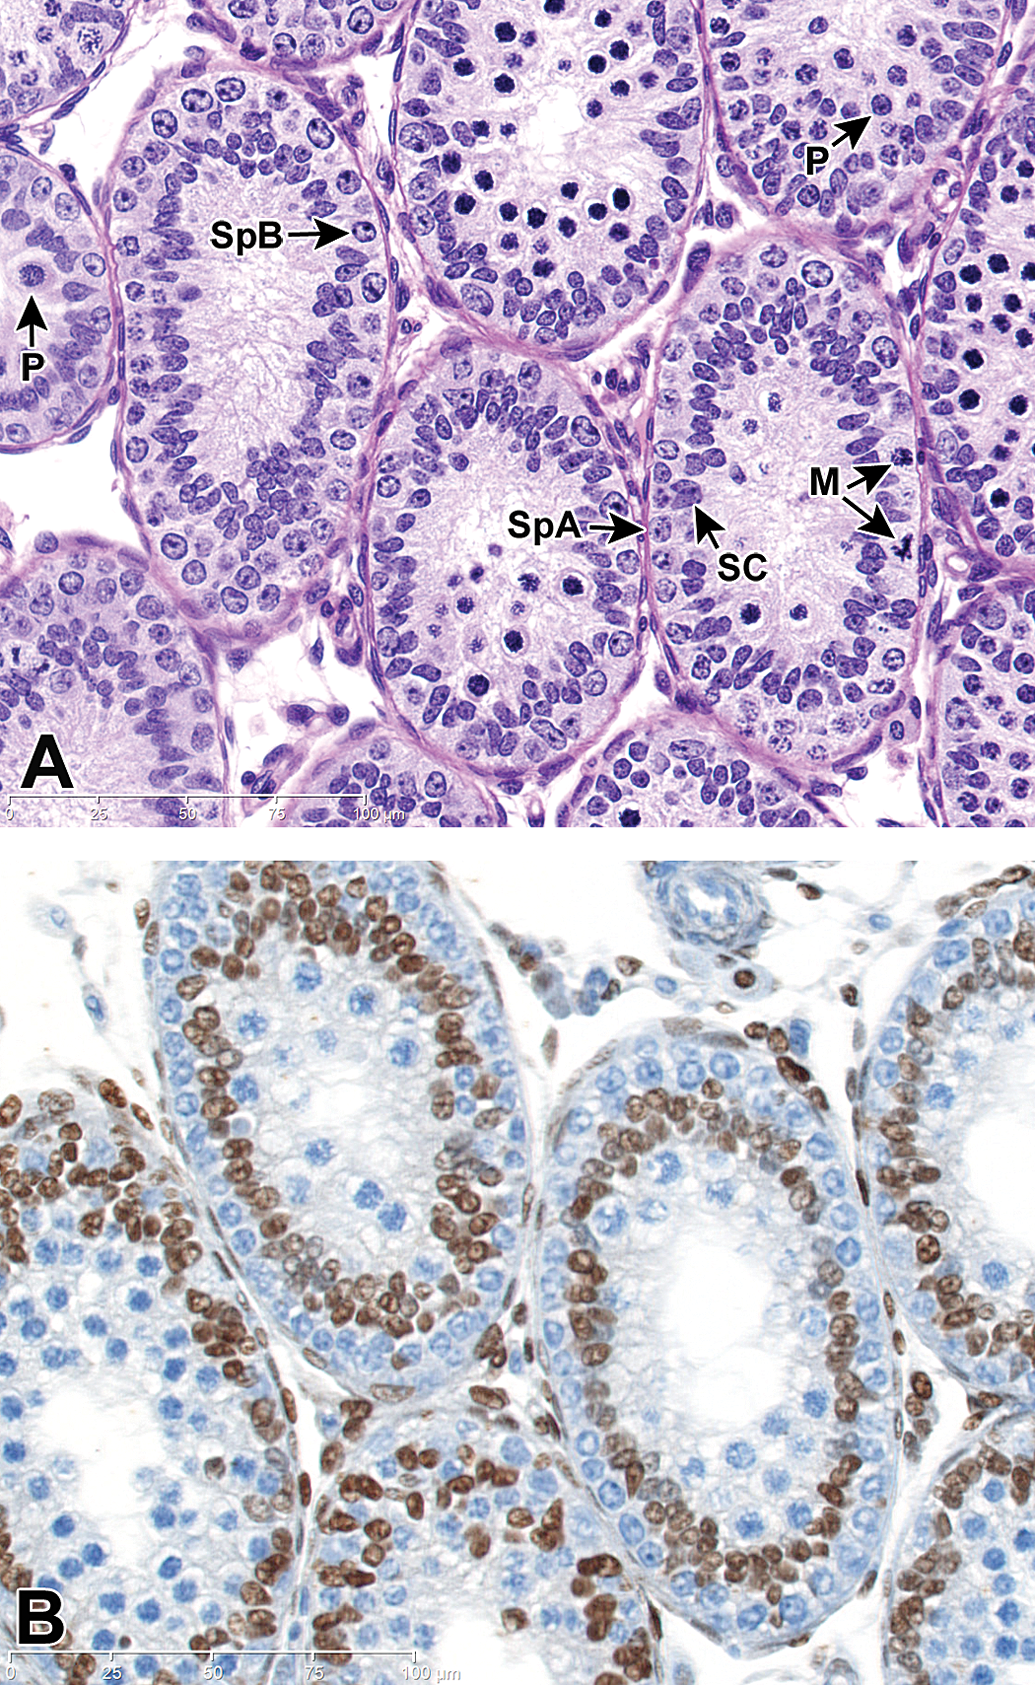
During the early infantile period, the predominant feature of the tubules is rapid expansion of Sertoli cells and spermatogonia (into type A, intermediate, and type B spermatogonia), with proliferation of PLC in the interstitium. This proliferation causes a jumbled pseudostratified appearance to the tubular epithelium (Figure 3A and B). Differentiating Sertoli cells from spermatogonia is based on the features of the nucleus. Sertoli cells are characterized by mid-sized cells that have an elongated nucleus with dispersed chromatin and a prominent nucleolus. Type A spermatogonia have a larger round nucleus with finely stippled to dispersed chromatin and a prominent nucleolus. Type B spermatogonia have a small round nucleus with a peripheral rim of condensed chromatin and coarse stippling. Mitotic activity is pronounced in the spermatogonia, Sertoli cell, and progenitor Leydig cell populations. Fetal gonocytes, characterized by a large round nucleus and central location within the tubules, become progressively sparse and are no longer apparent by PND 10.
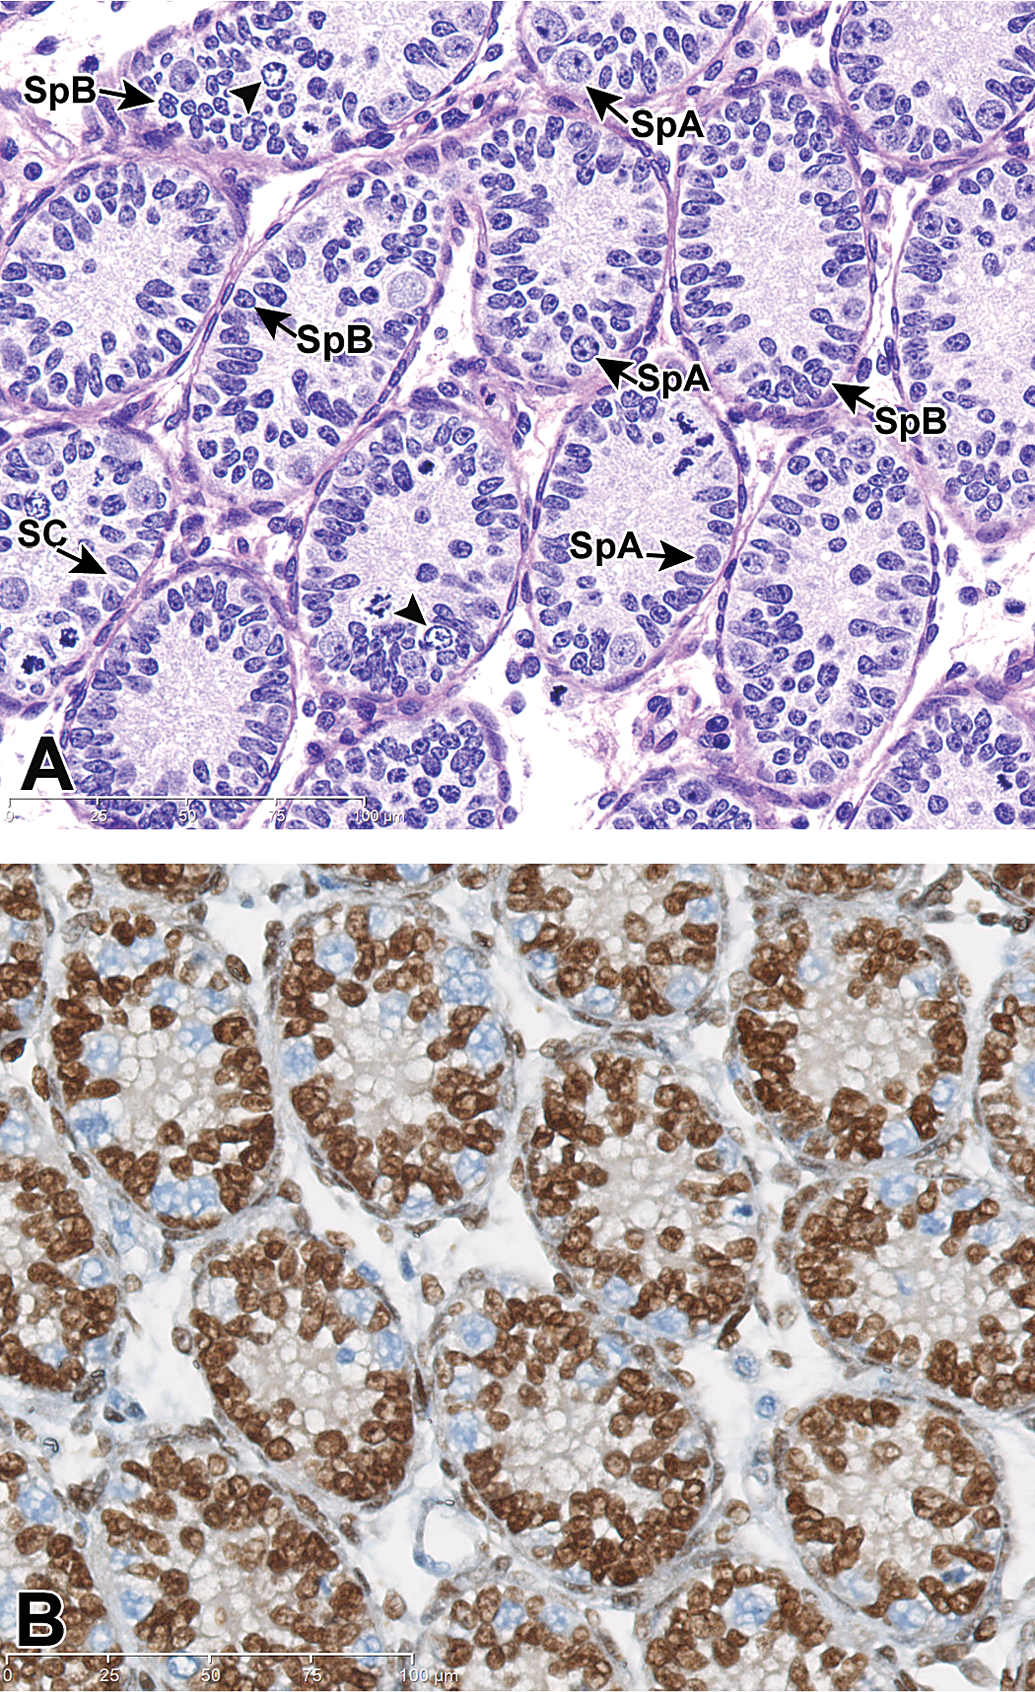
Testis, PND 9 (early infantile). (A) The tubules are lined by numerous Sertoli cells (SC) and spermatogonia, forming a pseudostratified layer. Sertoli cells are recognized as mid-sized cells that have an elongated to polygonal nucleus with dispersed chromatin and a prominent nucleolus. Type A spermatogonia (SpA) have a larger oval nucleus with finely stippled chromatin, and the type B spermatogonia (SpB) have a small round nucleus with a peripheral rim of condensed chromatin and course stippling. Note mitotic figures in spermatogonia, progenitor Leydig cell, and Sertoli cell populations, as well as many cells in prophase (arrowhead). H&E stain. (B) Note the pseudostratified layer of Sertoli cells (brown stained). This pseudostratified appearance is due to rapid expansion of the Sertoli cell population with limited increase in tubular diameter. The pale blue nuclei of spermatogonia are now apparent along the basement membrane of the tubules. GATA-4 IHC stain.
Late Infantile Period: PND 15 to PND 20
The late infantile period is the time when (1) maximum cell density in each tubule occurs, (2) the Sertoli cells cease to divide, (3) tubules start to segregate into stages, and (4) spermatocyte development (onset of meiosis) occurs.
At PND 15, spermatogonia and PLC are still mitotically active and the spermatogonia reach maximum density forming a thick pseudostratified layer with the Sertoli cells. The mitotic rate in the spermatogonial cell population wanes compared to that of the early infantile period, and apoptotic spermatogonia are present in the center of the tubules (Figure 4A). IHC for caspase 3 confirms the apoptosis of spermatogonia during this developmental period (Figure 4B).
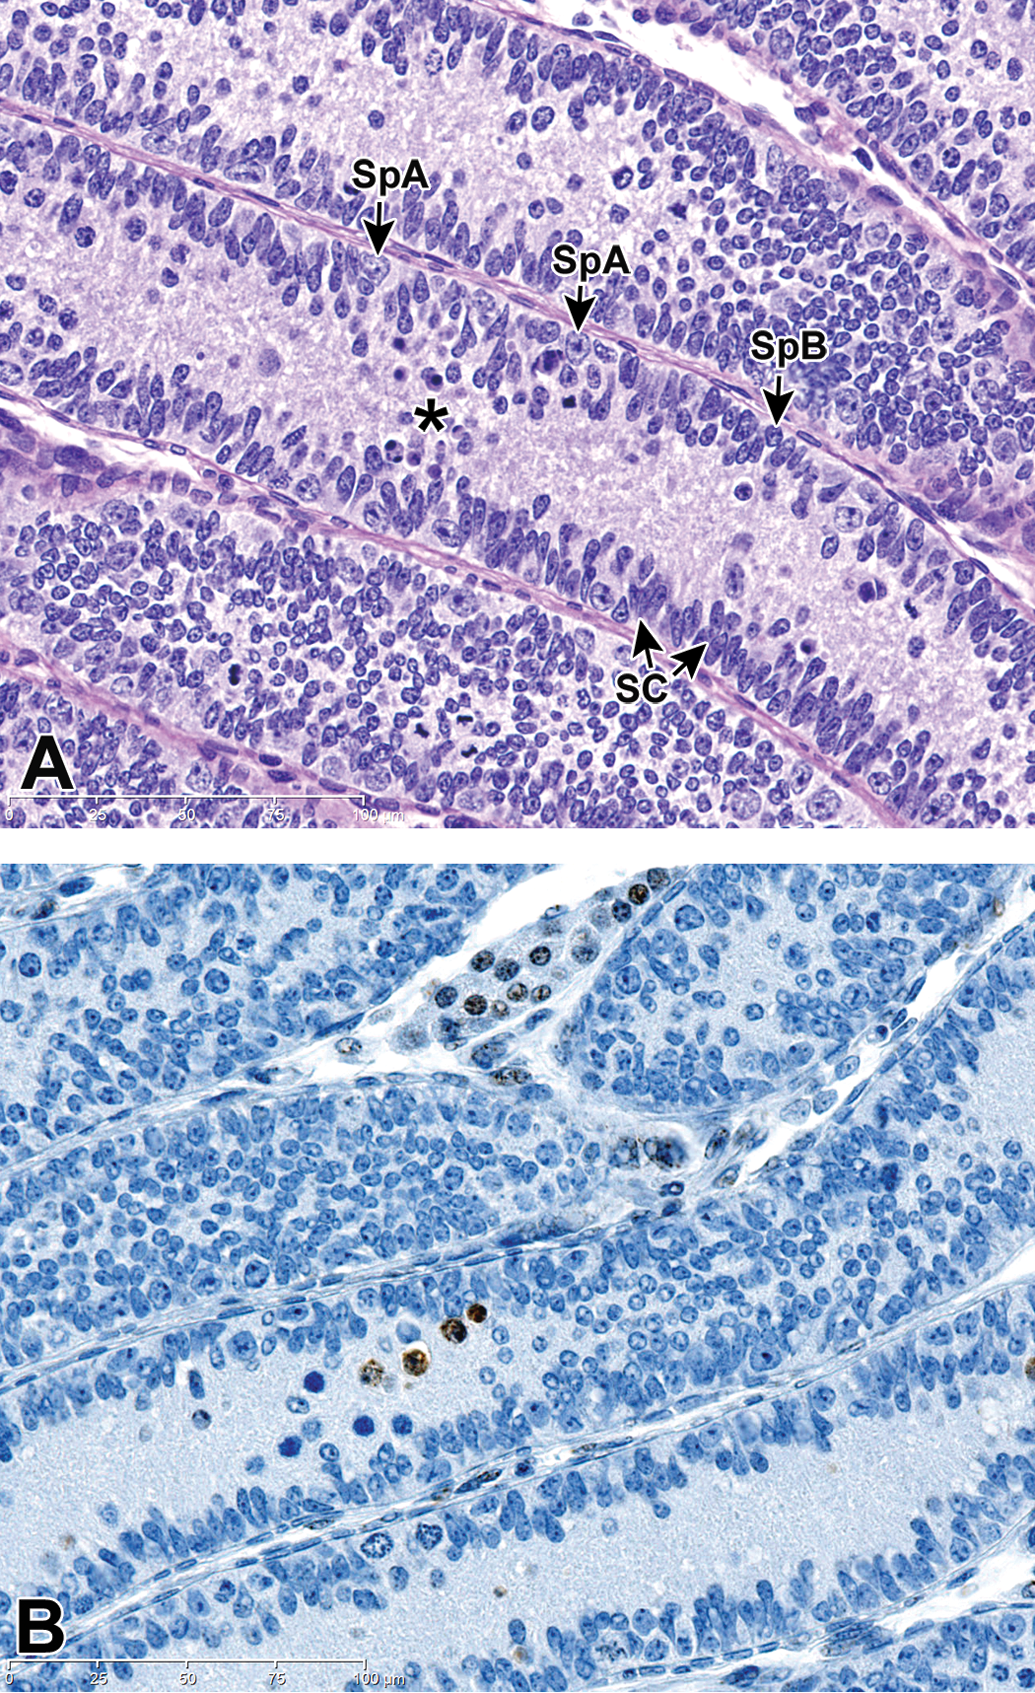
Testis, PND 15 (late infantile). (A) Note maximum density of spermatogonia forming a pseudostratified layer. Apoptosis of spermatogonia, due to overcrowding, is present to a mild degree in tubular lumens (asterisk). SpA = Spermatogonia A; SpB = spermatogonia B; SC = Sertoli cell. H&E stain. (B) Caspase 3 immunohistochemistry was used to highlight luminal apoptotic spermatogonia (brown stained). Caspase 3 IHC stain.
From PND 15 to 18, Sertoli cells stop dividing and spermatocyte development ensues. Preleptotene, leptotene, and zygotene spermatocytes become apparent. Preleptotene spermatocytes are identified by their basilar location in the tubule and widely dispersed, coarsely clumped chromatin. Leptotene and zygotene spermatocytes are recognized by their adluminal location, solidly condensed chromatin, clear cytoplasm, and distinct cell borders. Separation between stages of tubules becomes apparent as some tubules are populated by preleptotene spermatocytes while other tubules are populated by numerous leptotene and zygotene spermatocytes. As soon as spermatocyte development ensues, mitotic activity becomes rare in the spermatogonia cell population (Figure 5).
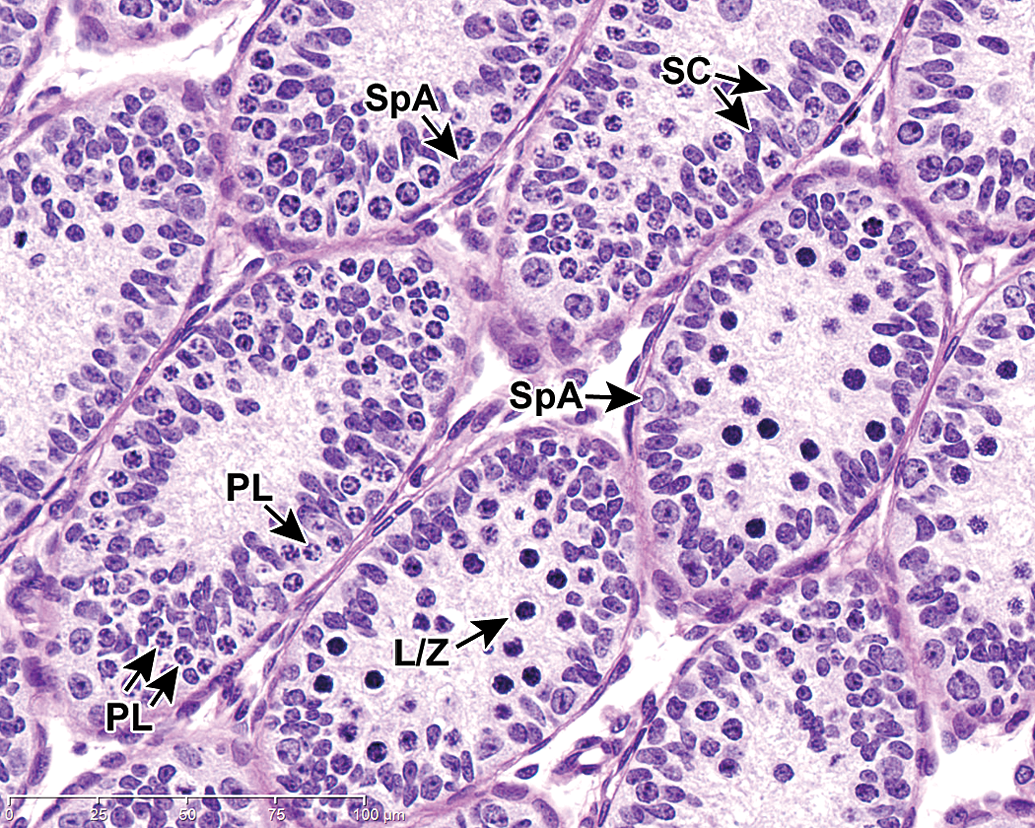
Testis, PND 16 (late infantile). Spermatocyte development occurs and this correlates to the development of a blood–testis barrier (BTB). Note formation of adluminal leptotene and zygotene spermatocytes (L/Z) in some tubules. Other tubules are populated by preleptotene spermatocytes (PL) residing outside the BTB. Tubular stages are recognizable, with some tubules containing leptotene and zygotene spermatocytes, while others contain preleptotene spermatocytes as the most developed spermatogenic cell type. The mitotic rate in the spermatogonia cell population is reduced, and mitoses in the Sertoli cell population has ceased. SpA = Spermatogonia A; SC = Sertoli cells. H&E stain.
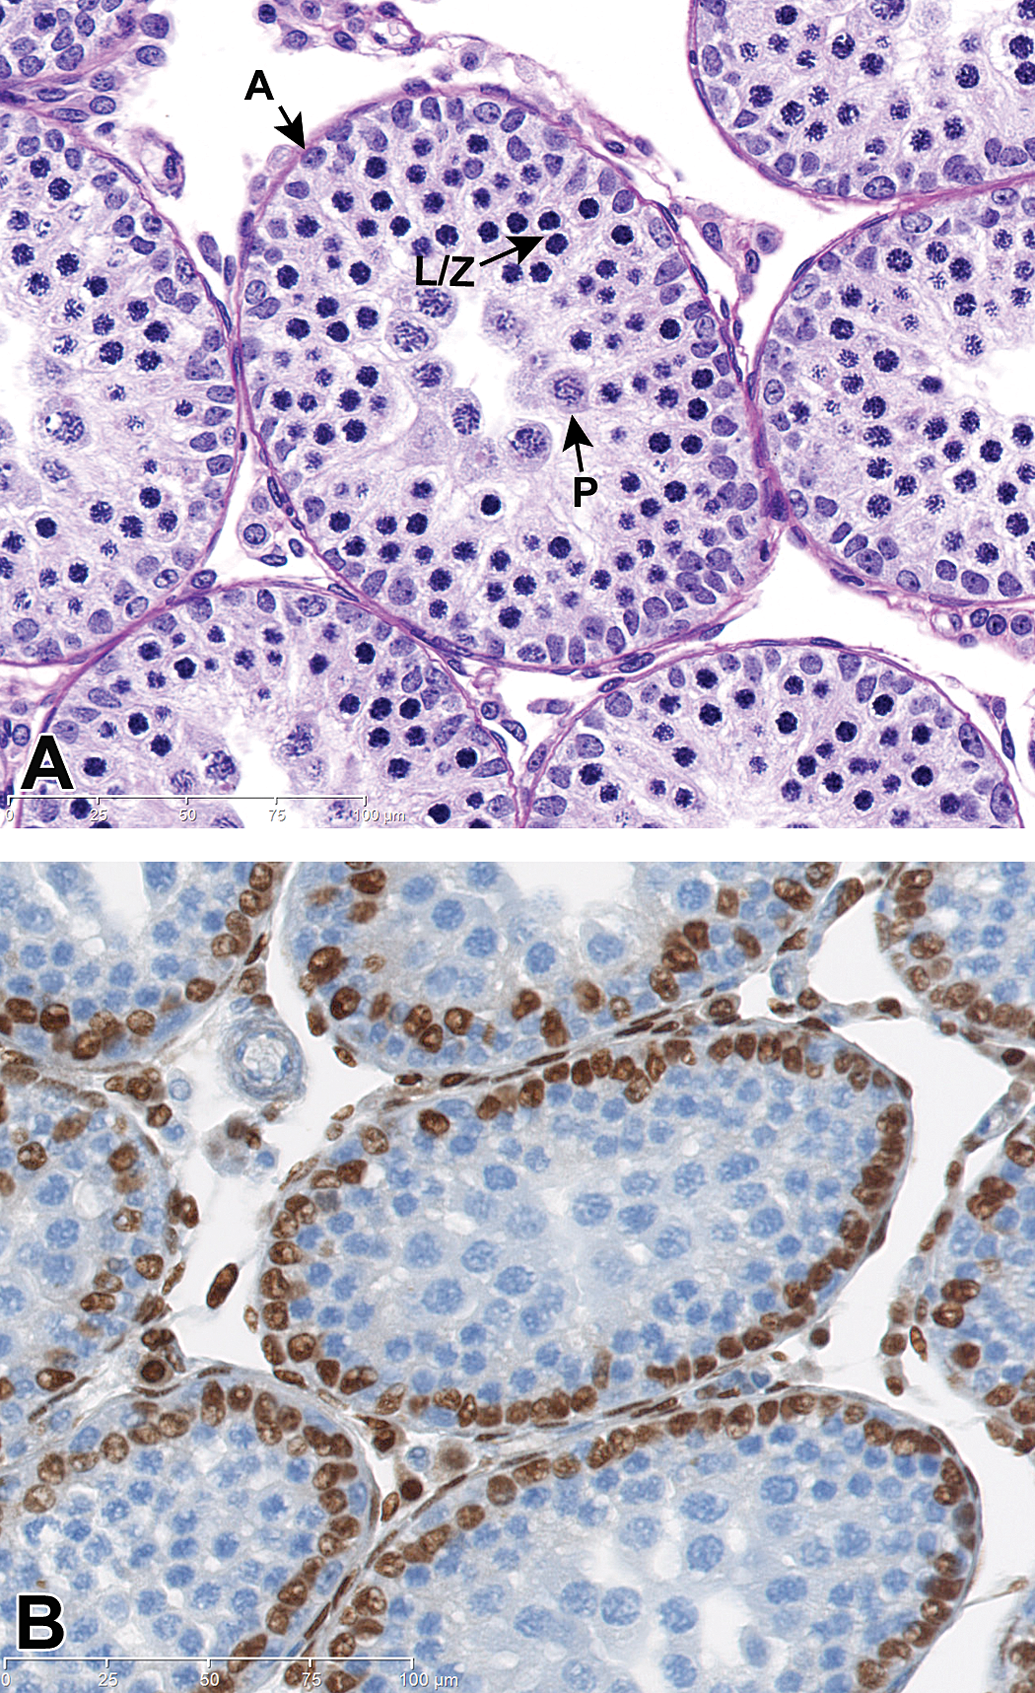
By PND 18, tubular lumina form, as evidenced by a small clear central space within tubules, and pachytene spermatocytes appear. Pachytene spermatocytes are characterized by adluminally placed cells with large round nuclei, nuclear chromatin that is less densely packed than the leptotene or zygotene spermatocytes, eosinophilic cytoplasm, and distinct cellular borders. At this point, spermatogonia and Sertoli cells transition into a distinct double-layered rosette. These tubules are characterized by an outer layer of spermatogonia (types A, intermediate, and type B) and an inner layer of Sertoli cells with oblong nuclei and finely stippled chromatin (Figure 6A and B).
Testis, PND 18 (late infantile). (A) Spermatogonia and Sertoli cells (SC) form a double-layered rosette with an outer row of spermatogonia types A (SpA) and B (SpB) and an inner crowded row of Sertoli cell nuclei. Differences between subtypes of spermatogonia are subtle. Spermatogonia type A have finely dispersed chromatin and type B have a peripheral rim of condensed chromatin. Pachytene spermatocytes (P) appear, and a few mitotically active spermatogonia (M) are still present. H&E stain. (B) The double-layer rosette pattern is striking at this stage and is comprised of an outermost row of pale blue spermatogonia and a more internal layer of crowded postmitotic Sertoli cell nuclei (stained brown). Note the innermost collection of spermatocytes (unstained). Sertoli cells stop dividing at this stage. GATA-4 IHC stain.
The interstitium contains PLC with a smaller population of immature Leydig cells (ILC) that represent the next phase of Leydig cell development. There is no clear morphologic difference between progenitor or ILC in standard H&E-stained sections. Mitotic activity continues within the Leydig cell population.
Juvenile Period: PND 21 to PND 32
The juvenile period is characterized by (1) maintenance of the first wave of spermatogenesis to round spermatids and (2) dramatic increase in tubular diameter. The presence of numerous large pachytene spermatocytes and the formation of secondary spermatocytes (by PND 26) are characteristics of this stage. There is a marked increase in the diameter of the tubules with retreat of the Sertoli cells and spermatogonia into a single layer along the basement membrane (Figure 7A and B). Apoptosis of pachytene spermatocytes is present within scattered tubules (Figure 8).
Testis, PND 25 (juvenile). (A) Pachytene development continues and spermatogonia and Sertoli cells retreat to a single basilar layer as the diameter of the tubule expands. A = Spermatogonia type A L/Z = leptotene/zygotene spermatocytes; P = pachytene spermatocytes. H&E stain. (B) The nuclei of Sertoli cells (brown stained) have retreated to a single outer layer making room for inner layers of spermatocyte development. GATA-4 IHC stain.
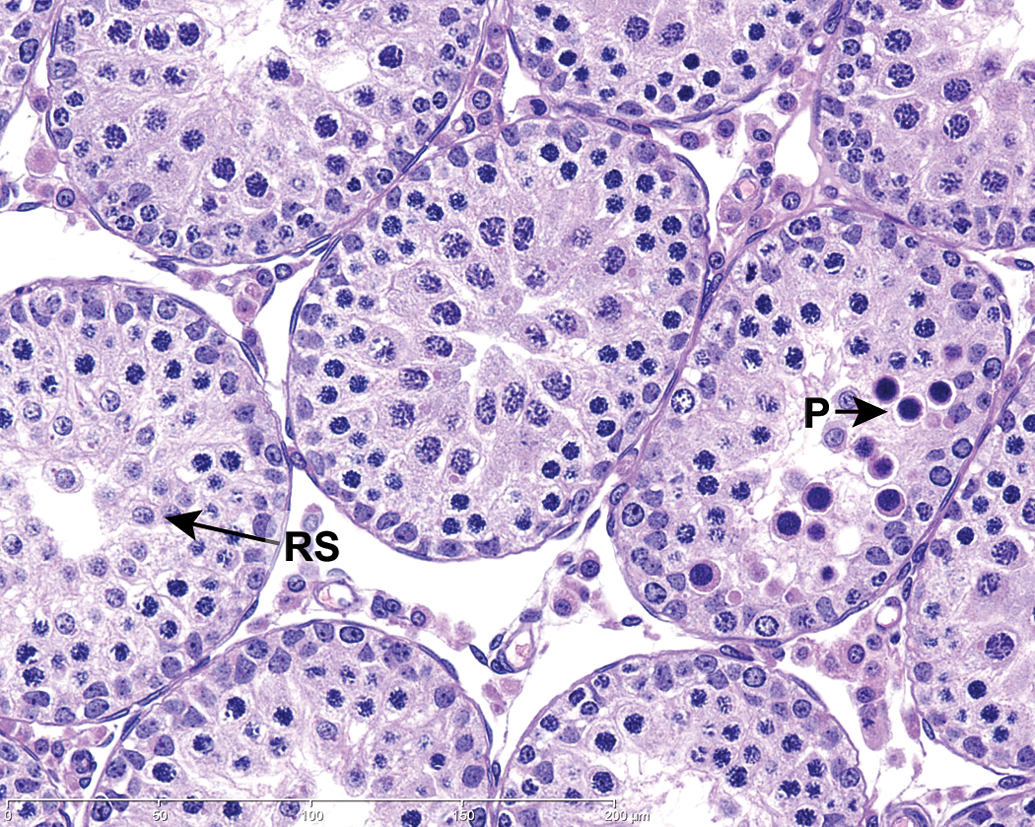
Testis, PND 27 (juvenile). Apoptosis of pachytene spermatocytes is present (P) in one tubule, and round spermatids (RS) are beginning to form in others. H&E stain.
Peri-pubertal Period: PND 32 to PND 55
During the peri-pubertal period, there is active spermiogenesis, as tubular diameter continues to expand and spermatids transition through the 19 steps of development. By PND 46, step 19 spermatids in stage VII tubules are first seen (Figure 9A and B). When step 19 spermatids arise at PND 46, all stages of tubules should be present. However, the appearance of the various tubular stages might vary from that of mature animals due to lower cell numbers, lower density of elongating spermatids, and smaller tubular diameter, when compared to the adult testis.
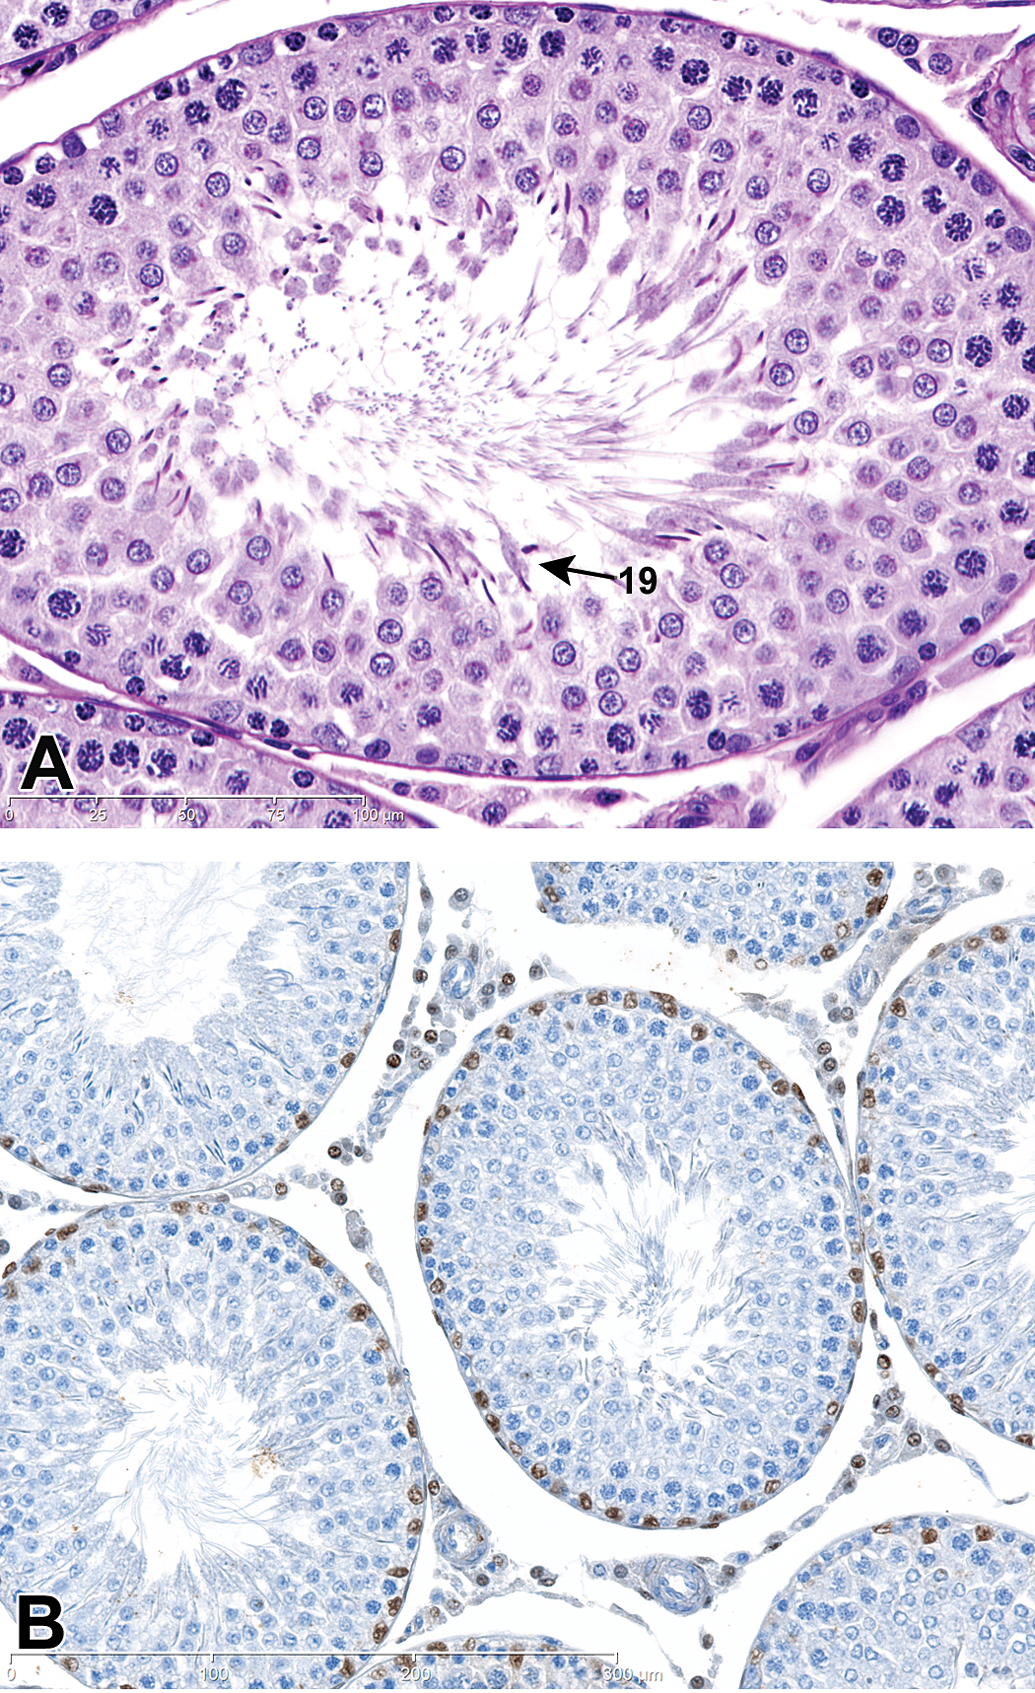
Testis, PND 46 (peri-pubertal). (A) Step 19 spermatids (19) present in Stage VII tubule. H&E stain. (B) The Sertoli cells (brown stained) reside along the basement membrane and are more widely separated and interspersed with spermatogonia (unstained) as the tubular diameter expands, and Sertoli cells are mitotically arrested. GATA-4 IHC stain.
Late Pubertal Period: PND 56 to PND 61
During the late pubertal period, there is continued growth of the testis and morphological features consistent with the appearance of a normal adult testis. Tubular diameters are increased, tubular stages can be recognized by their characteristic cellular associations, and there are readily perceptible increased numbers and density of elongating spermatids.
Part II: Correlation of Morphology to Neuroendocrine Parameters
The hypothalamic–pituitary–gonadal (HPG) axis in the adult rat is responsible for supporting spermatogenesis and is the basis for maintaining endocrine regulatory balance. The hypothalamus, under the control of a variety of neurotransmitters, growth factors, and steroid hormones, produces gonadotropin-releasing hormone (GnRH) that stimulates the pars distalis of the pituitary to produce the following 2 polypeptide gonadotropins: luteinizing hormone (LH) and follicle-stimulating hormone (FSH). LH, acting in concert with prolactin (PRL), stimulates the Leydig cells of the testis to produce androgens. These androgens cross into the seminiferous tubules and bind to cytosolic androgen-binding protein in Sertoli cells. This binding helps concentrate androgen within the Sertoli cell cytoplasm, and this androgen then binds to the nuclear androgen receptor and triggers the Sertoli cell to perform its many functions that support spermatogenesis. FSH acts upon the Sertoli cell to upregulate androgen binding protein, thus ensuring that an adequate concentration of androgens is present and functioning within the Sertoli cells. Turning off gonadotropin secretion is important in maintaining proper endocrine balance. Androgens produced by the Leydig cells enter not only the Sertoli cells but also the circulation where they exert a negative feedback effect on GnRH and LH production at the levels of the hypothalamus and pituitary, respectively. Inhibin, a dipeptide hormone, produced by Sertoli cells executes this same inhibitory effect on FSH secretion from the pituitary. For a more thorough review of the physiology of male reproductive endocrinology, the reader can refer to Weinbauer et al. (2010), O’Donnell et al. (2006), Ojeda and Skinner (2006), and Stoker et al. (2000).
Testicular development begins during the embryonic phase. During this period, the fetal testis is a functional endocrine organ capable of responding to pituitary gonadotropins, producing testosterone, and supporting germ cell mitotic activity. During postnatal development, the testis matures as Leydig cells proceed through several stages of maturation; Sertoli cells proliferate and mature into a postmitotic population; spermatogonia develop and proliferate; and the first wave of spermatogenesis occurs. The dynamic changes in hormone levels responsible for postnatal testicular development as well as the occurrence of pertinent physiologic events as described in the published literature are summarized in Figure 10 and Table 3. The information was extracted from several publications (Clark 1999; Stocco and McPhaul 2006; Desjardins 1978; Ojeda and Skinner 2006; Dohler and Wuttke 1975; Lee et al. 1975; Ketelslegers et al. 1978; Negro-Vilar, Krulich, and McCann 1973).
Graphical presentation of semiquantitative dynamic changes in selected hormone profiles during prepubertal development of testes in rats and maturation of Leydig cells. (A) Graphical presentation of the relationship of hormone levels to morphologic events from postnatal day (PND) 0 to 60. The upper portion of graph A shows relative changes in serum inhibin, prolactin (PRL), FSH, and estrogen (E2) levels. Inhibin produced by immature Sertoli cells peaks around PND 21 and keeps FSH levels low during the neonatal and infantile periods due to the negative feedback effect. The elevation of prolactin during the juvenile and peri-pubertal periods (PND 20–45) works in concert with elevations of FSH (PND 25–45) to effect maturation of Leydig cells by increasing LH receptors on, and testosterone production by, Leydig cells. FSH levels peak first at PND 26 for maturation of Leydig cells, and then a second time at PND 46 at the time of release of spermatozoa from tubules. The role of elevation of E2 from immature Sertoli cells from PND 12 to 19 is unclear, but this E2 may promote PRL production. The decline in E2 production is necessary for the maturation of the BTB at PND 16 to 20. The lower portion of graph A shows levels of testosterone, LH, and dihydrotestosterone. There is a slight elevation of testosterone from PND 15 to 40, when progenitor and ILC are present, but the more dramatic increase in testosterone occurs after PND 40 when MLC are increasing in number. LH levels decline and reach a nadir at PND 26, consistent with the highly sensitive feedback of the immature HPG axis. LH levels then increase in parallel with higher testosterone after PND 30, consistent with maturation of the HPG axis and its “mature” diminished sensitivity according to the gonadostat hypothesis. DHT levels surge from PND 20 to 40 (peaking at 40), because progenitor and ILC preferentially produce DHT. This surge of DHT supports the first wave of spermatocyte development that started at PND 16. (B) Graphical presentation of the maturation process of Leydig cells from fetal to progenitor to immature to MLC. There is regression of fetal Leydig cells from PND 0 to 14. Progenitor Leydig cells that produce predominantly enzyme-reduced androgens (i.e., DHT) arise from undifferentiated stem cells and peak in number by PND 21. The next maturational stage of ILC also producing DHT peaks at PND 35. Thereafter, mature Leydig cells producing testosterone (and incapable of producing DHT) rise to maximum levels at PND 90. FSH = Follicle-stimulating hormone; PRL = prolactin; E2 = estrogen; DHT = dihydrotestosterone; T = testosterone; LH = luteinizing hormone; FLC = fetal Leydig cells; PLC = progenitor Leydig cells; ILC = immature Leydig cells; MLC = mature Leydig cells.
Neonatal Period: Birth to PND 7
Fetal germ cells, or gonocytes, are rendered mitotically inactive at GD 17, and remain in mitotic arrest at the time of birth. By PND 5, gonocytes awaken from their mitotically arrested state and transition into mitotically active spermatogonia type A (Huckins and Clermont 1968). High serum FSH levels, working through FSH receptors on Sertoli cells, facilitate this transition from gonocyte to spermatogonia and instigate the high rate of proliferation of Sertoli cells (Rossi and Dolci 2013). Thyroid hormone level plays an important role in this process as well (Sharpe et al. 2003). Thyroid hormone receptors are expressed at high levels on Sertoli cells during the fetal and neonatal periods, and T3 is apparently critical to regulating Sertoli cell proliferation and, perhaps more importantly, maturation (Cooke, Holsberger, and Franca 2005; Sharpe et al. 2003). Moreover, thyroid hormone and FSH work together to induce androgen receptor expression on Sertoli cells, which begins by PND 4 to 6 in the rat (Bremner et al. 1994; Sharpe et al. 2003).
Toward the end of the neonatal period, serum FSH levels decline due to negative feedback by inhibin produced by the expanding Sertoli cell population. Serum inhibin levels begin to rise at the end of the neonatal period and continue to rise until PND 20 correlating with the rapid proliferation of Sertoli cells up to PND 18 (Saito 1995; Sharpe et al. 1999).
At the beginning of the neonatal period, the interstitium contains mitotically inactive FLC but, by the end of the neonatal period (PND 5), the FLC begin to regress and PLC develop de novo from mesenchymal peritubular stem cells. FLC are indistinguishable by light microscopy from PLC, except that PLC are mitotically active.
The high number of FLC at the beginning of the neonatal period is responsible for relatively high serum testosterone levels at birth. Likewise, the rapid regression of the FLC during the neonatal period coincides with the sudden drop in serum testosterone, because the FLC are the main source of serum testosterone. The new PLC that develop during the late neonatal period, and which replace the FLC, produce reduced metabolites of testosterone, predominantly 3α-androstanediol and dihydrotestosterone (DHT;Ge and Hardy 1998; Ojeda and Skinner 2006), and therefore this new Leydig cell population does not raise serum testosterone level to any biologically significant degree (Ojeda and Skinner 2006; Lee et al. 1975).
The low level of serum testosterone during the neonatal period does not preclude spermatogonia development, since this early stage of spermatogenesis (i.e., mitotic activity of spermatogonia) is androgen- and gonadotropin-independent (Desjardins 1978). In fact, Sertoli cells are devoid of androgen receptors during most of the neonatal stage (Rey et al. 2009).
There is a high serum estrogen (E2) level at birth and a sudden drop thereafter, and this follows a similar profile for FSH in the early neonatal period. The explanation for this serum E2 profile is unclear (Dohler and Wuttke 1975). The high initial E2 may reflect rapidly waning maternal circulating E2.
Early Infantile Period: PND 8 to PND 14
The early infantile period has no major transition point, but is a continuation of the dynamics set in motion during the late neonatal period. Diminishing levels of FSH, increasing levels of inhibin produced by Sertoli cells, high mitotic activity of spermatogonia and Sertoli cells, and replacement of FLC with PLC all contribute to the morphologic features of increased cellular density within the tubules and a stable density of Leydig cells in the interstitium. Increased cell density within the tubules is not only due to the high mitotic activity of spermatogonia and Sertoli cells, but that there is minimal expansion of tubular diameter at this time. Up to PND 15, tubular diameter shows little increase, since tubules are mostly increasing in length (Gaytan et al. 1986).
Serum FSH levels continue to decrease due to feedback associated with the rising levels of inhibin, which is a result of the increasing numbers of Sertoli cells. FSH receptor levels on Sertoli cells continue to increase in this time period (Desjardins 1978), and receptor density reaches a maximum at PND 10 to 15 (Ketelslegers et al. 1978). As a result of this increase in the number of FSH receptors, Sertoli cells continue to proliferate in response to FSH despite waning serum FSH levels.
The early infantile period is a time of fairly stable, albeit low, testosterone levels, due to continued regression of FLC and continued development of mitotically active PLC that predominantly produce DHT and 3α-androstanediol, rather than testosterone. A nadir in serum testosterone level at PND 6 to 14 corresponds to the loss of FLC (Lee et al. 1975). Spermatogenesis remains independent of testosterone or the enzyme-reduced androgens, because germ cell development is limited to mitosis of spermatogonia, which is an androgen-independent event.
Late Infantile Period: PND 15 to PND 20
The late infantile stage marks the transition of spermatogenesis from androgen-independence to androgen-dependence as meiosis and spermatocyte development begins, and this first wave of spermatocyte development is supported by DHT and other reduced androgens. Several changes account for this transition to meiosis, namely Sertoli cell maturation and relatively high levels of DHT. First, Sertoli cells stop dividing as early as PND 15. The cessation of mitotic activity within the Sertoli cell population at PND 15 indicates that Sertoli cells are mature and the blood–testis barrier (BTB) is formed. It is the BTB that allows for maintenance of a highly regulated intratubular fluid environment capable of supporting spermatocyte development. Therefore, this is the time when spermatogonia differentiate into preleptotene spermatocytes located outside the BTB and subsequently into adluminally placed leptotene and zygotene spermatocytes located within the BTB. When Sertoli cells mature at approximately PND 15, each testis in the rat contains 30 to 40 million nonrenewable Sertoli cells (Orth 1982; Berndtson and Thompson 1990). It should be noted that the BTB does not form instantaneously, but the formation occurs over 3 to 4 days (up to about PND 18). The BTB is a complex ensemble of tight junctions, basal ectoplasmic specializations (which are testis-specific adherens comprised of actin filament bundles arranged perpendicular to the Sertoli cell membrane), gap junctions, and desmosomes (Cheng and Mruk 2012). Even after the BTB fully forms, it remains a dynamic structure capable of remodeling to facilitate the periodic transport of preleptotene spermatocytes from outside the barrier to inside the barrier during routine spermatogenesis (Cheng and Mruk 2012).
A second reason why spermatocyte development ensues at around PND 15 is due to higher levels of DHT. DHT, the predominant androgen produced by the increasing population of PLC, increases to a level that stimulates meiosis. DHT stimulates meiosis more effectively than testosterone, since DHT is 5 to 10 times more potent in its androgen receptor binding than testosterone (Chemes, Podesta, and Rivarola 1976).
During the late infantile period, serum FSH levels are low and declining due to the continually rising levels of inhibin, and FSH levels reach a nadir by PND 18. On the other hand, LH levels have been, and stay, relatively high throughout the early and late infantile period because of low testosterone production by progenitor and ILC (Lee et al. 1975). There is little to no testosterone to exert its negative feedback on LH production.
Serum E2 levels rise to a low-level plateau from PND 12 to 19, yet the cause of this E2 elevation or the role of this E2 plateau on testis development is unknown. E2 may play a major role in elevating PRL levels at PND 20, since a rise in PRL may be E2-induced (see Juvenile Period). While the cause for the elevated E2 levels is unknown, elevated E2 followed by a rapid decline at PND 19 corroborates the observation that E2 production is high in proliferating “immature” Sertoli cells and low in nonproliferating “mature” Sertoli cells (Shaha 2008). After all, the decline in E2 at PND 19 occurs with maturation of Sertoli cells. Mature postmitotic Sertoli cells lose their FSH-induced aromatase activity, an enzyme that transforms androgens into E2s (Shaha 2008). The ever-diminishing serum FSH levels (due to increasing inhibin production) further contribute to this decline in aromatase activity.
While the role of elevated E2 is not clear, it is quite clear that the decline in the E2 level after PND 19 is critical to, and coincides with, maturation of Sertoli cells and establishment of the BTB. It has been shown that exogenous E2 administered at this time can delay functional maturation of the Sertoli cells, and be highly disruptive to the formation of the BTB particularly in prepubertal rats (Li et al. 2009; Cheng and Mruk 2012; Gaytan et al. 1986).
The high mitotic rate in the Leydig cell, Sertoli cell, and spermatogonia cell populations results in the maximum cell density within tubules at approximately PND 15. Apoptosis of spermatogonia occurs during this period as a result of this crowding (de Rooij 2001). The maturation of the Sertoli cells at around PND 16 allows for the formation of intratubular fluid to maintain and support spermatocyte development, and fluid filled lumina appear by PND 18. The crowding of Sertoli cells and spermatogonia, along with some tubular dilatation by fluid, manifests in physical formation of a double-layered rosette at PND 18 (Figure 6A and B).
Juvenile Period: PND 21 to PND 32
The juvenile period is the time when there is prominent expansion of the tubular diameter, significant testosterone production by ILC, increasing levels of FSH and LH, and formation of round spermatids. Concurrent with tubular expansion, there is loss of the immature double-layered rosette appearance, as Sertoli cells and spermatogonia retreat to a single layer of cells on the basement membrane.
Serum FSH levels, having reached a nadir at PND 18, increase throughout the juvenile period reaching a first peak at PND 26 (Lee et al. 1975). The steady increase in FSH levels may be explained in part due to declining inhibin levels from the stable population of Sertoli cells after PND 20.
LH levels follow a similar pattern to that of FSH levels, namely a nadir followed by a steady increase, but the nadir and subsequent increase occur at later time points than those for FSH levels. LH levels reach a nadir at PND 25, and thereafter increase. The LH level low point is due to an increase in testosterone produced from the ILC, which has a negative feedback on LH production. While only a small amount of testosterone is produced from ILC, only a small amount of testosterone is needed to turn off LH production during the early juvenile period, because this immature HPG axis has an exquisitely sensitive Testosterone–LH negative feedback mechanism. However, after PND 25 (at the end of the juvenile period), the HPG axis matures; there is reduced sensitivity to negative feedback; and LH levels begin to rise in parallel with increasing levels of testosterone. The parallel relationship between LH and testosterone is a hallmark feature of mature activity of the HPG axis.
Several explanations account for the maturation of the HPG axis and its reduced sensitivity to negative feedback from testosterone in the latter half of the juvenile period. PRL is one factor that reduces sensitivity of the HPG axis (Dohler and Wuttke 1975; Stoker et al. 1999; Negro-Vilar, Krulich, and McCann 1973; Becu-Villalobos et al. 1992). Heightened PRL during the juvenile stage has the added advantage of promoting LH receptors on Leydig cells, rendering Leydig cells more receptive to low LH levels (McNeilly, de Kretser, and Sharpe 1979), and allowing for increased testosterone production by these cells. The reduced sensitivity of the HPG axis along with heightened sensitivity of Leydig cells to an otherwise low LH level explains how LH and testosterone levels can both start low and increase in parallel (rather than in opposite directions). This resetting of sensitivity is often referred to as the gonadostat theory, which is similar to the resetting of a thermostat (Ramirez and McCann 1965).
Aside from the gonadostat theory, there is further explanation for higher levels of gonadotropins during the late juvenile period. The loss of inhibitory effects of gamma aminobutyric acid (GABA) during this time also allows for higher levels of gonadotropins. GABA is normally an inhibitory neurotransmitter that is responsible for low gonadotropin levels during the infantile and early juvenile periods. As the HPG matures, there is complex interaction of excitatory (noradrenaline, neuropeptide Y [NPY], and amino acids) and inhibitory (GABA and endogenous opioids) neurotransmitters that result in overall disinhibition of the effects of GABA at the level of the hypothalamus. This centrally acting disinhibition leads to higher gonadotropin levels as the animal reaches puberty.
Regardless of the reason for higher gonadotropin levels during the latter half of the juvenile period, higher levels of LH and FSH are critical for the final maturation of Leydig cells. At the beginning of the juvenile period, the Leydig cells are either progenitors (producing enzyme-reduced androgens) or ILC (producing both enzyme-reduced androgens and testosterone). Toward the end of the juvenile period, final maturation of Leydig cells occurs and testosterone production prevails. Important in this final maturation are the FSH level surge at PND 26 and the rising LH levels. The FSH level surge causes increased FSH binding to Sertoli cells, which triggers production of insulin-like growth factor 1 (IGF-1) by Sertoli cells. The FSH, IGF-1, and LH work in concert to facilitate final maturation of Leydig cells (Chen, Payne, and Kelch 1976; Swerdloff and Walsh 1973).
Peri-pubertal Period: PND 33 to PND 55
Rising levels of testosterone production from the increasing numbers of mature Leydig cells (MLC) now parallels an increasing level of LH, as the HPG axis continues to mature (Ketelslegers et al. 1978; Lee et al. 1975). DHT levels decline after PND 40. PRL levels remain relatively high until PND 50 (Stoker et al. 1999) and increase sensitivity of the Leydig cells to LH (by increasing LH receptors). PRL also promotes testosterone production by inhibiting the activity of 5α-reductase in Leydig cells (Martini et al. 1978; Witorsch and Kitay 1972). An association between high PRL levels, rising testosterone levels, and declining DHT levels is supported by the observation that PRL levels are high when DHT production from Leydig cells sharply declines at PND 40 and testosterone levels thereafter increase.
Discussion
Morphologic features of development of the prepubertal rat testes have been described in the literature (Campion et al. 2013; Marty et al. 2003; Whitney 2012), but histology of prepubertal development has not been illustrated to a degree useful for toxicologic pathologists. In our study, we show the histologic features of the developing rat testis from the neonatal period to puberty. In the prepubertal period in this current study, the initial transition of spermatogonia to pachytene spermatocytes took 18 days (PND 0–18), and the transition from spermatogonia to spermatozoa took 46 days. Both of these rates are faster than rates published for normal adult rats, which are 21 days and 53 days, respectively (Russell et al. 1990). Accelerated spermatogenesis during prepubertal development has been previously reported (van Haaster and de Rooij 1993; de Rooij 2001).
Apoptosis of spermatogonia is a feature that occurs during the late infantile period (PND 15–18) at the time of formation of the BTB and at a time of maximum cell density. This is consistent with reports that apoptosis of spermatogonia is density-dependent (de Rooij and Lok 1987; Jahnukainen et al. 2004; Morales, Mohamed, and Cavicchia 2007). Apoptosis of pachytene spermatocytes occurs thereafter from late infantile into the juvenile period (PND 18–26) and has been attributable to hormonal changes at a time of low, albeit rising, and levels of testosterone production from ILC (Jahnukainen et al. 2004).
A characteristic double-layered rosette pattern formed by Sertoli cells and spermatogonia in the late infantile stage helps define this stage. This rosette pattern disappears as the tubule undergoes a marked increase in diameter (↑ 130%, >2-fold) from PND 20 to PND 45 (Gaytan et al. 1986). This increase in tubular diameter and loss of rosette architecture are attributable to increasing testosterone levels from ILC through the juvenile period. The increase in tubular diameter coincides with the rapid increase in testis weight after PND 18 (Figure 1).
There is no corresponding quiescent period in testicular development in the male rat as exists in humans. The lack of a quiescent period is fairly unique to the rodent, as most other non-rodent species including the dog and nonhuman primate also have a quiescent period. In humans, there are essentially no circulating steroid hormones or gonadotropins during several years of childhood in males and females. This quiescent period is due in large part to the exquisitely sensitive negative feedback of the immature HPG axis and the inhibitory effect of GABA on production of GnRH. The low levels of gonadotropins and steroid hormones (i.e., testosterone) that occur during the infantile period of the male rat are the closest correlation to the quiescent period in humans. The mitotic arrest of gonocytes from GD 17 through PND 5 has also been considered a close parallel to the human quiescent period (Steinberger and Steinberger 1975). The lack of a quiescent period in the rat might suggest that endocrine disruptors causing reduced gonadotropin production have less relevance to humans during the human quiescent period, but this distinction is more of an academic possibility rather than a regulatory reality.
Sertoli cell proliferation profiles vary between rats and other species including humans. In humans, dogs, and monkeys, there are 2 distinct periods of Sertoli cell proliferation: one during the early life (neonatal—infantile period) and the other in the peri-pubertal period following quiescence during the juvenile period (Sharpe et al. 2003). This quiescence can be several years in humans, from the end of the infantile period (12–18 months) to puberty (10–13 years). In rats, there is only 1 observed proliferation time period for Sertoli cells, and that is from birth through PND 15 when the Sertoli cell matures. It has been suggested that in rats, the usual bimodal pattern of Sertoli cell proliferation exists, but is imperceptible, because of the relatively short juvenile period and absence of a quiescent period (Sharpe et al. 2003). Regardless of whether the profile is bimodal or not in rats, there is no equivalent of a quiescent period for Sertoli cell proliferation in the rat like there is in man, and this might affect the interpretation of human relevance for Sertoli cell toxicants identified in the rat.
The Leydig cell density remained relatively stable throughout the developmental stages. Mitotic activity in the progenitor Leydig cell population was one feature to distinguish FLC from postnatally developed Leydig cells. Differences in the morphology and position of the various subtypes of Leydig cell lineage in the interstitium have been described in the literature, as well as differences in phenotype with regard to LH receptors or steroidogenic markers (Mendis-Handagama and Ariyaratne 2001; Kuopio et al. 1989). We were unable to appreciate these differences in standard H&E-stained sections.
There are a few sensitive time points in prepubertal development that pathologists should understand when evaluating the testes of rats exposed to endocrine disruptors. As discussed previously, high PRL levels in the late juvenile period (PND 25–30) are critical for final maturation of Leydig cells and for maturation of the HPG axis. Therefore, xenobiotics that result in low PRL levels might disrupt maturation of Leydig cells or the HPG axis resulting in delayed puberty, prolonged DHT levels, and/or lower testosterone levels. Lower testosterone levels could possibly manifest as small size of tubules, lower testes weight, and delayed BPS. The small sized tubules might cause crowding of spermatogonia with increased apoptosis or apoptosis of pachytene spermatocytes due to lower testosterone levels. By that same reasoning, xenobiotics causing higher than normal PRL levels might lead to precocious puberty. This association has already been documented (Aguilar et al. 1988; de Jong and van der Schoot 1979; Dohler and Wuttke 1975).
Production of DHT and other reduced androgens by progenitor and ILC is important in sustaining the first wave of spermatocyte development that occurs when the BTB forms (PND 18–21; Cheng and Mruk 2012). Compounds that alter the activity of 5α-reductase could interfere with this first wave of development and lead to altered patterns of spermatogenesis. It has already been shown that finasteride, a 5α-reductase inhibitor, has been associated with delayed puberty at high doses in rats (Marty, Crissman, and Carney 2001). Moreover, iprodione and ketoconazole, 2 steroid biosynthesis inhibitors, also cause lower androgen levels and delayed puberty in rats (Blystone et al. 2007; Marty, Crissman, and Carney 2001). It would be safe to assume that any alteration in DHT levels causing disruption of the spermatogenic process would be associated with degeneration or loss of germ cell layers. It is well known that any condition unfavorable to germ cell differentiation will result in germ cell degeneration (Desjardins 1978). This is because the germ cells are programmed along an inflexible “assembly line.” Any disruption of the assembly line rate will lead to degeneration of the germ cells, because the germ cells will not wait in limbo for a more propitious environment in which to proceed (Desjardins 1978).
Compounds that interfere with, or exaggerate, the elevation of estradiol from PND 12 to 19 might also interfere with puberty. Higher E2 has been associated with precocious puberty (Mathias et al. 2012) and xenobiotics that cause earlier or exaggerated E2 levels might lead to precocious puberty. It is likely that this early onset of puberty is due to E2-induced elevated PRL levels. Stoker et al. (1999) showed that estradiol or bisphenol A (BPA) given to rats at PND 22 leads to higher PRL levels by PND 29. Estrogenic compounds can also cause delayed puberty as well as precocious puberty, as was demonstrated with methoxychlor, a compound with estrogenic activity (Chapin et al. 1997).
Estrogenic xenobiotics could also result in reduced spermatogenesis because of their effect on the initial formation of the BTB at around PND 18. Administration of diethylstilbestrol (DES) to prepubertal rats results in continual proliferation of Sertoli cells and a delay in the formation of the BTB. In the absence of the BTB, there was failure of meiosis, failure of development of spermatocytes past the pachytene stage, and spermatocyte apoptosis (Toyama et al. 2001). The effect of E2s on the BTB may also be time sensitive, as is illustrated with BPA, an estrogenic environmental toxicant. When BPA was given to adult rats, there was no effect on BTB integrity, but when administered to neonatal rats, it disrupted the BTB (Li et al. 2009).
Estrogenic effects on the BTB are not limited to an effect on initial formation of the BTB at PND 18. Once formed, the BTB is in a constant state of restructuring as it breaks down old BTB to allow preleptotene spermatocytes to be transferred across its barrier and reforms the BTB beneath these cells. E2 plays a significant role in the continual restructuring of the BTB as this transfer of preleptotene spermatocytes occur. Active aromatase activity by spermatocytes has been identified as leading to high estradiol in the microenvironment allowing for dissolution of the old BTB to allow this transfer of preleptotene spermatocytes to take place (Cheng and Mruk 2012). The tightly coordinated effects of E2 and androgens together with cytokines and tyrosine kinases on spermatogenesis would be undoubtedly disrupted with a xenobiotic that altered levels of estrogenic activity at any time after the initial formation of the BTB.
Even if the nuances and details of reproductive endocrinology are not known, the practicing pathologist should be able to identify an endocrine disruptor that results in histologic changes to the testes. When encountering small testes with a low number of spermatogenic cells, the pathologist should look for signs of immaturity to help explain these changes. Histologic features such as small tubular diameter, incomplete stages, rosette architecture, and apoptosis of spermatogonia and/or pachytene spermatocytes may be important in determining the pathogenesis of the testis alteration. Such features of immaturity in an otherwise mature rat could point to an endocrine disruption event. On the other hand, features of apoptosis and missing cell types in a prepubertal rat should be recognized as physiological and should not be confused with a xenobiotic-related effect.
Footnotes
Acknowledgments
The authors wish to thank Jim Berkley, BS, RLATG, at WIL Research in Ashland, Ohio, for his contributions as the in-life project leader for this study; and Sirena L. Hudgins, HT(ASCP)CM, QIHC, Pamela S. Taylor, Tara McIver, BS, HTL(ASCP)CM, QIHC, and Cynthia L. Swanson, MS, at WIL Research in Hillsborough, NC, for their technical expertise in the coordination of histology efforts, preparation of tissues, preparation of slides, and performance of special and immunohistochemical staining, and preparation of the digital histopathology images used in this article, respectively.
Authors Contribution
C. Picut contributed to conception and design; contributed to acquisition, analysis, and interpretation; drafted manuscript; critically revised manuscript; gave final approval; and agrees to be accountable for all aspects of work ensuring integrity and accuracy. A. Remick contributed to conception and design; contributed to acquisition, analysis, and interpretation; drafted manuscript; critically revised manuscript; gave final approval and agrees to be accountable for all aspects of work ensuring integrity and accuracy. E. deRijk contributed to analysis and interpretation; critically revised manuscript; gave final approval; and agrees to be accountable for all aspects of work ensuring integrity and accuracy. M. Simons contributed to design; critically revised manuscript; gave final approval; and agrees to be accountable for all aspects of work ensuring integrity and accuracy. D. Stump contributed to interpretation; critically revised manuscript; gave final approval; and agrees to be accountable for all aspects of work ensuring integrity and accuracy. G. Parker contributed to conception; contributed to interpretation; critically revised manuscript; gave final approval; and agrees to be accountable for all aspects of work ensuring integrity and accuracy.
The author(s) declared no potential conflicts of interest with respect to the research, authorship, and/or publication of this article.
The author(s) disclosed receipt of the following financial support for the research, authorship, and/or publication of this article: This project was fully funded by WIL Research.