
Abstract
Differences were examined between male and female Sprague-Dawley rats in basal levels of a wide range of urinary biomarkers, including 7 recently qualified biomarkers. The data were generated from urine samples collected on 3 occasions from untreated rats included in a study of the effect of gentamicin nephrotoxicity on urinary renal biomarkers, reported in a companion article in this journal (Gautier et al. 2014). The performance of multiple assays (9 singleplex assays and 2 multiplex platforms from Rules Based Medicine [RBM] and Meso Scale Discovery [MSD]) was evaluated, and normal ranges and variability estimates were derived. While variability was generally greater on the RBM platform than other assays, the more striking difference in the results from different assays was in magnitude. Where differences were observed between assays for an individual biomarker, they were seen in both sexes and consistent across samples collected at different time points. Differences of up to 15-fold were observed for some biomarker values between assays indicating that results generated using different assays should not be compared. For 8 biomarkers, there was compelling evidence for a sex difference. Baseline values in males were significantly higher than in females for total protein, β2-microglobulin, clusterin, cystatin-C, glutathione-S-transferase (GST-α), tissue inhibitor of metalloproteinases (TIMP-1), and vascular endothelial growth factor (VEGF); female values were significantly higher than that of males for albumin. The largest sex differences (male greater than female by 2- to 11-fold) were seen with β2-microglobulin, GST-α, and TIMP-1. These data add substantially to the limited body of knowledge in this area and provide a useful framework for evaluation of the potential relevance of sex differences in the diagnostic performance of these biomarkers.
Keywords
Introduction
The most widely used parameters to detect and monitor kidney injury include plasma/serum markers such as blood urea nitrogen (BUN) and serum creatinine (sCr), and urinary markers, such as urinary volume, specific gravity or osmolality, glucose or total protein excretion, and sediment examination. Although many of these measurements provide valid indicators of some aspect of kidney function, they lack sensitivity and/or specificity in detecting early stages of injury or disease and in some cases may be influenced by prerenal changes, which can make interpretation difficult.
Over many decades, the potential of a wide variety of specific urinary proteins to detect and track renal injury has been assessed in numerous individual studies, but it is only in recent years that extensive effort—involving collaboration between industrial, academic, and regulatory scientists—has been applied to the systematic evaluation of the diagnostic utility of these urinary biomarkers. The determination to characterize better biomarkers has been given additional impetus by the discovery of a number of potential novel biomarkers through the use of transcriptomic technologies (e.g., Amin et al. 2004; Thukral et al. 2005). This has enhanced the prospect of making available a range of sensitive and specific biomarkers that will have superior diagnostic utility. Collaborative efforts (Dieterle, Perentes, et al. 2010; Harpur et al. 2011: Vaidya et al. 2010; Yu et al. 2010) have resulted in the biological qualification of several urinary biomarkers for detection of nephrotoxic injury to either the renal tubules or the glomeruli in preclinical safety studies in rats. Some of these biomarkers have been available for years and some are comparatively new; 8 of them (albumin, β2-microglobulin, total protein, cystatin C, kidney injury molecule-1 [Kim-1], clusterin, trefoil factor 3, and renal papillary antigen-1 [RPA-1]) were judged by regulatory authorities to be acceptable in specified contexts of nonclinical development for detection of acute drug-induced renal toxicity and to provide additional and complementary information to the currently available standard parameters (European Medicines Agency [EMA] 2009, 2010; U.S. Food and Drug Administration [FDA] 2008, 2010).
Sex differences in renal function are known, many of which are related to sex hormone–regulated expression and action of transporters (Sabolic et al. 2007). These in turn can give rise to sex differences in pharmacological and toxicological responses. There is some prior knowledge of differences between the sexes in the urinary excretion of some of the long used urinary protein biomarkers. For example, it is well established that urinary excretion of total protein is up to several fold greater in male than female rats (Fuchs et al. 2012; Kolaja et al. 1994; Remuzzi et al. 1988; Tanner 2009). Individual protein biomarkers, such as some enzymes (Grotsch et al. 1985) and beta 2-microglobulin (Morel, Payan, and de Ceaurriz 1990), show greater urinary excretion in male than in female rats. Despite these sex differences in potentially relevant aspects of renal function, almost all of the published data reported to have been used in the biomarker qualification decisions (Dieterle, Perentes, et al. 2010; Harpur et al. 2011; Vaidya et al. 2010; Yu et al. 2010) were generated only in male rats. The only exception was a single study with carbapenem, which was conducted using male and female rats in response to data gaps identified by the regulators during their initial review of the first qualification submission (Ozer et al. 2010). Since the first biological qualification of urinary biomarkers most rodent studies have continued to use only male animals. One study did employ rats of both sexes (Fuchs et al. 2012) but all of the data were pooled across the sexes except for urinary protein, the baseline excretion of which was shown to be higher in male rats. The only recent studies that have specifically addressed potential sex differences in urinary biomarker levels in rats are those of Pinches, Betts, Bickerton, Beattie, et al. (2012) and Pinches, Betts, Bickerton, Burdett, et al. (2012). They have published baseline data for some conventional and many novel urinary biomarkers in untreated Wistar rats of both sexes (Pinches, Betts, Bickerton, Beattie, et al. 2012) as well as the response of these biomarkers to cisplatin-induced injury (Pinches, Betts, Bickerton, Burdett, et al. 2012).
This study was conducted under the auspices of the ILSI HESI Committee on Biomarkers of Nephrotoxicity to examine differences between male and female Sprague-Dawley rats in the constitutive presence in urine of a wide range of biomarkers, including 7 of the 8 qualified biomarkers; trefoil factor 3 was not studied, as there is no widely available assay for this biomarker. An opportunity was also taken to evaluate the performance of several assay platforms and to generate baseline data (with normal ranges and variability estimates) in Sprague-Dawley rats of both sexes. The response of the biomarkers to gentamicin-induced injury is reported in a companion article (Gautier et al. 2014).
Method
Animals and Husbandry
Sprague-Dawley specific pathogen free rats [Crl:CD(SD)IGS BR] at 7 weeks of age and weighing 130 to 230 g (females) and 250 to 350 (males) were obtained from Charles River laboratories Italia S.R.L., Via Indipendenza 11, Calco (lecco), 23885, Italy, and acclimated for a minimum of 6 days before use. The rats were housed in pairs in polysulfone solid bottom cages under conditions of 20 to 23°C and 40 to 70% relative humidity with a 12-hr light/12-hr dark cycle and had ad libitum access to A04-10 pelleted diet supplied by SAFE, Route de Saint Bris, Les Tremblats, 89290 Augy, France (except during urine collections) and filtered tap water (at all times). The animal care and experimental procedures were conducted in compliance with the European Economic Community (EEC) Directive 86/609/EEC (1986). The study was performed in accordance with the standards of the Institute of Laboratory Animals Resources (ILAR) Guide (1996) and was approved by an Internal Ethics Committee.
Study Design and Procedures
This article presents the control (baseline) data from untreated male and female Sprague-Dawley rats included in a study of the effect of gentamicin on urinary renal biomarkers. Table 1 summarizes the numbers of animals and timing of sample collection.
Study design: Number of animals and timing of sample collection.
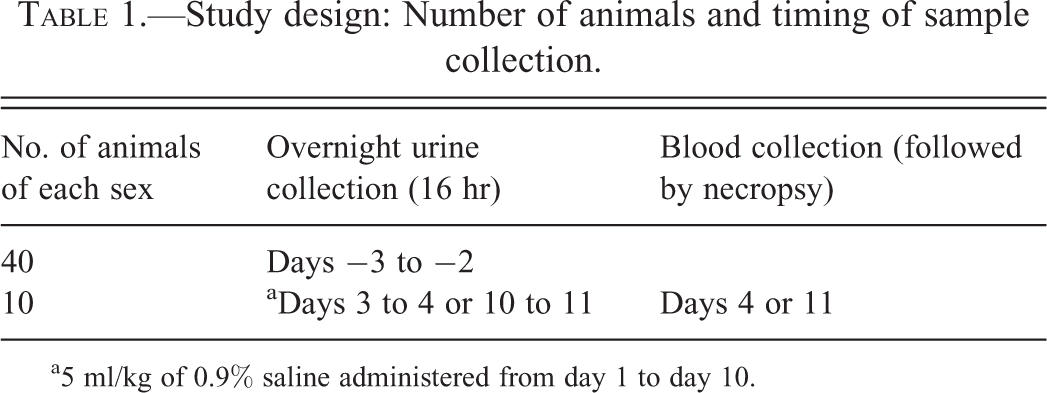
a5 ml/kg of 0.9% saline administered from day 1 to day 10.
During the dosing period, animals were examined clinically at least twice daily and weighed every other day. On the designated days pretest and before blood sample collection and necropsy (Table 1), animals were placed in individual metabolism cages overnight (approximately 16 hr) and urine samples were collected into ice-chilled containers. During the urine collections, animals were fasted but had free access to water. At the end of the collection period, urines were examined for color, appearance, and measurement of volume and specific gravity. After low speed centrifugation (400 g) at 4°C for 5 min, multiple aliquots of the supernatant urine were prepared and stored at −80°C until analyzed for creatinine, total protein and novel biomarkers as described subsequently.
Animals were euthanized by exsanguination from the abdominal aorta under Aerrane/isoflurane anesthesia. A sample of abdominal aorta blood was reserved for clinical pathology analyses.
Traditional Clinical Pathology Parameters
Urinary total protein, N-acetyl-β-D-glucosaminidase (NAG), and albumin and urinary and sCr were measured on the Roche Modular P analyzer (Roche Diagnostics, Meylan, France) using assay kits supplied by Roche Diagnostics and following standard methods. Creatinine and NAG were analyzed with enzymatic methods. Total protein was measured using a colorimetric method with red pyrogallol and albumin was measured using an immuno-turbidimetric method.
Assays for Novel Biomarkers of Nephrotoxicity
Urinary biomarkers were assayed on several platforms as shown in Table 2.
Summary of which biomarker assays were conducted on the different platforms.
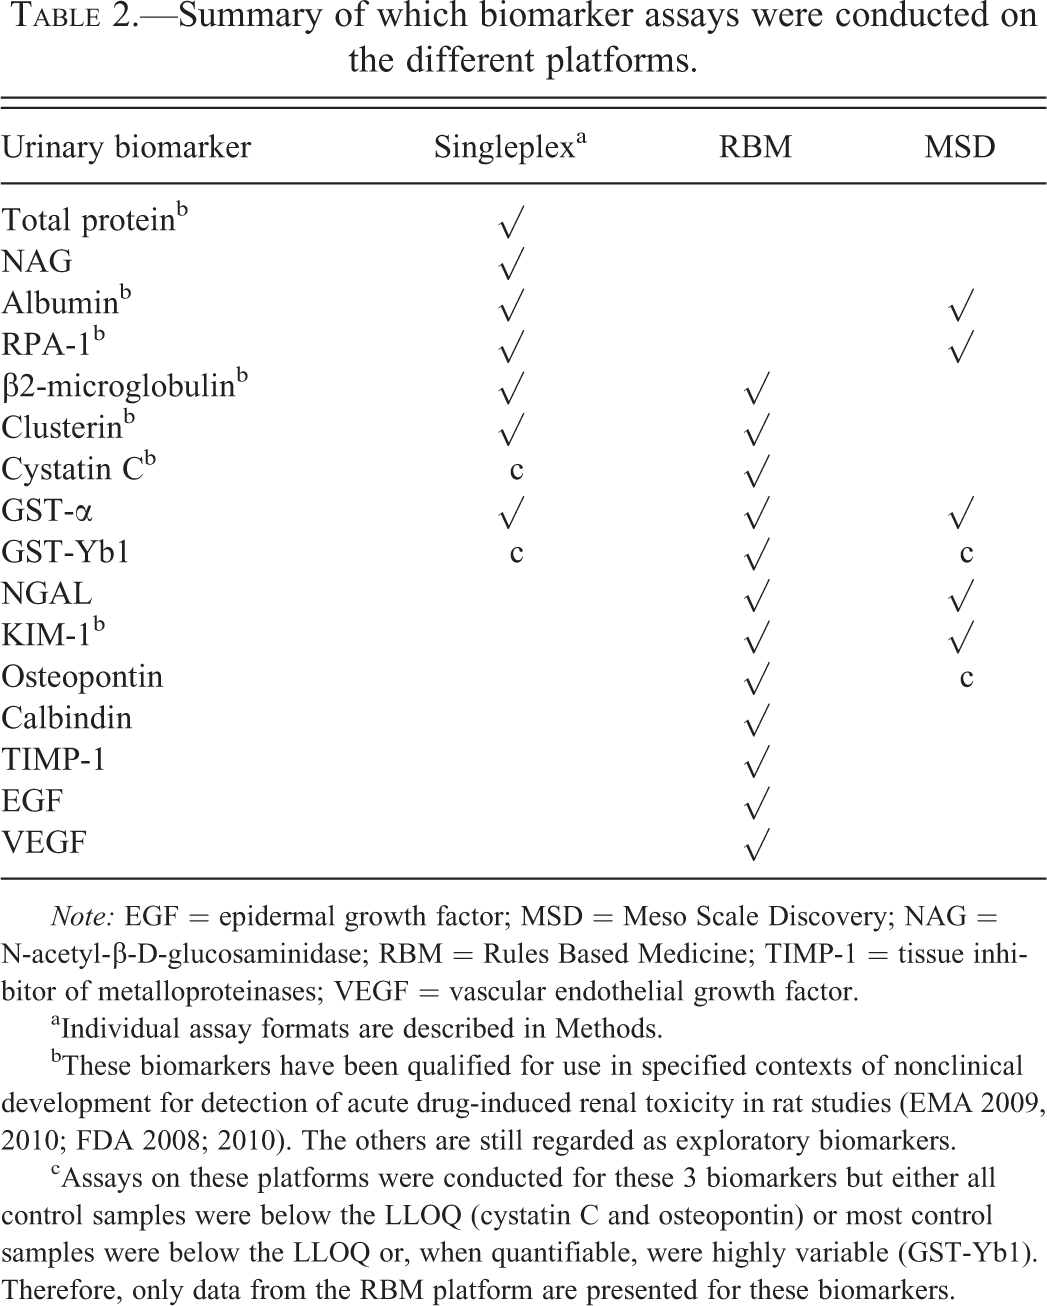
Note: EGF = epidermal growth factor; MSD = Meso Scale Discovery; NAG = N-acetyl-β-D-glucosaminidase; RBM = Rules Based Medicine; TIMP-1 = tissue inhibitor of metalloproteinases; VEGF = vascular endothelial growth factor.
aIndividual assay formats are described in Methods.
bThese biomarkers have been qualified for use in specified contexts of nonclinical development for detection of acute drug-induced renal toxicity in rat studies (EMA 2009, 2010; FDA 2008; 2010). The others are still regarded as exploratory biomarkers.
cAssays on these platforms were conducted for these 3 biomarkers but either all control samples were below the LLOQ (cystatin C and osteopontin) or most control samples were below the LLOQ or, when quantifiable, were highly variable (GST-Yb1). Therefore, only data from the RBM platform are presented for these biomarkers.
Singleplex assays
Glutathione-S-transferase (GST)-α (GST-α), GST-Yb1 (GST-µ), and RPA-1 were measured using rat enzyme-linked immunosorbent assay (ELISA) kits provided by Argutus Medical (Dublin, Ireland). β2-microglobulin was assessed using Pana test® Rat β2-microglobulin kit from Mitsubishi Chemical Medience Corporation (Kumamoto, Japan). Clusterin was measured using Rat Clusterin Elisa kit from Biovendor (Modrice, Czech Republic). Cystatin C was measured using an immuno-turbidimetric method with a kit from Dako (Glostrup, Denmark) on the Roche Modular P analyzer according to the manufacturer’s instructions.
RBM multiplex assays
A panel of 12 biomarkers shown in Table 2 was measured with the rat kidney multi-analyte profile (MAP) v1.0 by RBM (Austin, TX, USA).
MSD multiplex assays
A multiplex electrochemiluminescence-based MSD Sector Imager 2400 instrument from MSD (Gaithersburg, MD) was used to assess urinary biomarkers. GST-α, GST-Yb1, and RPA-1 were measured using the Argutus Acute Kidney Injury Test assay kit from MSD according to the manufacturer’s instructions and as also described elsewhere (Pinches, Betts, Bickerton, Beattie, et al. 2012). Lipocalin-2 (NGAL), osteopontin, albumin, and Kim-1 were measured using the kidney injury panel 1 assay kit from MSD according to the manufacturer’s instructions. Prior to analysis, urine samples were diluted 10-fold in assay diluent (supplied with the kit) and samples and calibrators were mixed with albumin tracer before addition (50 µl/well) to the plate.
Analytical Validation Process
The biomarkers measured with singleplex and MSD platforms were validated using an internal quality control process. The solutions used for the analytical validation process were urine samples containing high levels of biomarkers that were diluted to obtain high, medium, and low concentrations of biomarkers, or urine samples spiked with standards. Intra-run precision was determined using 3 different levels for each biomarker with 10 individual specimens for each level. Inter-run precision was determined using 3 different levels for each biomarker and 3 individual specimens for each level were assessed on three different occasions. Intra- and inter-run precision were considered acceptable if the coefficient of variation (CV) was below 20%. Lower and upper limits of quantification (LLOQ and ULOQ, respectively) were assessed for each biomarker using diluted or spiked samples. The LLOQ was determined as the lower dilution point that met the acceptance criteria (±20% difference vs. theoretical dilution value); the ULOQ was determined as the higher spiked value that met the acceptance criteria (±20% difference vs. spiked value). The biomarkers measured at RBM were validated using the following procedure. Intra-run precision was determined using 3 different levels for each biomarker with 1 individual specimen run in duplicate at each level. Inter-run precision was assessed on more than 3 days using 3 different levels for each biomarker with 1 individual specimen run in duplicate at each level. Intra- and inter-run precision were considered acceptable if the CV was below 30% for the low- and below 20% for the mid- and high-quality control samples. Low and high limits of quantification were assessed for each biomarker using diluted or spike samples. LLOQ and ULOQ were defined as the concentration of analyte where the imprecision of the assay increased above 30%. In most cases, the 30% imprecision value was not reached for the ULOQ and the highest concentration of the standard was listed as the ULOQ.
Expression of Urinary Biomarker Data
Urinary biomarker values were normalized for urinary creatinine content by dividing the urinary concentration of the biomarker by the urinary concentration of creatinine.
Statistical Analysis
Log-transformed biomarker values (normalized for urinary creatinine content) from baseline and day 4 and 11 control group animals were analyzed by repeated measures analysis of variance (ANOVA) using a compound symmetric covariance matrix. The model included fixed effects for day, sex, and their interaction. Estimated sex differences and 2-sided 95% confidence intervals were calculated, by day, and then converted to the ratio scale via the anti-log transformation. Statistically significant differences at the α = .05 level are indicated if the 95% confidence interval excludes the ratio value of 1.0.
For each sex separately, estimates and confidence intervals for intra-animal, inter-animal, and total variance were calculated using normalized biomarker values from control group animals. Animals with missing baseline or either day 4 or 11 values were excluded from the analyses. Two-sided 95% confidence intervals were calculated using the standard χ2 method for intra-animal variance, the modified large sample method for inter-animal variance, and the Graybill–Wang method for total variance (Burdick and Graybill 1992). Variance estimates were converted to percentage CV by applying the square root transformation and dividing by the observed mean. Two-sided 95% confidence intervals for the ratio of total variances between the sexes were calculated using the approach of Ting, Burdick, and Graybill (1991) and converted to percentage CV ratios by applying the square root transformation and dividing by the observed mean.
For each sex separately, 95% reference ranges for the biomarkers were calculated as the 2.5th and 97.5th percentiles of the normalized baseline (day 2) values.
No attempt was made to adjust confidence intervals for multiple comparisons. SAS 9.2 was used for all data analyses.
Results
Data Presentation
Urinary biomarker values were normalized by expressing them as a ratio to urinary creatinine content. Normalization to creatinine content was chosen after consideration of the alternative of expressing them as amount of biomarker excreted over a defined period. For this purpose, the correlation between biomarker values with urinary creatinine concentration or urine volume was calculated using baseline data. For most biomarkers, the correlation analysis indicated a stronger linear relationship between biomarker concentration and urinary creatinine concentration than urine volume. This was true for both males and females. For those biomarkers more correlated with urine volume, the correlation was only marginally stronger. It was further checked that urinary creatinine excretion (concentration × volume) was similar across all groups and thus unaffected by treatment.
The urinary cystatin C data obtained with the singleplex immuno-turbidimetric method and the urinary osteopontin data obtained with the MSD platform are not presented because all the values from control samples were below the LLOQ with these assays. In addition, the urinary GST-Yb1 data obtained with the singleplex EIA kit and using the MSD platform are not presented because the values from most of the control samples were either below the LLOQ or highly variable.
Platform Comparisons
Tables 3a through 3c show urinary biomarker values (normalized for urinary creatinine content) in samples collected on day 2, day 4, and day 11 and assayed on a variety of singleplex assays (Table 3a) and 2 multiplex platforms, RBM (Table 3b) and MSD (Table 3c). The baseline values (day 2) were obtained from naïve animals (40 of each sex) and include pre-treatment values from animals which subsequently received gentamicin. The values on days 4 and 11 were collected from control animals (10 of each sex) that were administered daily injections of 0.9% saline (5 ml/kg). From a total of 16 biomarkers, data from 9 are presented from 1 assay platform but the remaining 7 were measured on more than 1 assay platform (Table 2) allowing inter-platform comparisons of control values on 3 occasions. Differences in absolute biomarker values between platforms were not analyzed statistically; however, for 6 of the 7 biomarkers where comparisons were possible, there are 2-fold or greater differences in absolute values between assay platforms. RPA-1 was an exception in that the absolute values are highly consistent between the singleplex ELISA assay and the MSD multiplex assay; this may be explained by the fact that the same antibodies were used to measure RPA-1 in both assays. While both the direction and magnitude of the difference between platforms in control values of each individual biomarker is seen consistently in both sexes and when measured on different days, there is no consistent pattern across biomarkers in the differences (higher or lower) between platforms. As examples, the results on the RBM multiplex platform are approximately 7- to 14-fold higher and 6- to 15-fold higher for β2-microglobulin and clusterin, respectively, but approximately 5- to 15-fold lower for GST-α when compared with the respective singleplex assays. Results for GST-α were also available on the other multiplex platform, MSD, and here again the results on the RBM platform were 7- to 15-fold lower than on the MSD platform. Albumin was also measured on the MSD platform and a singleplex assay and the results were 2- to 4-fold higher on the MSD platform. For Kim-1, values on the MSD platform were approximately 2- to 4-fold higher than when measured on the RBM platform. The reverse was true for NGAL; the results were up to 2-fold higher on the RBM platform than on the MSD platform.
Control values on singleplex platforms across days, with sex ratios.
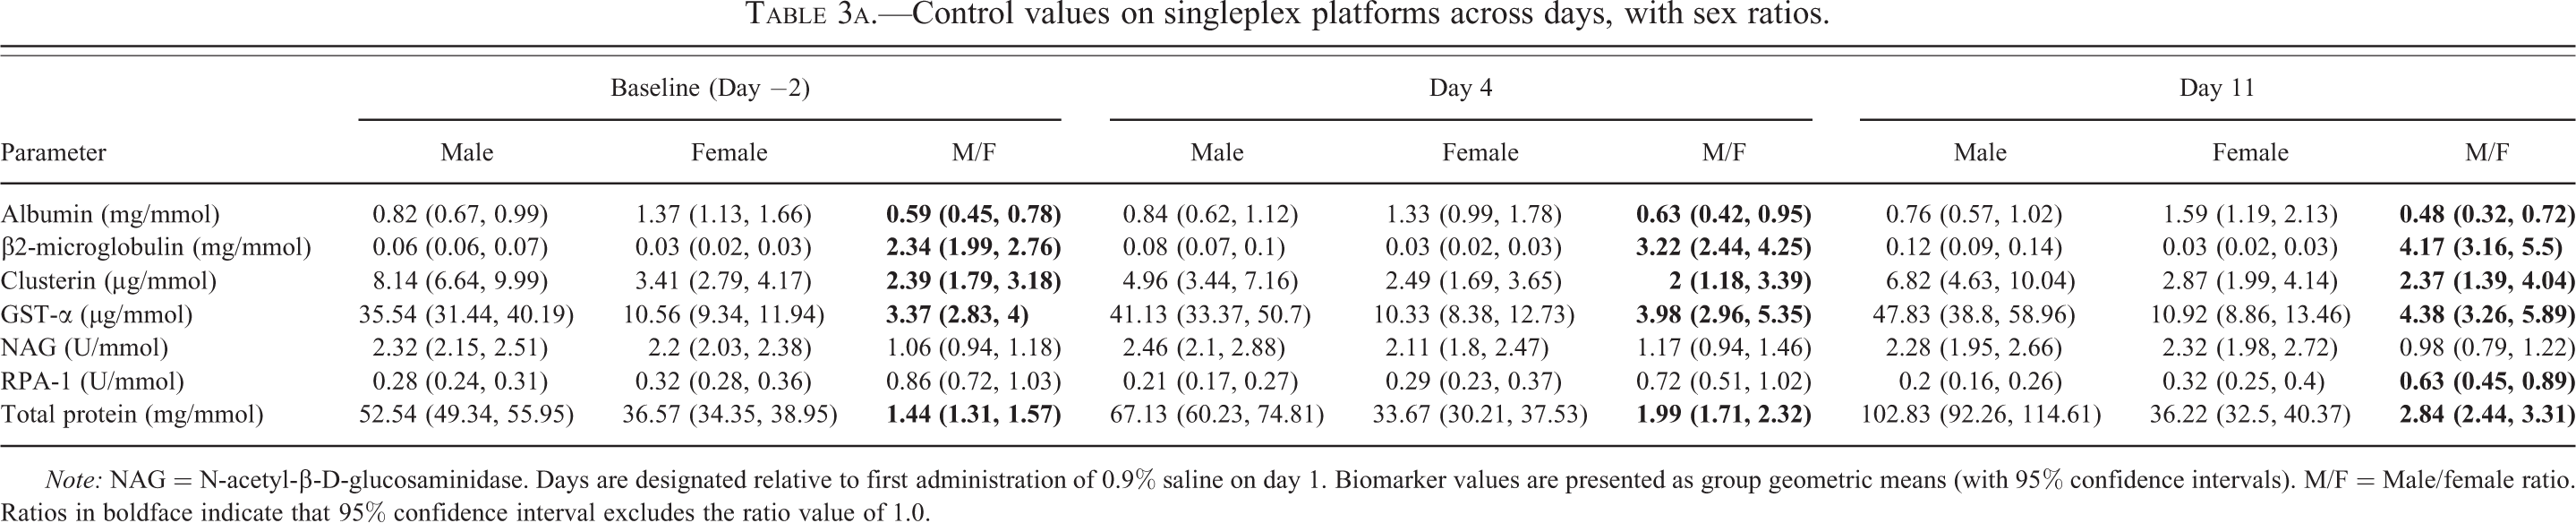
Note: NAG = N-acetyl-β-D-glucosaminidase. Days are designated relative to first administration of 0.9% saline on day 1. Biomarker values are presented as group geometric means (with 95% confidence intervals). M/F = Male/female ratio. Ratios in boldface indicate that 95% confidence interval excludes the ratio value of 1.0.
Control values on RBM platform across days, with sex ratios.
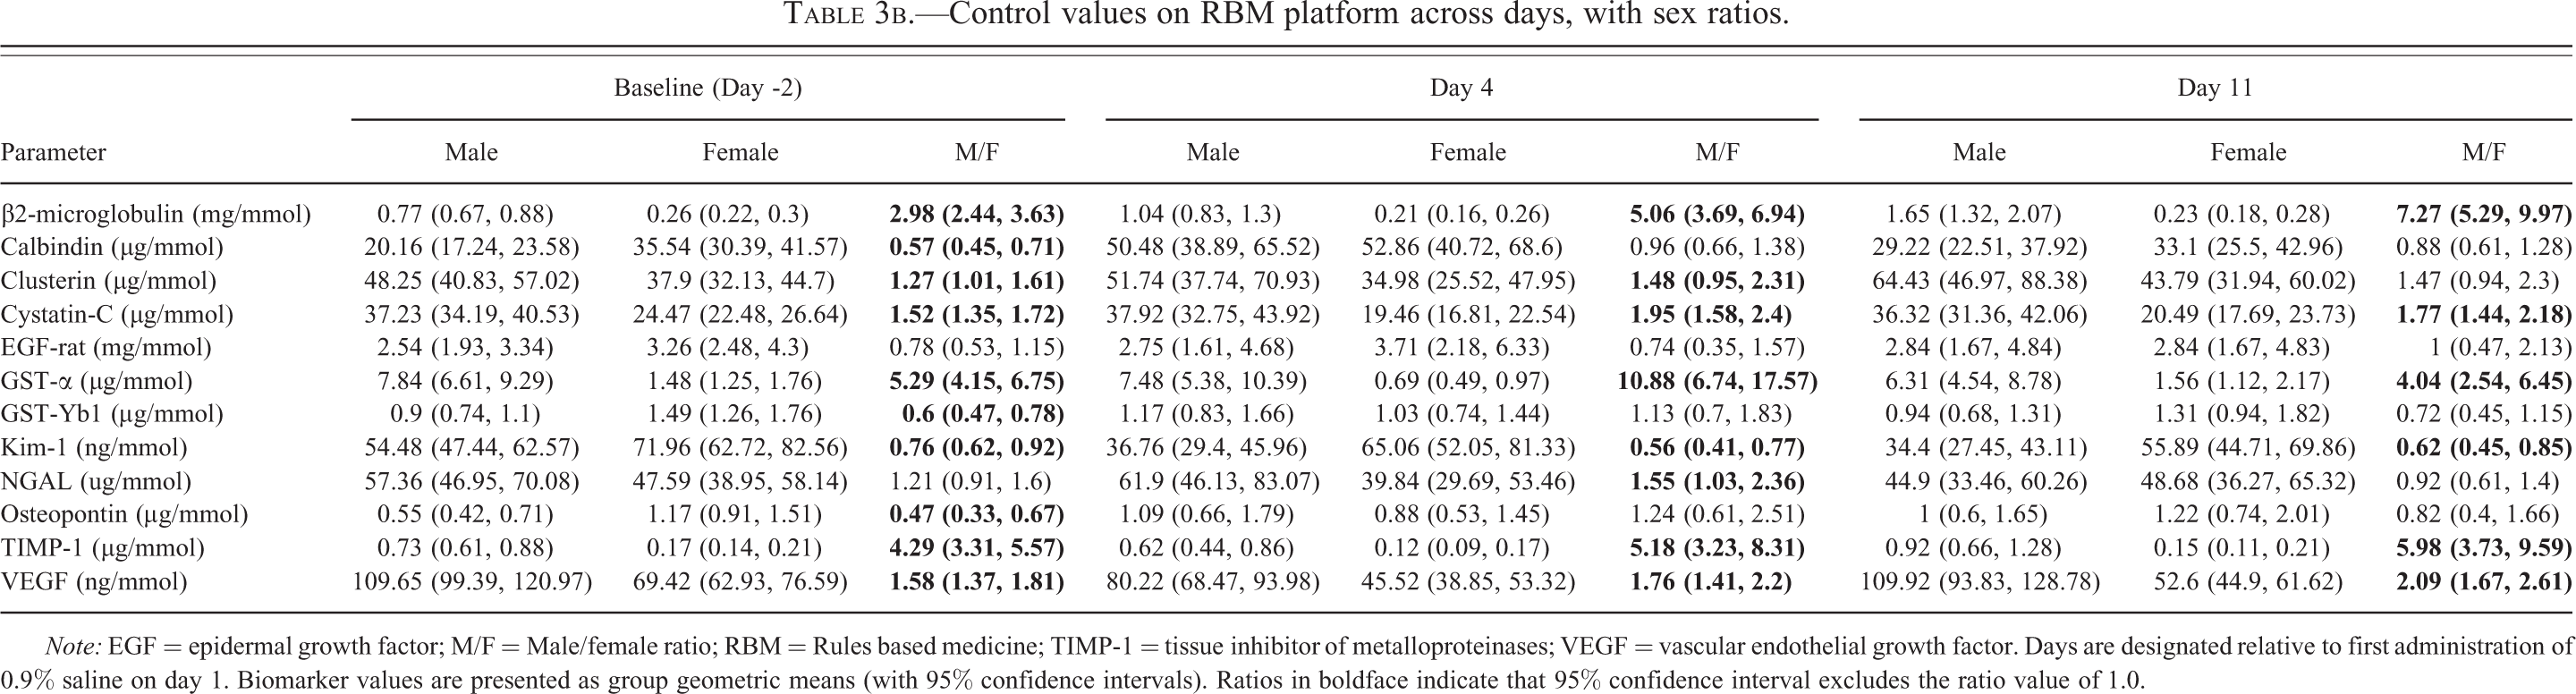
Note: EGF = epidermal growth factor; M/F = Male/female ratio; RBM = Rules based medicine; TIMP-1 = tissue inhibitor of metalloproteinases; VEGF = vascular endothelial growth factor. Days are designated relative to first administration of 0.9% saline on day 1. Biomarker values are presented as group geometric means (with 95% confidence intervals). Ratios in boldface indicate that 95% confidence interval excludes the ratio value of 1.0.
Control values on MSD platform across days, with sex ratios.
Note: GST-α = glutathione-S-transferase; M/F = Male/female ratio; NGAL = neutrophil gelatinase–associated lipocalin; RPA = renal papillary antigen; NA = Not Assayed Days. are designated relative to first administration of 0.9% saline on day 1. Biomarker values are presented as group geometric means (with 95% confidence intervals). Ratios in boldface indicate that 95% confidence interval excludes the ratio value of 1.0.
Sex Differences in Constitutive Values
Comparison between the sexes of these constitutive values (baseline values in all animals, and values in control animals on days 4 and 11) was done by calculating the male to female ratios (Tables 3a–c). Note that sex ratios were never calculated mixing results generated on more than one platform. These comparisons revealed statistically significant sex differences for 14 of the 16 biomarkers studied. The strength of the evidence for these sex differences is summarized in Table 4. At no time was a significant sex difference observed for NAG or EGF. In the case of 5 of the biomarkers (calbindin, GST-Yb1, Kim-1, osteopontin, and NGAL), the evidence for a sex difference was considered equivocal in that it was not seen consistently at all time points and/or it was not always the same sex that showed the higher value. The evidence for a sex difference was considered weak for one biomarker (RPA-1). There was indeed a consistent trend for a sex difference for RPA-1 (female greater than male) but the magnitude of the difference was small and it was not statistically significant at all times. For the remaining 8 biomarkers (β2-microglobulin, clusterin, cystatin-C, GST-α, albumin, total protein, tissue inhibitor of metalloproteinases [TIMP-1], and vascular endothelial growth factor [VEGF]), the evidence for a sex difference was unequivocal. All of them showed a significant difference between the sexes in baseline values (at which time the numbers were greatest, 40 of each sex) irrespective of assay platform where more than 1 was used. Furthermore, although the numbers of animals were smaller on days 4 and 11 (10 of each sex), there was a similar trend at these time points and on other platforms (where available). The evidence for a sex difference was strongest for β2-microglobulin, GST-α, and TIMP-1 in that the magnitude ranged from 2- to 11-fold and was significant at every time point, irrespective of assay platform. Values in males were significantly higher than in females for 7 of these biomarkers (total protein, β2-microglobulin, clusterin, cystatin-C, GST-α, TIMP-1, and VEGF); for albumin, the reverse was the case, that is, values in females were significantly higher than in males.
Evidence for sex differences with individual biomarkers.
Note: EGF = epidermal growth factor; MSD = Meso Scale Discovery; NAG = N-acetyl-β-D-glucosaminidase; RBM = Rules based medicine; TIMP-1 = tissue inhibitor of metalloproteinases; VEGF = vascular endothelial growth factor. (1) Sex difference always at least 2-fold in magnitude, always statistically significant, seen at all time points, and (for β2-microglobulin and α-GST ) using results measured on more than 1 platform. (2) Consistent trend for one sex greater than the other but generally 2-fold or less in magnitude and not always statistically significant at all times and across platforms. (3) Consistent trend for 1 sex greater than the other, always less than 2-fold in magnitude and not statistically significant at all times or across platforms. (4) Statistically significant sex difference seen at 1 or more time points but no consistent trend. (5) No statistically significant sex difference at any time point.
The sex differences for the eight biomarkers for which the evidence was clearest are illustrated in Figure 1 using baseline control values.
Boxplots of baseline values, by sex, for biomarkers with clear evidence for a sex difference: β2-microglobulin, cystatin-C, GST-α, TIMP-1, and VEGF (RBM Platform) and clusterin, albumin and total protein (Singleplex assays). The bottom and top edges of each box are located at the 25th and 75th percentiles. The distance between the 25th and 75th percentiles is known as the interquartile range (IQR). Within each box, the median is displayed as a line and the mean as a diamond. The whiskers extend to the farthest points that are within 3/2 times the IQR. Outliers are displayed as a circle.
Variability in Constitutive Urinary Biomarker Values and Normal Ranges
Total variability (Tables 5a and 5b) ranges, across assay platforms, from 24 to 82% (males) and 16 to 74% (females). In general, variability is as great as, or greater, within animals than between animals (true in both sexes).
Estimates of variability in male control values, with 95% confidence intervals.
Note: EGF = epidermal growth factor; MSD = Meso Scale Discovery; NAG = N-acetyl-β-D-glucosaminidase; RBM = Rules based medicine; TIMP-1 = tissue inhibitor of metalloproteinases; VEGF = vascular endothelial growth factor.
aThe variability of GST-α and RPA-1 on the MSD platform was not evaluated because these biomarkers were not measured on day-2 with this platform.
Estimates of variability in female control values, with 95% confidence intervals.
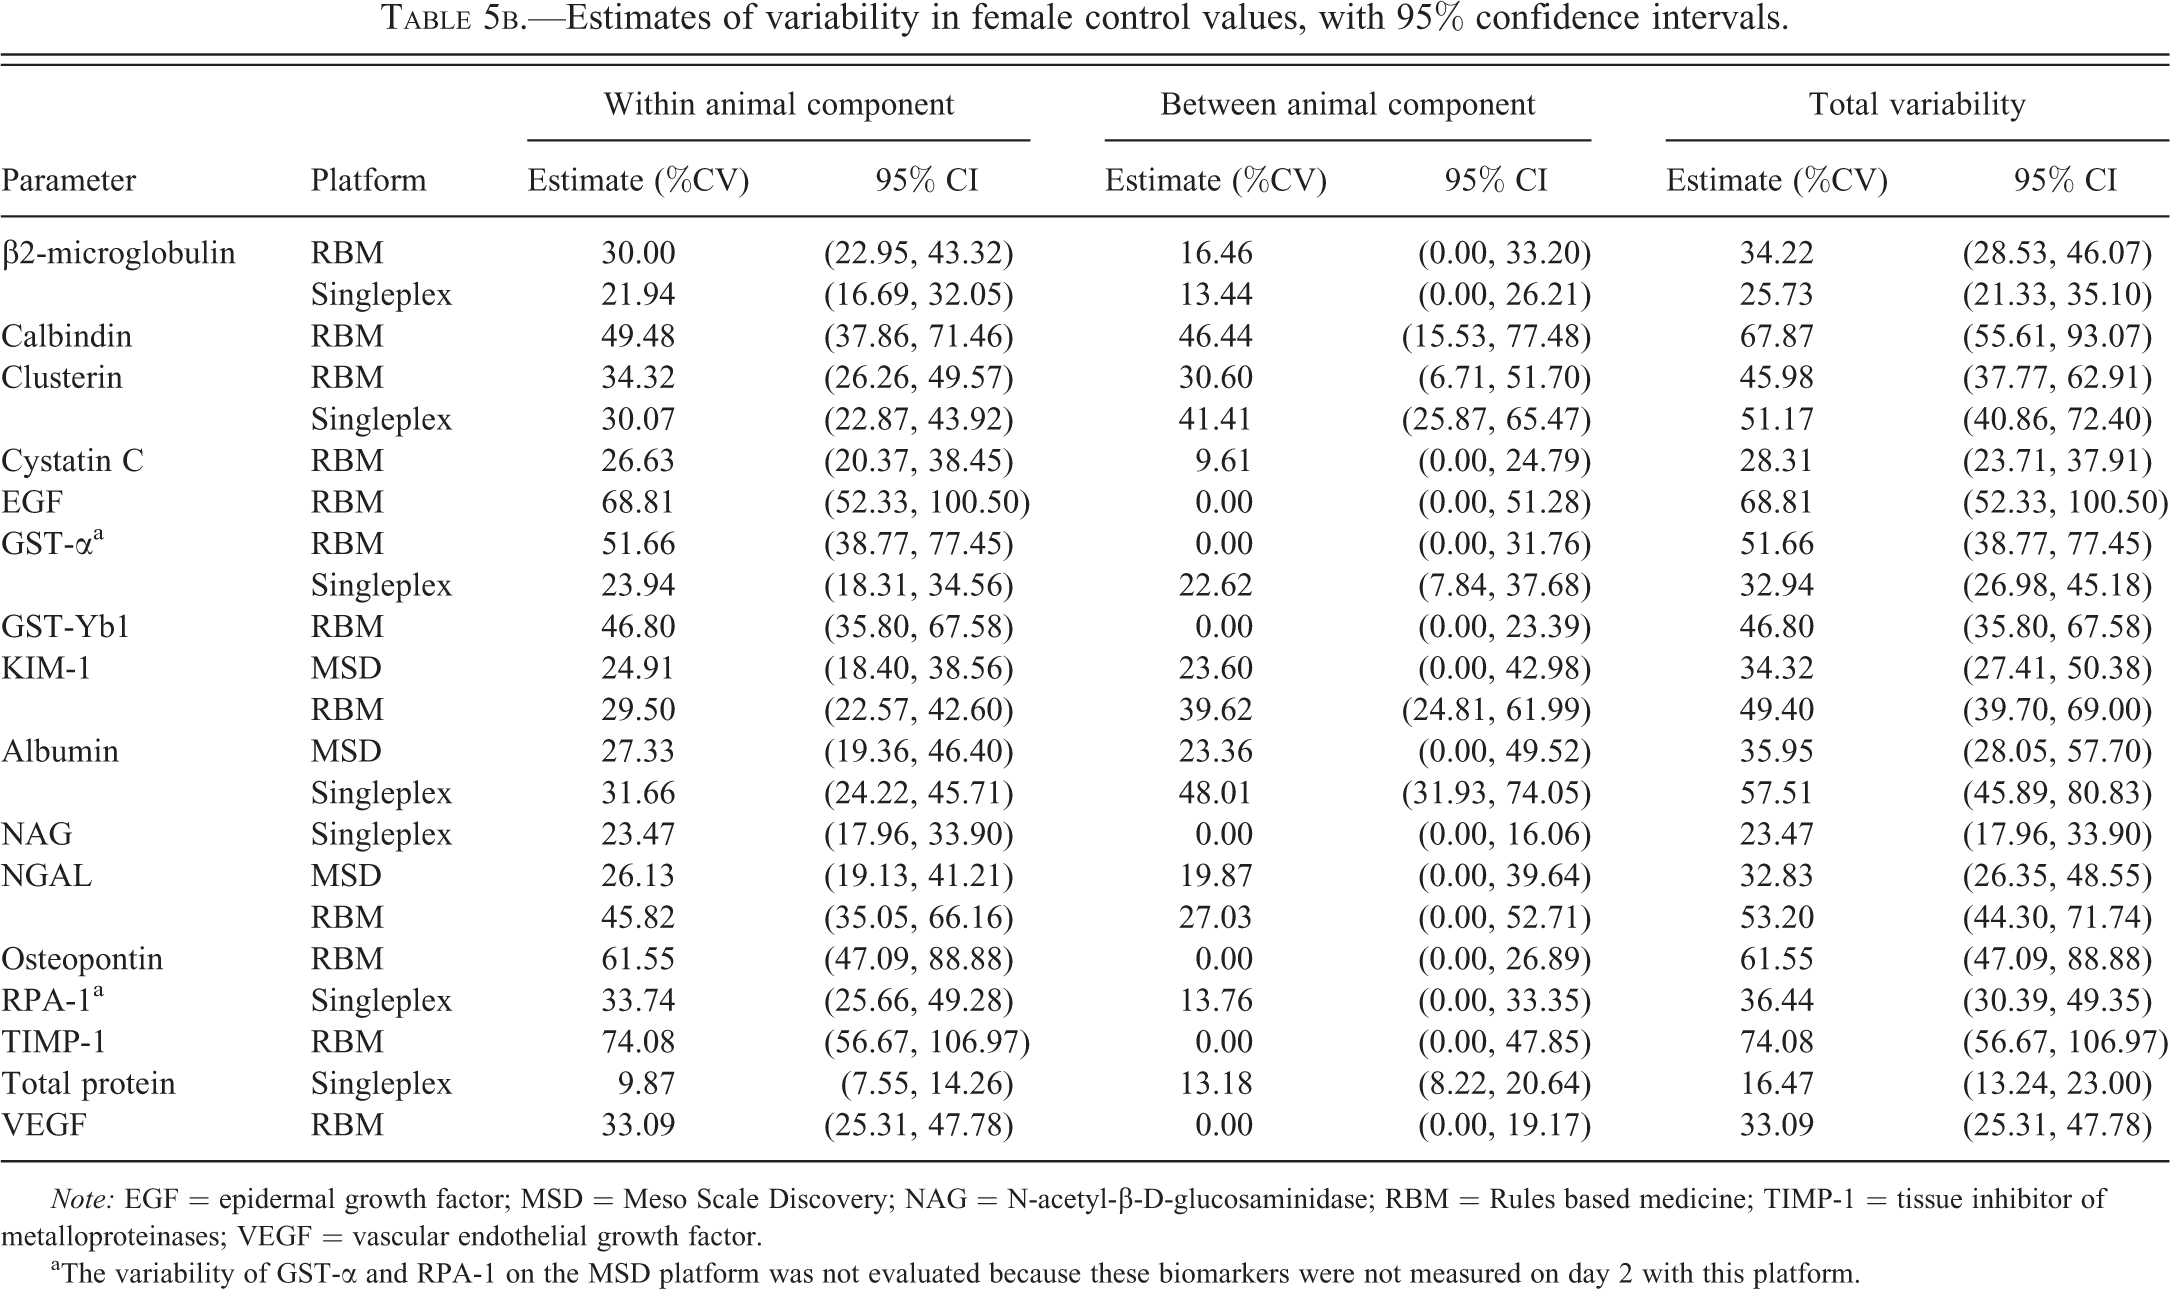
Note: EGF = epidermal growth factor; MSD = Meso Scale Discovery; NAG = N-acetyl-β-D-glucosaminidase; RBM = Rules based medicine; TIMP-1 = tissue inhibitor of metalloproteinases; VEGF = vascular endothelial growth factor.
aThe variability of GST-α and RPA-1 on the MSD platform was not evaluated because these biomarkers were not measured on day 2 with this platform.
Male/female ratios for total variability, with 95% confidence intervals.
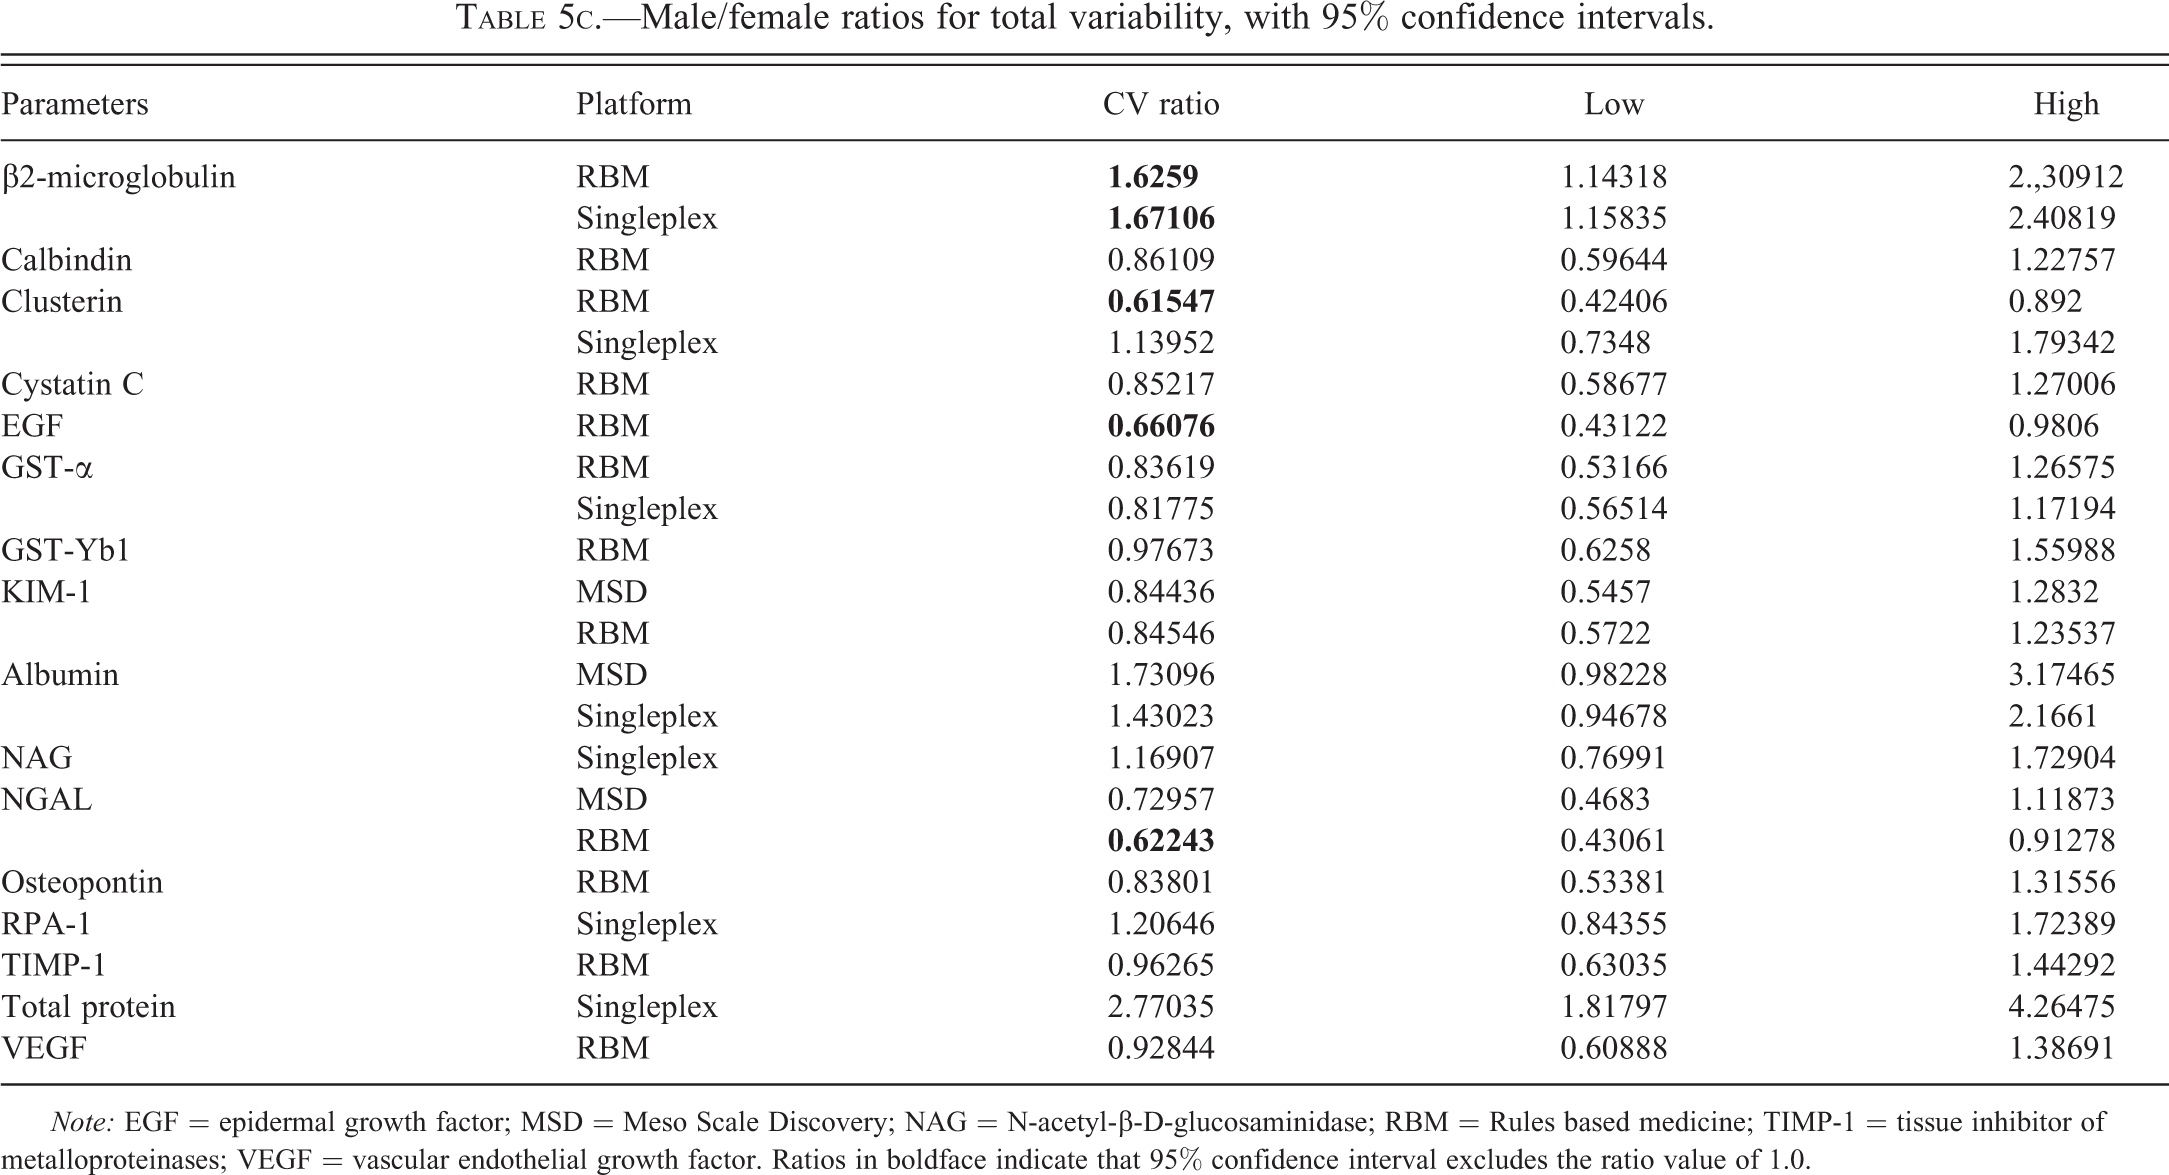
Note: EGF = epidermal growth factor; MSD = Meso Scale Discovery; NAG = N-acetyl-β-D-glucosaminidase; RBM = Rules based medicine; TIMP-1 = tissue inhibitor of metalloproteinases; VEGF = vascular endothelial growth factor. Ratios in boldface indicate that 95% confidence interval excludes the ratio value of 1.0.
For individual biomarkers, where data are available on more than 1 platform, the RBM platform tended to result in more variable data; thus, the RBM results were more variable than the singleplex assay data for β2-microglobulin and GST-α and more variable than the MSD data for Kim-1 and NGAL. These differences were evident in both sexes.
There were some differences in variability between sexes expressed as fold difference in the CV percentage for total variability (Table 5c). However, these differences were generally quite small (less than 2-fold with the 1 exception of total protein) and only in a few cases were the sex differences in variability significantly different. There was no consistency in which sex showed greater variability (greater in males for 6 biomarkers; greater in females for 10). Furthermore, in the case of clusterin, the sex difference in variability was assay dependent. Normal ranges for all of the biomarkers measured were calculated based on baseline values and these are presented by sex and assay platform (Table 6).
95% reference ranges for individual biomarkers by sex and assay platform.
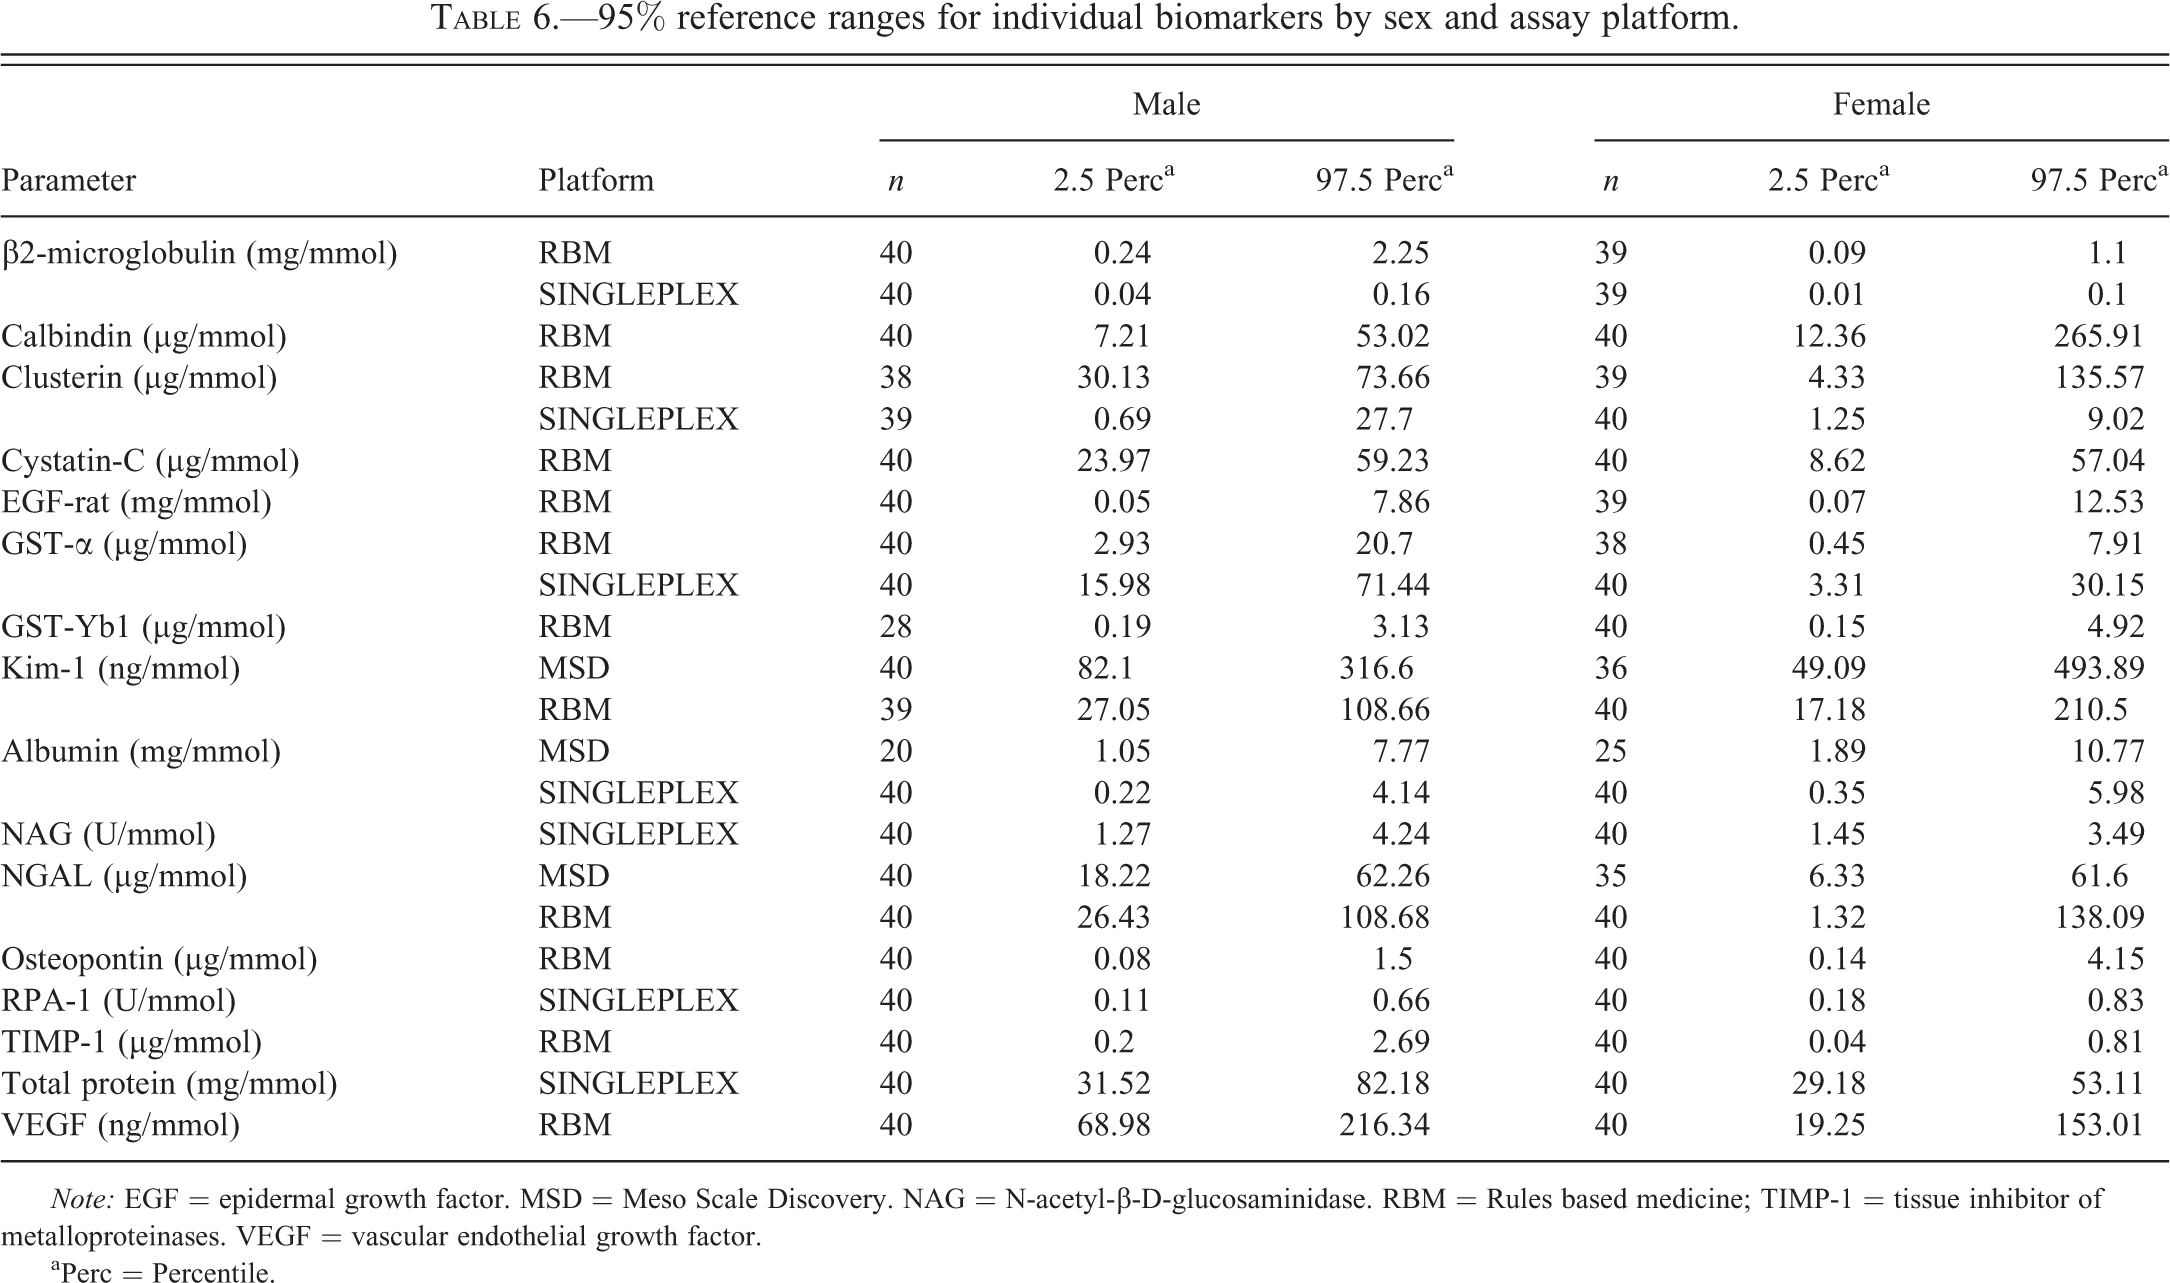
Note: EGF = epidermal growth factor. MSD = Meso Scale Discovery. NAG = N-acetyl-β-D-glucosaminidase. RBM = Rules based medicine; TIMP-1 = tissue inhibitor of metalloproteinases. VEGF = vascular endothelial growth factor.
aPerc = Percentile.
Discussion and Conclusions
The published evidence supporting the diagnostic utility of the urinary biomarkers included in this study is very variable. Seven of the biomarkers have been recently qualified by regulatory authorities for specifically defined use in rodent studies in nonclinical drug development (Table 2; EMA 2009, 2010; FDA 2008, 2010). While some of these seven qualified biomarkers (total protein, albumin, and β2-microglobulin) have been used for many years to report renal injury in rodent studies, data on the others have been generated much more recently, in many cases specifically to support the qualification process. Three other biomarkers included in the present study (NAG, GST-α, and GST-Yb1) have also seen widespread use in both nonclinical and clinical studies of renal injury, but the results of recent work in rats (Harpur et al. 2011) did not support their qualification for use in nonclinical studies. The remaining biomarkers measured in this study are regarded as exploratory, although there is promising evidence in support of the utility of some of them, notably NGAL and osteopontin.
Adoption of any new biomarker into routine practice requires the generation of many data to provide confidence in the performance of the assays together with the generation of normal ranges and information on variability. In addition, there is a general dearth of information on the performance of the biomarkers in the female sex. This study was conducted to address these needs. The data generated here in the Sprague-Dawley rat, which is one of the breeds most commonly used in studies to support drug development, complement those from the recent study conducted in the Wistar rat (Pinches, Betts, Bickerton, Beattie, et al. 2012; Pinches, Betts, Bickerton, Burdett, et al. 2012).
In order to adjust for changes in urine flow, the most common method of expression of urinary biomarker values is after normalization to urinary creatinine content. This is the method that sees most widespread use and which was applied in all of the rat studies in which the data used to support qualification by the regulatory authorities were generated (Dieterle, Sistare, et al. 2010; Harpur et al. 2011). It was also used in the recent study comparing urinary biomarker excretion in both sexes of Wistar rats (Pinches, Betts, Bickerton, Beattie, et al. 2012; Pinches, Betts, Bickerton, Burdett, et al. 2012). When assessing the diagnostic performance of urinary biomarkers, it has been shown to produce comparable outcomes to an alternative method of expressing the biomarker values in terms of amount excreted per unit time (Harpur et al. 2011). However, the use of creatinine normalization requires demonstration that urinary excretion of creatinine is comparable between the groups under test and is not changed by any experimental procedure such as administration of a nephrotoxicant. In this study, normalization of the data to urinary creatinine was chosen after it was shown that for most biomarkers, a stronger linear relationship existed between biomarker concentration and creatinine concentration than urine volume. The decision to normalize the data to urinary creatinine was also influenced by the fact that it has been shown previously that the amount of creatinine excreted in urine remained constant over time in both control animals and rats treated with nephrotoxicants, including gentamicin (Harpur et al. 2011). The lack of effect of gentamicin-induced renal injury on urinary excretion of creatinine has been confirmed in the companion study (Gautier et al. 2014).
In order to measure all of the biomarkers of interest, it was necessary to use a variety of singleplex assays and a multiplex assay platform, RBM (Table 2). While the primary objective of the study was to make a comparison between the sexes in normal (control) urinary biomarker values and after nephrotoxic injury (Gautier et al. 2014), the opportunity was taken to make an evaluation of the performance of different assays. Therefore, 2 MSD multiplex assay kits were used to provide data on a total of 7 biomarkers, all of which were also assayed on a singleplex assay or the RBM platform, or both (Table 2). There were some important differences in the performance of the various assays. In the case of 4 assays (2 of the singleplex assays and 2 on the MSD multiplex kits) for 3 biomarkers (cystatin C, GST-Yb1, and osteopontin), the control values were either below the LLOQ or, when measurable, were extremely variable (Table 2). No data are presented from these assays, but data were available for each of these 3 biomarkers from the RBM multiplex platform. Where data for an individual biomarker were available on more than 1 assay platform, some differences in variability were noted (Tables 5a and 5b). While variability was generally greater on the RBM platform than on other platforms, the most striking difference in the results from different assays was in the magnitude of the values. Differences in individual biomarkers between platforms ranged up to 15-fold. These differences were probably due to the use of different antibodies with varying degrees of affinity and specificity between platforms. When comparing across biomarkers, there was no pattern in the direction of the difference between 2 platforms. However, where differences were observed between assays for an individual biomarker, they were seen in both sexes and consistent across samples collected at different time points. The clear implication of these observations is that results generated in different assays should not be compared. In the case of 5 biomarkers, there were some significant differences between the sexes in total variability (Table 5c). However, the magnitude of these differences was small; only in the case of total protein was the sex difference in variability greater than 2-fold, a difference that seemed to be attributable to a particularly low variability in females (Table 5b). It is evident from the preceding discussion that normal ranges (Table 6) must be considered specific to each sex and individual assay platform.
Published data on urinary biomarker values in the female sex are very sparse. Although both sexes are invariably included in nonclinical studies to support drug development, it is comparatively rare that studies using both sexes are reported in the literature. It is even rarer that studies have been conducted with the specific objective of examining sex differences in the presence and diagnostic performance of biomarkers. Nevertheless, sex differences in urinary biomarkers have been known for many years, for example, in urinary excretion of some enzymes, such as alanine aminopeptidase and γ-glutamyltranspeptidase (Grotsch et al. 1985), total protein (Fuchs et al. 2012; Remuzzi et al. 1988; Tanner 2009), and β2-microglobulin (Morel, Payan, and de Ceaurriz 1990). The results of the present study showed that there were differences between the sexes for the majority (14 of 16) of the biomarkers (Tables 3a–c). No sex difference was found in the urinary levels of NAG or EGF. The authors are not aware of any other published data for EGF in the female rat. In the case of NAG, the absence of a sex difference has been previously reported (Grotsch et al. 1985; Kolaja et al. 1994; Pinches, Betts, Bickerton, Beattie, et al. 2012). For 6 other biomarkers, calbindin, GST-Yb1, osteopontin, Kim-1, RPA-1, and NGAL, the evidence for a sex difference is considered to be weak or equivocal since it was not seen consistently at all time points and/or it was not always the same sex that showed the higher value. For the remaining 8 biomarkers, there was convincing evidence for a sex difference in basal urinary levels (Figure 1), even if the magnitude of the differences was mostly less than 2-fold and there was not absolute consistency in whether or not the differences were significantly different across platforms and at all time points. Values in males were significantly higher than in females for total protein, β2-microglobulin, clusterin, cystatin-C, GST-α, TIMP-1, and VEGF; female values were significantly higher than male values for albumin. The largest sex differences (male greater than female by 2- to 11-fold) were seen with β2-microglobulin, GST-α, and TIMP-1. In the case of β2-microglobulin, this is consistent with the 4-fold difference (male greater than female) reported by Morel, Payan, and de Ceaurriz (1990) in the Sprague-Dawley rat. For some of these biomarkers (total protein, albumin, GST-α, and RPA-1), it is possible to compare sex differences seen in this study in the Sprague-Dawley rat with sex differences reported in the Wistar rat (Pinches, Betts, Bickerton, Beattie, et al. 2012). While direct comparison of the data between the 2 breeds would be unwise due to differences in study design, assay format, and expression of the results, nevertheless the existence, magnitude, and direction (male greater than female or vice versa) of a sex difference in basal urinary excretion of these biomarkers showed good concordance between the Sprague-Dawley and Wistar rats. In the case of total protein, evidence for strain concordance is corroborated by other results in the Wistar (Fuchs et al. 2012; Remuzzi et al. 1988; Tanner 2009) and Fischer-344 (Kolaja et al. 1994) strains. The basis of the sex difference in urinary total protein content is quite well understood (Stonard 1990). It is mainly attributable to differences in sex-dependent low molecular weight proteins such as the β2-microglobulin and, particularly, α2U-globulin (Swenberg 1993). Alpha2U-globulin is synthesized under androgenic control in the liver of male rats and freely filtered in the glomeruli but only about 50% is reabsorbed in the tubules, the rest appearing in the urine. It is almost completely absent in female rat urine. The basis for sex differences in urinary excretion of some of the other biomarkers is not so well understood. Pinches, Betts, Bickerton, Beattie, et al. (2012) considered that the reported sex differences in urinary concentration of GST-α and RPA-1 were of magnitudes that are unlikely to reflect the influence of normalization to urine creatinine. The influence of normalization can also be rejected as an explanation in the current study since there was almost no difference in the urinary concentration of creatinine between male and female rats (3.8 µmol/l vs. 4.1 µmol/l). Pinches, Betts, Bickerton, Beattie, et al. (2012) did propose an explanation for the greater urinary excretion of RPA-1 in female rats. Using immunohistochemistry, they showed that staining for RPA-1 was present in the S3 segment of the proximal tubule as well as the collecting duct in female rats whereas it was confined to the collecting duct in male rats. While this provides no quantitative information, they felt that this sex difference in expression of RPA-1 in renal tissues could account for the greater urinary excretion of RPA-1 in female rats. The results of the present study for RPA-1 are consistent with those of Pinches, Betts, Bickerton, Beattie, et al. (2012) with a trend for female values to be higher than male values; however, the evidence for a sex difference was considered weak and requires confirmation. No RPA-1 immunohistochemistry was conducted in this study, so it is not known if a differential distribution of RPA-1 is also present in renal tissue of male and female Sprague-Dawley rats.
In summary, this study has used samples from both sexes of the Sprague-Dawley to provide information on assay performance (normal ranges and variability estimates) for a broad range of urinary biomarkers measured on several assay platforms. While variability was generally greater on the RBM platform than other assays, the more striking difference in the results from different assays was in magnitude. Where differences were observed between assays for an individual biomarker they were seen in both sexes and consistent across samples collected at different time points. Differences of up to 15-fold were observed for some biomarker values between assays indicating that results generated using different assays should not be compared. Sex differences in urinary excretion of the majority of the biomarkers were identified, which provide a useful framework for considering any potential relevance of these sex differences for the diagnostic performance of these urinary biomarkers.
Footnotes
Acknowledgment
We thank Pascal Le Priol from Sanofi for excellent technical assistance in this work.
Authors’ Note
The International Life Sciences Institute (ILSI) Health and Environmental Sciences Institute (HESI) Committee on Biomarkers of Nephrotoxicity is a consortium of pharmaceutical companies and government and academic scientists, whose mission is to advance development of biomarkers of renal toxicity that bridge from the preclinical to the clinical stages of drug development. HESI is an international, nonprofit organization that stimulates and supports scientific research that contributes to the collaborative identification and resolution of health and environmental issues of concern to the public, scientific community, government agencies, and industry.
The author(s) declared no potential conflicts of interest with respect to the research, authorship, and/or publication of this article. This publication stems from the work conducted as an in-kind contribution by a subgroup of members of the HESI Biomarkers of Nephrotoxicity Committee, which is coordinated and funded through ILSI HESI.
The author(s) received no financial support for the research, authorship, and/or publication of this article.