
Abstract
To assess relative sensitivity for detection of cytokines and chemokines in cynomolgus serum samples, we tested three commercially available multiplex array kits using the Luminex® platform with sera from animals exposed by intravenous injection to 150 μg/kg staphylococcal enterotoxin B (SEB) or 20 μg/kg lipopolysaccharide (LPS). Each of these kits detected similar patterns of changes in circulating cytokines/chemokines in response to SEB or LPS stimulation, especially the induction of high amounts of interleukin (IL)-2 and interferon-gamma (IFN-γ) in response to SEB but not LPS. However, there were clear differences in sensitivity for particular analytes, especially for IL-10. Additional experiments that focused on one multiplex array kit demonstrated very low or undetectable levels of cytokines in naive cynomolgus macaques, except for highly variable background levels of IL-8, monocyte chemoattractant protein-1, and macrophage inflammatory protein-1β. Therefore, multiplex array analysis of circulating cytokine/chemokine patterns was capable of detection of systemic activation of diverse immune cell subsets.
Introduction
Cynomolgus macaques (Macaca fasicularis) are an important species for both research and nonclinical toxicity testing (Green and Black 2000). Detection of changes in circulating cytokines and/or chemokines in cynomolgus macaques and other nonhuman primates may be indicative of underlying tissue inflammation or changes in immune system status in the presence of a novel therapeutic (Garcia et al. 2004; Hutchinson et al. 2001; Kircheis et al. 2007; Tarrant 2010). In addition, the pharmacologic activity of immunosuppressant therapeutics in cynomolgus and rhesus macaques has been assessed by monitoring cytokine release ex vivo in response to stimulants, such as staphylococcal enterotoxin B (SEB) or lipopolysaccharide (LPS; Krakauer et al. 2007; Zheng et al. 2009). The main challenge with detection of nonhuman primate cytokines/chemokines is that most of the detection methods make use of antihuman cytokine/chemokine-specific monoclonal antibodies that are presumed to cross-react with the respective macaque analytes. Therefore, ensuring the appropriate cross-reactivity and sensitivity of the detection reagents is important for obtaining accurate assessments of circulating cynomolgus cytokines and chemokines.
Within the past 5 to 7 years, commercial manufacturers of multiplex array platforms have made available kits for the detection of nonhuman primate (typically cynomolgus or rhesus macaque) cytokines and chemokines. For detection of human circulating cytokines/chemokines, studies involving direct kit-to-kit comparisons have shown that while kits from different manufacturers give the same pattern of results, the absolute amounts of cytokine/chemokine detected can vary between kits (Djoba Siawaya et al. 2008; Khan et al. 2004). Given the current interest in cytokine release in response to drug exposure in cynomolgus macaques, there is a need for understanding the relative performance of the available multiplex array kits. For our experimental purposes, the most critical assay performance characteristic of a multiplex array kit is the ability to detect concentration changes in circulating cytokines/chemokines in response to agent-induced modulation of the immune response. Therefore, we tested three commercially available multiplex array kits using the Luminex® platform for sensitivity in the detection of cynomolgus cytokines and chemokines using sera from animals exposed to either SEB or LPS. Once the relative sensitivities for the seven common cytokines and chemokines were determined, a single kit was used to measure circulating quantities of 10 different cytokines and chemokines in naive, healthy cynomolgus macaques to extend our knowledge of the performance characteristics of that kit.
Materials and Methods
Reagents
In this study, three commercially available multiplex Luminex kits were used: Kit A: MILLIPLEX MAP kit for Nonhuman Primate Cytokines-23Plex (Cat # MPXPRCYTO40K; Millipore, Billerica, MA). For this kit, the following standards and quality controls were provided in recombinant nonhuman primate proteins: interferon-gamma (IFN-γ), interleukin-1-beta (IL-1β), IL-2, IL-4, IL-5, IL-12, IL-13, tumor necrosis factor-alpha (TNF-α), and IL-18. The rest of the standards and quality controls were human proteins. The detecting antibodies were mostly generated against human proteins with the exception of IL-2 (monkey) and vascular endothelial growth factor (VEGF; mouse). Kit B: Monkey Cytokine 5-plex Panel and Monkey Chemokine 5-plex Panel (Cat# LPC 001 and LPC002; Invitrogen, Carlsbad, CA). For this kit, all the standards were human recombinant proteins. The original specificity of the detection antibodies was not provided. Kit C: Fluorokine MAP Primate Multiplex Kit (Cat#LKT006; R&D Systems, Minneapolis, MN). For this kit, all standards were recombinant rhesus or cynomolgus macaque proteins. The detection antibodies were generated against macaque proteins.
Each manufacturer provided spike recovery data for the analytes contained within each kit; a spiked recovery value between 80 and 120% is considered an acceptable indicator of assay accuracy. Assay accuracy in all three kits was similar, with the exception of Kit B's detection of monocyte chemoattractant protein-1 (MCP-1), for which the spiked recovery was slightly below 80%. Assay precision has been performed by the kit manufacturers and was not assessed in this current study.
Samples
All serum samples were collected from cynomolgus monkeys and the samples were stored at −70° to −80°C. Male/female cynomolgus monkeys (Macaca fascicularis), 5- to 14-year-old, were cared for in accordance with the Guide for the Care and Use of Laboratory Animals (Institute for Laboratory Animal Research, 1996). Animals were either single-/pair-housed indoors or group-housed outdoors in an Association for Assessment and Accreditation of Laboratory Animal Care International (AAALAC), Intl-accredited facility in species-specific housing. All research protocols and animal housing was approved by an Institutional Animal Care and Use Committee. Animals were fed a certified primate diet (PMI # 7532 Lab Fiber-plus, Richmond, IN) daily in amounts appropriate for the age and size of the animals and had ad libitum access to city water via automatic watering system or water bottle. Both food and nonfood enrichment were provided. Animals were maintained on a 12:12-hr light–dark cycle in rooms at 65° to 85°F temperature.
To measure the background levels of circulating cytokines and chemokines, serum samples were obtained from 10 healthy cynomolgus macaques (n = 5 males and 5 females). To induce circulating cytokines and chemokines, three cynomolgus macaques were injected intravenously with 150 μg/kg of SEB and another three cynomolgus macaques were injected intravenously with 20 μg/kg LPS. Serum samples from the SEB and LPS-injected animals were collected just prior to dosing (0 hr) and 2 hr and 8 hr postdosing. All serum samples were analyzed undiluted for kits A and B but were diluted 1:4 for kit C for all cytokine/chemokine assessments. The dilution factor used with kit C was factored into all subsequent calculations of the data generated by this kit.
Experiments
Serum samples from cynomolgus macaques exposed to either SEB or LPS were run twice with each tested multiplex array kits on separate days. Serum samples from naive cynomolgus macaques were run twice with kit C on separate days. For each multiplex array kit, the manufacturer’s protocol was followed. Briefly 96-well filter plates were blocked by pipetting 200 μl of wash buffer into each well. After 10 min, the wash buffer was discarded by vacuum aspiration and 25 μl of assay diluent was added to each well. According to the plate layout, 25 μl of either standard or sample was then added to appropriate wells after which 25 μl of antibody-coated fluorescent beads were added. Biotinylated secondary (detection) and streptavidin-phycoerythrin-labeled antibodies were then added sequentially to the plate, with alternate incubation and washing steps. Finally, 100 μl of sheath fluid was added to the wells, and plates were read on the Bio-Plex 100 array reader. Data were analyzed by Bio-Plex Manager 5.0 Software, and standard curves were generated using a 4-parameter logistic nonlinear regression fitting curve. Cytokine/chemokine levels are reported in picogram per milliliter (pg/ml). Data reported as below limits of quantitation (BLQ) or above limits of quantitation (ALQ) indicate that the calculated concentration for that analyte is too far off the standard curve to be accurately determined (see Table 1).
Comparison of three multiplex array kits for the detection of chemokines and cytokines in the sera of cynomolgus macaques (n = 3) prior to and after exposure to staphyloccocal enterotoxin B (SEB) or lipopolysaccharide (LPS).
Note: ALQ = above limits of quantitation; BLQ = below limits of quantitation; IFN = interferon; IL = interleukin; MCP-1 = monocyte chemoattractant protein-1; MIP = macrophage inflammatory protein; TNF-α = tumor necrosis factor-alpha.
BLQ: indicates that the value is below the limit of quantitation based on the standard curve. ALQ: indicates that the value is above the limit of quantitation based on the standard curve.
aSerum samples from cynomolgus macaques were collected prior to dosing or 2 and 8 hr after dosing with SEB or LPS as described in Materials and Methods section. Samples were tested for cytokine and chemokine concentrations using each kit twice on separate days. As similar results were obtained with both runs for each kit, representative data from one run are shown.
Results/Discussion
Direct Comparison of Three Multiplex Panels for Detecting Cytokines and Chemokines in Cynomolgus Macaque Serum Samples
We tested multiplex array kits from three different vendors for the detection of nonhuman primate cytokines and chemokines; referenced below as kit A, kit B, and kit C (Materials and Methods Section). We performed a direct comparison of these kits to determine assay accuracy and sensitivity for multiple analytes. This assessment included the detection of the seven analytes that overlapped between the available kits: IFN-γ, IL-2, IL-8, IL-10, MCP-1, macrophage inflammatory protein-1 (MIP-1β), and TNF-α.
Assessment of Standard Curves
Figure 1 shows representative standard curves for each of the assessed analytes for each kit; standard curves were generated according to the manufacturers’ specifications. Recovery assessment of each standard was performed by back calculating concentrations of each standard following completion of regression analysis, and then comparing it to the actual concentration using the formula: Observed Concentration/Expected Concentration × 100. Any value for a standard outside of 80 to 120% of the actual value was flagged as outlier. As shown in Table 2, the standard curve performance for the seven analytes was similar for all three kits with the majority of the calculated values for the standard curves being within 20% of the expected values.
Representative standard curves from seven common analytes among the three tested multiplex array kits. Cytokines are indicated by solid symbols and lines, and chemokines are indicated by open symbols and dotted lines. A. Standard curves for kit A: 6-point
Representative standard curve recovery data for kits A, B, and C.
Note: IFN = interferon; IL = interleukin; MCP-1 = monocyte chemoattractant protein-1; MIP = macrophage inflammatory protein; TNF-α = tumor necrosis factor-alpha.
aFor each point on standard curve, the percentage recovery was determined by the following equation: Observed Concentration/Expected Concentration × 100. b1:5 serial dilution from the highest standard S1 (10,000 pg/ml) to lowest standard S7 (0.64 pg/ ml) in kit A. cFor kits B and C, standard curves were generated from 1:3 serial dilution from the highest standard S1, the concentration of which varies by analyte and by kit lot number.
Individual Analyte Detection Using Serum Samples from SEB-treated and LPS-treated Cynomolgus Macaques
To compare the performance of the kits for detection of cytokines/chemokines during an inflammatory response, cynomolgus macaques were given 150 μg/kg SEB (n = 3) or 20 μg/kg LPS (n = 3) intravenously. SEB was chosen as the proinflammatory agent because of its ability to directly activate both T cells and monocytes to cause cytokine release (Ulrich, Bavari, and Olson 1995), while LPS mainly activates innate immune cells which express toll-like receptor-4 (TLR4; Beutler 2000). Blood samples were collected from the animals immediately prior to dosing (0 hr) and 2 and 8 hr postdosing. The samples were tested with kits A, B, and C. As shown in Table 1, all three kits gave equivalent results for the detection of the tested circulating cytokines/chemokines at the predose (0 hr) time point, with the exception of IL-8. The values for IL-8 given by kit B were up to 100× lower than the values given by kits A and C. All tested kits showed similar patterns in the changes of serum cytokine/chemokine concentrations in response to SEB and LPS exposure. In general, TNF-α and MIP-1β peaked at the 2-hr time point and decreased by the 8-hr time point, and MCP-1 was elevated at both 2- and 8-hr time points. In addition, serum samples from SEB-treated animals had increased IL-8 and IL-2 concentrations that peaked at the 2-hr time point and IFN-γ concentrations that peaked at 8 hr after dosing, while the serum samples from LPS-treated animals showed no changes in IL-8, IL-2, or IFN-γ.
Although the overall pattern of chemokine changes in response to exposure to LPS and SEB was similar between the three tested kits, the detected amounts of each chemokine varied between the kits. For example, the concentrations of circulating MCP-1 at 2- and 8-hr time points were approximately 10- to 20-fold above 0 hr values using kit A, approximately 25- to 50-fold above 0 hr values with Kit B, and extrapolated beyond the range of the standard curve with kit C for the SEB response samples (Table 1). Similar discrepancies were observed in the concentrations of MIP-1β in samples from both LPS- and SEB-treated animals, with the values from the kit C at the 2- and 8-hr time points being 40- to 50-fold and 4- to 25-fold greater than the values from kit A and kit B, respectively (Table 1). For detection of IL-8, kit B reported greater than 50-fold lower concentrations compared to kit A and kit C at all tested time points in SEB-treated animals (Table 1).
Similar to the results with the detection of chemokines, the overall pattern of cytokine changes in response to exposure to LPS and SEB was similar with the three tested kits, although the detected amounts of each cytokine varied between the kits. In detection of TNF-α in response to LPS, kit C gave the highest values (1,618–2,858 pg/ml), followed by kit A and kit B (267–751 pg/ml; Table 1). Changes in circulating IL-2 and IFN-γ were observed after exposure to SEB but not LPS. Kit C gave the highest concentration IFN-γ at the 2-hr time point. However, at the 8-hr time point, values were well above the highest point on the standard curve, which was ∼1,200 pg/ml. This suggests that kit C may have a limited detection range for high concentrations of IFN-γ in comparison with kits A and B, in which the IFN-γ standard curve extended up to 10,000 pg/ml (Figure 1). All three kits showed a peak of circulating IL-2 at the 2-hr time point, with kit B showing the highest values within the range of its standard curve. The clearest difference between the kits was observed with the detection of IL-10 (Table 1). Kit B reported no detectable circulating IL-10 after exposure to SEB or LPS, while both kit A and kit C detected increases in circulating IL-10 at the 2-hr time point (SEB and LPS) and the 8-hr time point (SEB), albeit with different sensitivities: the values determined using kit C were 10- to-280-fold higher than the values determined using kit A. As the IL-10 standard curve material for kit B was recombinant human protein, we were unable to confirm that the detection reagents in kit B had cross-reactivity for cynomolgus macaque IL-10.
Detection of Serum Cytokines in Naive Cynomolgus Macaques
As discussed earlier, all three kits showed similar predose values of the examined analytes, with the exception of IL-8. However, as only a small number of animals were used in that experiment, we wanted to confirm the background levels of 10 different circulating cytokines and chemokines in five male and five female naive, healthy macaques. Based on the results indicating a higher sensitivity for low concentrations of IL-10 and IFN-γ, we decided to use only kit C for this analysis and included the following analytes available with kit C: IFN-γ, IL-1β, IL-2, IL-5, IL-6, IL-8, IL-10, TNF-α, MIP-1β, and MCP-1. As shown in Figure 2, IFN-γ, IL-1β, IL-5, and IL-10 concentrations were either at or below the limits of detection for all animals. IL-2, IL-6, and TNF-α were present in low amounts in the sera of most animals, with a few animals having concentrations >50 pg/ml. These low levels of IL-2, IL-6, and TNF-α were unexpected since no detectable levels of these cytokines were measured at the 0-hr time points of SEB-treated and LPS-treated animals (see Table 1). The serum concentrations of MIP-1β in the naive animals ranged from 50 to 175 pg/ml (Figure 2). The chemokines MCP-1 and IL-8 were present at relatively high concentrations in naive cynomolgus macaques and demonstrated the most interanimal variability: IL-8 concentrations ranged from 850 to 4,000 pg/ml and MCP-1 concentrations ranged from 250 to 1,000 pg/ml. These data indicate that naive cynomolgus macaques have high interanimal variability in background levels of some cytokines and chemokines, especially IL-8, MCP-1, and MIP-1β. We did not assess intra-animal variability in circulating cytokines (i.e., sampling the same naive animal repeatedly over a time period): it is possible that normal variations in circulating cytokines within naive animals could be enhancing the high inter-animal variability in circulating IL-8, MCP-1, and MIP-1β.
Detection of cytokines and chemokines in sera from naive, healthy cynomolgus macaques. Serum samples were collected from male and female macaques (n = 5 per sex, age range 5- to 17-year-old) and analyzed for detection of cytokines and chemokines using kit C on 2 separate runs. Data shown are representative of results from 1 run. Each symbol represents the value for an individual animal. Circles indicate samples from males; triangles indicate samples from females. Values for IL-1β, IL-5, IL-10, and IFN-γ were all below the limits of quantitation based on the standard curves. IL = interleukin; IFN = interferon.
The inherent attraction of multiplex array technologies for assessment of circulating proteins is to allow for detection of a broad spectrum of analytes using one sample in a relatively short time span. The most appropriate role for multiplex array kits may be for screening purposes: to find of patterns of analyte expression rather than precise measurement of absolute concentrations or quantitative changes in concentrations. For example, we were able to detect differences in the serum cytokine profiles in response to SEB versus LPS exposure: SEB-treated animals had increases in serum concentrations in IL-2 at both the 2-hr and 8-hr time points and had ≥100-fold higher serum concentrations of IFN-γ compared to LPS-treated animals (Table 3). Our data suggest that, at a minimum, users must confirm that multiplex array kits are capable of detecting the cytokines/chemokines of interest in positive control samples, such as macaque serum samples known or expected to contain analytes of interest. Given the current interest in measuring cytokine release in cynomolgus macaques in nonclinical drug studies, knowledge of the performance characteristics of multiplex array kits will give greater confidence in reported results. Therefore, selection of the appropriate multiplex array kit for detection of changes in serum cytokine and chemokine concentrations in cynomolgus macaques will depend on experimental design and the analytes of interest.
Changes in circulating cytokine/chemokines in cynomolgus macaques after injection with either lipopolysaccharide (LPS) or staphyloccocal enterotoxin (SEB).
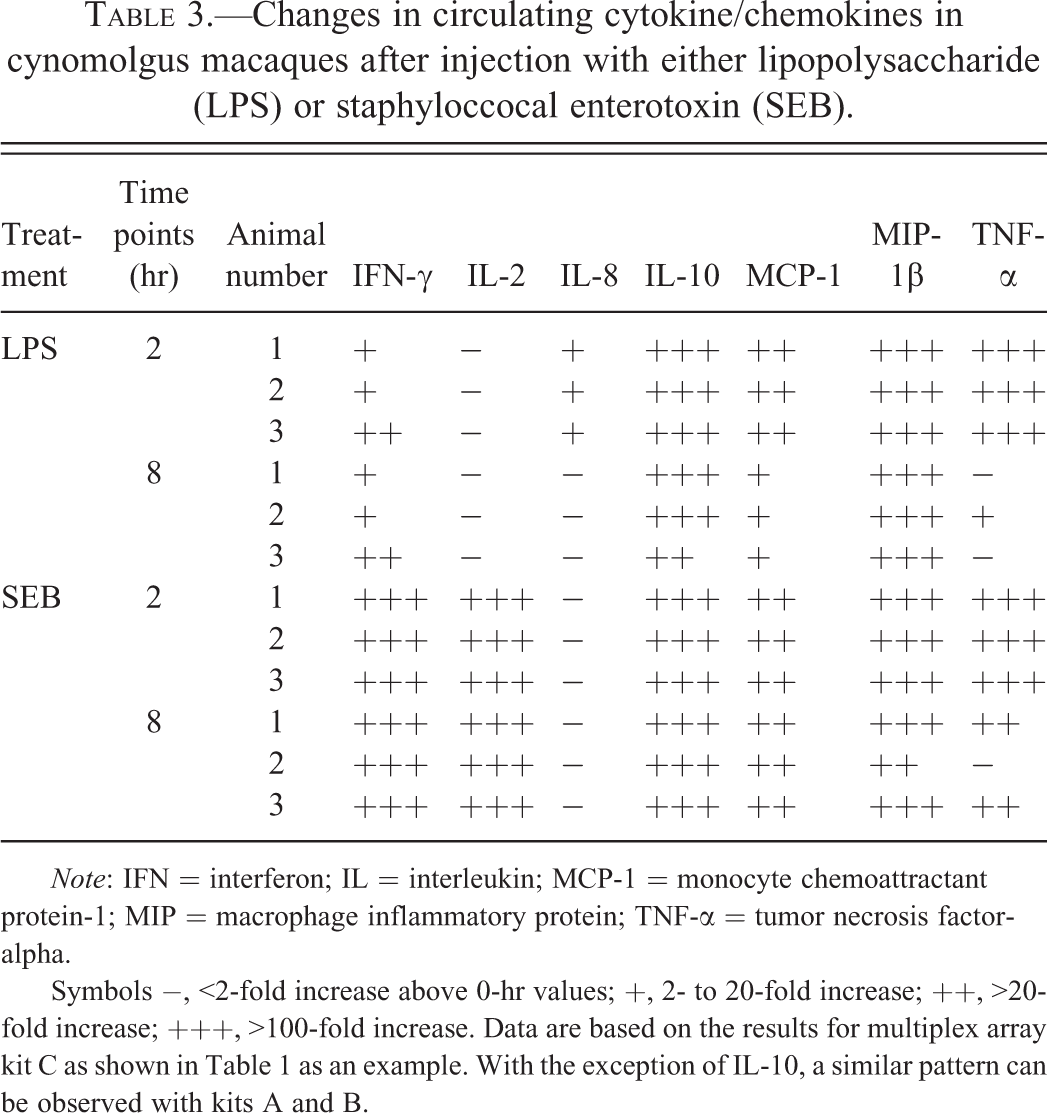
Note: IFN = interferon; IL = interleukin; MCP-1 = monocyte chemoattractant protein-1; MIP = macrophage inflammatory protein; TNF-α = tumor necrosis factor-alpha.
Symbols −, <2-fold increase above 0-hr values; +, 2- to 20-fold increase; ++, >20-fold increase; +++, >100-fold increase. Data are based on the results for multiplex array kit C as shown in Table 1 as an example. With the exception of IL-10, a similar pattern can be observed with kits A and B.
Footnotes
The author(s) declared no potential conflicts of interest with respect to the research, authorship, and/or publication of this article.
The author(s) are employees of Amgen Inc. which funded this work.