
Abstract
Cynomolgus monkeys dosed with a therapeutic monoclonal antibody (mAbY.1) at ≥50 mg/kg had unexpected acute thrombocytopenia (nadir ∼3,000 platelets/µl), sometimes with decreases in red cell mass. Increased activated macrophages, mitotic figures, and erythrophagocytosis were observed in the spleen. Binding of mAbY.1 to cynomolgus peripheral blood cells could not be detected in vitro. mAbY.1 induced phagocytosis of platelets by peripheral blood monocytes from cynomolgus monkeys, but not from humans. mAbs sharing the same constant domain (Fc) sequences, but differing from mAbY.1 in their variable domains, bound competitively to and had similar biological activity against the intended target. None of these antibodies had hematologic liabilities in vitro or in vivo. Neither the F(ab’)2 portion of mAbY.1 nor the F(ab’)2 portion on an aglycosylated Fc (IgG1) framework caused phagocytosis of platelets in vitro. These data suggest that the hematologic effects of mAbY.1 in cynomolgus monkeys likely occurred through an off-target mechanism, shown to be driven by 1 to 3 amino acid differences in the light chain. The hematologic effects made mAbY.1 an unsuitable candidate for further development as a therapeutic agent. This example demonstrates that nonclinical safety studies may be essential for understanding off-target effects of mAbs prior to clinical trials.
Keywords
Introduction
Acute profound cytopenias due to shortened circulating lifespan of blood cells are occasional unexpected side effects of drugs in humans (Aster 2007). The incidence of thrombocytopenia resulting from the administration of therapeutic mAbs is fairly low but has been reported with mAbs directed against a variety of targets (Hansel et al. 2010). Thrombocytopenia, sometimes with other cytopenias, occurs at higher incidence with administration of some therapeutic interferons (IFN), interleukins (IL), and hematopoietic growth factors (e.g., IFNγ, IL-21, IL-3, IL-18, macrophage colony stimulating factor [M-CSF], granulocyte-macrophage colony stimulating factor [GM-CSF]; Everds and Tarrant in press).
In nonclinical studies, unexpected cytopenias associated with therapeutic mAbs have been infrequently reported. Putative off-target effects presenting as decreases in platelets were observed in cynomolgus monkeys during nonclinical in vivo testing of mAbs against IL-13, immunoglobulin (Ig)E, an unspecified cell-based target, and in rats dosed with a mAb against sclerostin (Adis, 2002; Martin et al. 2008; Rudmann et al. 2011; Santostefano et al. 2012).
Clinically conditions, cytopenias can be caused by activated macrophages that phagocytose normal RBCs and platelets. Collectively, these clinical conditions are known as hemophagocytic syndromes (HPS) and can be congenital or acquired. Antitumor necrosis factor-alpha (TNFα) drugs and recombinant human (rh)IL-3 have been implicated in rare instances of acquired human HPS with concurrent thrombocytopenia and anemia (Aouba et al. 2003; Araki et al. 2011; Hurwitz et al. 1996; Ramanan and Schneider 2003; Sandhu et al. 2007; Stern, Riley, and Buckley 2001). HPS has also been demonstrated or hypothesized in nonclinical and clinical studies after administration of rhIL-21 or rhIL-3 to cynomolgus monkeys (van Gils et al. 1993; Waggie et al. 2012), recombinant murine (rm)IL-4, rmIL-18, or rmIFN-γ to mice (Milner et al. 2010; Herzyk et al. 2003; Zoller et al. 2011), hematopoietic growth factors M-CSF and GM-CSF to several species including humans (Abrams et al. 2003; Baker and Levin 1998, Garnick and O’Reilly 1989; Johnson et al. 1993; Munn, Garnick, and Cheung 1990; Nash et al. 1995; Tomer et al. 1993; Vitt et al. 1994; Zamkoff et al. 1992), and an anti-EGFL7 mAb to rats (Couch et al. 2010).
mAbY.1 is a human IgG2 directed against a human cell surface membrane-bound protein. mAbY.1 is pharmacologically active against the intended target in both humans and cynomolgus monkeys and exhibits similar potency against the target in both species. Hematologic liabilities have not been reported in nonclinical and clinical studies with small molecules against the same target. In a nonclinical toxicity study, mAbY.1 was administered to cynomolgus monkeys. Mild to marked decreases in platelets and minimal to marked decreases in erythrocytes were observed at doses ≥50 mg/kg. In response to these observations, additional in vivo and in vitro studies were conducted to understand the mechanism for mAbY.1-mediated platelet and erythrocyte decreases. These investigations demonstrated that administration of mAbY.1 to cynomolgus monkeys resulted in phagocytosis of platelets and erythrocytes by activated macrophages. Other mAbs that compete for binding against the same intended target with similar potencies did not have these unexpected effects in vivo or in vitro. mAbY.1-induced in vitro phagocytosis of platelets was observed with cynomolgus monocytes/macrophages and was not observed in human monocytes/macrophages.
Materials and Methods
Animals and Husbandry
Nave male and female cynomolgus monkeys (Macaca fascicularis) of Chinese or Mauritius origin, 2 to 12 years old (1.9–4.4 kg), were housed in stainless steel cages. Care and use of animals was as specified by United States Department of Agriculture Animal Welfare Act (9 CFR, Parts 1, 2, and 3) and as described in the Guide for the Care and Use of Laboratory Animals (Institute for Laboratory Animal Research [ILAR] 1996) and/or the Canadian Council on Animal Care. Animals were individually or socially housed indoors in species-specific housing at a Canadian Council on Animal Care and/or Association for Assessment and Accreditation of Laboratory Animal Care-accredited facility. All research protocols were approved by the Testing Facility (Charles River Laboratory [CRL] Montreal or CRL-Reno) Institutional Animal Care and Use Committees (IACUC) prior to dose administration. All animals were negative for simian retrovirus.
Certified Primate Diet (#5048, PMI, Richmond, IN or #2050C, Harlan, Indianapolis, IN) was provided daily in amounts appropriate for the age and size of the animals. Animals had ad libitum access to water (reverse osmosis-purified and passed through ultraviolet light treatment) via automatic watering system/water bottle. Animals were maintained on a 12:12 hr light: dark cycle in rooms at 18° to 29°C and 30 to 70% humidity and had access to enrichment opportunities (including some or all of the following: treats, fresh fruit, toys, grooming bars, and social interaction).
Test Articles
mAbY.1, mAbY.2, mAbY.3, mAbY.4, mAbY.5, and mAbY.6 are Xenomouse®-derived fully human monoclonal antibodies (IgG2) against the same cell surface receptor (target). Sequences of these mAbs were compared using VectorNTI software (Invitrogen/Life Technologies Corp., Grand Island, NY). mAbY.1, mAbY.2, mAbY.3, mAbY.4, mAbY.5, and mAbY.6 have identical constant domain sequences (Table 1). mAbY.2, mAbY.3, mAbY.4, mAbY.5, and mAbY.6 differ in their primary amino acid sequence from mAbY.1 in the variable regions but have comparable potency in cell-based assays and compete with mAbY.1 (and with each other) for binding to the target (data not shown). Mod-mAbY.1 is a molecule that has the same F(ab’)2 as mAbY.1 and an aglycosylated IgG1 Fc portion with low FcγR binding. mAbY.1/6 and 6/1 chimeras were generated by combining the heavy chain of mAbY.1 with the light chain of mAbY.6 and the heavy chain of mAbY.6 with the light chain of mAbY.1, respectively. Molecular modeling of a generic IgG was performed with Molecular Operating Environment software (Chemical Computing Group, Inc., Montreal, Canada). The 1HZH structure from the Protein Data Bank (Research Collaboratory for Structural Bioinformatics) was utilized for modeling.
Test articles.
Stocks of target-specific mAbs (mAbY.1, mAbY.2, mAbY.3, mAbY.4, mAbY.5, and mod-mAbY.1) were at 70 mg/mL in a vehicle formulation consisting of 9% (w/v) sucrose solution, buffered with 10 mM sodium acetate, adjusted to pH 5.2, and stabilized with 0.004% (w/v) polysorbate 20. Stocks were diluted prior to dosing as needed. Vehicle control consisted of the vehicle formulation alone.
Serum concentrations of mAbY.1, mAbY.2, mAbY.3, mAbY.4, mAbY.5, and mod-mAbY.1 were measured using a validated enzyme-linked immunosorbent assay (ELISA) with a lower limit of quantification of 10 ng/mL. Noncompartmental kinetic analysis was conducted on serum concentration–time data using WinNonlin Enterprise (version 5.1.1, Pharsight Corporation, St. Louis, MO). The following toxicokinetic parameters were estimated: the maximum observed concentration (C max) and the time for C max (T max) were observed values from the concentration versus time data and the area under the concentration time curve was calculated using the linear trapezoidal method.
Anti-mAbY.1 antibodies were assessed using an electrochemiluminescence-based immunoassay to detect antibodies capable of binding specifically to any portion of mAbY.1. Samples found to be positive for binding antibodies were further tested using a validated cell-based bioassay to evaluate neutralizing capacity of the anti-drug antibodies.
Main Study Design
mAbY.1 was administered to male and female cynomolgus monkeys for a total of 4 doses by subcutaneous (sc) injection at dose levels of 0 (vehicle control), 10, 50, or 300 mg/kg, or by intravenous (iv) bolus injection at 300 mg/kg (6–12 animals/group). The vehicle control and mAbY.1 were administered at a dose volume of 4.3 mL/kg and a rate of approximately 5 mL/min was used for the iv administrations. Weekly dosing was originally planned for the main nonclinical toxicity study. Because of unexpected hematologic effects, the interval between the first and second doses was extended to 3 weeks to allow recovery of hematology parameters between dosing; subsequent doses were every 2 (10 mg/kg) or 3 (50 mg/kg and 300 mg/kg) weeks. Standard toxicologic parameters were measured including clinical signs, body weight, food consumption, clinical pathology, toxicokinetics, antidrug antibody assessment, peripheral blood lymphocyte subsets (T cells, B cells, and NK cells), necropsy, and histopathology.
All animals were fasted overnight before scheduled necropsy. All animals were sedated with ketamine HCl, weighed, euthanized using sodium pentobarbital-administered iv, and exsanguinated. A complete gross pathology examination was conducted. Macroscopic observations and standard organ weight parameters were determined.
Sections of standard organs and tissues were collected and fixed in neutral buffered 10% formalin, Davidson’s solution, or modified Davidson’s solution. All tissues were embedded in paraffin wax, sectioned, and stained with H&E for microscopic examination.
Blood collection was conducted from nonsedated restrained animals in a stratified manner across groups and sexes. Animals were fasted when blood was collected for clinical chemistry. Blood samples were collected for hematology, coagulation, and clinical chemistry from the femoral vein of animals at predose and at 40 and 72hr postdose, followed by hematology collections every 3 to 7 days (totaling 1–3 collections per week) throughout the study. Additional coagulation and clinical chemistry collections were taken prior to subsequent doses. Urinalysis was performed once pretreatment and during the last week of the dosing phase.
The following hematology parameters were measured using a Bayer Advia 120® Automated Hematology Analyzer (Siemens Healthcare, Deerfield, IL): RBC count, hemoglobin concentration, hematocrit, mean corpuscular volume (MCV), mean corpuscular hemoglobin concentration (MCHC), mean corpuscular hemoglobin (MCH), red cell distribution width (RDW), reticulocyte count, platelet count, mean platelet volume (MPV), mean platelet component (MPC), and white blood cell (WBC) counts, including automated differentials. Hematology data were recalculated using adjusted gating to eliminate interference of small hypochromic RBCs with platelet counts and large platelets with RBC counts (Jordan et al. in press). Blood smears were evaluated microscopically for morphology. Manual WBC differential counts were performed on selected samples. Standard coagulation, clinical chemistry, and urinalysis parameters were measured using standard procedures and an ACL Advance (Beckman-Coulter, Brea, CA), a Hitachi P800 (Roche Diagnostics, Indianapolis, IN), and a Bayer Atlas (Siemens, Deerfield, IL), respectively.
Investigative Study Design
To investigate the early time course of mAbY.1-mediated effects, female cynomolgus monkeys received a single dose of mAbY.1, mod-mAbY.1, mAbY.2, mAbY.3, mAbY.4, or mAbY.5 (1 or 2 animals/group) at 300 mg/kg via iv bolus injection. The test articles were administered at a dose volume of 4.3 mL/kg at a rate of approximately 5 mL/min.
Clinical signs, body weight, body temperature, food consumption, and toxicokinetics were measured. Hematology parameters, reticulated platelets, and serum cytokines were evaluated measured in animals dosed with mAbY.1 at predose and at 2 (cytokines only), 6, 24, 48, and 72 hr postdose; lymphocyte subsets were evaluated at predose and at 2, 24, and 72 hr postdose. For the detection of serum cytokines, the Fluorokine MAP Primate Multiplex Kit (#LKT006, R&D Systems, Minneapolis, MN) was used according to the manufacturer’s specifications on a Bio-Plex 100 array reader and the following cytokines/chemokines were assessed: IL-1β, IL-2, IL-5, IL-6, IL-8, IL-10, IFN-γ, monocyte chemoattractant protein-1 (MCP-1), macrophage inflammatory protein(MIP)-1β, and TNF-α. Data were analyzed using Bio-Plex Manager 5.0 Software, and standard curves generated using 4-parameter logistic nonlinear regression fitting curves. Animals administered mAbY.1 and mod-mAbY.1 were necropsied 3 days postdose and limited tissues were weighed and processed for evaluation. All other animals were returned to the colony after 14 days.
The same hematology parameters described in the main study were evaluated in the investigative study. The following additional hematology parameters were determined: hemoglobin distribution width (HDW), corpuscular hemoglobin concentration mean (CHCM), platelet component distribution width (PCDW), and mean platelet dry mass (MPM). Blood smears from animals treated with mAbY.1 or mod-mAbY.1 were evaluated microscopically for blood cell morphology. Reticulated platelets were analyzed following published methods (Pankraz et al. 2008).
Macroscopic observations and organ weights were recorded at necropsy. Selected organs were fixed in neutral buffered 10% formalin and processed to glass slides. Sections were stained with H&E and evaluated by light microscopy. Splenic and bone marrow cytologic samples were prepared using touch-prep and paintbrush techniques, respectively. Cytologic slides were stained with Wright’s Giemsa and evaluated. Additionally, spleen was evaluated by immunohistochemistry (IHC).
Antibody Reagents for In Vitro Assays
The following detection antibodies used for flow cytometric analyses were purchased from BD Biosciences (San Jose, CA): CD14-PECy7 (#557742), CD41a-APC (#559777; mouse anti-human GPIIb), CD45-APC (#340943), CD61-FITC (#557291), and CD62P-PE (#550561; mouse anti-human P-selectin). Anti-human IgG-FITC (#A80-319F) was purchased from Bethyl Laboratories (Montgomery, TX). W6/32, an anti-human HLA-DR antibody, was purchased from Biolegend (#311423; San Diego, CA). Anti-streptavidin mAb is an in-house generated human IgG2 that was used as an isotype control for mAbY.1. Biotinylation of mAbY.1 was performed according to manufacturer’s directions using EZ-Link® NHS-PEG12-Biotin (#21312/21313, Thermo Scientific, Rockford, IL). F(ab’)2 fragments of mAbY.1 were prepared using standard methods. mAbY.1, mAbY.2, mAbY.3, mAbY.4, mAbY.5, mod-mAbY.1, and mAbY.1 F(ab’)2 were supplied in vehicle solution at concentrations of 70 mg/mL (mAbY.1 only) or 30 to 40 mg/mL.
Phlebotomy
Blood from cynomolgus macaques and human donors was collected into acid citrate dextrose, 3.2% sodium citrate, and sodium heparin for platelet activation, platelet aggregation, and blood cell binding flow cytometric analyses, respectively. Blood samples were used within 2 to 4 hr of collection for most studies except when indicated otherwise. For platelet aggregation and activation studies, blood was collected from subjects not exposed to aspirin, ibuprofen, or other anti-inflammatory analgesics for the previous 7 days.
Preparation of Platelet-rich Plasma (PRP) and Washed Platelets (wPLT)
Whole blood samples from human donors or cynomolgus macaques were centrifuged at 170g for 15 min without braking. PRP was collected from the top layer and used for platelet aggregation experiments (see below) or further processed to isolate wPLT. To prepare wPLT, PRP was diluted in 5 volumes of citrate wash buffer (11 mM glucose,128 mM NaCl, 4.3 mM NaH2PO4, 7.5 mM Na2HPO4, 4.8 mM sodium citrate, 2.4 mM citric acid, 0.35% [w/v] bovine serum albumin, pH 6.5) and pelleted (600g). Platelets were resuspended in modified HEPES-Tyrode’s buffer (10 mM HEPES, 137 mM NaCl, 2.8 mM KCl, 1 mM MgCl2, 12 mM NaHCO3, 0.4 mM Na2HPO4, 0.35% [w/v] BSA, 5.5 mM glucose, pH 7.4) in a volume equal to original PRP volume.
Investigation of Binding of mAbY.1 to Peripheral Blood Cells
Binding of mAbY.1 to peripheral blood cells was evaluated using flow cytometric analyses of whole blood and wPLTs, and a modified Coombs Test.
Binding of mAbY.1 was evaluated on RBCs, platelets, and leukocytes in whole blood samples from 5 healthy human donors and 5 cynomolgus monkeys using biotinylated mAbY.1 and streptavidin-conjugated phycoerythrin (SAV-PE; BD Biosciences, custom reagent) as the secondary detection reagent. Samples were analyzed on a FACS CantoII™ (BD Biosciences). Leukocytes were identified by expression of CD45 with monocytic, lymphocytic, and granulocytic subpopulations identified using light scatter (linear scale). Platelets and RBCs were identified using light scatter (log scale) and the expression of CD61 (platelets CD61-positive; RBC CD61-negative). Binding of mAbY.1 was reported as the shift in FL2 median fluorescent intensity (MFI) relative to cells stained with SAV-PE alone. As a positive control for mAb Y.1 binding, target-transfected Chinese hamster ovary (CHO) cells were added to aliquots of whole blood and stained along with the human and cynomolgus monkey blood cells.
In addition, binding of unlabeled mAbY.1 was assessed on wPLTs. Twenty microliters of wPLTs were incubated with mAbY.1 for 20 min at room temperature (RT), washed with PBS/1% FBS, and centrifuged for 6 min at 0.6 relative centrifugal force. Platelets were then stained with anti-CD41a-APC/CD62P-PE and antihuman IgG-FITC (40 µg/mL). The reaction mixtures were incubated for 20 min at RT, washed with PBS/1% FBS, and resuspended in 200 µl lyse/fix (2% formaldehyde in 10 mM HEPES, 0.15 mM NaCl, pH 7.4). Samples were analyzed on a flow cytometer as described above. Controls included anti-streptavidin mAb (human IgG2 isotype control) and a positive control, 5 mg/mL AMG X (human IgG2 with known capability to bind cynomolgus platelets; Santostefano et al. 2012).
mAbY.1 binding to RBCs was assessed using a modified Coombs Test. A 5% (v/v) suspension of washed (3×) cynomolgus RBCs in saline was prepared from EDTA-anticoagulated blood. A drop (approximately 50 µl) of cynomolgus RBC suspension or Ig-coated human RBCs (Coombscell-E; #16030100, Biotest Medical Diagnostics GmbH, Dreieich, Germany) was placed in each well in a 96-well round bottom plate. Two drops of serial 10-fold dilutions of mAbY.1 or neat anti-streptavidin human IgG2 isotype control were added to wells of cynomolgus RBC suspension, and incubated for 30 min at 37°C. Two drops of Coombs reagent (Antihuman Globulin Anti-IgG Catalog No 804175100, Biotest Medical Diagnostics GmbH, Dreieich, Germany) were added to each well. Plates were evaluated with and without centrifugation for lattice formation.
Measurement of Platelet Aggregation
Aggregation was measured using a Chrono-log 560vs Platelet Optical Aggregometer (Chrono-log Corporation, Havertown, PA). Materials tested (volume added; final concentration) were mAbY.1 (30 µl; 6.36 mg/mL), anti-streptavidin isotype control (30 µl; 2.99 mg/mL) and a positive control agonist, adenosine diphosphate (ADP; 5 µl; 10 µM). Aggregation was measured in whole blood by impedance and in PRP by light transmission.
Measurement of Platelet Activation
The control or test articles included various concentrations of mAbY.1 (0.2–14 mg/mL), 5 mg/mL anti-streptavidin mAb (human IgG2 isotype control), 5 µM 4-phorbol 12-myristate 13-acetate (PMA) as positive control, or 5 µl vehicle control (A52SuT). Control or test articles were added to 20 µl whole blood in a final volume of 25 µl and incubated for 20 min at RT. After incubation, anti-CD41a-APC (for identification of platelets) and anti-CD62P-PE (for assessment of activation), diluted in modified Tyrode-HEPES buffer, were added, each at 10 µg/mL final concentration, and incubated for 20 min at RT. Lyse/fixative solution (400 µl; 2% formalin, 10 mM HEPES, 0.15 mM NaCl, pH 7.4) was added to each sample and samples were stored at 4°C until analyzed by flow cytometry (FacsCalibur™, Beckton-Dickinson). Platelets were identified by gating on CD41a+ and excluding events with low forward scatter (FSC) to remove platelet-derived microparticles. Activated platelets were identified by an increase in MFI of CD62P compared with resting platelets. Data were analyzed using FlowJo software (v.7.3, Treestar, Ashland, OR).
Cytokine Release Assay
Whole blood samples from 3 cynomolgus monkeys were incubated at 37°C in 5% CO2 in a 96-well flat bottom plate (100 µl/well) for 2, 4, 6, and 24 hr in the presence of 100 µl of 10, 3, or 1 mg/mL mAb Y.1, 10 mg/mL anti-streptavidin isotype control mAb, or 10 μg/mL lipopolysaccharide (LPS; Sigma, St. Louis, MO) in culture media. At the specified time points, supernatants were collected and frozen at −80°C until analysis. Supernatant samples were tested for the presence of cytokines/chemokines using the multiplex array detection method described above for detection of serum cytokines in the investigative study. The following cytokines/chemokines were analyzed: IL-1β, IL-2, IL-6, IL-8, IFN-γ, TNF-α, MIP-1β, and MCP-1.
Phagocytosis Assay
Peripheral blood leukocytes (PBLs) and platelets were isolated from blood samples of cynomolgus macaques or human donors. Whole blood was centrifuged for isolation of PRP as described above. The bottom layers of the sample were centrifuged again at 2,000g for 10 min to obtain a platelet-poor plasma layer and buffy coat layer enriched for PBLs. After collection of the PBL/buffy coat layer, contaminating erythrocytes were lysed with BD Pharm Lyse™ (#555899; BD Biosciences). PBLs were then washed twice with RPMI-1640 with 10% FBS (#10082, Life Technologies) and resuspended in a final concentration of 5 × 10⁶ cells/mL.
Cynomolgus monocytes were purified from PBL preparations using Miltenyi Biotech Nonhuman Primate CD14 MicroBeads (#130091097, Miltenyi Biotech, Auburn, CA) using the manufacturer’s protocol. Flow cytometry gating on CD14+ cells was used to verify that the resulting preparation contained approximately 95% monocytes. Monocytes were washed twice with RPMI-1640 with 10% FBS and the final concentration was adjusted to 1 × 10⁶ cells/mL.
Platelets were labeled by incubating PRP with Cell Tracker™ Green CMFDA (5-chloromethylfluorescein diacetate; Invitrogen, Eugene, OR) at a final concentration of 20 µM for 30 min at RT. Labeled platelets were washed with PBS, resuspended in RPMI-1640 with 10% FBS, and the final concentration was adjusted to 1 × 10⁸ cells/mL.
CMFDA-labeled platelets (100 µL) and PBLs or purified monocytes (100 µL) from an autologous human or cynomolgus donor were incubated with various concentrations of test articles in the dark at 37°C. After 6 hr, the reaction was stopped by transferring the plates to ice. Extracellular fluorescence was quenched by incubating 2 min with 0.1% trypan blue (#15250, Life Technologies). Cells were washed twice with ice-cold PBS, incubated with propidium iodide (#P3566, Life Technologies) and anti-CD14-PE-Cy7 for 30 min at 4°C, and washed again. Cells were analyzed by a BD LSRII™ flow cytometer (BD Biosciences). CMFDA fluorescence was measured in CD14-expressing monocytes. The increase in CMFDA fluorescence intensity was used to estimate effects of various reagents on phagocytic capacity of monocytes for platelets.
Results
Administration of mAbY.1 to Cynomolgus Monkeys Resulted in Unexpected Profound Thrombocytopenia and Decreased Red Cell Mass
After the first dose of mAbY.1 in the main study, mild to marked decreases in platelet count were observed at doses ≥50 mg/kg by 40 hr postdose (Figure 1A). Minimal to marked decreases in RBC mass parameters (RBC counts, hemoglobin concentration, and hematocrit) with increased reticulocyte counts were observed at 300 mg/kg sc or iv and in 1 animal at 10 mg/kg (Figure 1B and C; Data not shown for RBC counts and hemoglobin concentration).
Time course of hematology effects after the first dose of mAbY.1 (main study). Points represent mean (SD) for n = 8–12/group.
Platelet counts were mildly to markedly decreased by 40 hr postdose in some animals at 10 mg/kg and all animals at ≥50 mg/kg sc or 300 mg/kg iv. The decreases in platelets were dose-related, similar at 300 mg/kg iv or sc, and similar in males and females. Platelet counts persisted near their nadir (with the lowest counts being approximately 3 × 10³/µL) for more than 10 days postdose, and recovered to or above predose values by 20 days postdose in all animals at 10 mg/kg or 50 mg/kg, and most animals at 300 mg/kg sc and iv. A few animals at 300 mg/kg sc and iv showed only minimal evidence of reversibility between doses. Decreased platelet counts were observed with concurrent increases in MPV at 300 mg/kg iv or sc (data not shown). After the second, third, and fourth doses, nadirs for platelet counts were generally less pronounced and recovery began or was completed by 6 days postdose. MPC, a measure of platelet granularity, was not affected by the test article, suggesting that platelets were not activated (data not shown). Clinical signs related to thrombocytopenia after the first dose included focal areas of petechiae, ecchymoses, and red coloration of the skin. External hemorrhage was not observed. The degree of petechial and ecchymotic hemorrhage was insufficient to account for the decrease in red cell mass observed in affected animals.
RBC mass parameters were mildly decreased in 1 animal at 10 mg/kg and minimally to moderately decreased in most animals at 300 mg/kg sc and iv (with the lowest hematocrit values of approximately 21%). The decreases in RBC mass were similar at 300 mg/kg iv or sc and had no sex predilection. Compared to platelets, the nadir for RBC mass parameters occurred slightly later and was shorter. Decreased RBC mass persisted for 13 to 20 days postdose and then recovered to approximate pretreatment values in the affected animal at 10 mg/kg and in most animals at 300 mg/kg sc and iv. Affected animals had increased reticulocytes starting at day 3 that returned to baseline as RBC mass recovered. Affected animals also had moderately to markedly increased RDW, but other RBC indices (MCV, MCH, and MCHC) were minimally and inconsistently affected (data not shown). A few animals at 300 mg/kg sc and iv with mild to moderate decreases in RBC mass parameters showed no or incomplete reversibility between doses. These animals had the most pronounced increases in reticulocyte counts, and spherocytes were noted on their blood smears. RBC mass effects were generally milder and occurred in fewer animals after the second, third, and fourth doses.
Additional clinical pathology changes were observed in groups at doses ≥50 mg/kg. Other hematologic changes after the first dose included increases in total WBCs, neutrophils, lymphocytes, and monocytes at day 3 (data not shown). Coagulation and clinical chemistry (measured predose and at days 3 and 22, prior to the second dose) included transiently increased fibrinogen (2.4× and 1.3× control group mean) and bilirubin (2.6 and 1.7× control group mean) on day 3 in males and females, respectively, and persistent increases in globulin (generally 1.2× control group means for both males and females) (data not shown). There were no alterations in peripheral blood lymphocyte subsets or coagulation times. Clinical pathology after subsequent doses included transient increases then decreases in monocyte, lymphocyte, and basophil counts after each dose. No changes in urinalysis parameters were noted.
In the investigational study, a single iv bolus dose of mAbY.1 was administered to 2 female cynomolgus monkeys at 300 mg/kg to assess the early time course of thrombocytopenia and evaluate changes in tissues at the nadir of the peripheral blood cell responses (72 hr). Mean platelet counts decreased by 43% within 2 hr of dosing and by 82% at day 3 (Figure 2A). Mean RBC mass parameters decreased by 21% at day 3 (Figure 2B). No changes in leukocytes, lymphocyte subsets, or serum cytokines were observed.
Early time course of platelet and hematocrit effects after a single dose of mAbY.1 (investigative study). Each line represents data from 1 animal.
mAbY.1 Administration Was Associated with Splenic Macrophage Proliferation, Activation, and Hemophagocytosis
No mortality occurred during the main or investigative toxicity studies. In the main study, animals were euthanized approximately 24 hr after the fourth dose of mAbY.1. At necropsy, splenic enlargement and moderate increases in splenic weights were observed in animals at ≥50 mg/kg (Table 2). The increased splenic weights correlated microscopically with hyperplasia of the mononuclear phagocyte system (MPS) in the red pulp (Table 3). The appearance of macrophage populations in other tissues (e.g., liver, brain, lymph nodes, and bone marrow) was similar to those of controls. Additional light microscopic changes included minimal to slight inflammatory infiltrates (consisting primarily of either neutrophils or mixed population of neutrophils, lymphocytes, and macrophages) in several tissues of animals at ≥50 mg/kg, and increased incidence of inflammation at injection sites in animals at ≥10 mg/kg.
Spleen weights after mAbY.1 administration (main study).
Note. SD = standard deviation.
Light microscopic findings in spleen.
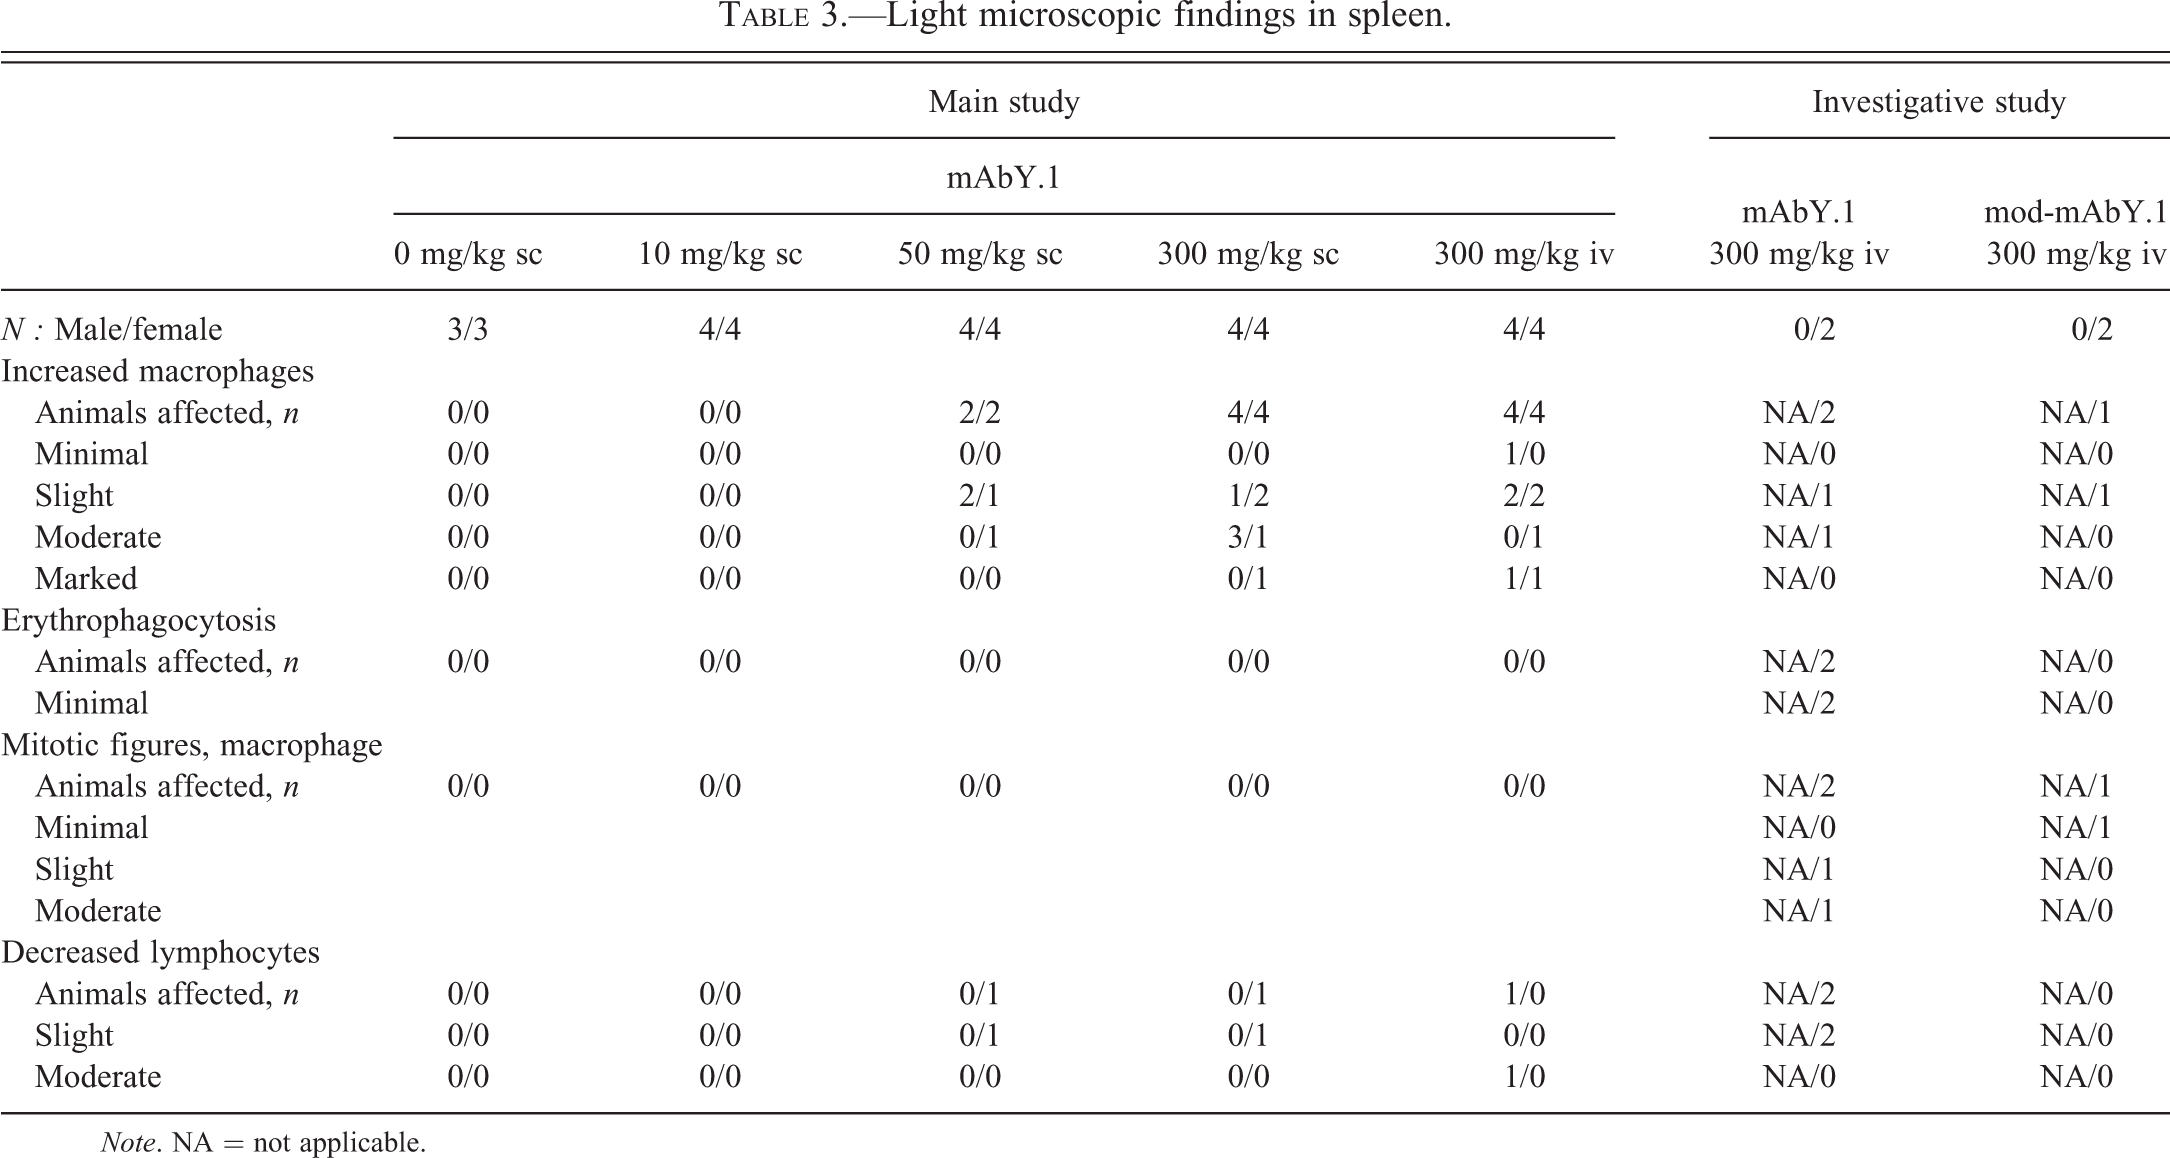
Note. NA = not applicable.
In the investigative study, 2 animals administered a single 300 mg/kg iv dose of mAbY.1 were euthanized 3 days after dosing. Microscopic findings attributed to mAbY.1 were limited to the spleen and were not observed in other organs containing macrophages such as liver, brain, lymph node, and bone marrow. Splenic cytology findings in animals dosed with mAbY.1 included minimal to moderate increased proportion of neutrophils, mildly increased proportion of macrophages, moderate to marked cytoplasmic vacuoles in macrophages, mild to moderate numbers of macrophages containing erythrocytes (erythrophagocytosis), and mildly increased mitosis (Figure 3A and B). The principal histologic change in the splenic red pulp was alteration of the MPS, characterized by increased numbers of macrophages with increased numbers of mitotic figures (Figure 3C) and occasionally erythrophagocytosis. The identity of the macrophages was confirmed by IHC staining utilizing antibodies directed against CD68, CD163, and CD16 (data not shown). Adequate to mildly increased numbers of megakaryocytes without morphologic changes were observed cytologically in bone marrow of these animals.
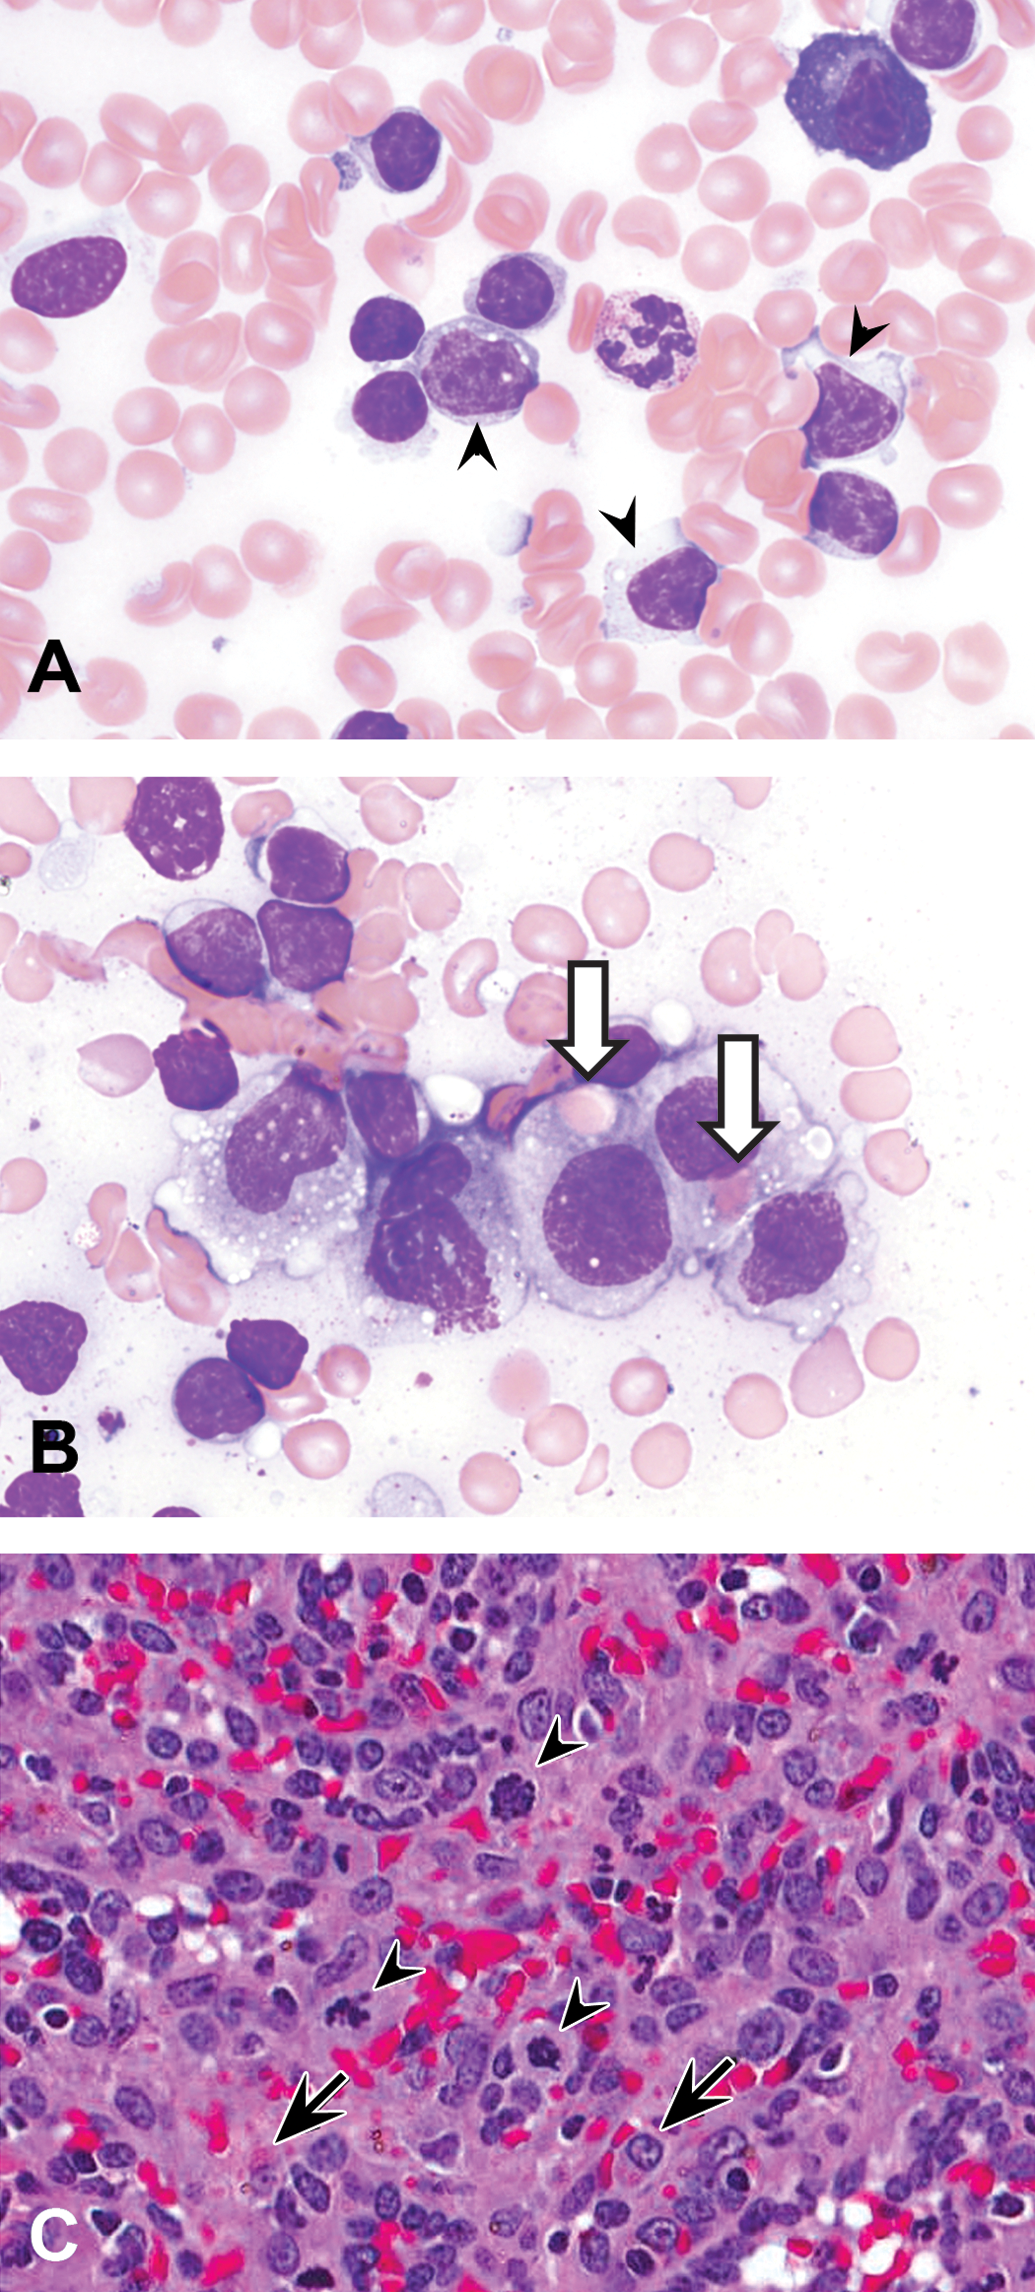
Splenic cytology and histology 72 hr after 300 mg/kg mAbY.1 (investigative study). (A) Splenic cell cytology from a stock animal showing quiescent macrophages (arrowheads; Wright-Giemsa stain, 100× magnification). (B) Splenic cell cytology from an animal dosed with mAbY.1 showing increased proportion of macrophages, macrophages with cytoplasmic vacuoles, and erythrophagocytosis (arrows). (Wright-Giemsa stain, 100× magnification). (C) Spleen section characterized by increased numbers of macrophages in the red pulp and increased numbers of mitotic figures (arrowheads) within this cell population. Small numbers of macrophages also exhibited erythrophagocytosis (arrows). H&E, 40× magnification.
Rapid Development of Anti-mAbY.1 Antibodies in Cynomolgus Monkeys Resulted in Enhanced Drug Clearance
Following the first sc dose of mAbY.1 in the main toxicity study, average AUC0–336 hr were approximately proportional (Figure 4A). There was no relevant difference in exposure between males and females. Exposure following subsequent doses was substantially lower than day 1 mean AUCs and ranged from 7 to 64% of day 1 AUC values. For example, after the third sc dose, mean AUCs were 7%, 8%, and 55%, respectively, of day 1 mean AUCs for animals dosed at 10, 50, and 300 mg/kg mAbY.1 (Table 4).
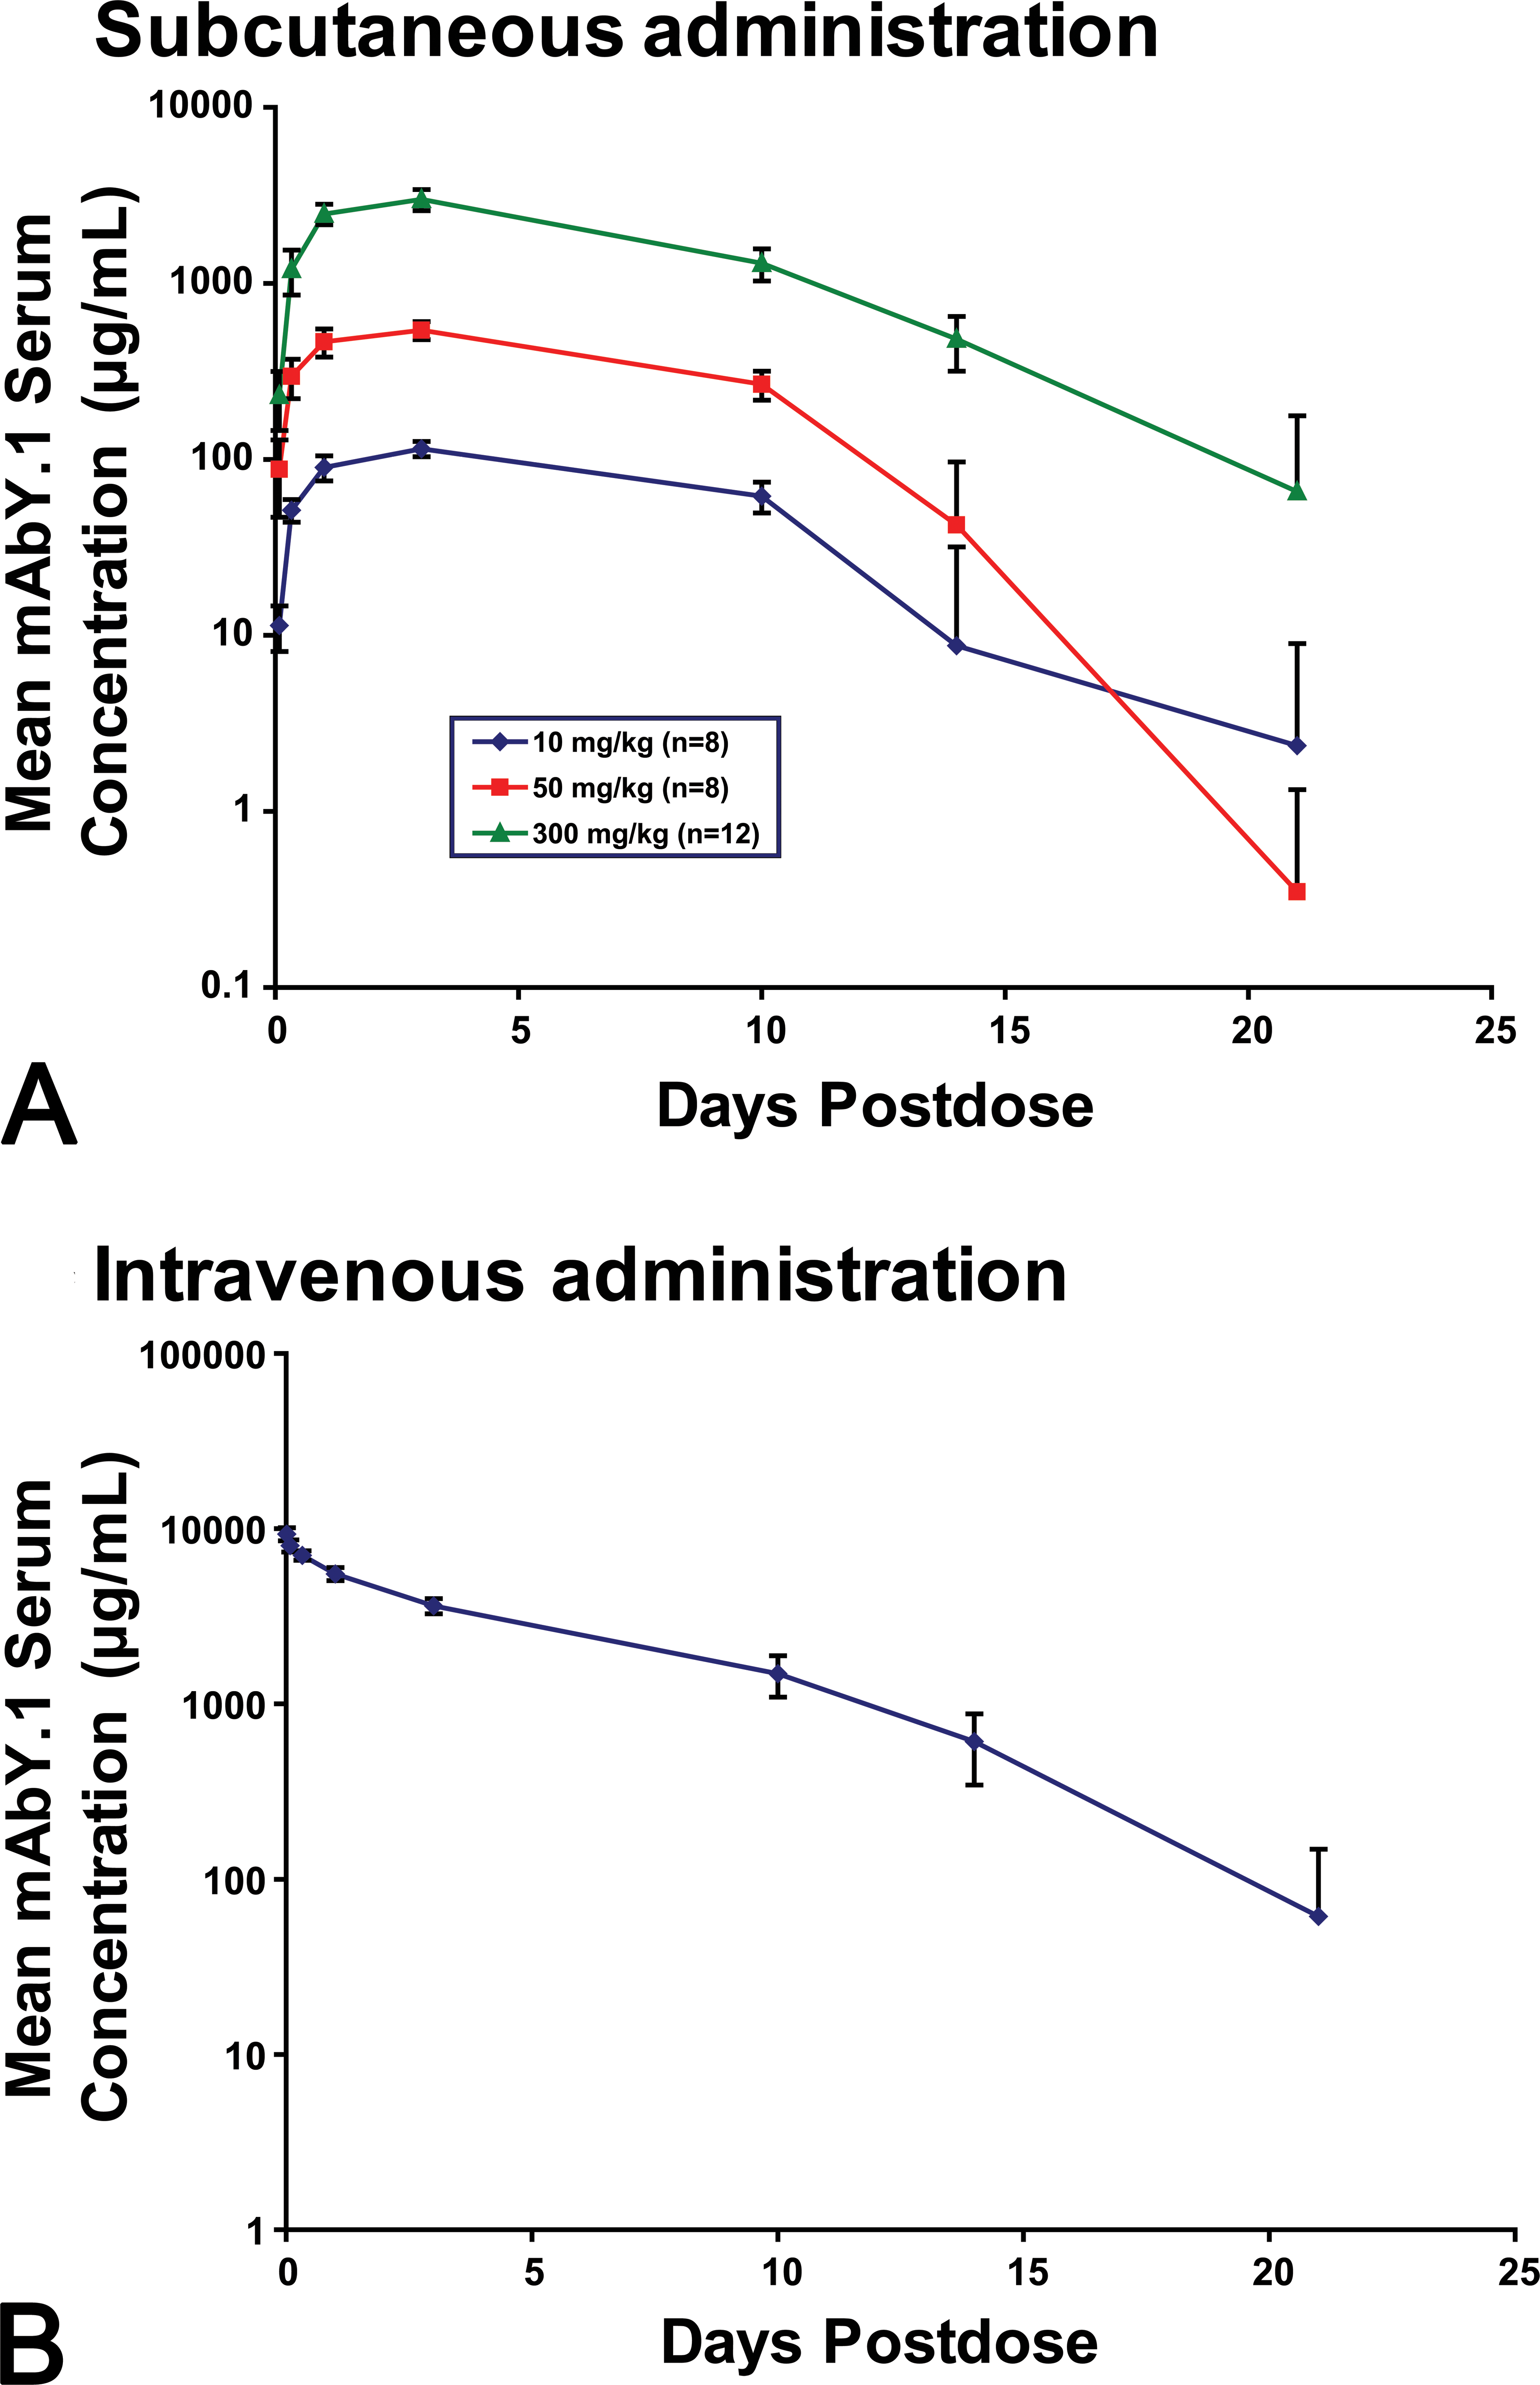
Serum concentration–time curves for mAbY.1 after the first dose (main study). Points represent mean (SD) for n = 8–12/group.
Toxicokinetic parameter estimates following dosing with mAbY.1.
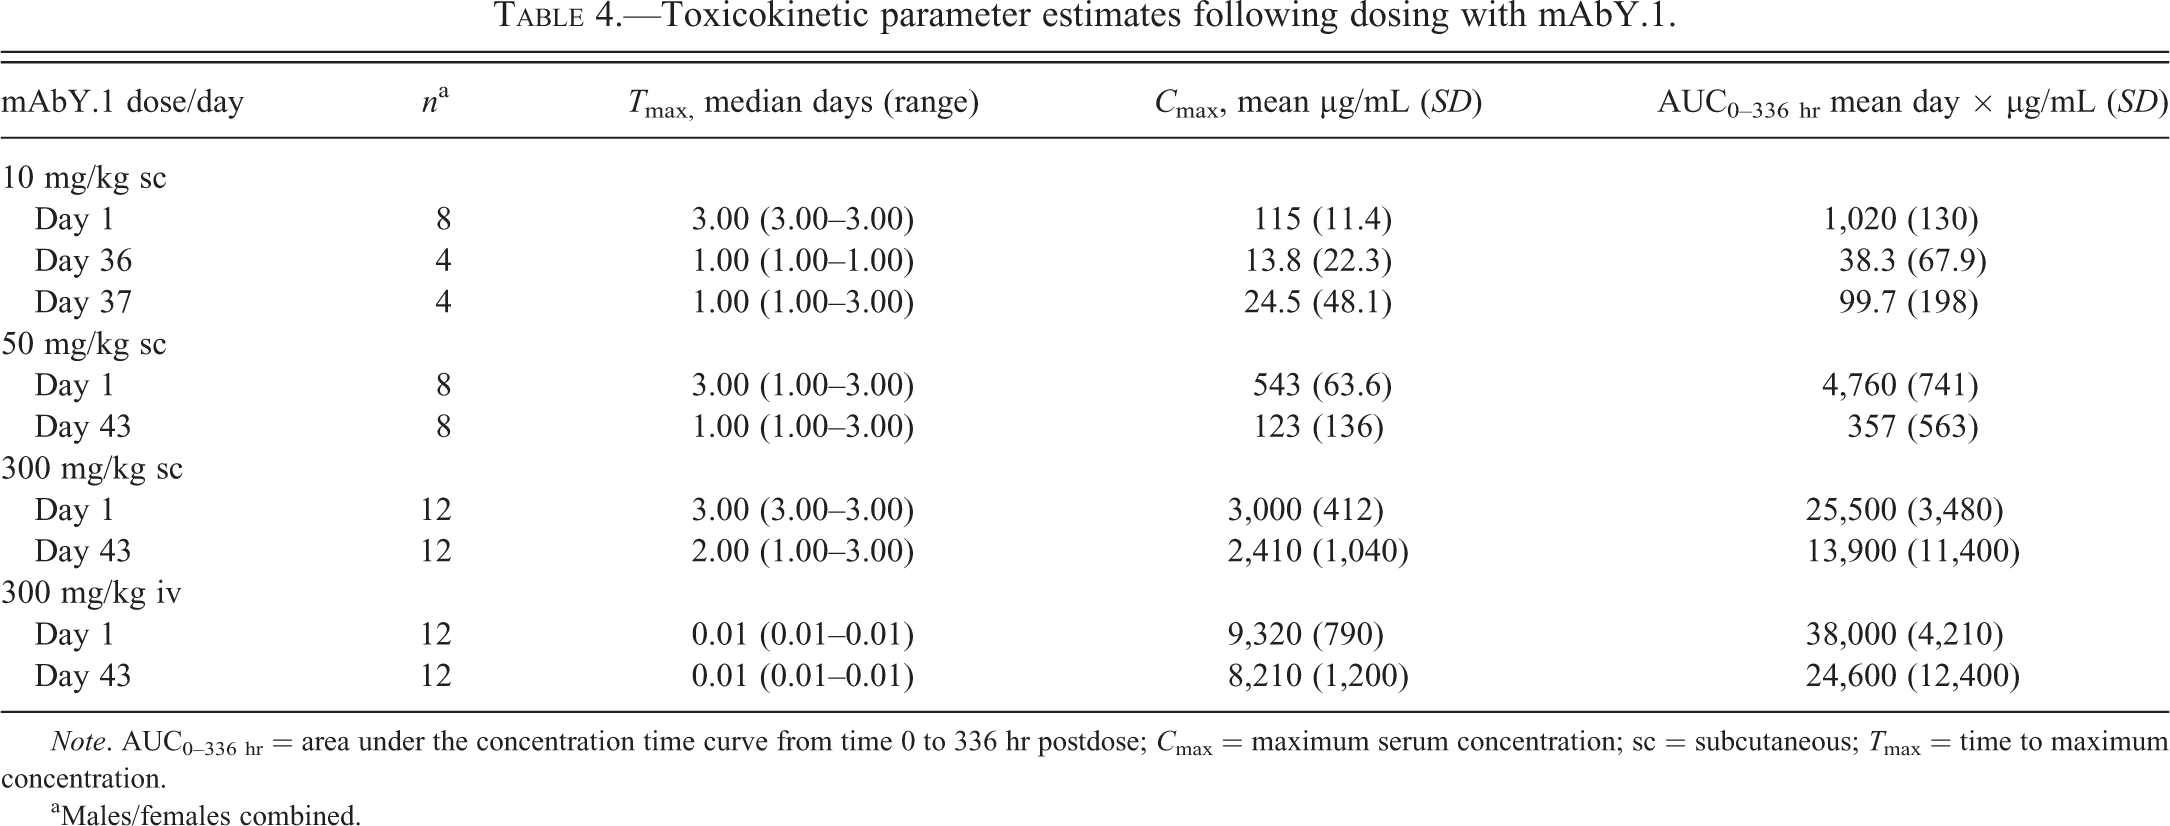
Note. AUC0–336 hr = area under the concentration time curve from time 0 to 336 hr postdose; C max = maximum serum concentration; sc = subcutaneous; T max = time to maximum concentration.
aMales/females combined.
After iv administration of mAbY.1 (300 mg/kg), a decrease in exposure compared with day 1 was also observed after repeat dose administration (Table 4 and Figure 4B).
During the dosing phase of the study, anti-mAbY.1 binding antibodies were detected in 39 of the 46 (85%) animals administered mAbY.1, and neutralizing antibodies were observed in 37 of the 46 animals (80%). By day 145, anti-drug antibodies were detected in 7 of the 8 animals at 10 mg/kg and 6 of the 8 animals at 50 mg/kg. Anti-drug antibodies were not detected at 300 mg/kg iv or sc, but that was likely due to the high drug concentrations in the samples interfering with the detection. At later time points (e.g., day 42) when drug concentrations were lower, anti-drug antibodies were detected in 9 of the 12 animals in both of the 300 mg/kg groups (sc and iv). The very rapid onset of hematologic effects suggests that antidrug antibodies did not contribute to the cytopenias.
In Vitro, mAbY.1 Did Not Bind to Cynomolgus Monkey Blood Cells and Did Not Cause Platelet Activation/Aggregation
Direct binding of mAbY.1 to either platelets or RBCs from cynomolgus monkeys could not be detected using standard techniques. By flow cytometric analysis, mAbY.1 did not bind to cynomolgus wPLT or platelets in whole blood, in contrast to the positive control, AMG X, a mAb that has previously been shown to bind to cynomolgus platelets (Santostefano et al. 2012). In addition, mAbY.1 did not cause platelet activation as assessed by platelet P-selectin expression in whole blood up to 14 mg/kg, or cause platelet aggregation in either whole blood or PRP at concentrations up to 11.7 or 6.4 mg/mL, respectively. Biotinylated mAbY.1 did not bind to platelets, RBCs, lymphocytes, monocytes, or granulocytes in peripheral blood from humans or cynomolgus monkeys, but did bind to CHO cells transfected with the human receptor. Additionally, mAbY.1 did not bind to cynomolgus RBCs as measured by RBC agglutination in a modified Coombs Test.
Cytokine Release from Cynomolgus Whole Blood Was Detected Only at Very High Concentrations of mAbY.1
Incubation of cynomolgus whole blood with mAbY.1 for 2, 4, 6, and 24 hr resulted in the release of small amounts of IL-6 and IL-1β (2- to 3-fold above isotype control), but not TNFα (Table 5). Release of these cytokines was consistently observed only at the highest concentration of mAbY.1 (10 mg/mL) which exceeded the C max exposure in the 300 mg/kg dose group, and thus occurred at concentrations that were irrelevant for the in vivo findings. There was no release of cytokines for any of the other cytokines that were measured, including IL-2, IL-8, INF-γ, MIP-1β, and MCP-1.
Cytokine release after mAbY.1 incubation with whole blood from cynomolgus monkeysa.
Note. IL = interleukin; LPS = lipopolysaccharide; TNFα = tumor necrosis factor-alpha.
aData represent mean fold increase over isotype control (>2.0-fold increase only).
– indicates a change of ≤2.0-fold increase.
mAbY.1 Induced Phagocytosis of Platelets by Cynomolgus Monocytes In Vitro
To investigate effects of mAbY.1 on the phagocytosis of platelets by monocytes, a flow cytometric assay was developed (Figure 5). Cynomolgus PBLs incubated with mAbY.1 or W6/32 (positive control) had increased intracellular platelets in monocytes, as indicated by CMFDA fluorescence, compared with PBLs treated with isotype control (Figure 6A). The phagocytosis inhibitor cytochalasin D abolished the increase in CMFDA fluorescence induced by mAbY.1, confirming that mAbY.1 caused phagocytosis of platelets by monocytes (Figure 6A). Concentrations of mAbY.1 required to trigger phagocytosis of platelets by monocytes were as low as 10 to 30 µg/mL (Figure 6B). The 50% effective concentration (EC50) and EC90 for phagocytosis induced by mAbY.1 were approximately 37 and 88 µg/mL, respectively, based on average values from 5 cynomolgus monkeys (Figure 6B). Incubation of mAbY.1 with purified cynomolgus monocytes also resulted in phagocytosis of CMFDA-labeled cynomolgus platelets (Figure 6C).
Gating strategy for phagocytosis assay. Peripheral blood leukocytes (PBLs) and 5-chloromethylfluorescein diacetate (CMFDA)-labeled platelets were coincubated for 6 hr at 37°C. The flow cytometry gating scheme for measuring CMFDA fluorescence in viable CD14-positive monocytes is shown. Data are representative of 10 individual cynomolgus monkeys. SSC, side scatter; FSC, forward scatter; PI, propidium iodide; CMFDA, 5-chloromethylfluorescein diacetate. The same strategy was used for the human phagocytosis assay.
Phagocytosis of platelets by cynomolgus monocytes in vitro. (A) Cynomolgus peripheral blood leukocytes (PBLs) and 5-chloromethylfluorescein diacetate (CMFDA)-labeled platelets were coincubated with control IgG1 antibody, positive control W6/32, mAbY.1 with and without cytochalasin D and phagocytosis was assessed by fluorescence intensity of CMFDA in CD14-positive monocytes by flow cytometry. (B) mAbY.1 stimulated phagocytosis of platelets by monocytes. The left panel shows a representative dose titration curve of increased
To determine whether mAbY.1 could induce phagocytosis of platelets by human monocytes, human PBLs and autologous CMFDA-labeled platelets were incubated with mAbY.1 (0.0001–3 mg/mL). mAbY.1 did not induce phagocytosis of human platelets by autologous monocytes. Human platelets were phagocytosed by human monocytes incubated with the positive control W6/32 (100 µg/mL; Figure 7).
Phagocytosis of platelets by human monocytes in vitro. Human white blood cells (WBCs) and 5-chloromethylfluorescein diacetate (CMFDA)-labeled platelets were coincubated with isotype control antibody, mAb1.1, or W6/32 for 6 hr and assessed for phagocytosis of platelets by monocytes by measuring CMFDA fluorescence in monocytes by flow cytometry. (A) Titration curve of mAbY.1 on phagocytosis of CMFDA-labeled platelets by human monocytes. (B) Effects of positive and negative control antibodies on phagocytosis in human cells. Data shown are representative of 4 individual human subjects. The symbols and bars indicate the mean and SD of the replicates for each condition within the experiment (n = 2).
Four other human mAbs (mAbY.2, mAbY.3, mAbY.4, and mAbY.5) against the same pharmacological target were investigated to determine whether mAbY.1-induced phagocytosis was mediated through the intended target. Cynomolgus PBLs and autologous CMFDA-labeled platelets were incubated with these 4 mAbs (0.0001–3 mg/mL). None of these mAbs induced phagocytosis of platelets by monocytes in cynomolgus samples (Figure 8A). Similarly, phagocytosis of platelets by monocytes was not induced by mod-mAbY.1 with an aglycosylated IgG1 Fc portion (low FcγR binding) or by the F(ab’)2 fragment of mAbY.1 at concentrations up to 3 mg/mL (Figure 8B).
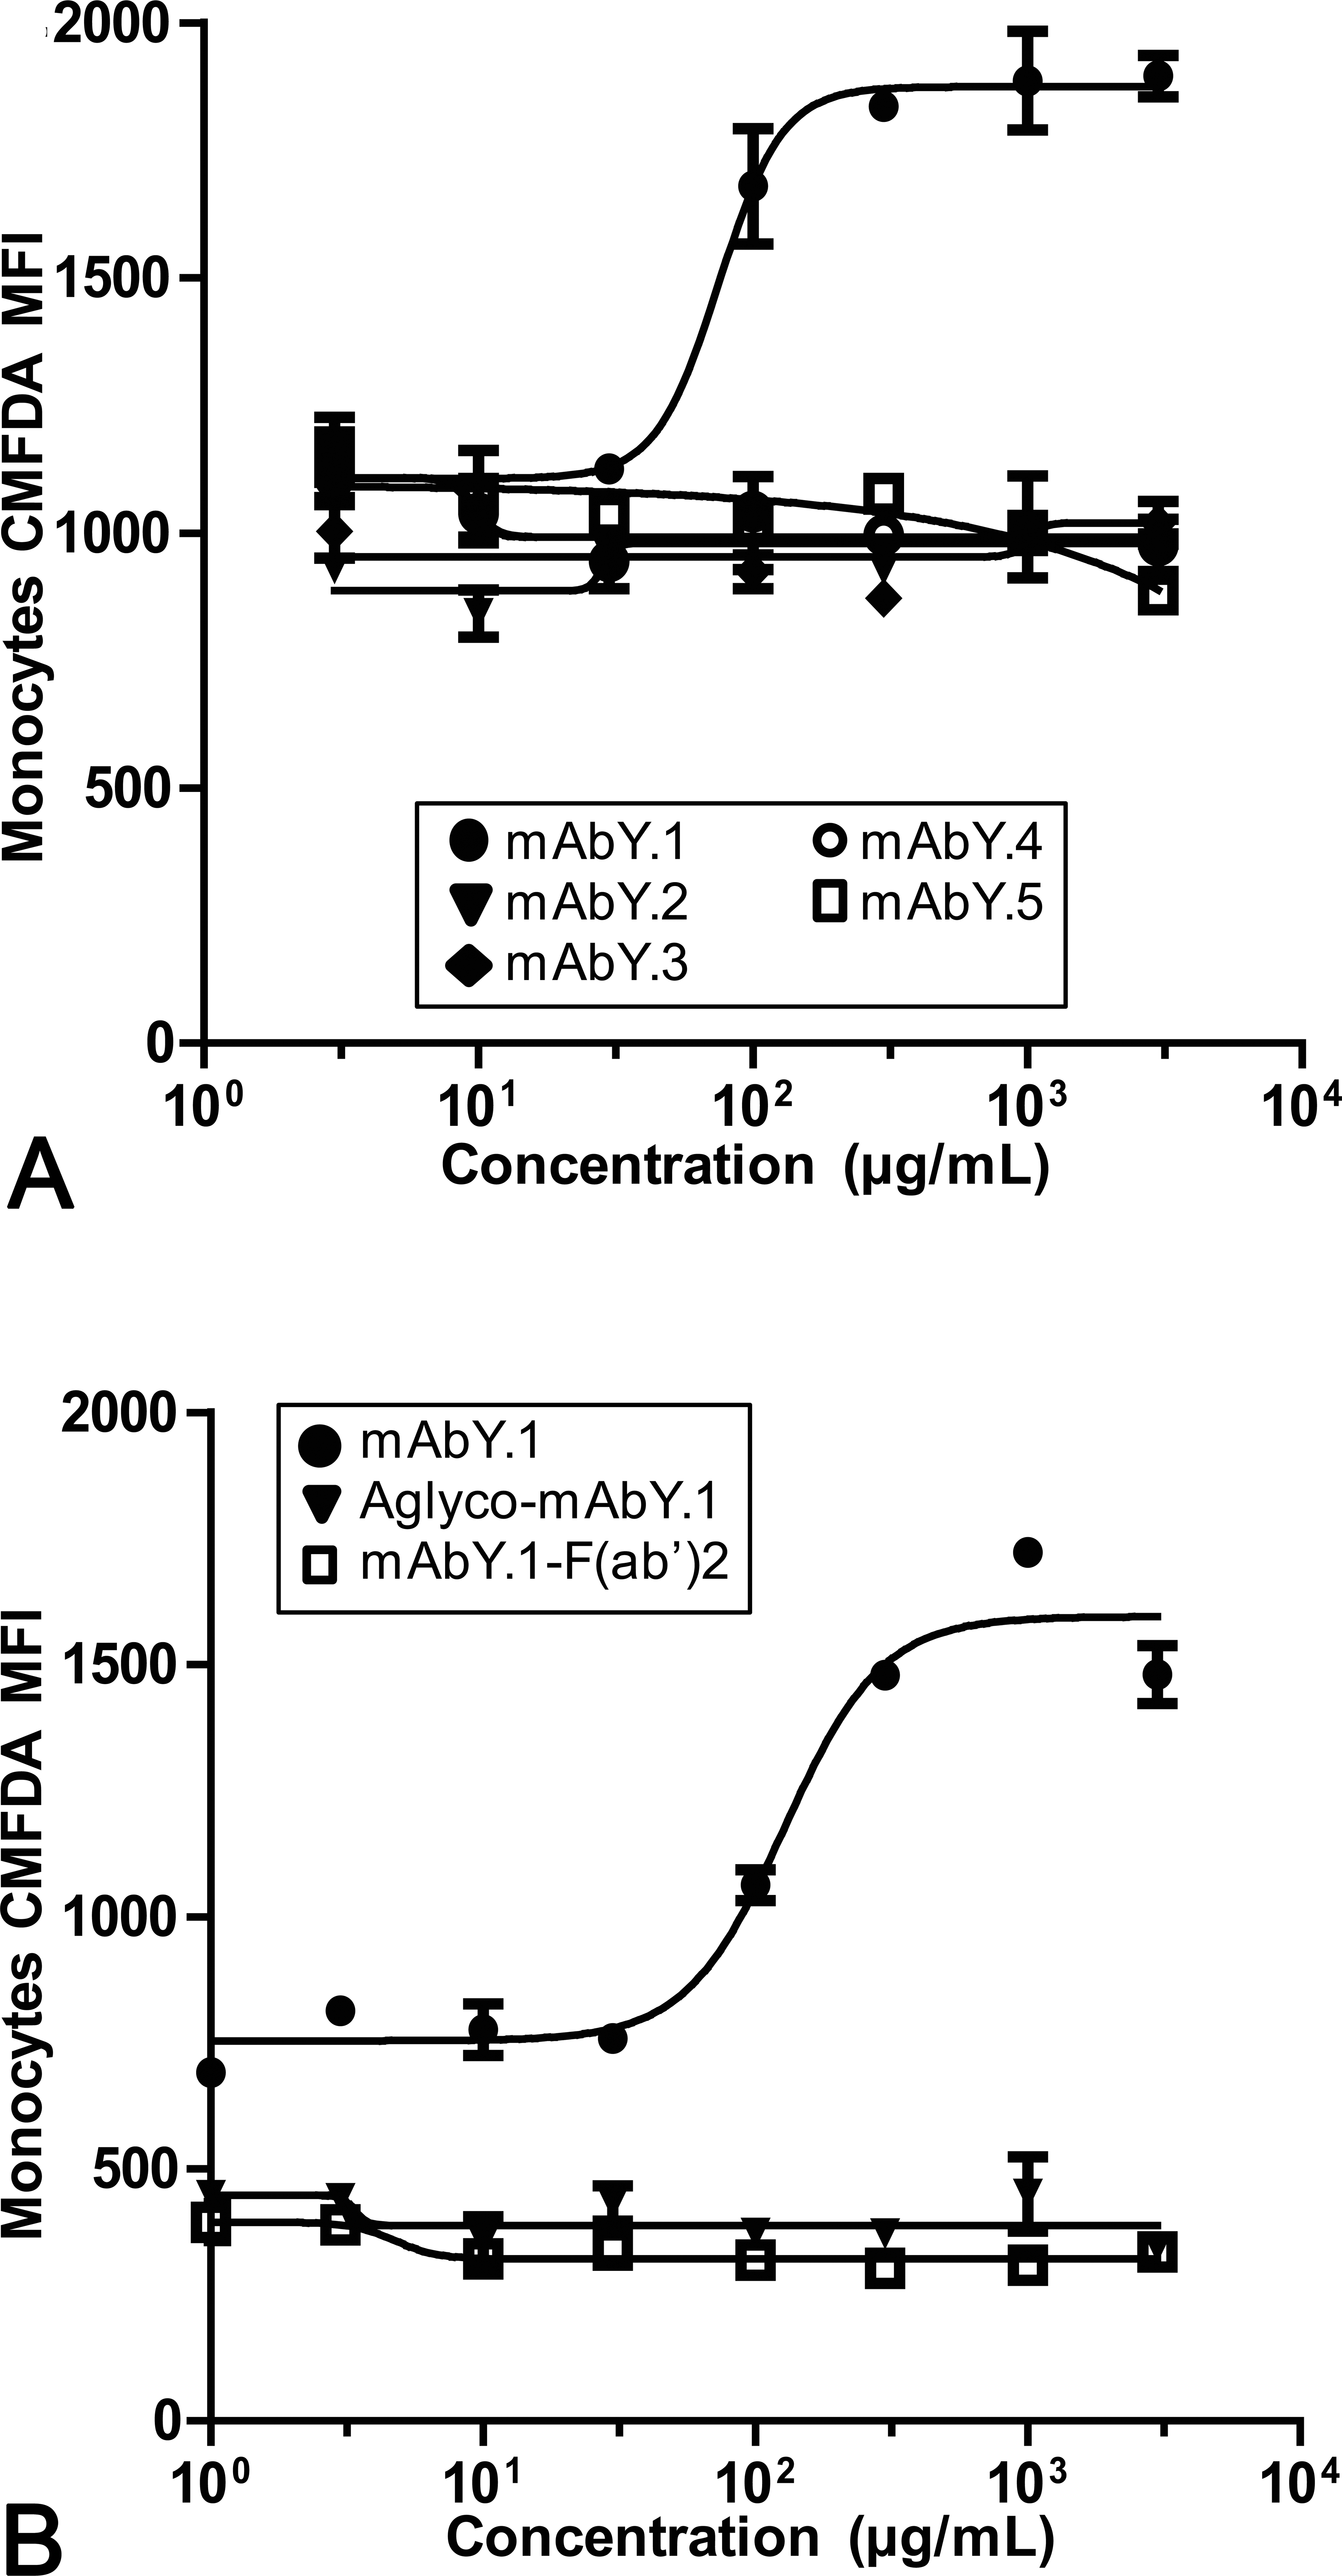
Requirement for Fc and Fab portions of mAbY.1 for phagocytosis of platelets by cynomolgus monocytes. Cynomolgus peripheral blood leukocytes (PBLs) and 5-chloromethylfluorescein diacetate (CMFDA)-labeled platelets were coincubated with (A) mAbs from the mAbY series or (B) modified-mAbY.1 or mAbY.1 F(ab’)2 fragments for 6 hr and assessed for phagocytosis of platelets by monocytes by measuring CMFDA fluorescence in monocytes by flow cytometry. Data shown are representative of 2 separate experiments using cells from different animals. The symbols and bars indicate the mean and SD of the replicates for each condition within the experiment (n = 2).
Even though mAbY.1, mAbY.2, mAbY.3, mAbY.4, and mAbY.5 are directed against the same surface target and have the same constant domain, they have numerous differences in the sequence of their variable regions. Another antibody, mAbY.6, differed from mAbY.1 by only 7 amino acid residues in the variable domain and did not induce in vitro phagocytosis of platelets by monocytes (Table 6). Since 3 of the 7 amino acid residues that differed between mAbY.1 and mAbY.6 were on the light chain (LC) and 4 were on the heavy chain (HC), 2 constructs were generated by exchanging the LCs and HCs from each molecule, creating chimeric molecules.
Comparison of structure and biological activity of mAbY IgG2 constructs.
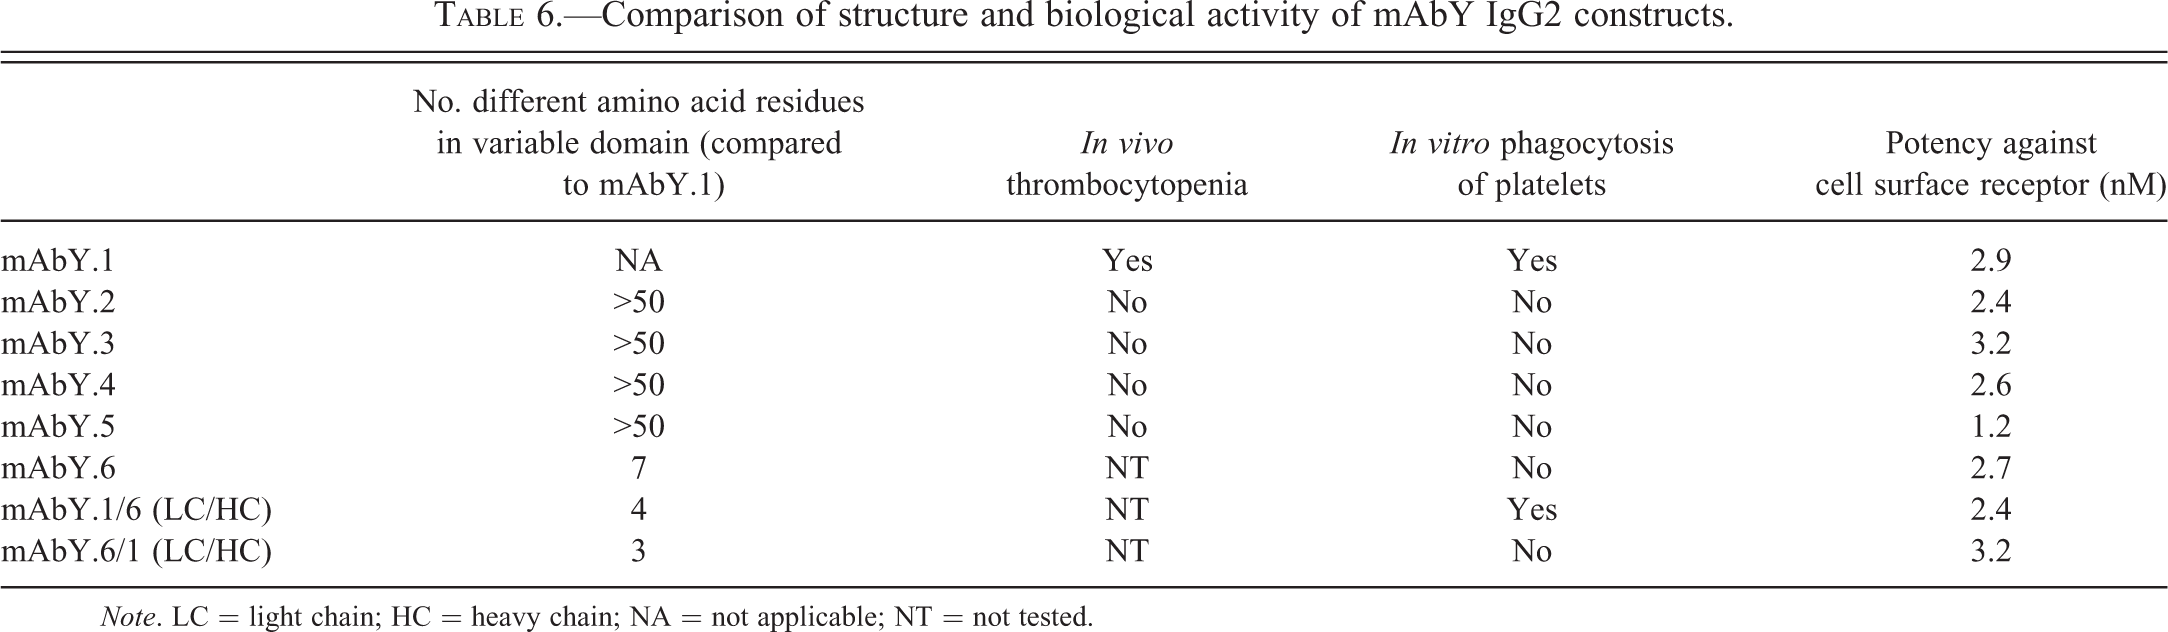
Note. LC = light chain; HC = heavy chain; NA = not applicable; NT = not tested.
The mAbY.1 LC/mAbY.6 HC (mAbY.1/6) chimera induced phagocytosis of platelets by monocytes, similar to the parent molecule mAbY.1. However, the mabY.6 LC/mAbY.1 HC (mAbY.6/1 chimera) did not induce in vitro phagocytosis, indicating that some or all of the 3 residue differences in the light chain were sufficient to induce phagocytosis (Table 6). These 3 residues are located in different framework sections and are structurally segregated from each other and from the hypothesized antigen-binding complementarity-determining region (CDR) residues (Figure 9A and B).
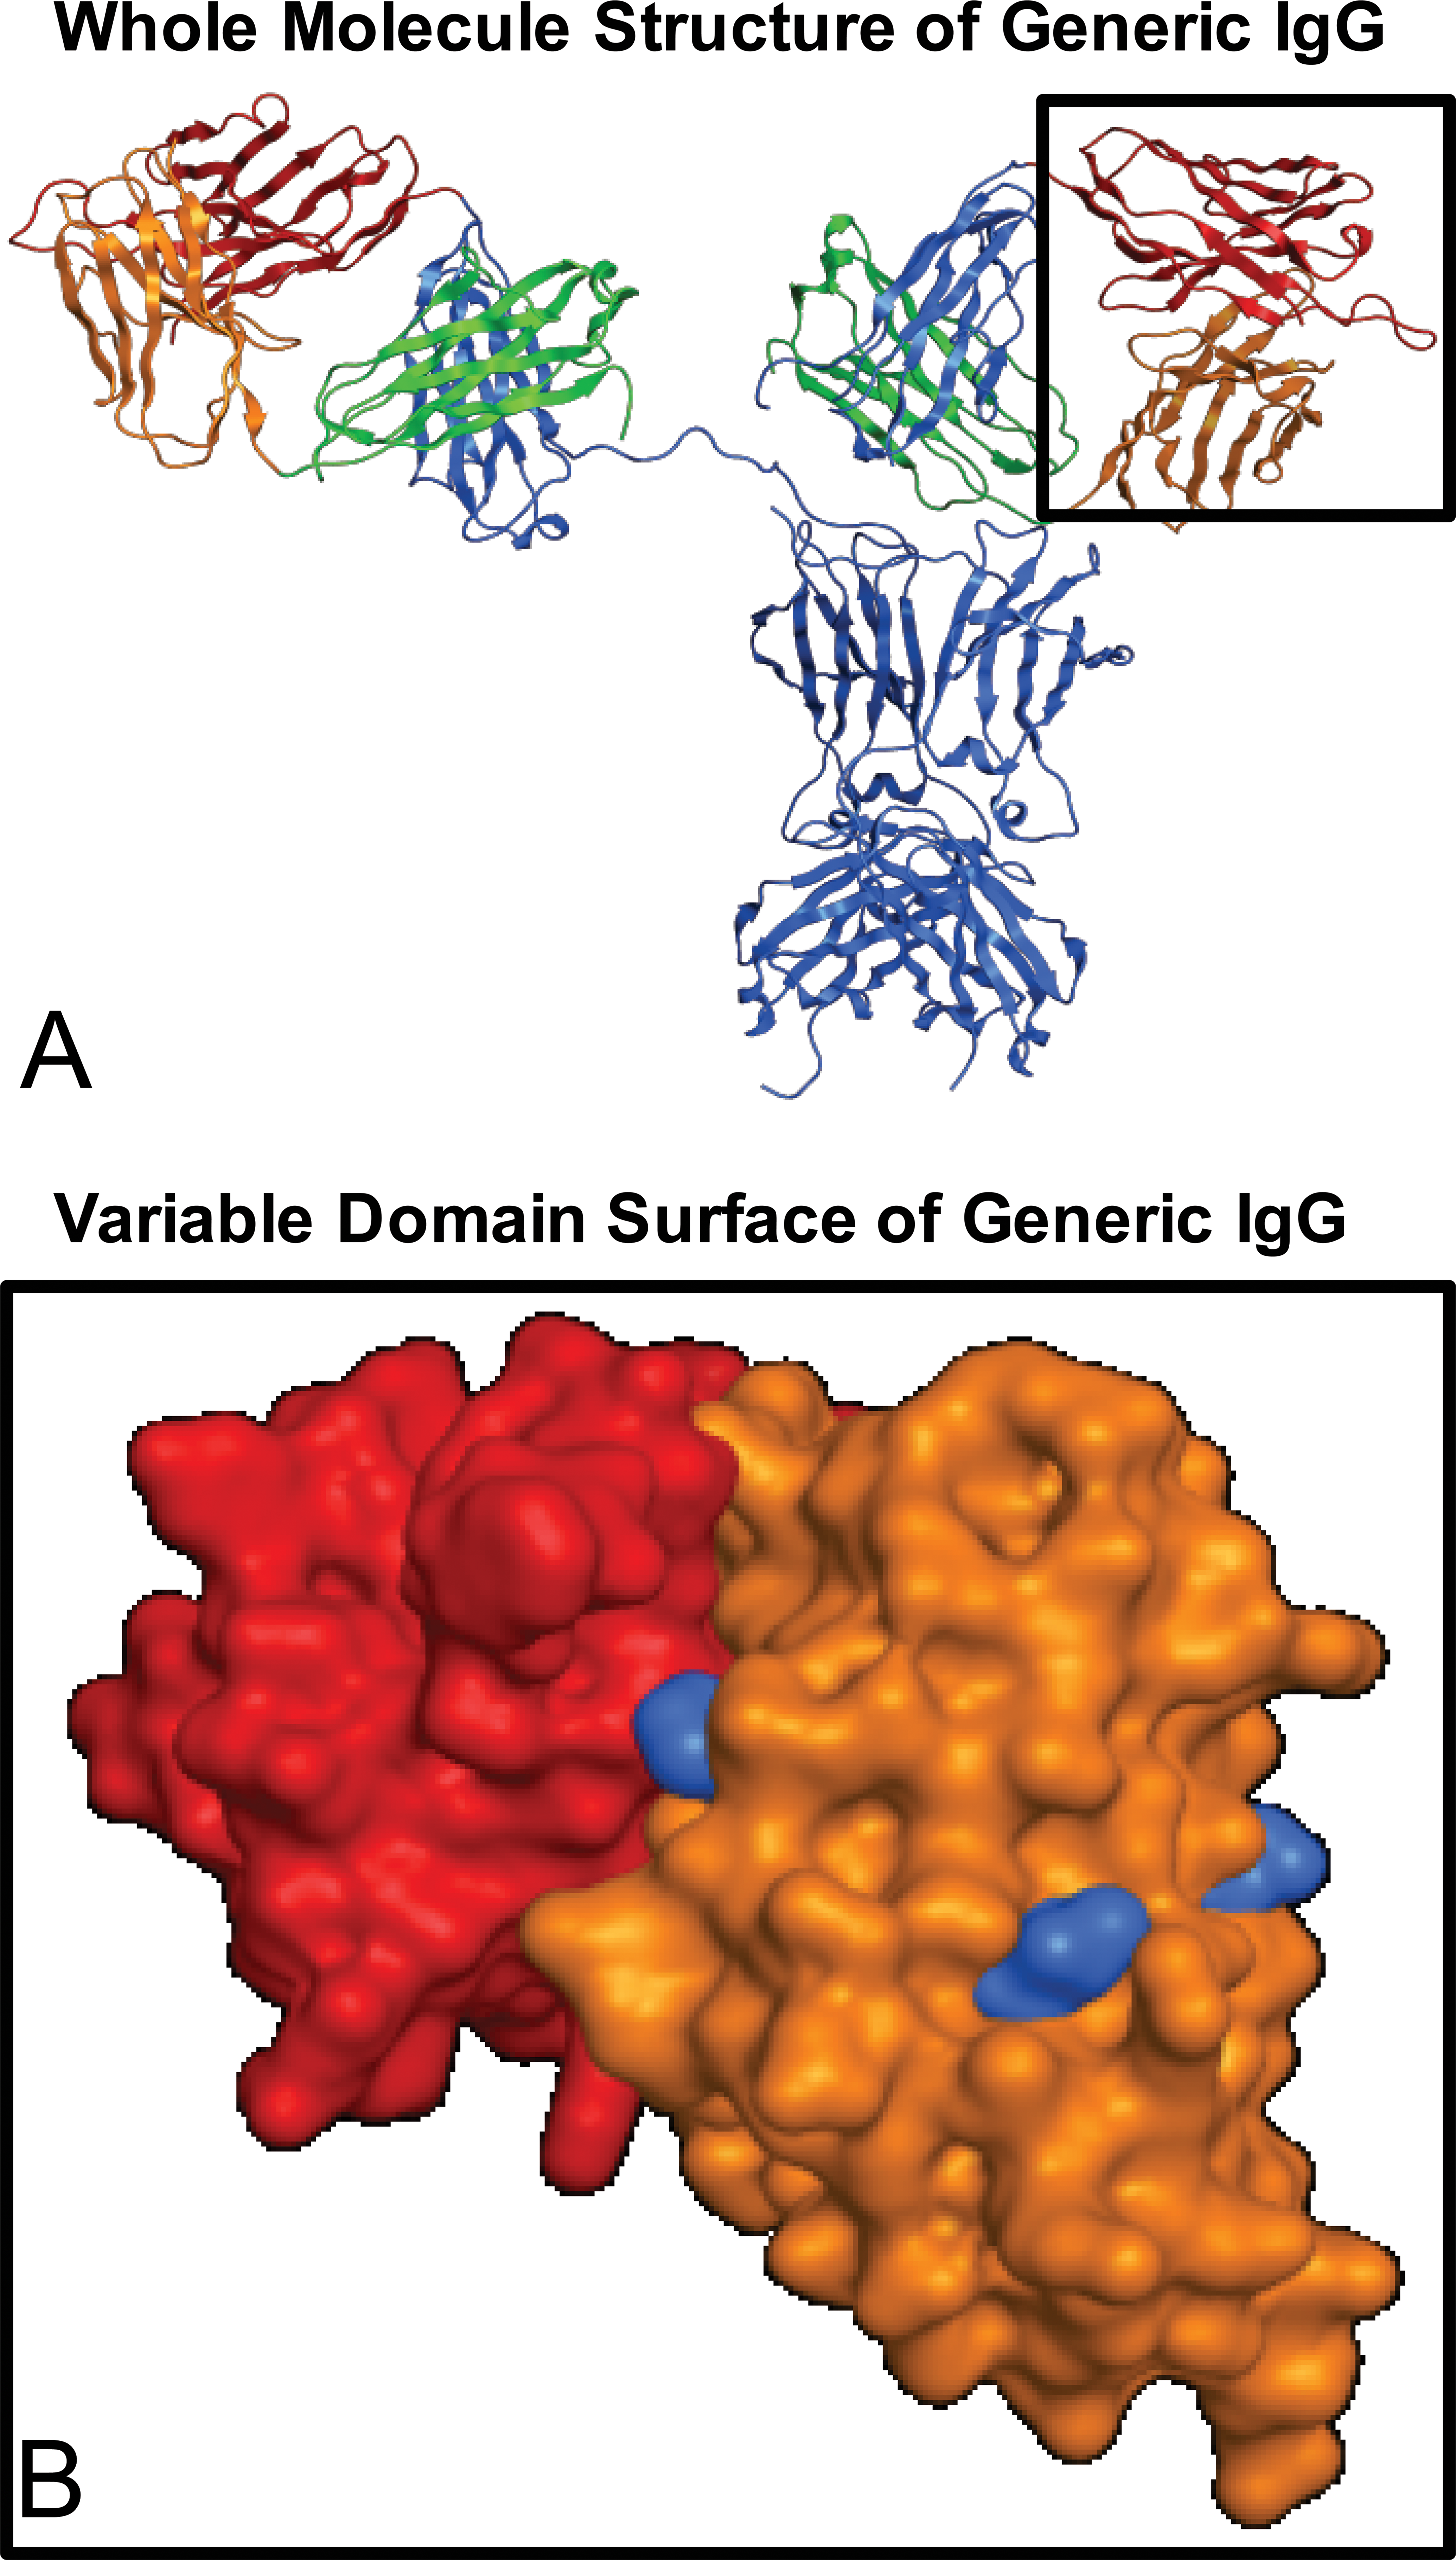
Structural positions of IgG chimera differences. (A) Whole molecule structure of generic IgG. Generic IgG structure (PDB code 1HZH) backbone is shown in ribbon format. Sections of the structure colored by heavy chain constant domains (blue), light chain constant domains (green), heavy chain variable domain (red), and light chain variable domain (orange). (B) Variable domain surface of generic IgG. Zoomed image of variable domains from 9A inset. Heavy chain variable domain surface is shown in red, light chain variable domain surface shown in orange. Amino acid positions corresponding to the residues associated with phagocytosis are highlighted on the surface of the variable light chain domain in blue.
Thrombocytopenia and RBC Decreases Were Not Observed with Other mAbs against the Same Target as mAbY.1 or with mod-mAbY.1
In the investigative study, female cynomolgus monkeys (1–2 animals/group) were administered a single iv bolus dose of mAbY.2, mAbY.3, mAbY.4, or mAbY.5 to examine whether other human mAb antagonists with similar potency against the same pharmacological target and of the same isotype (IgG2) would exhibit similar hematologic effects as mAbY.1. Similar exposure profiles were observed for these 4 mAbs and mAbY.1 (Figure 10), with mean C max values ranging from 6,970 to 10,400 µg/mL and AUC336 hr ranging from 19,460 to 47,300 µg·day/mL. No test article–related changes in platelet or RBC mass parameters were observed in cynomolgus monkeys treated with mAbY.2, mAbY.3, mAbY.4, or mAbY.5 at 300 mg/kg iv (Figure 11A and B; expressed as percentage of baseline).
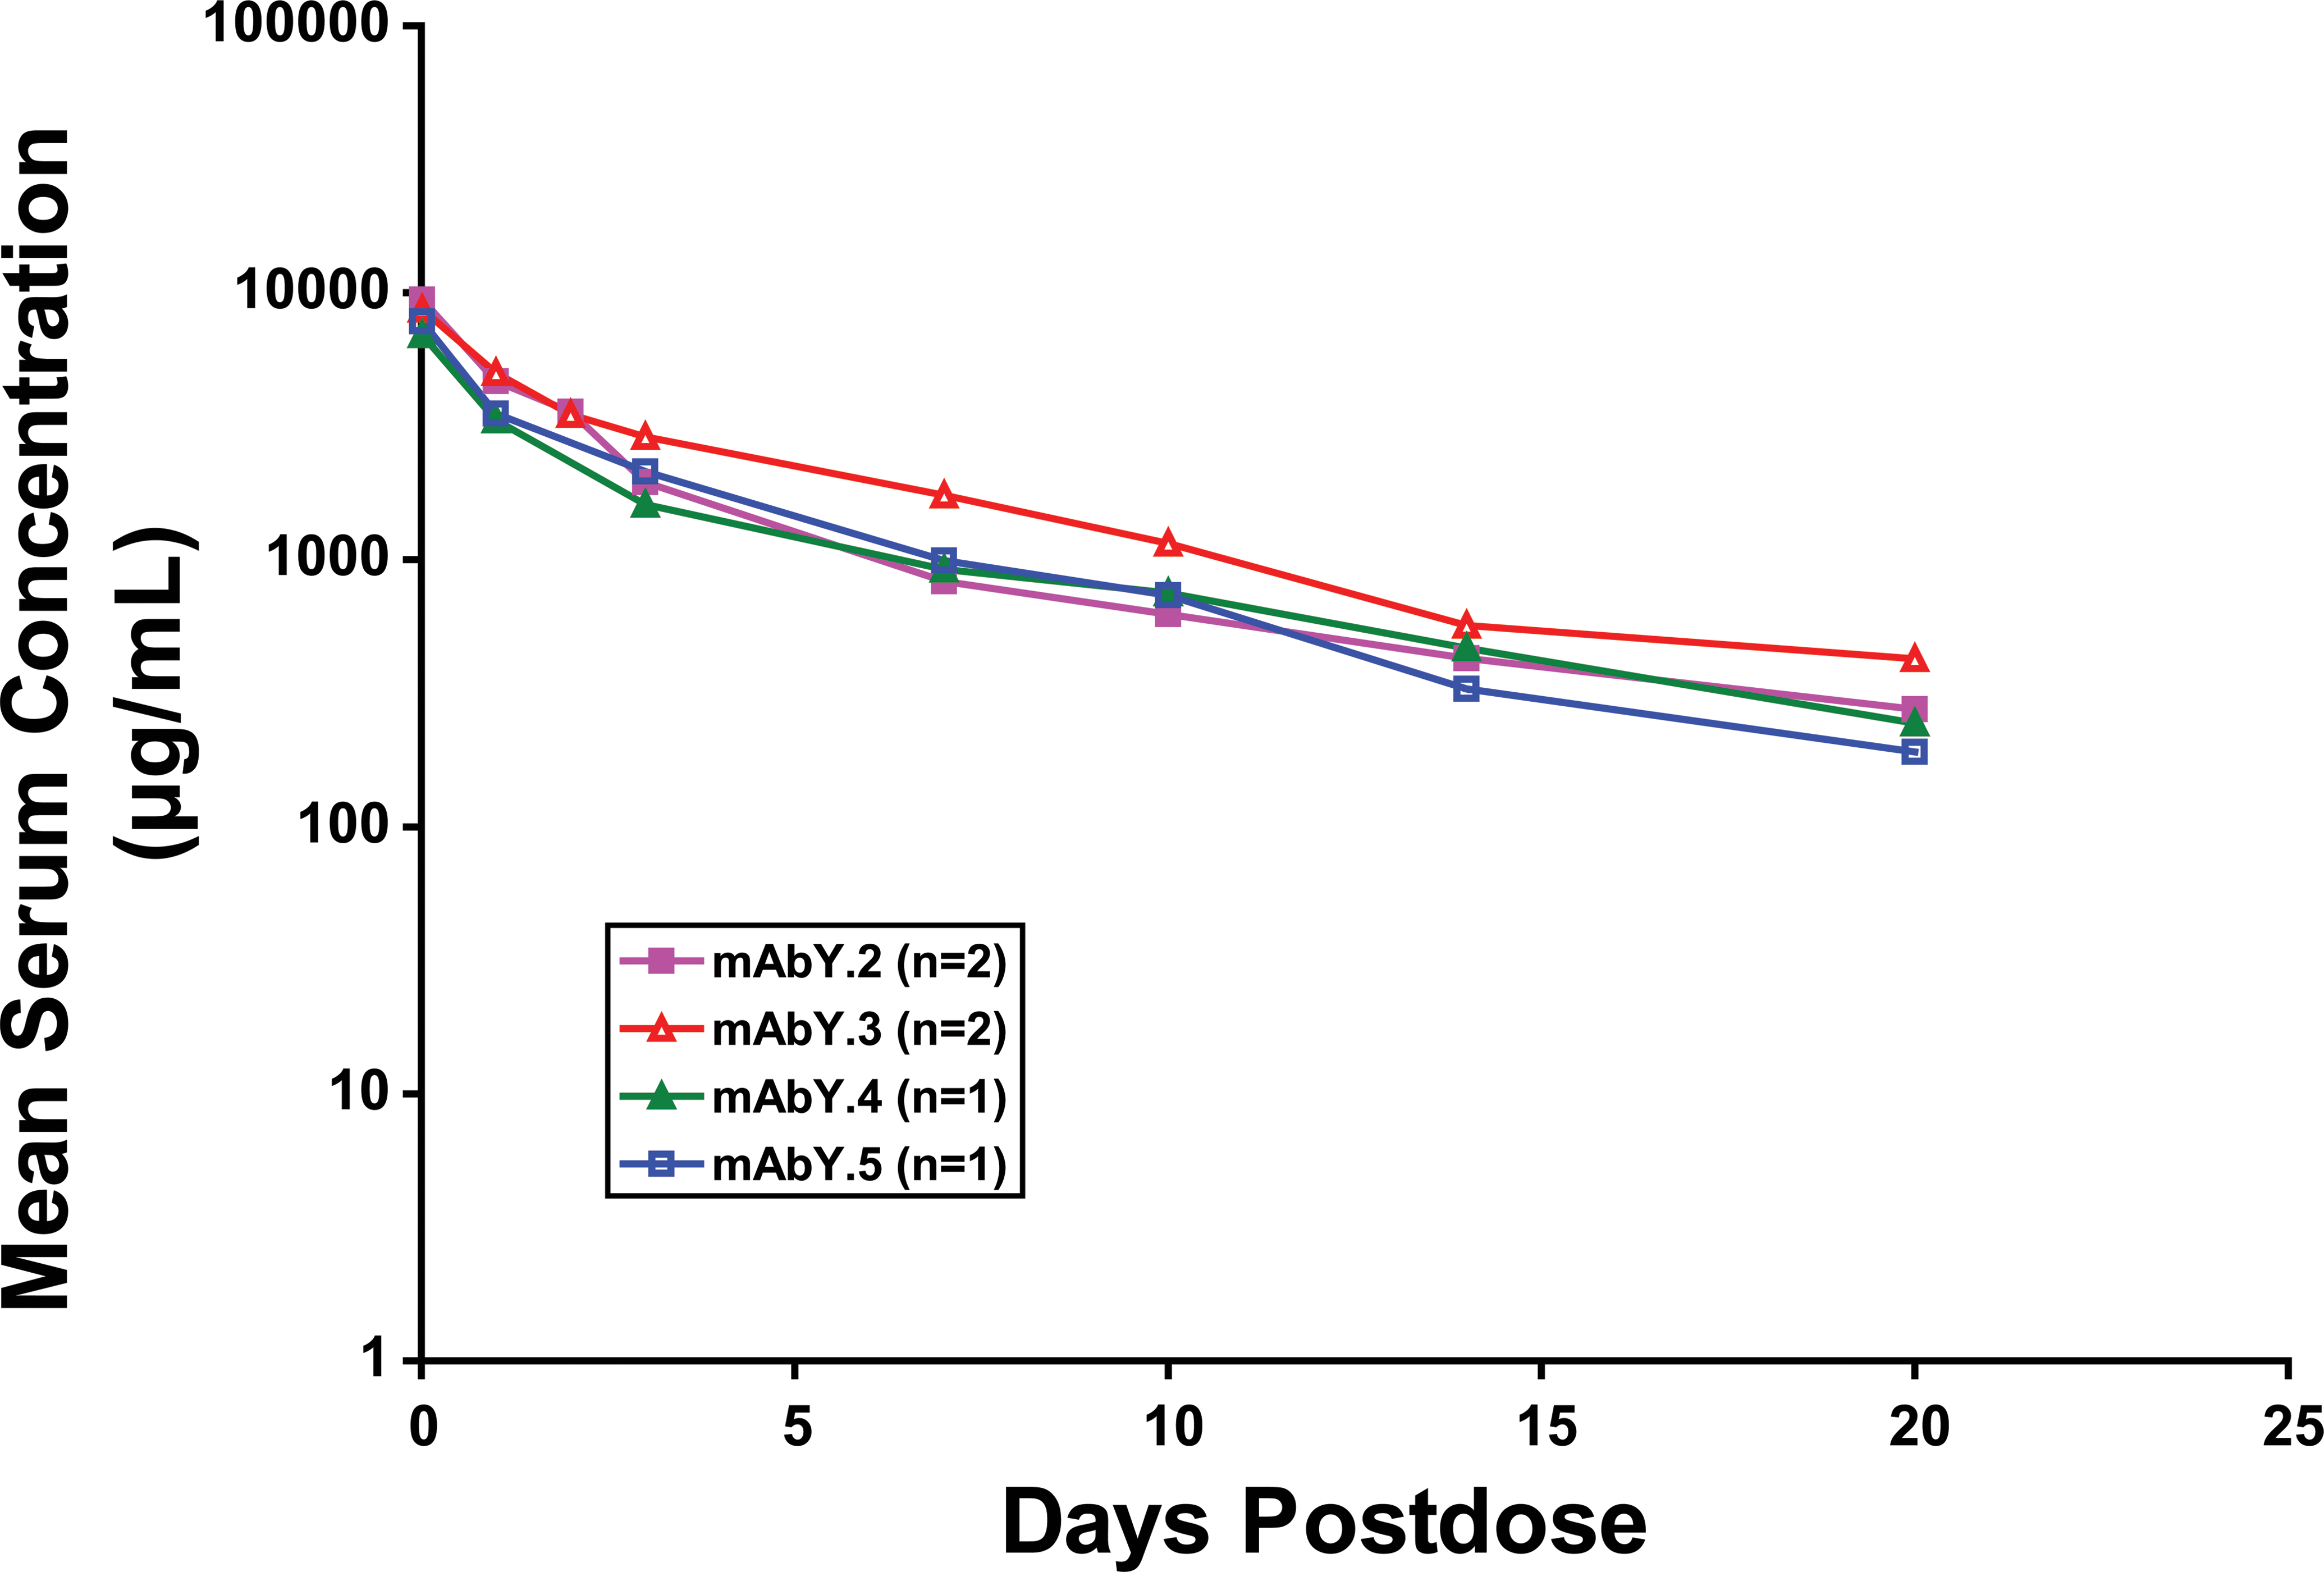
Serum concentration–time curves of other antibodies in the mAbY series. Points represent mAb concentration of 1 to 2 animals at various times after a single IV injection of 300 mg/kg.
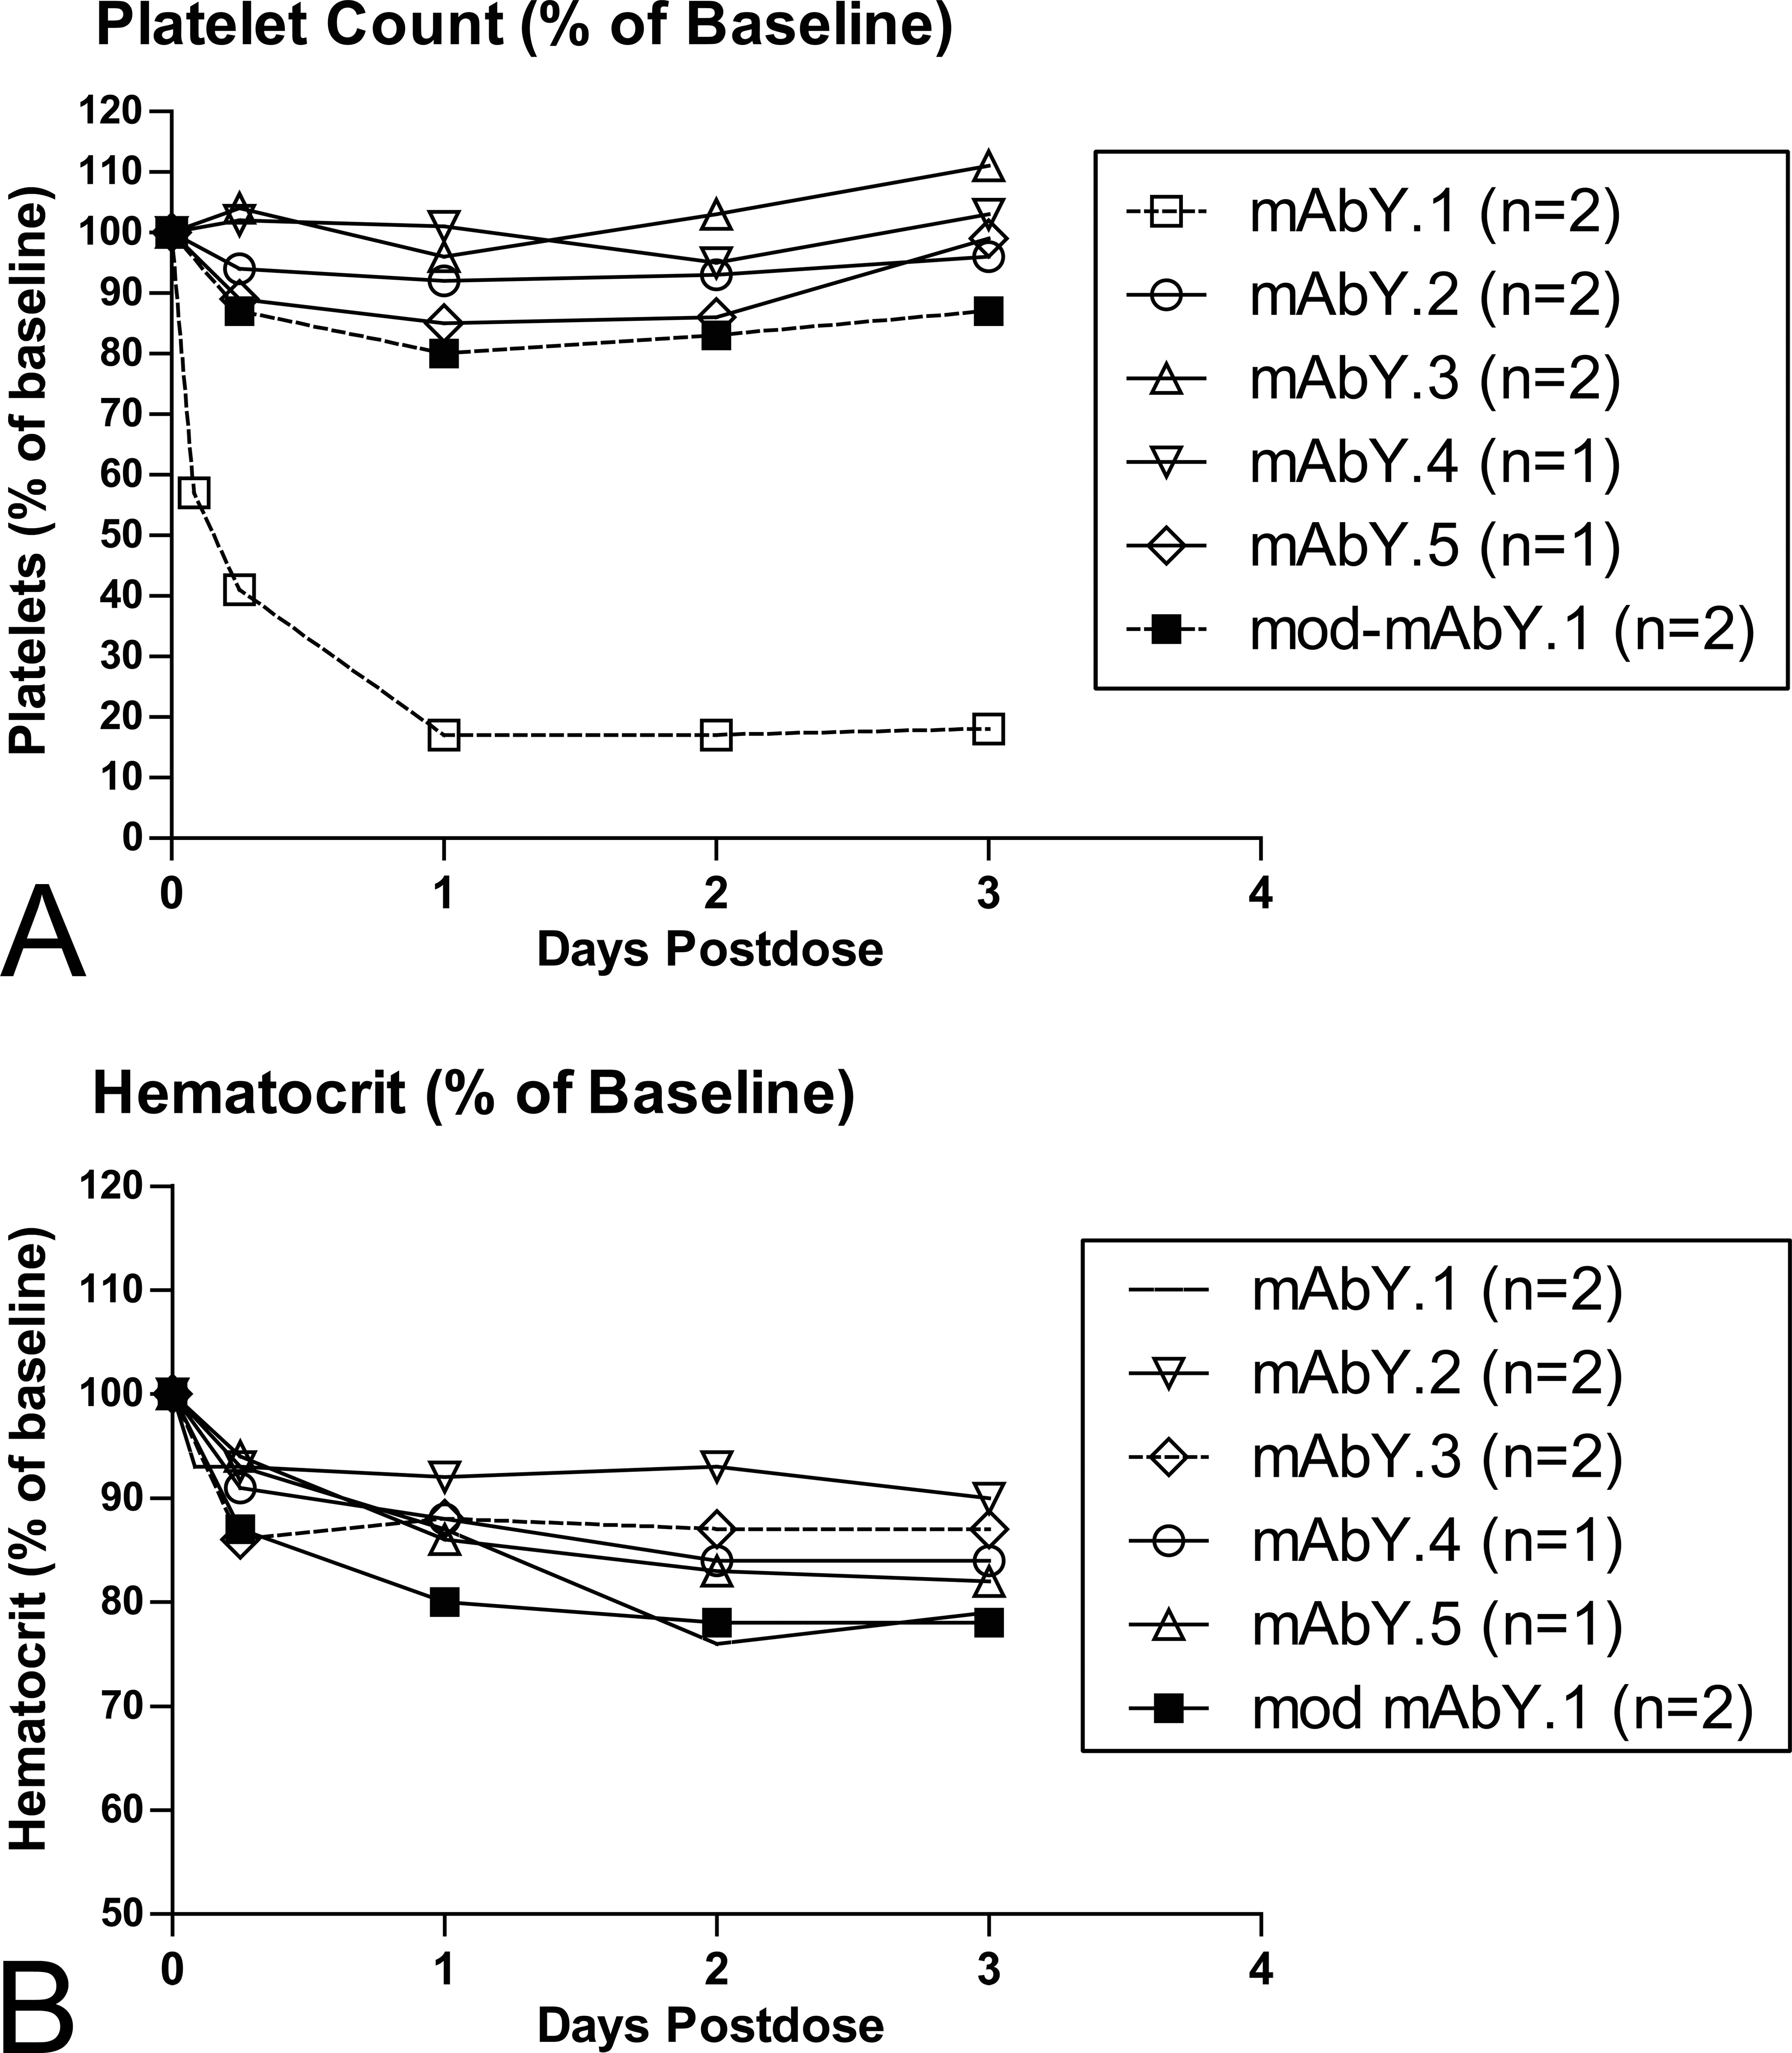
Hematology effects (expressed as a percentage of baseline) after a single dose of mAbY.1 or related molecules at 300 mg/kg IV (investigative study). Points represent values for 1–2 animals.
Two additional cynomolgus monkeys were dosed iv with 300 mg/kg mod-mAbY.1, which contains an aglycosylated Fc portion and has low FcγR binding. These animals had partial attenuation of mAbY.1-related hematologic effects (1 animal had a 29% decrease in platelet counts, and both animals had 15–22% decreases in red cell mass parameters). Animals dosed with mod-mAbY.1 had normal splenic weights, histology, and cytology, and normal bone marrow cytology.
None of the animals in the investigative study, including those administered mAbY.1, had detectable alterations in the serum cytokine panel (see Materials and Methods section) or peripheral blood lymphocyte subsets, including no change in B cells, T cells, or NK cells (data not shown).
Discussion
mAbs are successful biotherapeutics that are generally well tolerated in humans and other species. Adverse events associated with therapeutic mAbs are often related specifically to binding of a target moiety or to modifying an intended biochemical pathway (Kamba and McDonald 2007). Recently, several publications have documented nontarget-related effects of mAbs on peripheral blood cells (Martin et al. 2008; Rudmann et al. 2011; Adis, 2002; Santostefano et al. 2012). Each of these examples has shown unique characteristics with respect to cells affected, affinity of the unintended binding, and species specificity. mAbY.1 is another example of a mAb with novel clinical findings and mechanisms resulting from probable off-target activities. The structural basis for these off-target activities has been localized to differences in 3 amino acids in the variable region of the Fc portion of the mAb.
Administration of mAbY.1 to cynomolgus monkeys resulted in profound and unexpected thrombocytopenia, sometimes with decreased red cell mass. Significant effects on platelet counts and RBC mass were evident by 4 hr postdose. By 3 days postdosing, platelet counts and RBC mass parameters had decreased significantly; these low values persisted for several days, recovering by approximately 20 days postdose. After subsequent doses, nadirs were generally less pronounced and recovery was faster (within approximately 6 days) for platelets and RBC mass. Decreased platelet counts and RBC mass parameters occurred when serum concentrations of mAbY.1 were high. Serum drug concentrations after subsequent doses were significantly lower because of antidrug antibodies that enhanced mAbY.1 clearance. The decreased severity of hematologic effects and the faster recovery after the second and subsequent doses may have been due to shorter drug exposures with lower C max concentrations. In addition, expansion of hematopoiesis, as indicated by increased reticulocyte counts and increased MPV, may have contributed to more rapid recovery.
Despite profound thrombocytopenia and minimal to marked decreased RBC mass, clinical signs after the first dose were generally limited to multifocal ecchymotic and petechial hemorrhages. There were no effects on the coagulation cascade, with no changes in coagulation times (prothrombin time and activated partial thromboplastin time) and minor increases, rather than decreases, in fibrinogen concentration. The lack of spontaneous external hemorrhage in cynomolgus monkeys with profound thrombocytopenia has been previously reported (Santostefano et al. 2012). In the relatively protected environment of a laboratory animal facility, the cynomolgus monkeys on this study with very low platelet counts but normal coagulation parameters had no episodes of clinically relevant spontaneous hemorrhage.
Several clinical and anatomic findings indicate that splenic hemophagocytosis was the underlying cause of thrombocytopenia and decreased RBCs. Hematologic data include (1) the relatively rapid decrease in platelets and RBCs after dosing; (2) the robust reticulocyte response consistent with recycling of heme from phagocytosed RBCs; (3) circulating RBC fragments, indicating cellular damage; and (4) circulating small RBCs and spherocytes, indicating remodeling of RBCs by macrophages. Splenic erythrophagocytosis was evident histologically and cytologically; platelet phagocytosis was not observed in vivo (likely due to the small size and lack of distinctive characteristics of platelets by light microscopy). Macrophage proliferation/recruitment was indicated by increased spleen weights and increased numbers of macrophages with increased mitotic figures. Splenic macrophage activation was indicated by cytomegalic macrophages with numerous vacuoles.
The effect of mAbY.1 observed in the spleen could have been due solely to macrophage hyperplasia, as indicated by increased mitoses, or to recruitment of additional monocytes. The increase in circulating monocyte counts (up to 5-fold predose values) at 3 days after a single dose of mAbY.1 suggested potential systemic recruitment of monocytes to the spleen. Alternatively, the 5-fold increase in monocytes postdose may have been part of a generalized release or demargination of leukocytes, since neutrophils and lymphocytes were also increased, albeit to a lesser magnitude, at day 3.
Decreases in platelets due to decreased production or consumption/activation were considered unlikely causes of thrombocytopenia associated with mAbY.1. There was no evidence of decreased platelet production; bone marrow megakaryocyte morphology and density ranged from normal to increased after dosing with mAbY.1. In contrast, the presence of large platelets and increased MPV suggested accelerated platelet production. There was no evidence of platelet consumption (e.g., no evidence of thrombi or disseminated extravascular coagulation) or direct activation of platelets (no in vitro induction of aggregation or activation at concentrations 11-fold higher than in vivo concentrations associated with thrombocytopenia).
Similarly, mechanisms other than phagocytosis (also called extravascular hemolysis) were considered unlikely causes of decreased red cell mass associated with mAbY.1. Decreased production is inconsistent with the robust reticulocyte responses and time course of events on this study. There were no clinical or postmortem signs indicating hemorrhage other than minor and sporadic ecchymotic hemorrhages in some animals, and no evidence of altered iron status as might be expected after external, based on standard hematologic parameters, hemorrhage. There was no clinical, hematologic, or histologic evidence of intravascular hemolysis, despite frequent hematology sampling and close monitoring of the animals.
The pivotal role of macrophages in the hematologic effects induced by mAbY.1 was demonstrated in vitro. Incubation of cynomolgus PBLs with mAbY.1 actively induced phagocytosis of autologous labeled platelets. Phagocytosis induced by mAbY.1 was mediated by the Fab domain and required a functional Fc portion of the molecule, since phagocytosis was not induced by mAbY.1 F(ab’)2, mod-mAbY.1, or an isotype control antibody with an identical Fc portion. The activation of macrophages was likely not dependent on lymphocytes since mAbY.1 induced similar effects in purified cynomolgus monocyte preparations as in PBLs. The effect did not occur in a comparable human system. Species specificity has been observed in vitro or in vivo with other potentially off-target hematologic effects of biotherapeutics (Rudmann et al. 2011; Santostefano et al. 2012).
mAbY.1-induced phagocytosis of labeled autologous platelets by cynomolgus PBLs or monocytes only occurred after an incubation period of 6 hr. Usually, in vitro assays of phagocytosis by monocyte/macrophages require minutes of incubation rather than hours (Pestel et al. 1981). The requirement for a 6-hr incubation with mAbY.1 to demonstrate phagocytosis may be due to low affinity interactions or to changes in monocytes or platelets that necessitate prolonged exposure (e.g., synthesis of a protein or alteration of a surface receptor).
The cytopenias observed in animals administered mAbY.1 were reminiscent of HPS, a group of closely related diseases in humans and animals characterized by single or multiple cytopenias (Henter et al. 2007). Acquired HPS has been reported in humans, rhesus macaques, rats, cats, and dogs (Weiss 2007; Stromberg et al. 1983; Ide et al. 2009; Cotroneo, Colby, and Bergin 2011). Causes of HPS, regardless of species, include infections, neoplasms, and altered immune function. The underlying etiology for most hemophagocytic conditions is dysregulation of lymphocytes, chronic stimulation of CD8+ T cells, and excessive production of IFN-γ (Behrens et al. 2011). HPS has also been associated with therapeutic administration of interleukins (IL-3, IL-4, IL18, and IL-21), hematopoietic growth factors (M-CSF, GM-CSF), IFN-γ, and a mAb (Anti-EGFL7) in animals and humans (van Gils et al. 1993; Waggie et al. 2012; Herzyk et al. 2003; Milner et al. 2010; Zoller et al. 2011; Abrams et al. 2003; Baker and Levin 1998; Garnick and O'Reilly 1989; Johnson et al. 1993; Munn, Garnick, and Cheung 1990; Vitt et al. 1994; Zamkoff et al. 1992; Tomer et al. 1993; Nash et al. 1995; Couch et al. 2010).
Patients with HPS generally present with fever, neurologic symptoms, hepatosplenomegaly, and cytopenias. Histologically, lymphocytes and mature macrophages exhibiting hemophagocytosis accumulate in numerous organs including spleen, liver, lymph nodes, bone marrow, and central nervous system (Ost, Nilsson-Ardnor, and Henter 1998). The clinical diagnosis of HPS in humans requires fulfillment of 5 of the following 8 criteria: fever, splenomegaly, bicytopenia, fasting hypertriglyceridemia (≥265 mg/dl) or hypofibrinogenemia (≤150 mg/dl), demonstration of hemophagocytosis, low/absent natural killer cell activity and/or NK cell counts, hyperferritinemia (>500 μg/L), and increased soluble CD25 concentrations in the serum (>2,400 IU/mL; Henter et al. 2007). Hypertriglyceridemia is driven by inhibition of lipoprotein lipase by TNFα (Henter, Carlson, et al. 1991) and hypofibrinogenemia results from fibrinolysis due to the release of plasminogen activator.
Hemophagocytosis induced by mAbY.1 is similar to clinical (human or animal) HPS in that both conditions are associated with bicytopenias and macrophage proliferation. However, hemophagocytosis induced by mAbY.1 differed from clinical cases in that there was no evidence of cytokine release, hypertriglyceridemia, hypofibrinogenemia, lymphocyte dysregulation, or extrasplenic hemophagocytosis. Serum ferritin and soluble CD25 were not measured.
Cytokines and other factors released from activated T cells and macrophages such as TNFα, IL-1, IL-6, and IFN-γ drive many of the downstream clinical and laboratory findings of HPS (Henter, Elinder, et al. 1991; Henter, Carlson, et al. 1991). Animals administered mAbY.1 had no increases in peripheral blood cytokines. In vitro incubation of cynomolgus whole blood with mAbY.1 at concentrations up to 10 mg/mL did not elicit any relevant release of cytokines, including TNFα, IL-1, IL-6, and IFN-γ. Clinical pathology effects of HPS driven by these cytokines did not occur (i.e., hypertriglyceridemia or hypofibrinogenemia). Animals had no consistent changes in body temperatures during the 72 hr after dosing, and signs typically associated with fever in animals (decreased activity and food consumption) occurred only as incidental findings. NK-cell counts were unaffected by treatment. Taken together, the above findings suggest that systemic cytokine release was not a prominent feature of mAbY.1-induced hemophagocytosis.
Lymphocyte dysregulation is the underlying cause of most clinical cases of HPS, but did not play a major role in mAbY.1-related effects. In animals administered mAbY.1, there were no changes in peripheral lymphocyte subsets, or lymphocytic infiltrates associated with proliferating or activated macrophages in tissue. In addition, using purified monocytes rather than PBLs had no effect on the results of the phagocytosis assay. These data suggest that the primary effect of mAbY.1 involved monocytes and did not require dysregulation of lymphocytes.
Activated macrophages with hemophagocytosis in numerous organs are a common feature of clinical hemophagocytosis. However, in animals administered mAbY.1, macrophage proliferation and hemophagocytosis was restricted to the red pulp of the spleen. Macrophages in other tissues such as liver (including Kupffer cells), lymph node, bone marrow, and brain were not affected. To our knowledge, clinical HPS limited to the spleen has not been reported.
We hypothesized that mAbY.1 might be binding to monocytes, platelets, and/or RBCs, inducing phagocytosis. Binding of mAbs to macrophages can cause activation. In addition, binding of antibodies, including mAbs, to other blood cells (WBCs, RBCs, and PLT) accelerates their phagocytosis. However, a number of experiments failed to detect binding of mAbY.1 to any cynomolgus or human peripheral blood cells. We then considered that the binding of mAbY.1 might be low-affinity or might interfere with cell/cell interactions.
mAbY.1 may activate monocytes/macrophages, with platelets and RBCs being phagocytosed as innocent bystanders. The restriction of phagocytosis to the splenic red pulp suggests targeting of a specific population of monocytes/macrophages. Potential subpopulations include splenic red pulp macrophages that normally phagocytose aged or damaged RBCs, or the large number of monocytes residing in the splenic red pulp that are released during inflammation (Swirski et al. 2009).
Alternatively, mAbY.1 may act directly on platelets and RBCs, causing alterations that induce their phagocytosis by monocytes/macrophages. One of the several cell surface molecules in common between platelets and RBCs may be the target for mAbY.1.
A third possibility is that mAbY.1 blocks a specific interaction between macrophages and platelets or RBCs. In health, macrophages recognize platelets and RBCs as self through “don’t eat me” signaling, such as the SIRPα-CD47 system, in which CD47 on platelets and RBCs interacts with SIRPα on macrophages to send the self-signal. Platelets and RBCs from CD47−/ − mice infused into wild-type mice are rapidly phagocytosed by splenic macrophages (Oldenborg et al. 2000). mAbY.1 might interfere with the SIRPα-CD47 system or another “don’t eat me” pathway by binding with low affinity to either macrophage SIRPα or blood cell CD47. Further experiments are needed to address these questions.
The relationship of the intended target to the unexpected thrombocytopenia and decreased RBC mass in cynomolgus monkeys was evaluated in vivo and in vitro. Other IgG2 antibodies against the same target with approximately equal activity were tested in vivo and in vitro for thrombocytopenia and decreased RBC mass, and induction of platelet phagocytosis, respectively. There were no effects on platelets or RBCs with other mAbs against the target that were administered at 300 mg/kg iv to cynomolgus monkeys. In vitro, phagocytosis of autologous platelets by monocytes was not induced by mAbY.2, mAbY.3, mAbY.4, or mAbY.5. mAbY.1 was active against the intended target of humans and cynomolgus monkeys with similar potency; however, mAbY.1 did not induce phagocytosis of autologous platelets by human monocytes. Hematologic liabilities have not been reported in preclinical and clinical studies of small molecules against the same target. These data suggest that the mAbY.1-induced phagocytosis by cynomolgus macrophages of platelets and RBCs is likely an off-target effect.
Light chain/heavy chain exchanges between mAbY.1 and its 7-residue variant, mAbY.6, identified 3 differences in light chain amino acid residues that were sufficient to enable induction of phagocytosis. These sequences were in the conserved framework structure of the light chain variable domain of mAbY.1. As is evident from these observations, very small changes in amino acid sequences of mAbs can have profound biological impacts.
In conclusion, mAbY.1 induced direct or indirect activation of monocytes/macrophages and phagocytosis of platelets and erythrocytes in cynomolgus monkeys. In vitro, mAbY.1-induced phagocytosis of platelets and erythrocytes was observed in cynomolgus but not human monocytes. Other mAbs that competed for binding against the same intended target did not cause thrombocytopenia in vivo or phagocytosis of platelets by monocytes in vitro. These experiments demonstrate that mAbs can have effects that are unrelated to the intended target and may be species-specific. These effects can be due to very small differences in antibody sequences and can be evaluated using modified antibodies. This example demonstrates that nonclinical safety studies may be essential for understanding off-target effects of mAbs prior to clinical trials.
Footnotes
The author(s) declared no potential conflicts of interest with respect to the research, authorship, and/or publication of this article.
The author(s) disclosed receipt of the following financial support for the research, authorship, and/or publication of this article: This work was supported by Amgen Inc.
Acknowledgments
The authors thank Glenn Elliott and David Zelmanovic for data analysis and interpretation; Licheng Shi and Darcey Clark for scientific assistance; and Julia R. Gage, on behalf of Amgen Inc., for editorial assistance.
Authors’ Note
Nancy Everds, Nianyu Li, Keith Bailey, Madeline Fort, Riki Stevenson, Remi Jawando, Kevin Salyers, Vibha Jawa, Padma Narayanan, Erin Stevens, Ching He, Mai Phuong Nguyen, Sam Tran, Cen Xu, and Katherine Sprugel are currently or were previously employed by Amgen Inc., and/or own Amgen stock.
Abbreviations
References
Supplementary Material
Please find the following supplemental material available below.
For Open Access articles published under a Creative Commons License, all supplemental material carries the same license as the article it is associated with.
For non-Open Access articles published, all supplemental material carries a non-exclusive license, and permission requests for re-use of supplemental material or any part of supplemental material shall be sent directly to the copyright owner as specified in the copyright notice associated with the article.