
Abstract
Contrast-induced nephropathy (CIN) refers to a decline in renal function following exposure to iodinated contrast media (CM). The present study was initiated to explore the role of known human risk factors (spontaneous hypertension, diabetes, protein-losing nephropathy) on CIN development in rodent models and to determine the effect of CM administration on kidney injury biomarkers in the face of preexisting kidney injury. Spontaneously hypertensive rats (hypertension), streptozotocin-treated Sprague Dawley rats (diabetes), and Dahl salt-sensitive rats (protein-losing nephropathy) were given single intravenous injections of the nonionic, low osmolar contrast medium, iohexol. Blood urea nitrogen (BUN), serum creatinine (sCr), and urinary biomarkers; albumin, lipocalin 2 (Lcn-2), osteopontin (Opn), kidney injury molecule 1 (Kim-1), renal papillary antigen 1 (Rpa-1), α-glutathione S-transferase (α-Gst), µ-glutathione S-transferase (µ-Gst), and beta-2 microglobulin (β2m) were measured in disease models and appropriate controls to determine the response of these biomarkers to CM administration. Each disease model produced elevated biomarkers of kidney injury without CM. Preexisting histopathology was exacerbated by CM but little or no significant increases in biomarkers were observed. When 1.5-fold or greater sCr increases from pre-CM were used to define true positives, receiver–operating characteristic curve analysis of biomarker performance showed sCr was the best predictor of CIN across disease models. β2m, Lcn-2, and BUN were the best predictors of histopathology defined kidney injury.
Introduction
Contrast-induced nephropathy (CIN), also known as contrast-induced acute kidney injury (C-AKI), is a form of AKI that follows intravascular contrast media (CM) exposure (Solomon 2008). The term C-AKI implies direct kidney tissue damage following exposure to iodinated CM, while the term CIN describes a decline, often transient, in kidney function associated with the administration of CM (Goldfarb et al. 2009; Perazella 2009; Solomon 2009). CM-associated histological kidney changes largely consisting of proximal tubular vacuolization or necrosis have been previously described (Tumlin et al. 2006). Clinically, CM-associated decreases in renal function due to altered renal filtration have been reflected in serum creatinine (sCr) increases. Even when mild and transient, these changes have been associated with increased acute mortality and decreased long-term survivability (Finn 2006; McCullough 2006; Solomon et al. 2009). The incidence of CIN varies by the definition used for designating functional decline (Finn 2006; McCullough 2009; Solomon and Segal 2008; Waikar and Bonventre 2009). However, the role of CM in the decline of kidney function in CIN is not fully understood (Baumgarten and Ellis 2008; Katzberg and Lamba 2009). Following CM administration, CIN may evolve directly from toxic injury to kidney cells (perhaps more correctly termed C-AKI) or indirectly from induction of physiologic changes (i.e., reduced renal blood flow) that result in loss of compensatory mechanisms that are countering preexisting kidney injury.
The incidence of CIN in the general human population is estimated to be 1% to 2%, but in patients with risk factors the incident might be as high as 50% (Finn 2006). Risk factors for CIN in patients include cardiac disorders, largely because of the increased exposure to CM in diagnostic procedures, and more significantly, diabetes mellitus with renal insufficiency, and preexisting renal impairment including chronic kidney disease (Goldfarb 2005; Finn 2006; Pannu, Wiebe, and Tonelli 2006). CIN is difficult to induce in normal laboratory animals (Morcos 1998). A small animal model for contrast-induced renal injury was previously described in aging spontaneously hypertensive rats (SHRs; Duarte, Zhang, and Ellis 1997). This SHR model has also been applied to evaluate the effects of CM on systolic blood pressure and renal damage (Duarte, Zhang, and Ellis 1998, 1999; Zhang, Duarte, and Ellis 1999). However, little attention has been paid to human risk factors in developing rodent models, and the relationship between CIN and risk factors such as diabetes and preexisting nephropathy has not been thoroughly explored in animal models.
Iohexol (Omnipaque), a low osmolar, nonionic CM has been associated with increased incidence of CIN in patients (Solomon and Dumouchel 2006), and animal studies have demonstrated omnipaque 350 (350 mg of iodine/mL; 672 mOsm/kg) to be more nephrotoxic than omnipaque 140 (140 mg of iodine/mL; 322 mOsm/kg; Zhang, Duarte, and Ellis 1999). The effects of ominpaque in the face of hypertension, diabetes, and preexisting nephropathy (common predisposing backgrounds for CIN) were studied in SHRs, streptozotocin-treated Sprague-Dawley (SD) rats, and Dahl salt-sensitive (DSS) rats, respectively. The present study was conducted in rodent models with known human risk factors for CIN to determine whether these risk factors could elicit CIN as defined by 1.5-fold sCr increases and/or exacerbate preexisting kidney injury as determined by histopathology evaluation and novel biomarkers of kidney injury. To date, no reliable biomarker has been identified for predicting or monitoring CIN. In the present study, a commercially available set of urinary kidney injury biomarkers was used to assess the utility of these urinary proteins in predicting CIN. While there is much supporting evidence for the sensitivity of several novel urinary proteins in detecting renal injury induced by nephrotoxic drugs (Lock 2010), less is known about the response of these biomarkers in CIN or in disease states that predispose to CIN. In this study, the profiles of various kidney injury biomarkers before and after exposure of rodent models to intravenous iohexol were examined to determine whether CM administration could affect the levels of urinary kidney injury biomarkers and whether these newer markers could predict CIN.
Materials and Methods
Animal Care and Treatment
All animal procedures were performed in accordance with the U.S. Public Health Service Guide for the Care and Use of Laboratory Animals in an AAALAC-accredited facility under an Institutional Animal Care and Use Committee approved protocol (WO-2009-86). Strain, age, and procedure information on the creation and monitoring of models prior to CM administration is detailed below. Following CM administration, sacrifice and sampling protocols were similar for each model.
SHR Model
Male SHRs that spontaneously develop progressive hypertension and male Wistar-Kyoto (WKY) rats that are normotensive (the background strain for SHRs) were ordered from Harlan and acclimated according to protocol. Animals were 20 to 21 weeks old upon arrival and had been screened prior to delivery for hypertension (systole >180 mm Hg). No further measurements of hypertension were performed. Animals were maintained in standard plastic caging, experienced 12-hour light cycling at 22°C to 24°C with ad libitum water and standard chow. Periodic serial urine and blood samples were obtained to compare baseline differences in serum and urinary biomarkers between SHRs and WKY rats (n = 10 per strain). At 26 to 27 weeks of age, groups from each strain were given a single intraperitoneal injection of furosemide (15 mg/kg) and placed in metabolic cages for 4 hr without water. Upon removal from the metabolic cages, animals received CM as a single intravenous dose (6 ml/kg) of iohexol (omnipaque 350 mg iodine [mgI]/ml; GE Healthcare, Princeton, NJ) or an equivalent volume of 0.9% w/v saline (Sal) and were returned to normal caging with ad libitum water intake. The four treatment groups each containing five rats were (1) SHR + CM, (2) SHR + saline, (3) WKY + CM, and (4) WKY + saline. Urine and blood were obtained for animals in each group at 24, 48, and 72 hr posttreatment. All animals were sacrificed 72 hr following CM administration.
Streptozotocin-Induced Diabetic Sprague-Dawley Model
SD rats, 6- to 7-week-old male were ordered from Harlan and acclimated according to protocol. Animals were maintained in standard plastic caging, experienced 12-hr light cycling at 22°C to 24°C with ad libitum water and standard chow. Periodic serial urine and blood collections were instituted to monitor kidney function prior to creation of the diabetic phenotype and prior to CM administration. At 9 to 10 weeks of age, groups were treated with either intraperitoneal streptozotocin (STZ, 65 mg/kg) to induce diabetes through beta cell destruction or an equal volume of saline. Blood glucose levels were evaluated 72 hr postinjection to confirm hyperglycemia. Periodic blood and urine samples were obtained to compare baseline biomarker levels in diabetic rats (n = 14) to those in nondiabetic rats (n = 5). At 14 to 15 weeks of age, a single intravenous dose (6 ml/kg) of 350 mgI/ml iohexol was given to diabetic (n = 10) and nondiabetic (n = 5) cohorts of SD rats. Four diabetic rats received no treatment and were sacrificed at the same time that other diabetic animals received CM (time 0). Two treatment groups (1) diabetic SD (n = 10) and (2) nondiabetic SD (n = 5) were then compared after CM treatment. Urine and blood were obtained from animals in both groups at 24, 48, and 72 hr posttreatment. All animals were sacrificed 72 hr following CM administration.
DSS Nephropathy Model
(Studies A and B) Six- to seven-week-old male DSS and Dahl salt-resistant (DSR) rats were purchased from Harlan and acclimated according to protocol. Animals were maintained in standard plastic caging, experienced 12-hr light cycling at 22°C to 24°C with ad libitum water and, initially, standard chow. Periodic serial urine and blood samplings were initiated to assess kidney function prior to CM administration. At 7 to 8 weeks of age, animals were switched to a high-salt (8.5% NaCl) diet. As described in the literature, the high-salt diet resulted in hypertension and protein-losing nephropathy in DSS animals but not in DSR animals (Simchon et al. 1989). Blood and urine samples were collected to obtain baseline differences in serum and urinary biomarkers between DSR and DSS rats without CM. At 10 to 11 weeks of age, animals received a single intravenous dose (6 ml/kg) of 350 mgI/ml iohexol or an equal volume of saline. (Study A) Two experimental groups (1) DSR + CM, n = 4 and (2) DSS + CM, n = 5 were compared following CM administration. Urine and blood were obtained for animals in both groups at 24, 48, and 72 hr posttreatment. As the first experiment within this project, final sampling and sacrifice were planned for 7 days post-CM. Two DSS rats were found dead the morning of sacrifice. Biomarker data from these rats at 72 hr post-CM are included in biomarker analysis, but these two animals were not included in the histopathology evaluations that were conducted 7 days after CM. All other experiments were designed with sacrifice of the animals at 72 hr following CM exposure. (Study B) Two treatment groups (1) DSS + CM, n = 7; and (2) DSS + saline, n = 7 were then compared. Urine and blood were obtained for animals in both groups at 24, 48, and 72 hr posttreatment. All animals were sacrificed 72 hr following CM administration.
Sampling and Sacrifice
When feasible, urine and blood were collected following the 2-day acclimation period but before any treatment to induce the model phenotype (SHRs required no further treatment). Once the model phenotype was established, periodic blood samples were obtained from the jugular vein with the rat under isoflorane anesthesia. Prior to blood collection, rats were placed in individual metabolic cages and urine collected for 4 hr in a refrigerated rack. Urine was centrifuged, aliquoted, and stored at −80°C until analyzed. Samples were taken every 7 to 10 days during the model monitoring phase of the experiment. Terminal urine was collected for 4 hours immediately preceding sacrifice. Terminal exsanguination and blood collection from the caudal vena cava was performed under isoflorane anesthesia. Blood was allowed to clot and was then centrifuged, serum separated, aliquoted, and stored at −80°C until analyzed. Tissues for histopathology evaluation were harvested at sacrifice and stored in formalin.
Serum and Urine Analyses for kidney Injury
Sera were analyzed for albumin, total protein, alkaline phosphatase, alanine aminotransferase, amylase, total bilirubin, calcium, phosphorus, glucose, sodium, potassium, globulins, blood urea nitrogen (BUN), and creatinine (sCr) using a Vetscan Model 200 Blood Analyzer and Vetscan Comprehensive Diagnostic Profiles (Abaxis, Union City, CA). A reagent strip (Multistix 7, Siemens, Tarrytown, NY) was used to estimate urinary protein loss in the Dahl nephropathy model. Following manufacturer’s directions, the urinary biomarkers albumin (Alb), lipocalin 2 (Lcn-2), osteopontin (Opn), kidney injury molecule 1 (Kim-1), renal papillary antigen 1 (Rpa-1), α-glutathione S-transferase (α-Gst), µ-glutathione S-transferase (µ-Gst), and beta-2 microglobulin (β2m) were quantified using proprietary rat kits on the Meso Scale Discovery electrochemiluminescence platform (Meso Scale Discovery, Gaithersburg, MD). To account for differences in hydration and urine concentration, the results were normalized to urine creatinine, which was measured against a standard curve in an enzyme-based assay with Assay Design’s Creatinine Detection Kits (Assay Designs, Inc, Ann Arbor, MI) following the manufacturer’s protocol. Total urine volume collected per animal was also recorded for each 4-hr collection period. Normalized values were used for all data presentations and analyses.
Histopathology
Both kidneys and the liver were removed immediately following sacrifice. The left and right kidneys were bisected longitudinally and transversally, respectively. The liver was cut into 5 to 10 mm slices. Both kidneys and the liver were immersion fixed in 4% neutral-buffered formalin for 24 hours, embedded in paraffin, sectioned at 5 µ and stained with hematoxylin and eosin (H&E). Two to six longitudinally and transversally cut sections from each animal were used for microscopic evaluation. The histopathological evaluation of the glomeruli, tubules, interstitium, and arteries of the kidney was performed by a pathologist using a scale of 0 to 4: 0 = normal; 1 = mild; 2 = moderate; 3 = severe; and 4 = very severe (Duarte, Zhang, and Ellis 1997). A similar scale was used to evaluate histopathology changes in the liver including changes in hepatocytes, hepatic morphology, inflammation, and vasculature.
Statistics
One-way analysis of variance (ANOVA) or ANOVA on ranks with post hoc significance testing (p < .05) with Holm-Sidak method or Tukey test, respectively, was used to make intra-group comparisons between 3 or more groups. For two groups, t tests or rank sum tests were used to compare treatment groups to controls. For comparisons in the same animal pre- and post-CM administration, paired t tests were administered. Biomarker performances were compared using receiver–operating characteristic (ROC) curve analyses. ROC curves evaluating biomarker ability to reflect detectable morphologic change used histopathology as the determinant of true positives. Other ROC curves were generated to evaluate the performance of biomarkers in detecting CIN that was defined as a 50% or greater increase in sCr following CM administration. Animals experiencing this degree of change were considered true positives. All statistical analyses were conducted in SigmaPlot 11 (Systat Software Inc., San Jose, CA).
Results
General Toxicity
In the SHR model, the rats had preexisting hypertension. Therefore, their background strain, WKY, was used as a comparator for any changes that occurred with evolution of hypertension. No clinical signs were detected in either SHRs or WKY rats. Normal food and fluid intake and normal body condition were maintained. No differences were recorded in urine output between strains or CM treatment status (data not shown).
In the STZ-induced diabetic SD model, STZ-treated rats evolved from normoglycemic to hyperglycemic within 2 days of STZ treatment. Prior to creating the diabetic model, there were no differences among SD rats in size, appearance, clinical chemistry, or urinary biomarkers of renal injury (data not shown). Three days following STZ treatment, polydipsia and polyuria were seen and within 2 to 3 weeks the animals had developed loose stool related to the profound polydipsia. The average serum glucose concentration for STZ-treated animals was greater than 600 mg/dl for the duration of the experiment. Over the 2 to 3 weeks prior to CM administration and sacrifice, the majority of diabetic animals experienced chronic mild to moderate weight loss (3–12%). Although unkempt in appearance, all animals remained alert, active, eating, and drinking. Solute diuresis resulted in doubled urine volumes in diabetic rats (p < .05) compared to nondiabetic rats (11.70 ± 1.66 ml vs. 5.98 ± 2.27 ml; mean ± standard deviation). There was no change in urine volume following CM administration in either diabetic or nondiabetic rats.
After 2 days on a high-salt diet, DSS but not DSR rats progressed from normal urine protein to protein-losing nephropathy (average >2,000 mg/dl). Over 2 to 3 weeks on the high-salt diet, a mild decline in the general condition (weight loss, poor hair coat, decreased grooming) of the DSS rats was noted in Study A, but all animals remained alert and responsive with normal food and water intake. All animals in Study B maintained good general condition throughout the experiment although protein loss was approximately the same as in Study A. Not unexpectedly, both DSR and DSS rats experienced a three- to fivefold increase in urine volume after being placed on the high-salt diet (data not shown; p < .05). In Study A, DSS rats subsequently given CM had a minimal though statistically significant post-CM decrease (p < .05) in urine volume (12.36 ± 2.71 ml to 6.92 ± 3.42 ml; mean ± standard deviation) compared to their pre-CM volumes. In Study B, this decrease was not statistically significant (12.94 ± 4.20 ml to 9.47 ± 5.28 ml; mean ± standard deviation).
Histopathological Studies
Some models demonstrated changes in BUN, serum alkaline phosphatase and alanine aminotransferase, and urinary GSTs, which could potentially be associated with either liver injury or kidney injury. Liver sections from all rats were evaluated (Table 1) and representative photomicrographs are depicted in Figure 1. Mild inflammation was found uniformly in SHR + saline, SHR + CM, and WKY + CM rats. A single (1 of 4) diabetic animal that did not receive CM had mild liver injury, but the rest had no demonstrable lesions (Figure 1A). Since all nondiabetic rats received CM, tissues from nondiabetic rats without CM treatment were not available for evaluation. Mild inflammation, hepatocyte vacuolization, and necrosis were described in all nondiabetic rats given CM. The majority of diabetic rats treated with CM demonstrated similar mild lesions but 30% exhibited massive hepatocellular necrosis and inflammation in the center of the hepatic lobules (Figure 1B, C, D). DSS + saline rats had no liver injury except for a single rat (1 of 7) that exhibited mild vascular changes and inflammation (Figure 1E). Since all DSR rats received CM, tissue for DSR + saline was not available for evaluation. A single DSR + CM (1 of 4) rat had moderate liver injury. Mild to very severe hyaline arteriolosclerosis, periarteritis nodosa, and inflammation in the hepatic triads was identified post-CM treatment in all evaluated DSS + CM rats in Study A and in a subset (4 of 7) of DSS + CM rats in Study B (Figures 1F, G, H).

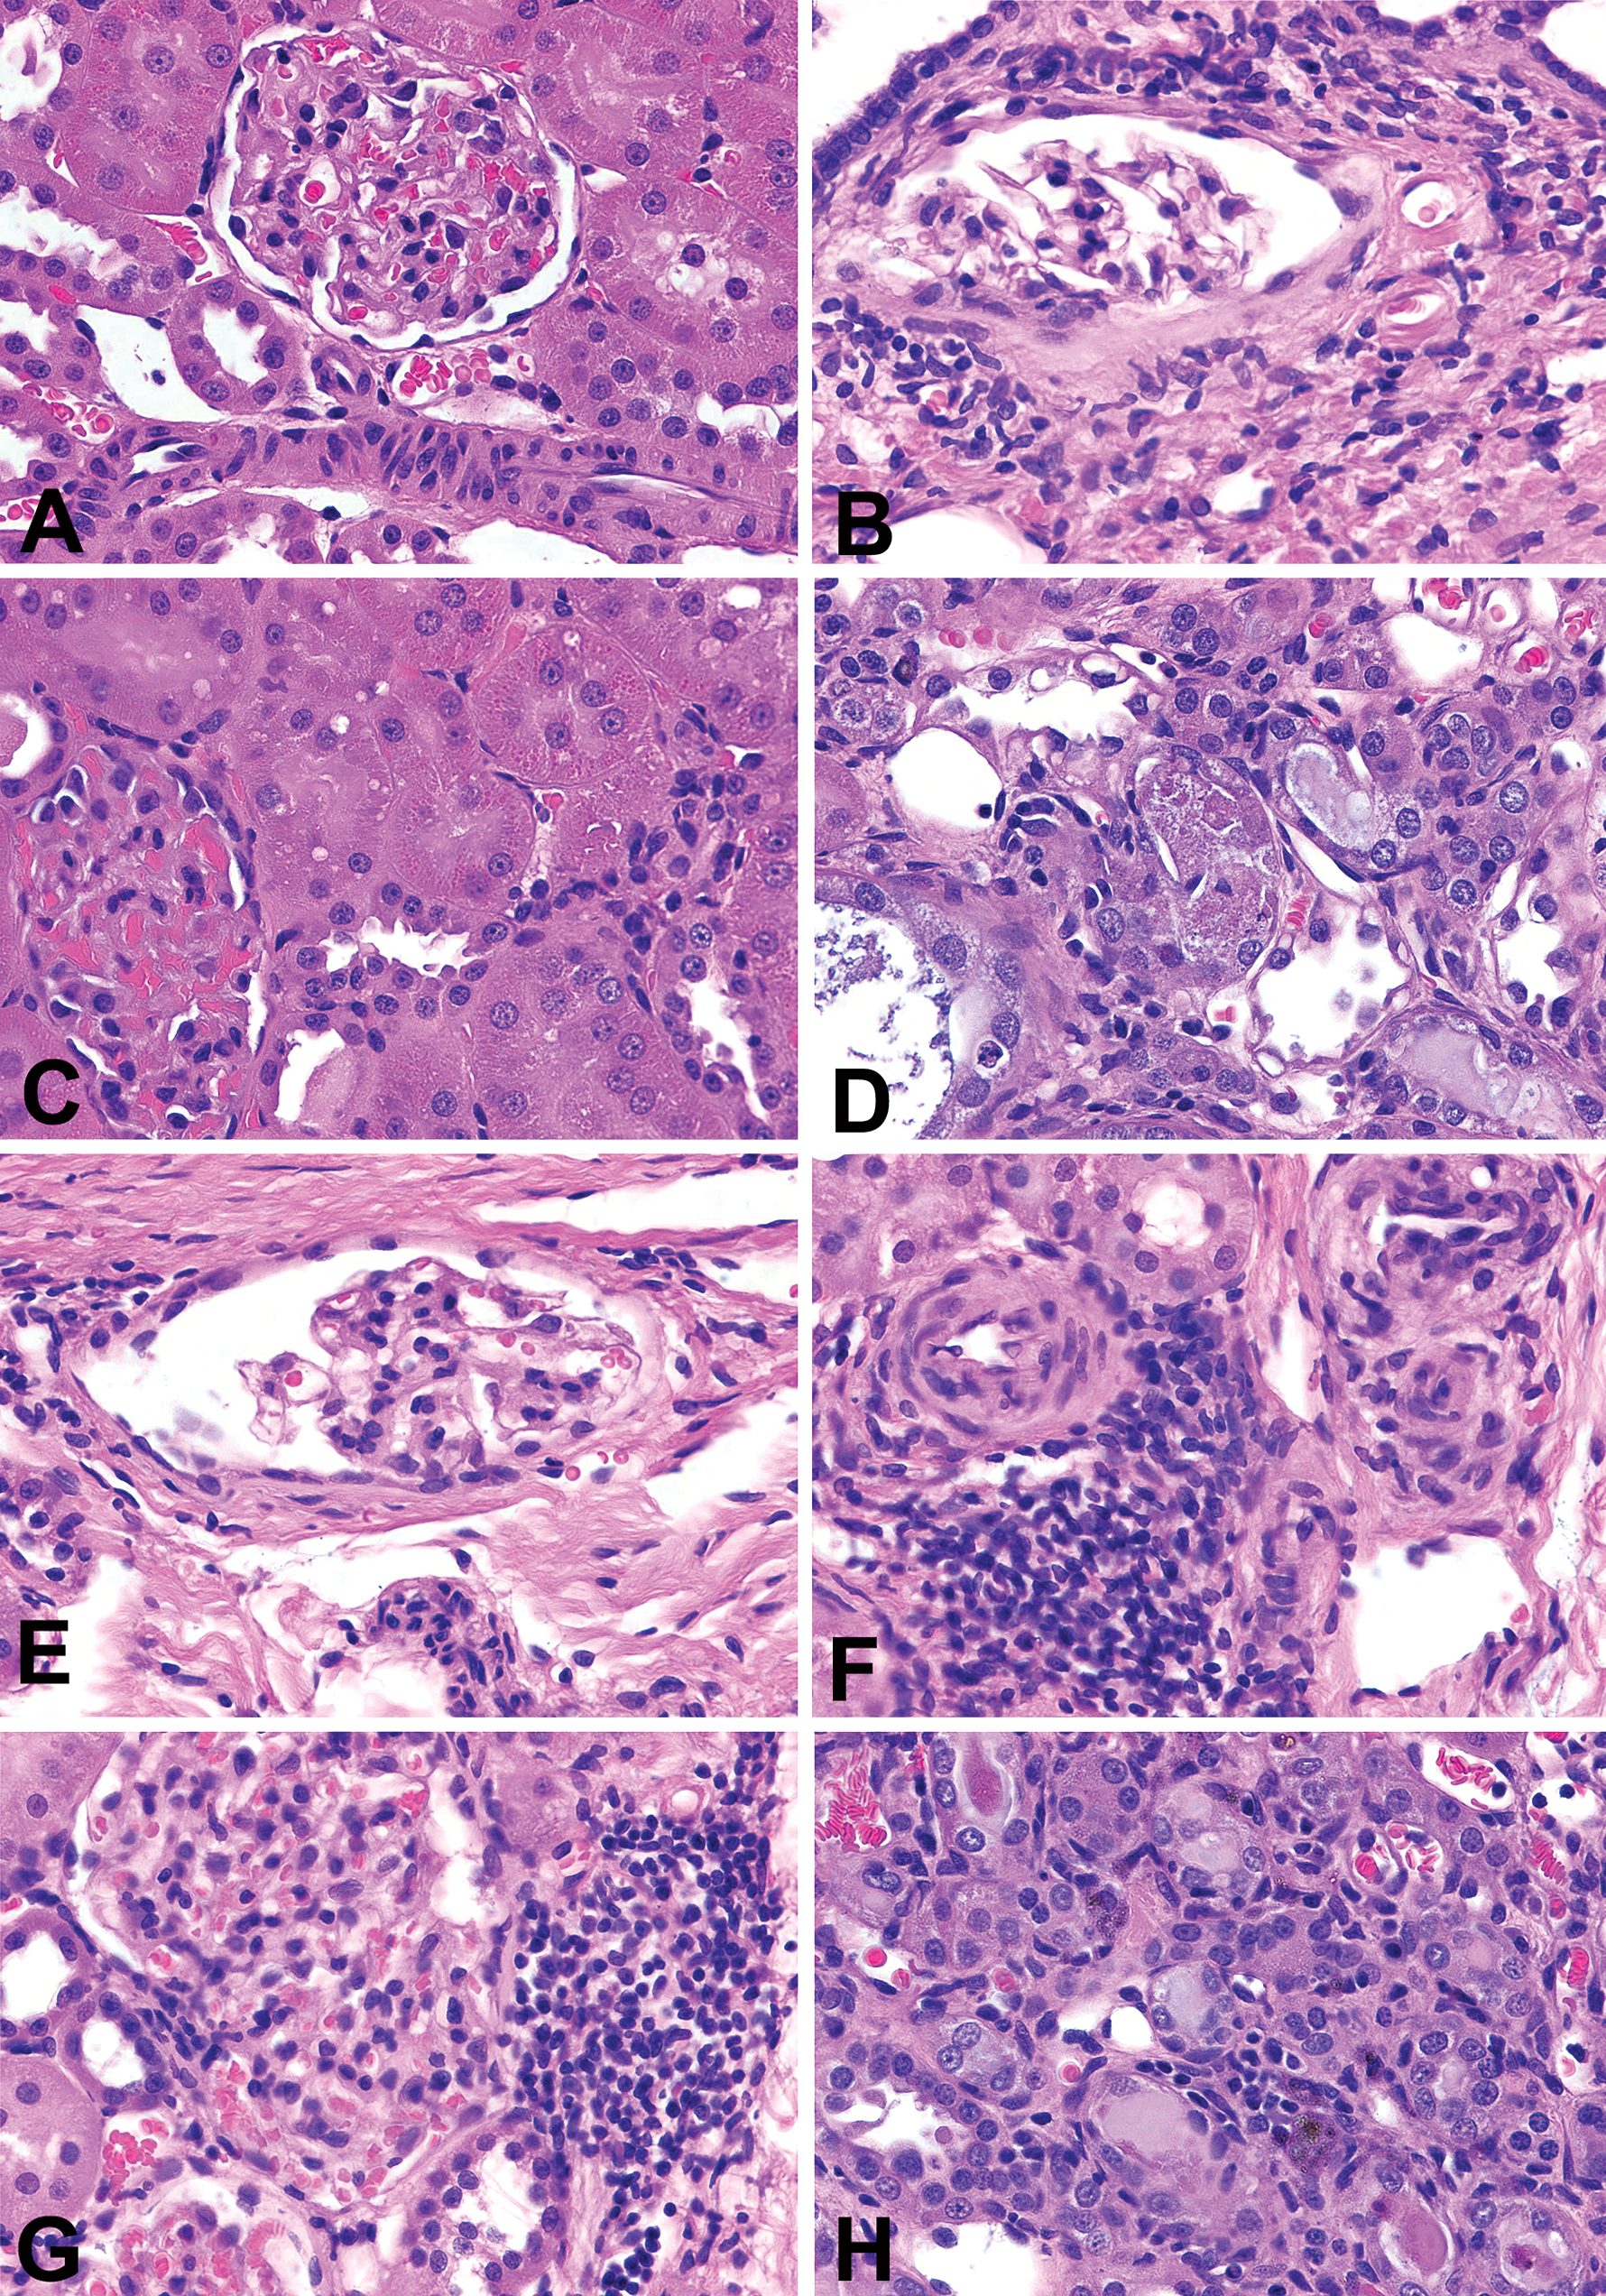
Photomicrographs showing contrast-induced acute liver injury in streptozotocin-induced diabetic Sprague-Dawley (SD) rats and Dahl salt-sensitive (DSS) rats. A, Untreated diabetic SD rats; no liver injury. B–D, Diabetic SD rats + CM; (B) numerous inflammatory cells and hemorrhage; (C) cytoplasmic vacuolization of hepatocytes; (D) massive necrosis of hepatocytes, inflammation, and hemorrhage. (E) Dahl salt-sensitive (DSS) rats + saline; no liver injury. (F–H) Dahl salt-sensitive (DSS) rats + CM treatment; severe hepatic vascular injury seen in the portal triads; (F) fibroid necrosis and perivascular fibrosis and inflammation were commonly identified in the arterioles; (G) small-sized arteries; and (H) medium-sized arteries. Hemotoxylin eosin (H&E) stain, ×630 for all figures.
Liver injury in animal models 72 hours after exposure to contrast media or saline.
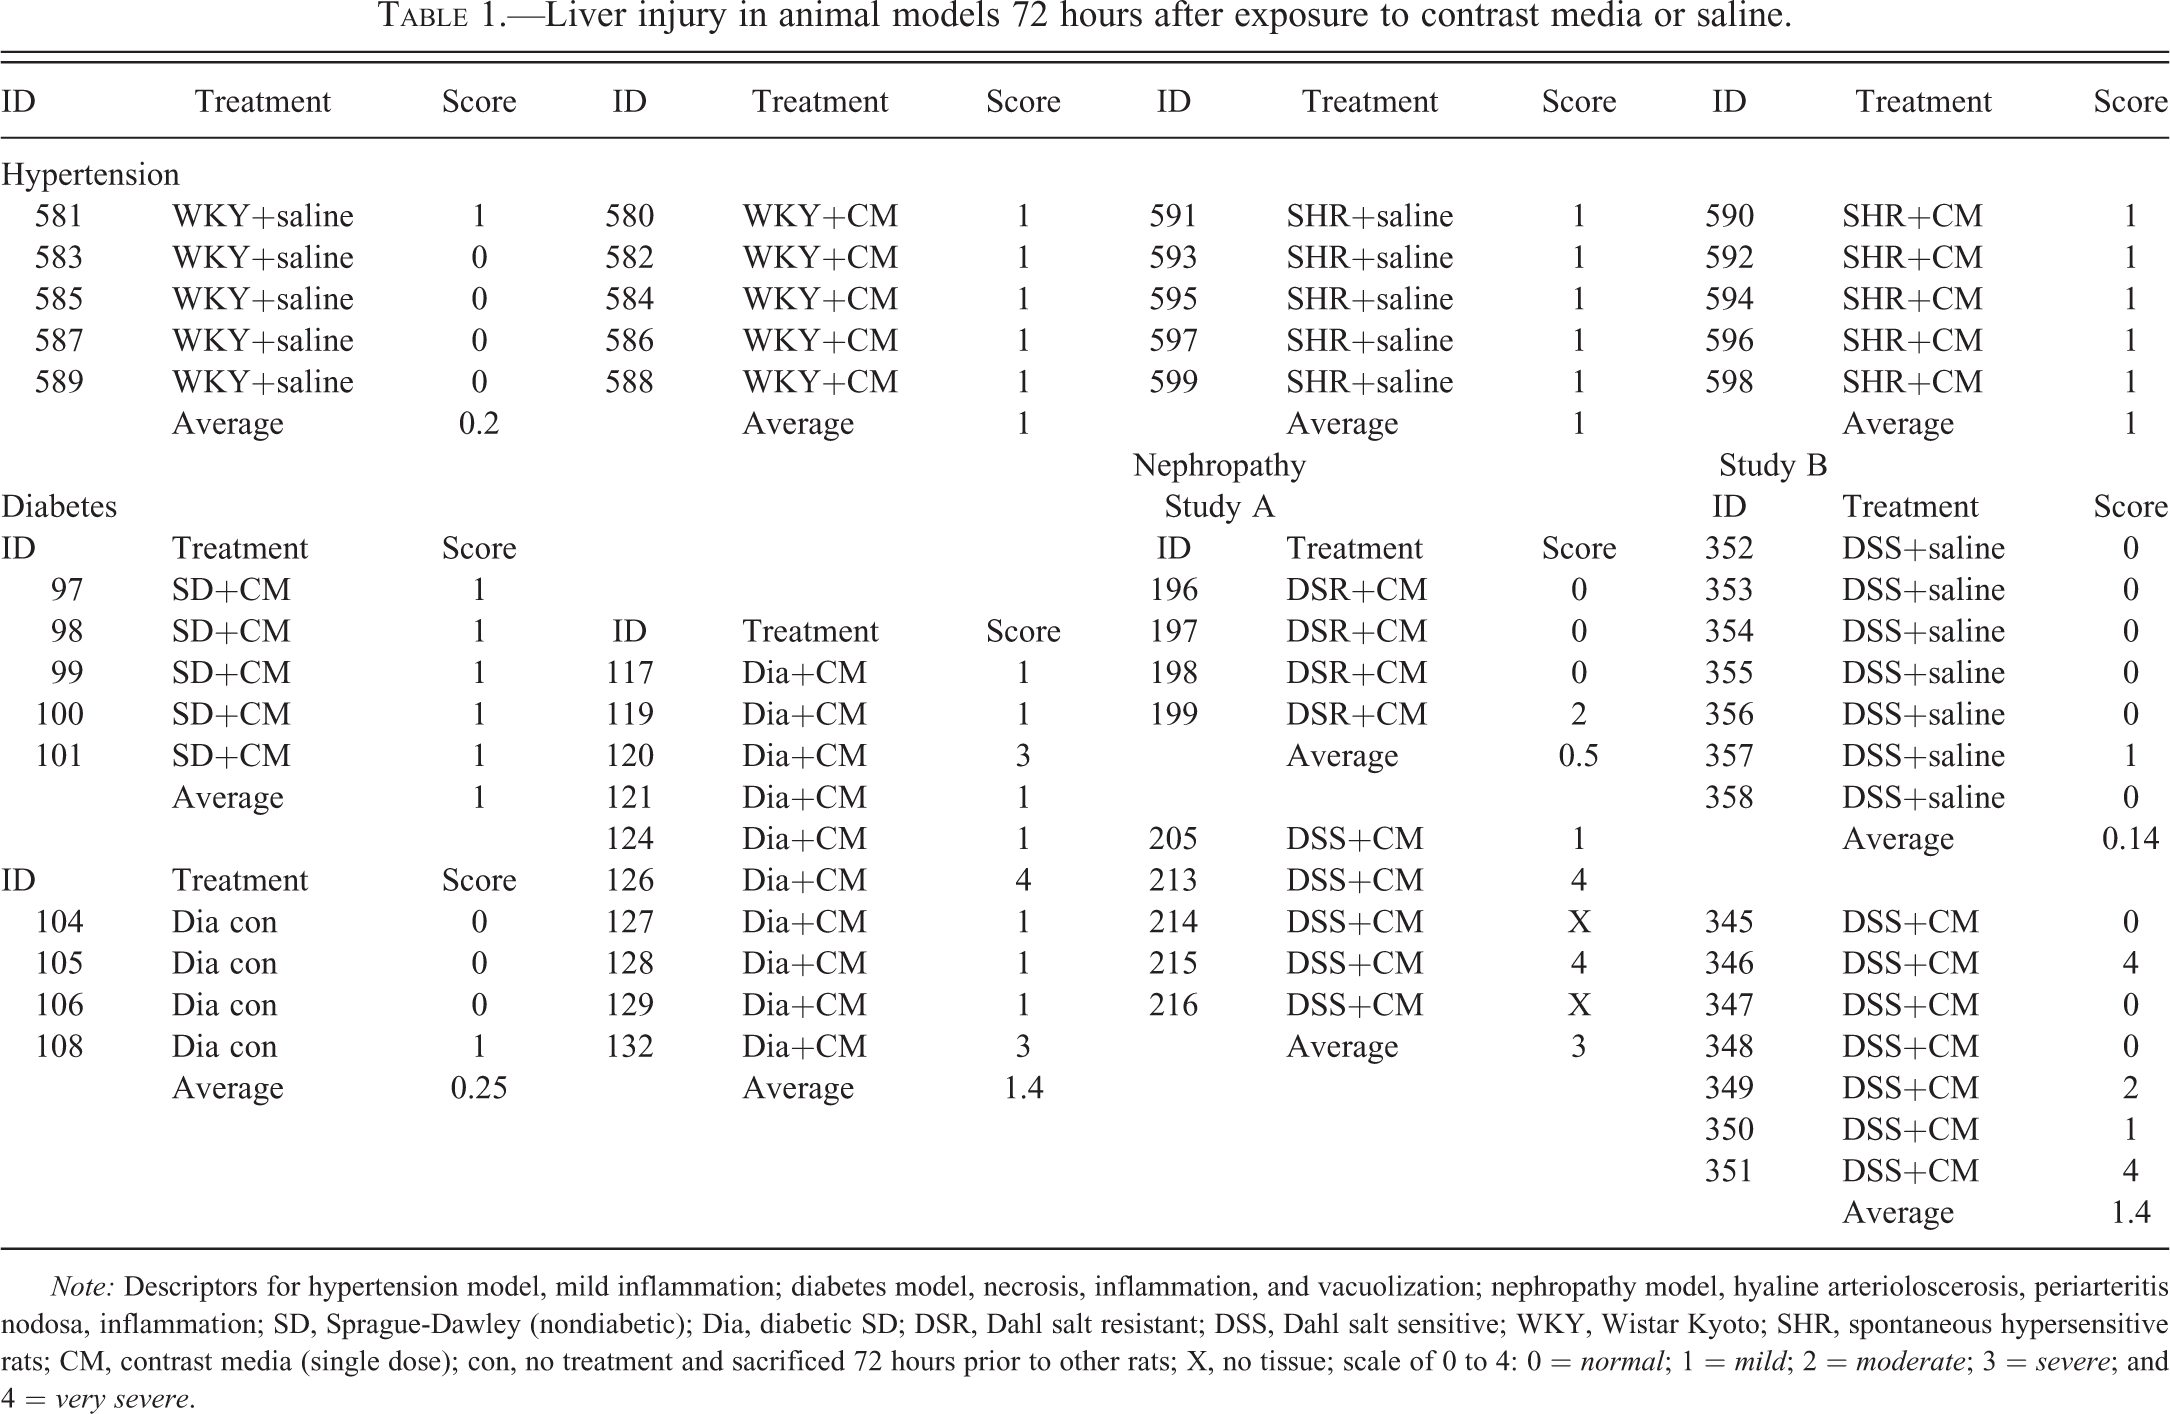
Note: Descriptors for hypertension model, mild inflammation; diabetes model, necrosis, inflammation, and vacuolization; nephropathy model, hyaline arterioloscerosis, periarteritis nodosa, inflammation; SD, Sprague-Dawley (nondiabetic); Dia, diabetic SD; DSR, Dahl salt resistant; DSS, Dahl salt sensitive; WKY, Wistar Kyoto; SHR, spontaneous hypersensitive rats; CM, contrast media (single dose); con, no treatment and sacrificed 72 hours prior to other rats; X, no tissue; scale of 0 to 4: 0 = normal; 1 = mild; 2 = moderate; 3 = severe; and 4 = very severe.
Histological evaluation of the glomeruli, tubules, interstitium, and blood vessels (arteries and arterioles) within the kidney was used to distinguish model-related injury from C-AKI. The nephropathy score of each category of kidney injury (on a scale of 0–4) is summarized in Tables 2 through 4 and representative photomicrographs are presented in Figures 2 through 4.
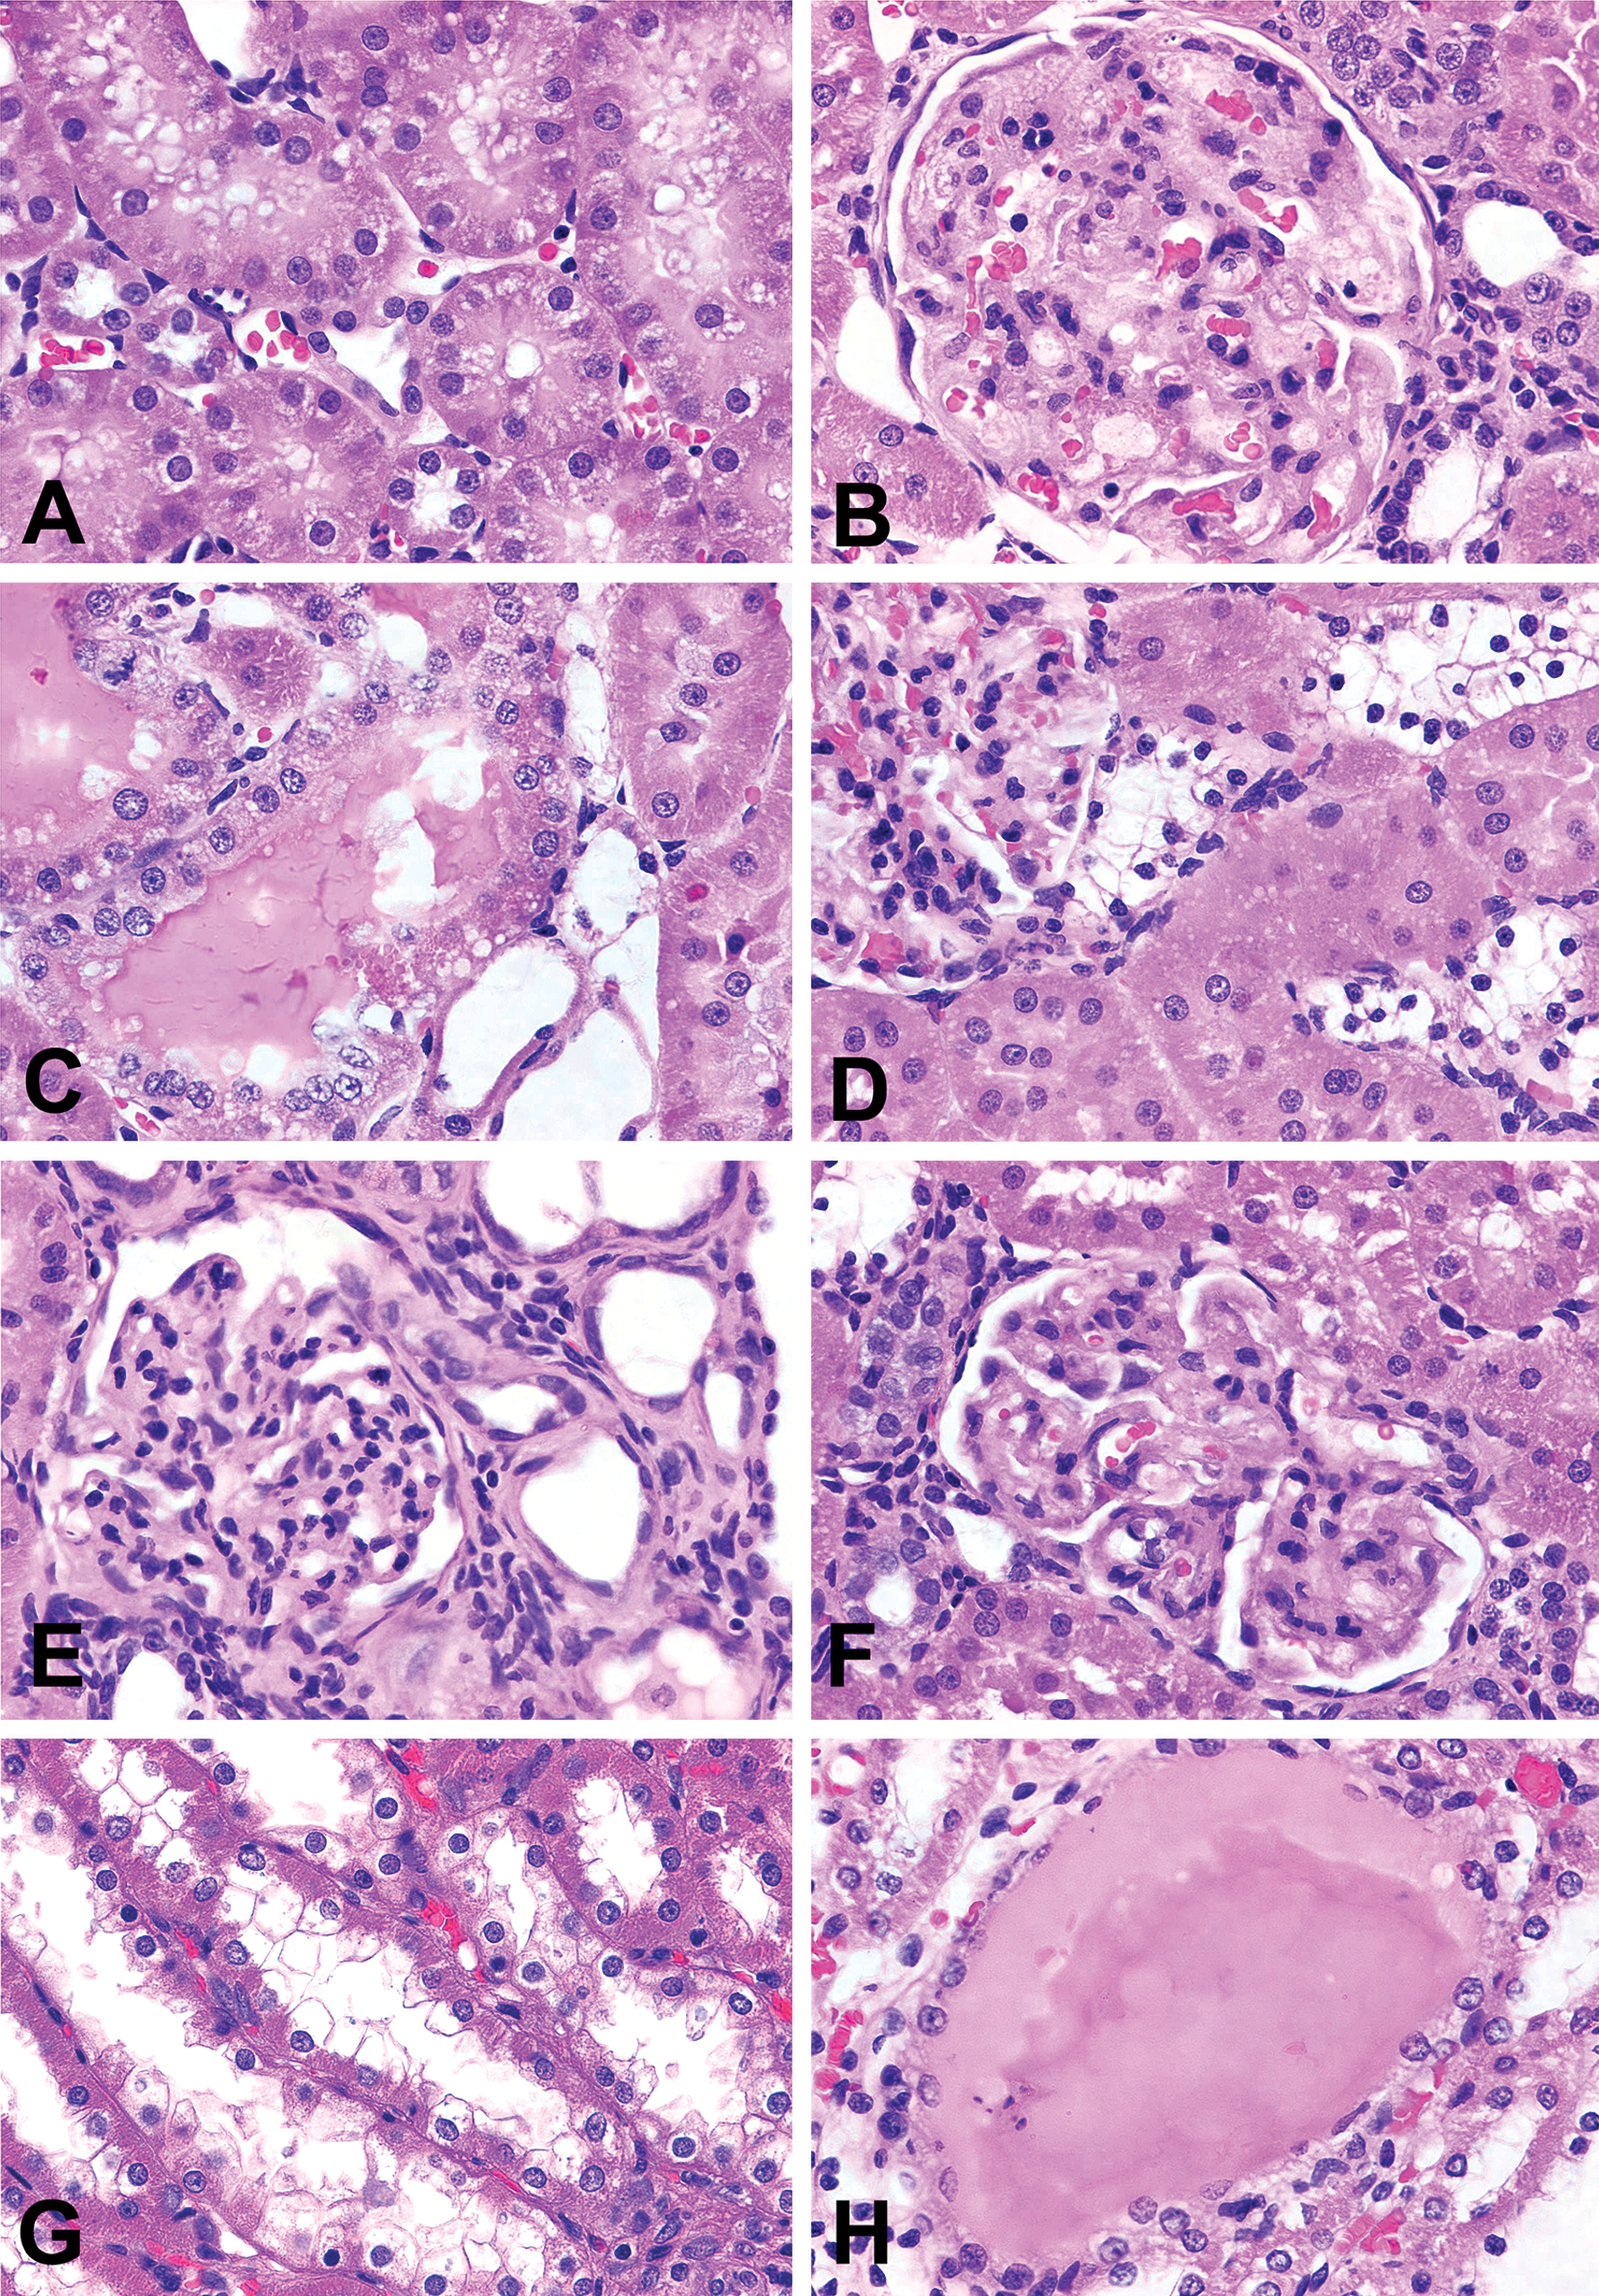
Comparison of model-associated kidney injury and contrast-induced acute kidney injury in Wistar-Kyoto (WKY) rats and spontaneously hypertensive rats (SHRs). A, WKY rat without CM treatment; no significant changes in the glomeruli, tubules, small arteries or arterioles. B, SHRs without CM treatment; mild glomerosclerosis presenting as segmental sclerosis with thickening of Bowman’s capsule, hyaline change in arterioles, interstitial fibrosis, and infiltration with lymphocytes. C, CM-treated WKY; mild degeneration (cytoplasmic vacuoles) in proximal tubules. D–H, CM-treated SHRs; (D) epithelial cell necrosis in the distal tubules; (E) segmental sclerosis with thickening of Bowman’s capsule in the affected glomerulus; (F) early stage of periarteritis nodosa presenting as marked increase in thickening of intima and media and narrowing the lumen, and periarterial inflammation; (G) severe interstitial inflammation. (H) interstitial inflammation and macrophages with accumulating intracellular pigment. Hemotoxylin eosin (H&E) stain, ×630 for all figures.
Renal findings in WKY rats and SHRs 72 hr after exposure to contrast media or saline.
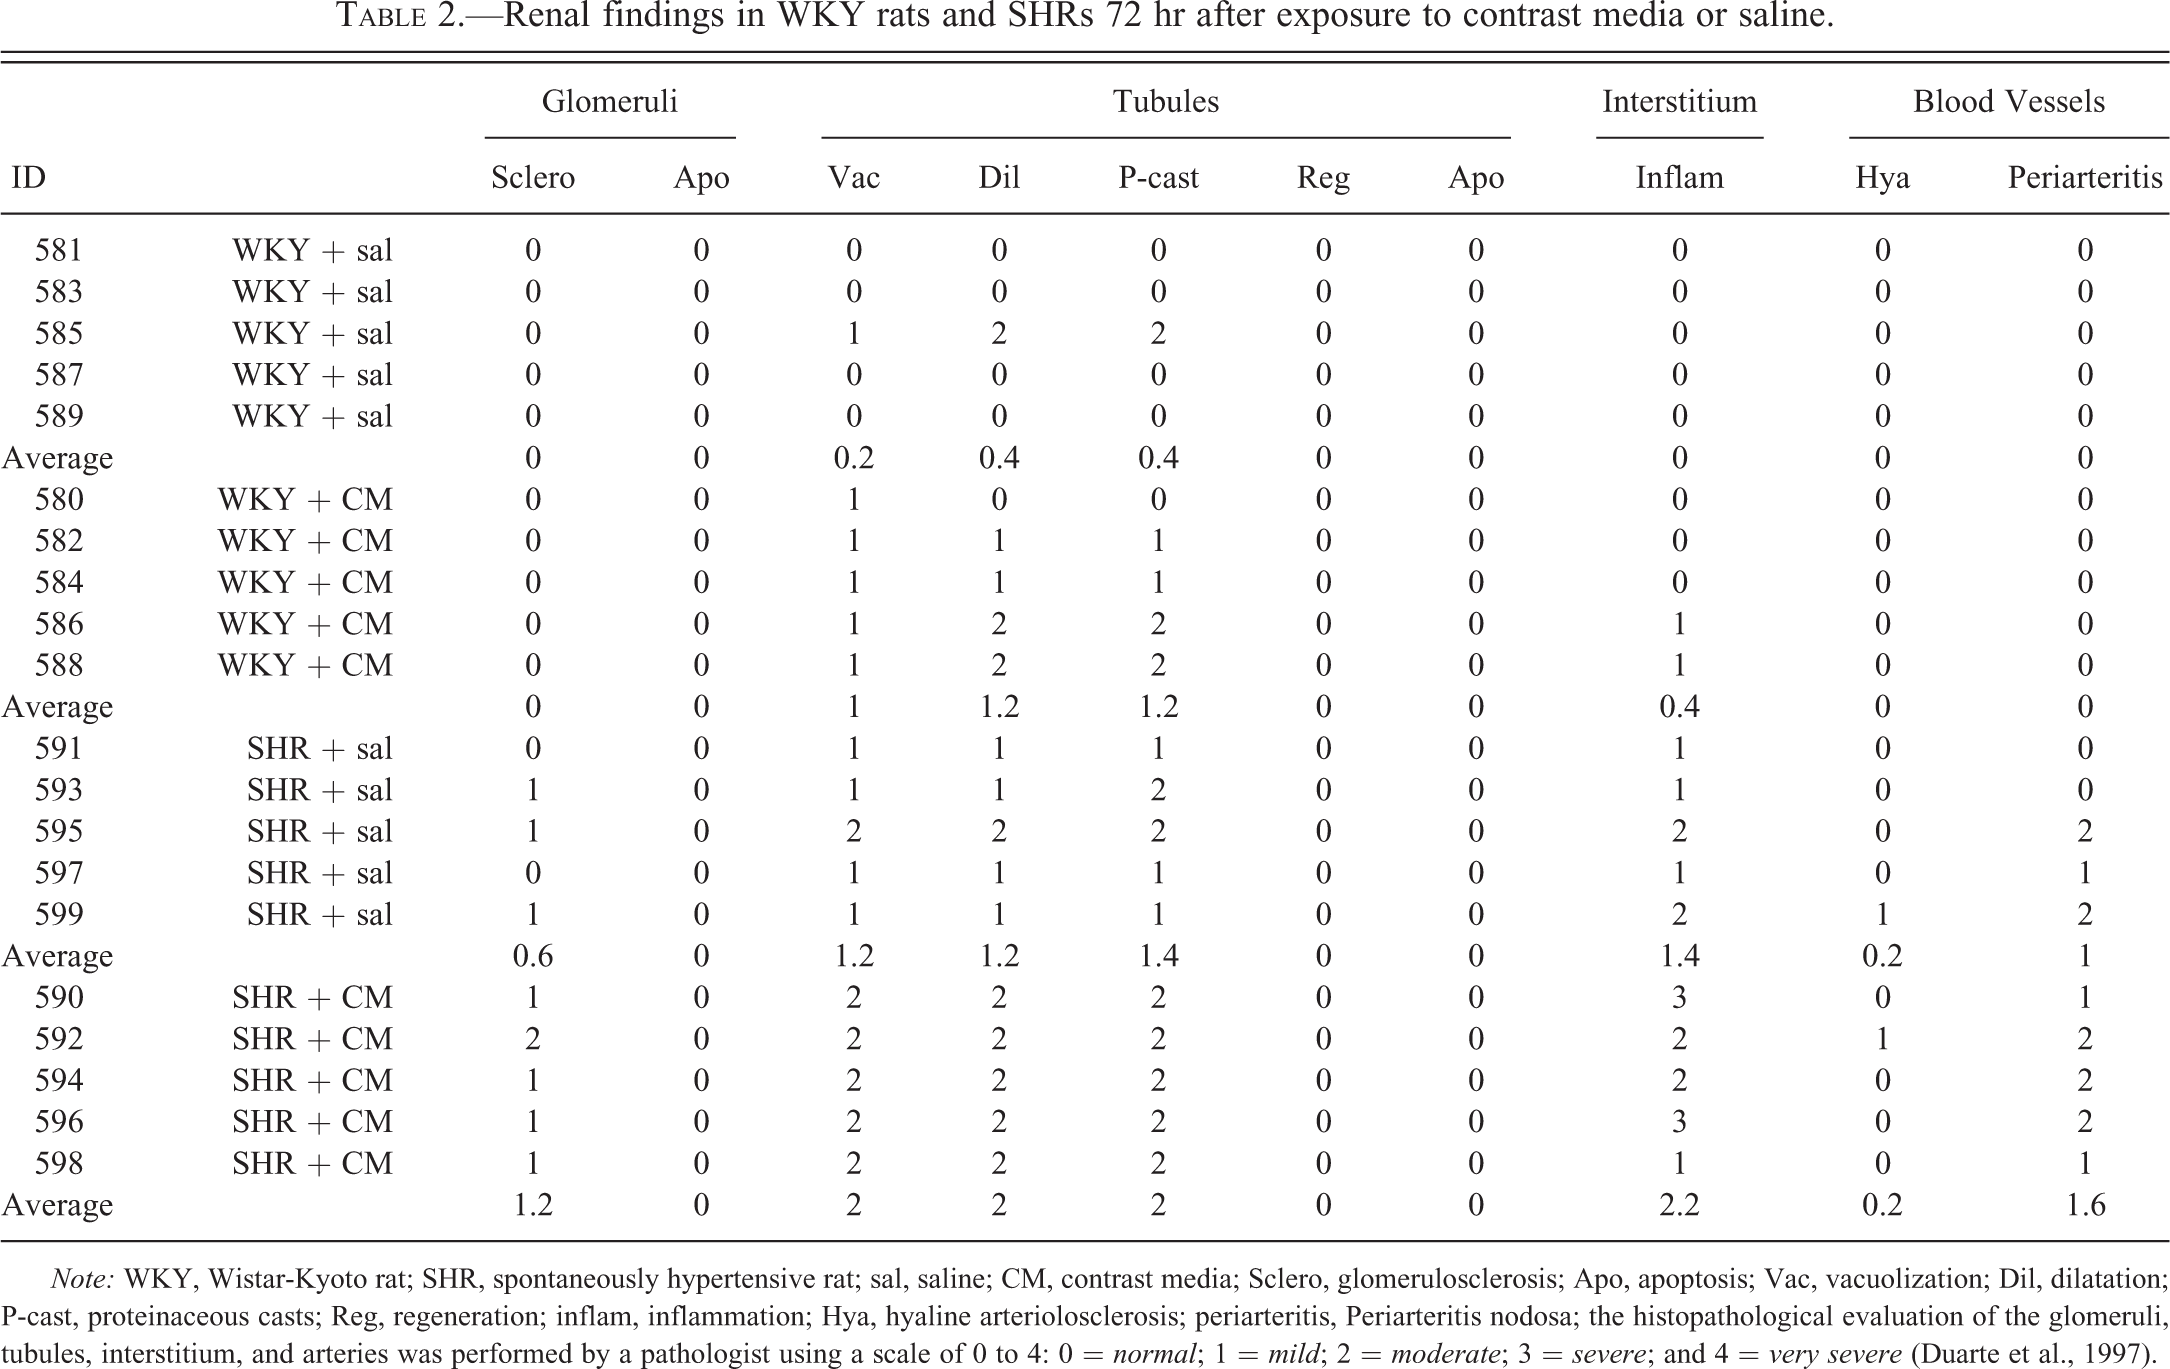
Note: WKY, Wistar-Kyoto rat; SHR, spontaneously hypertensive rat; sal, saline; CM, contrast media; Sclero, glomerulosclerosis; Apo, apoptosis; Vac, vacuolization; Dil, dilatation; P-cast, proteinaceous casts; Reg, regeneration; inflam, inflammation; Hya, hyaline arteriolosclerosis; periarteritis, Periarteritis nodosa; the histopathological evaluation of the glomeruli, tubules, interstitium, and arteries was performed by a pathologist using a scale of 0 to 4: 0 = normal; 1 = mild; 2 = moderate; 3 = severe; and 4 = very severe (Duarte et al., 1997).
SHR Model
With saline treatment, no significant changes were found in WKY rats (Figure 2A), but mild tubular degeneration (epithelial vacuolization and tubular dilatation) and glomerulosclerosis with interstitial inflammation and hyaline changes in arterioles (Figure 2B) were observed in SHRs. With CM treatment, WKY rats exhibited mild epithelial vacuolization (Figure 2C) and tubular dilatation in the proximal tubules, while SHRs showed moderate proximal tubular dilatation and epithelial vacuolization with epithelial cell necrosis in distal tubules (Figure 2D), glomerular segmental sclerosis (Figure 2E), early periarteritis nodosa (Figure 2F), and interstitial inflammation (Figure 2G) with pigmentation (Figure 2H). Table 2 presents the histopathology observations in these animals.
STZ-Induced Diabetic Sprague-Dawley Model
Since all nondiabetic rats received CM, tissues were not obtained from nondiabetic (normal) SD rats without CM. With CM administration, the majority of nondiabetic SD rats were found to have mild to moderate vacuolization in the proximal tubular epithelium (Figure 3A). Two of four nontreated diabetic SD rats presented lesions consistent with moderate diabetic glomerulosclerosis (Figure 3B), and all of them had mild to moderate tubular dilatation with proteinaceous casts (Figure 3C) and moderate vacuolization of epithelial cells in distal tubules (Figure 3D). CM-treated diabetic SD rats showed exacerbated (moderate to severe) glomerulosclerosis (Figures 3E andF), distal tubular dilatation, with proteinaceous casts, and epithelial cell vacuolization. In addition, epithelial vacuolization and dilatation were noted in the collecting ducts (Figure 3G) with occasional severe dilatation and proteinaceous casts within the renal medulla (Figure 3H). Table 3 summarizes the histopathology findings in diabetic and nondiabetic SD rats.
Comparison of model-associated kidney injury and contrast-induced acute kidney injury in nondiabetic and streptozotocin-induced diabetic Sprague-Dawley rats. A, Nondiabetic SD rat with CM treatment; mild degeneration (cytoplasmic vacuoles) of epithelial cells in the proximal tubules. B;D, Diabetic SD rats without CM treatment; (B) diabetic glomerulosclerosis presenting as global sclerosis of the affected glomerulus, increase in mesangial matrix, and partial obliteration of capillary tuft; (C) tubular dilatation of proximal tubules and proteinaceous casts; (D) moderate vacuolization of epithelial cells in the distal tubules. E–H, CM-treated diabetic SD rats; (E, F) diabetic glomerulosclerosis presenting as global sclerosis, marked decrease in the size of the affected glomuruli, and almost complete obliteration of capillary tuft; (G) exacerbated vacuolization of the distal tubules and tubular dilatation of the collecting ducts; (H) severe tubular dilatation of the collecting ducts and proteinaceous casts in the medulla. Hemotoxylin eosin (H&E) stain, ×630 for all figures.
Renal findings in diabetic and non-diabetic rats 72 hr after exposure to contrast media or saline.
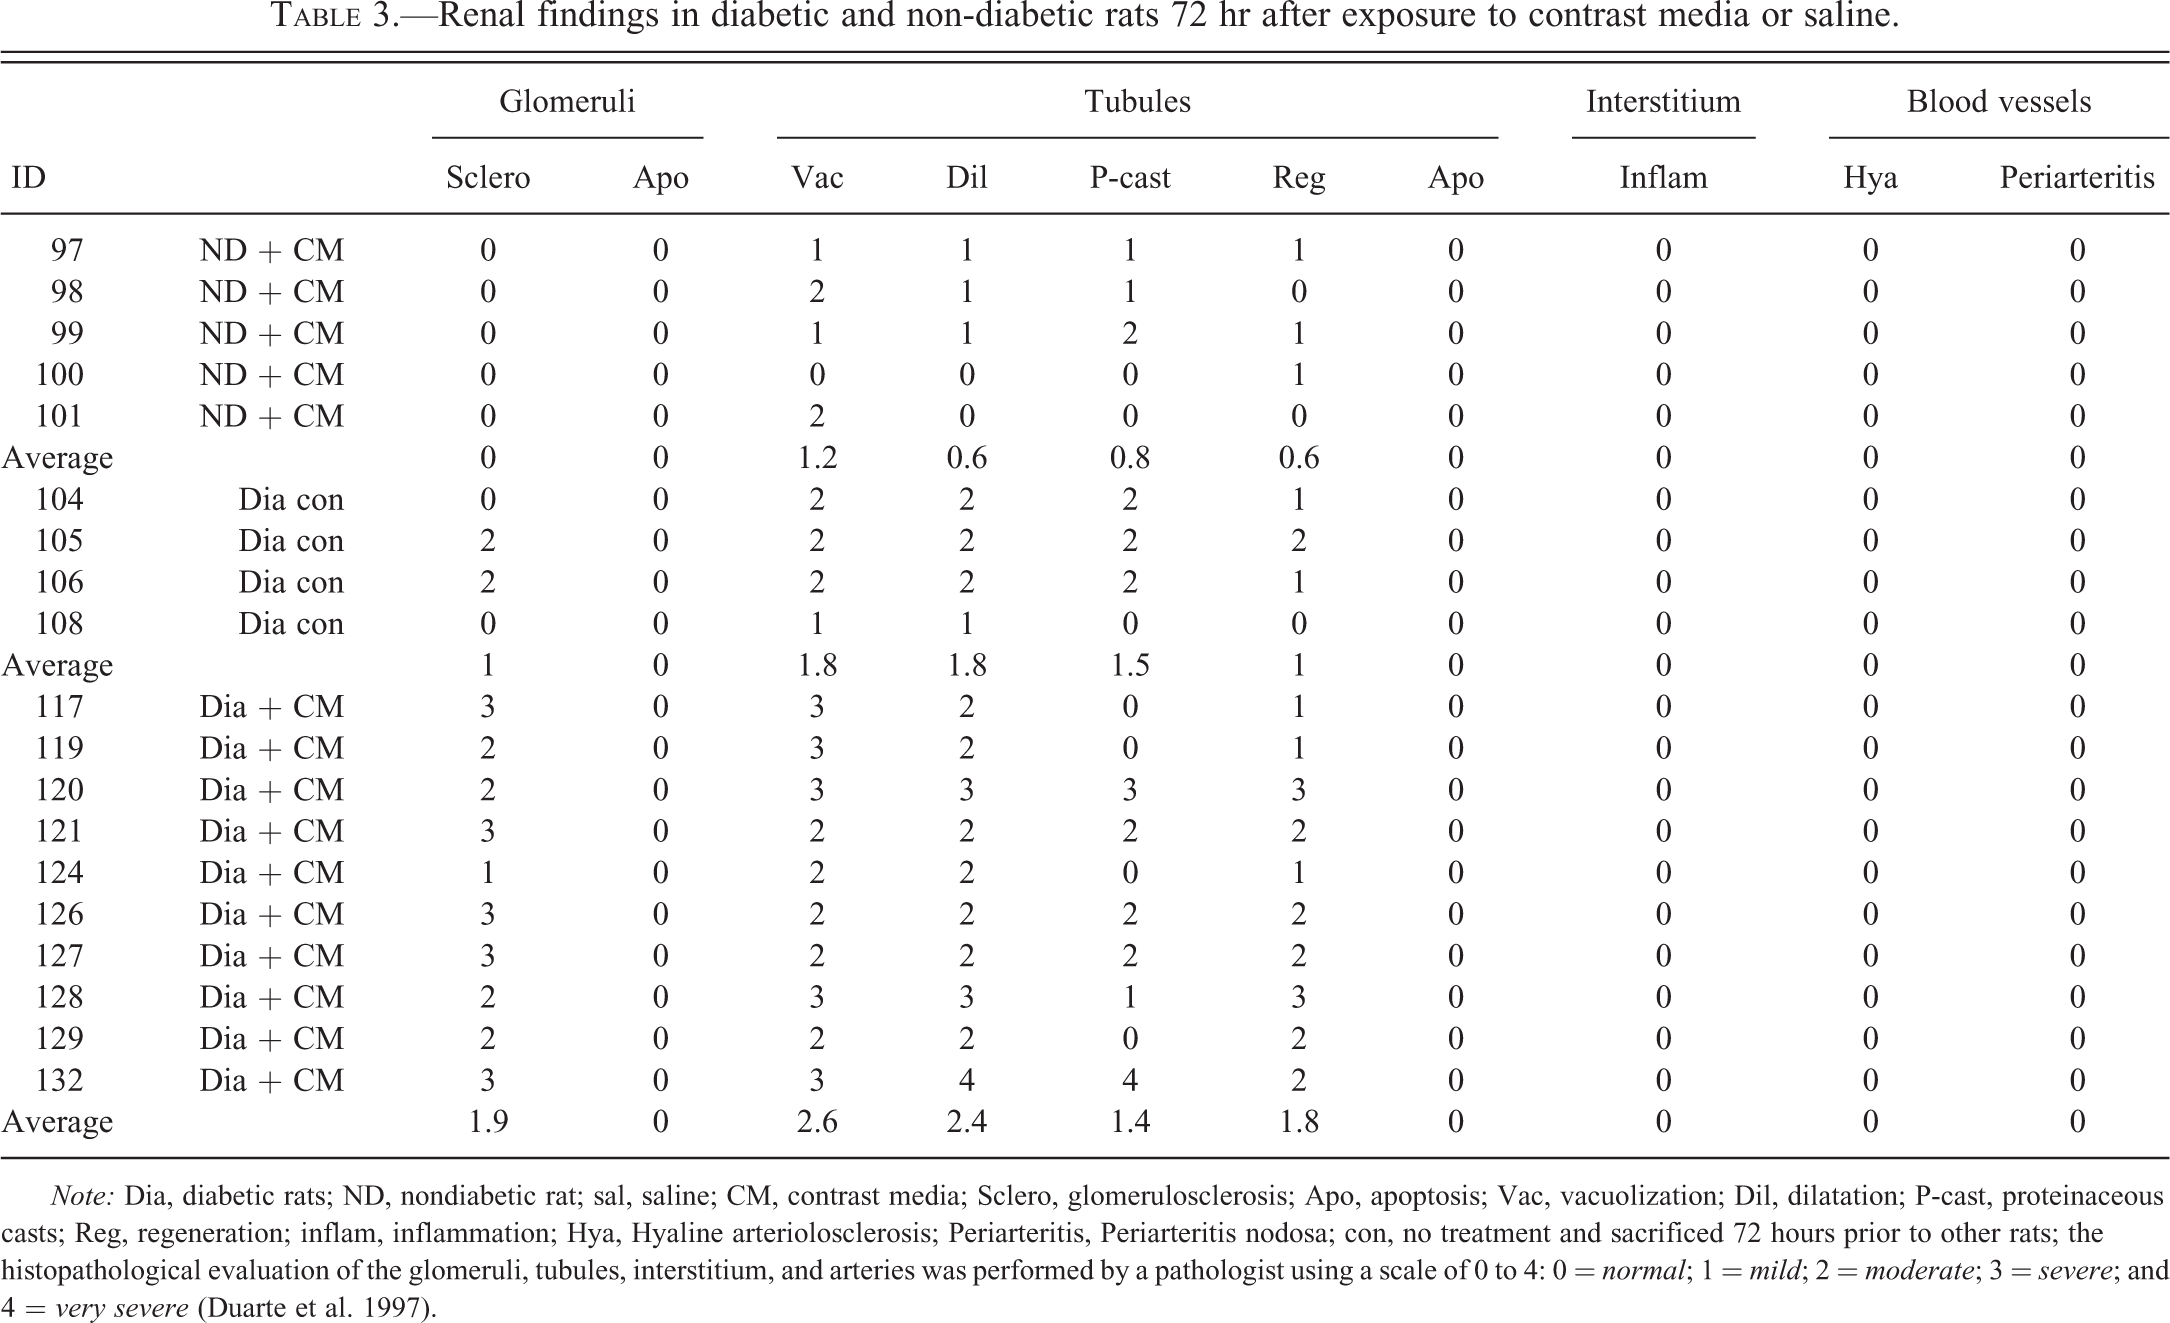
Note: Dia, diabetic rats; ND, nondiabetic rat; sal, saline; CM, contrast media; Sclero, glomerulosclerosis; Apo, apoptosis; Vac, vacuolization; Dil, dilatation; P-cast, proteinaceous casts; Reg, regeneration; inflam, inflammation; Hya, Hyaline arteriolosclerosis; Periarteritis, Periarteritis nodosa; con, no treatment and sacrificed 72 hours prior to other rats; the histopathological evaluation of the glomeruli, tubules, interstitium, and arteries was performed by a pathologist using a scale of 0 to 4: 0 = normal; 1 = mild; 2 = moderate; 3 = severe; and 4 = very severe (Duarte et al. 1997).
DSS Nephropathy Model
In Study A, DSR + CM rats demonstrated moderate to severe proximal tubular cell regeneration (Figure 4A), severe vacuolization of distal tubular cells (Figure 4B), distention of the distal tubules sufficient to form tubular cysts (Figure 4C), and vacuolization of collecting duct epithelium (Figure 4D). However, no significant glomerular, vascular, or interstitial changes were detected. In Study B, DSS + saline rats demonstrated severe interstitial infiltration with lymphocytes (Figure 4E). In both studies, DSS + CM rats exhibited very severe tubular changes, glomerulosclerosis (Figure 4F), periarteritis nodosa (Figure 4G), and severe epithelial cell apoptosis in distal tubules or thick ascending limb of the Loop of Henle (Figure 4H). DSS + saline and DSS + CM rats in Study B exhibited lesions similar to one another. However, mean severity scores for tubular protein casts, epithelial cell regeneration, and hyaline arteriosclerosis were significantly higher (p < .05) in DSS + CM rats compared to DSS + saline. Table 4 summarizes the histopathology findings in this model.
Serum and Urinary Biomarkers—Pre-CM Administration
SHR Model
Prior to treatment group assignment, BUN and urinary albumin, αGst, µGst, and β2m levels were significantly higher in SHRs (n = 10) compared to WKY (n = 10) rats (Table 5). Conversely, SHRs demonstrated a significantly lower baseline level of urinary Kim-1 compared to WKY rats. Model-related differences in BUN and urinary albumin and β2m persisted throughout the remainder of the study.
Renal findings in DSR and DSS rats 72 hr after exposure to contrast media or saline.
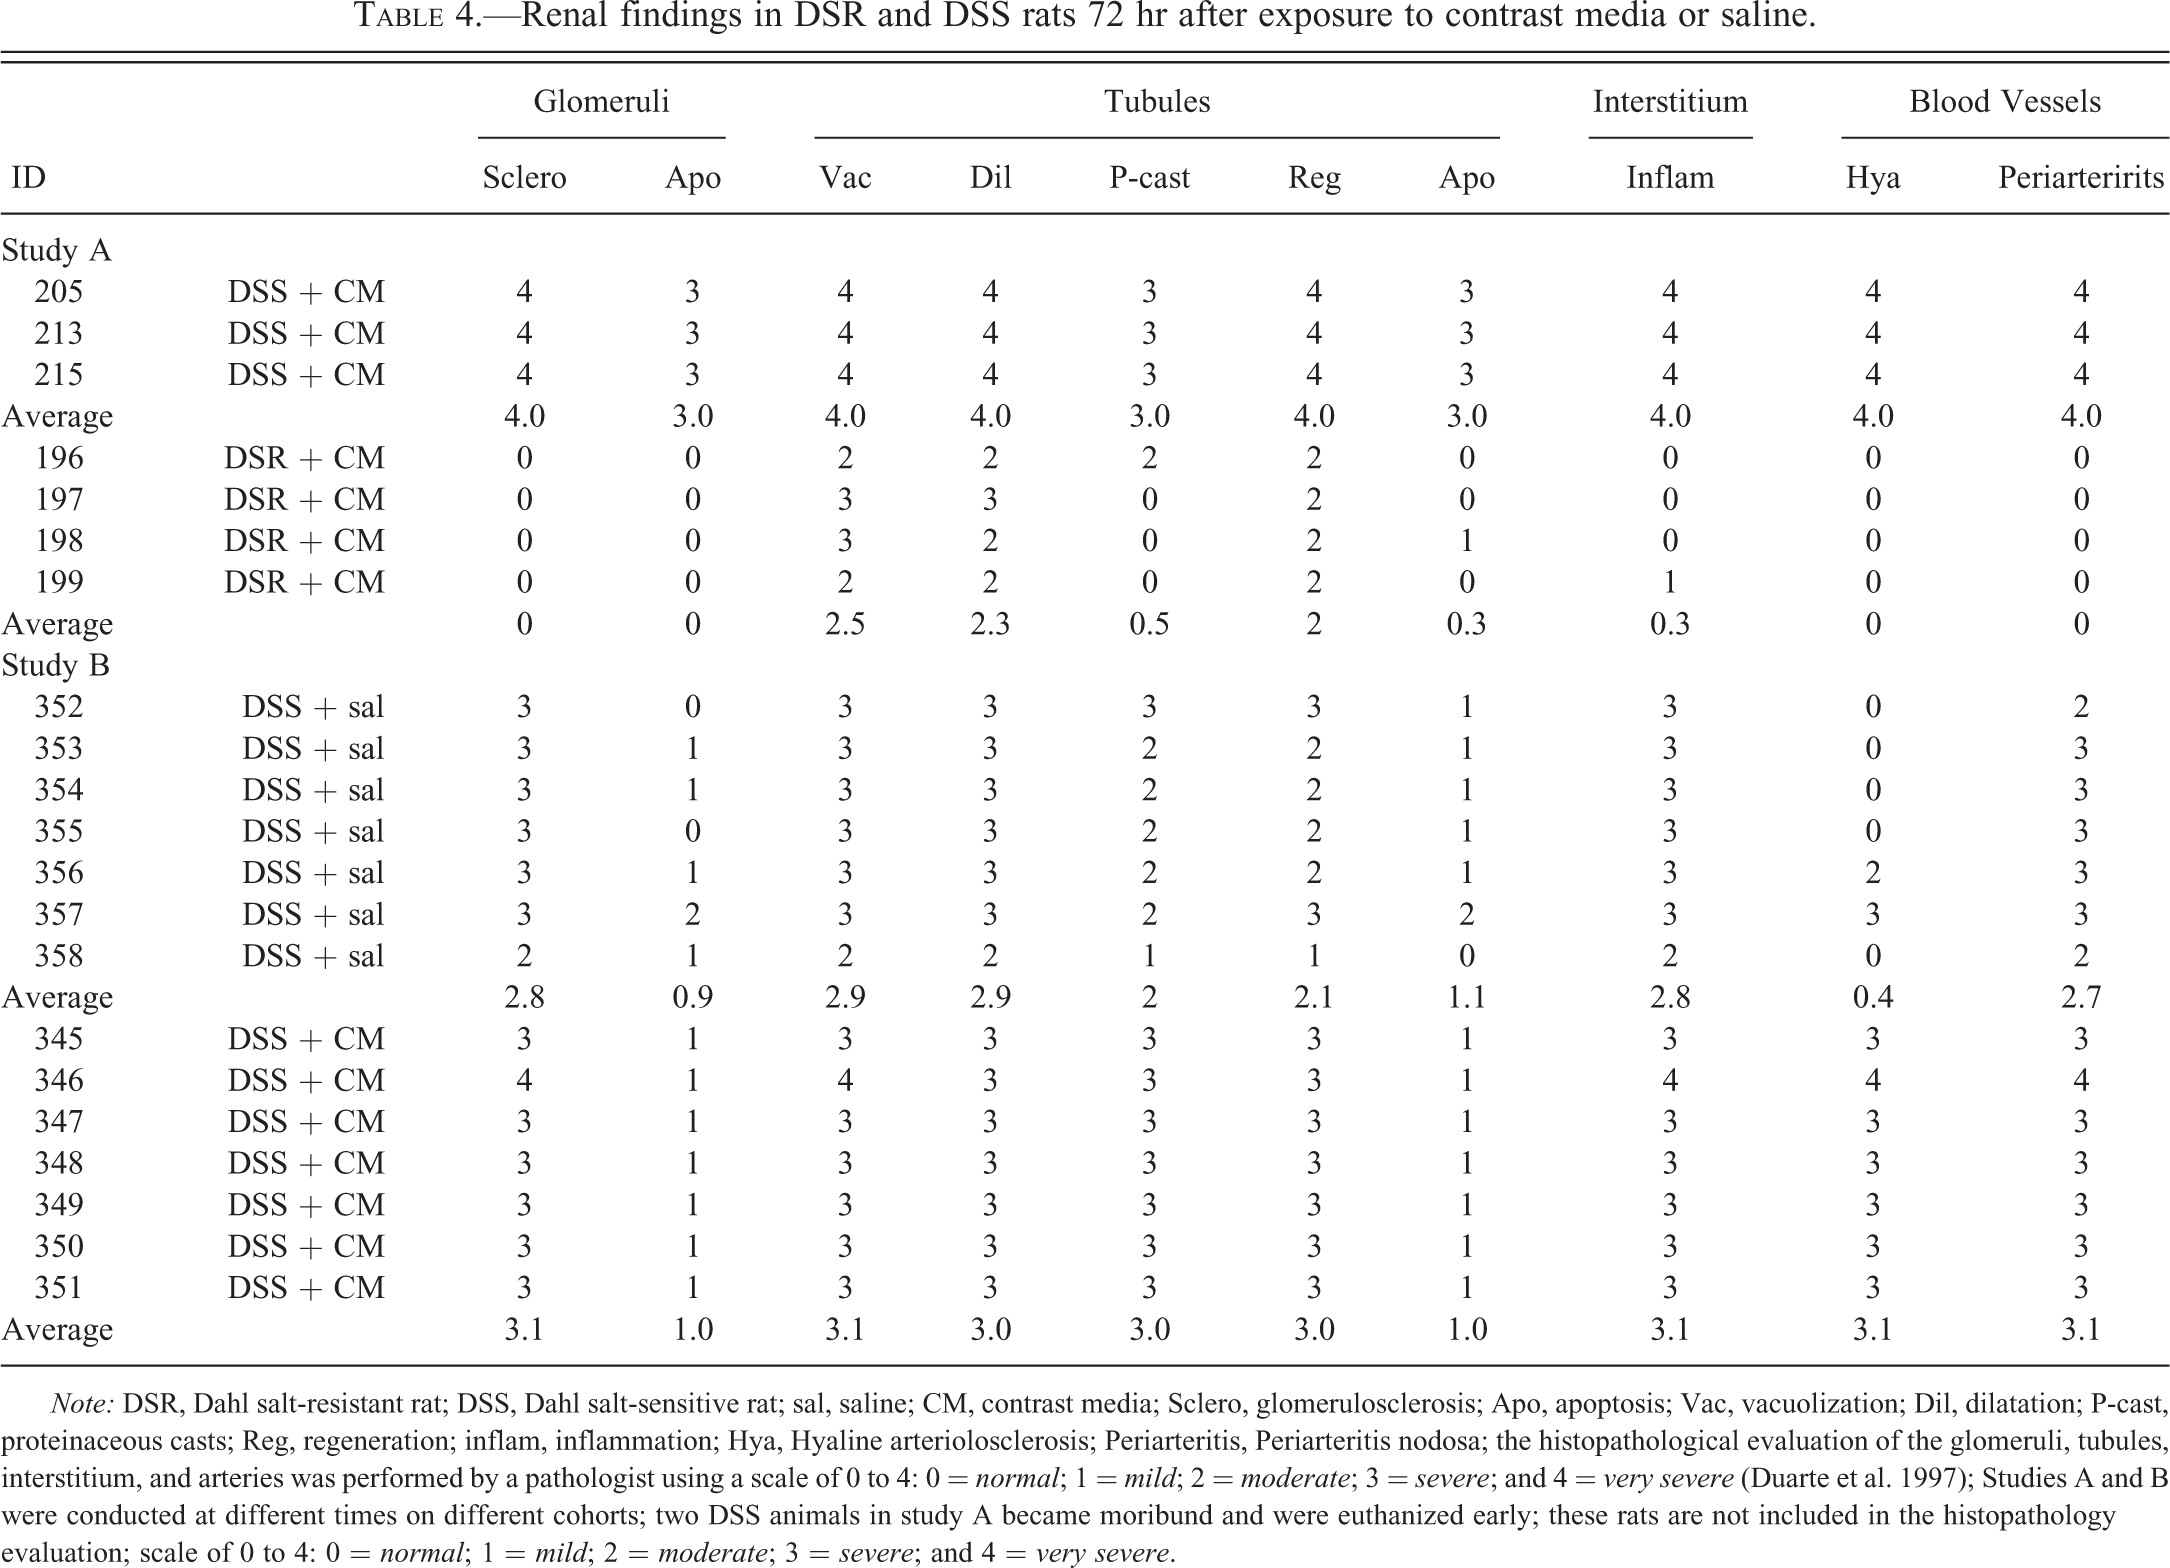
Note: DSR, Dahl salt-resistant rat; DSS, Dahl salt-sensitive rat; sal, saline; CM, contrast media; Sclero, glomerulosclerosis; Apo, apoptosis; Vac, vacuolization; Dil, dilatation; P-cast, proteinaceous casts; Reg, regeneration; inflam, inflammation; Hya, Hyaline arteriolosclerosis; Periarteritis, Periarteritis nodosa; the histopathological evaluation of the glomeruli, tubules, interstitium, and arteries was performed by a pathologist using a scale of 0 to 4: 0 = normal; 1 = mild; 2 = moderate; 3 = severe; and 4 = very severe (Duarte et al. 1997); Studies A and B were conducted at different times on different cohorts; two DSS animals in study A became moribund and were euthanized early; these rats are not included in the histopathology evaluation; scale of 0 to 4: 0 = normal; 1 = mild; 2 = moderate; 3 = severe; and 4 = very severe.
Precontrast media renal biomarkers in a hypertensive model.
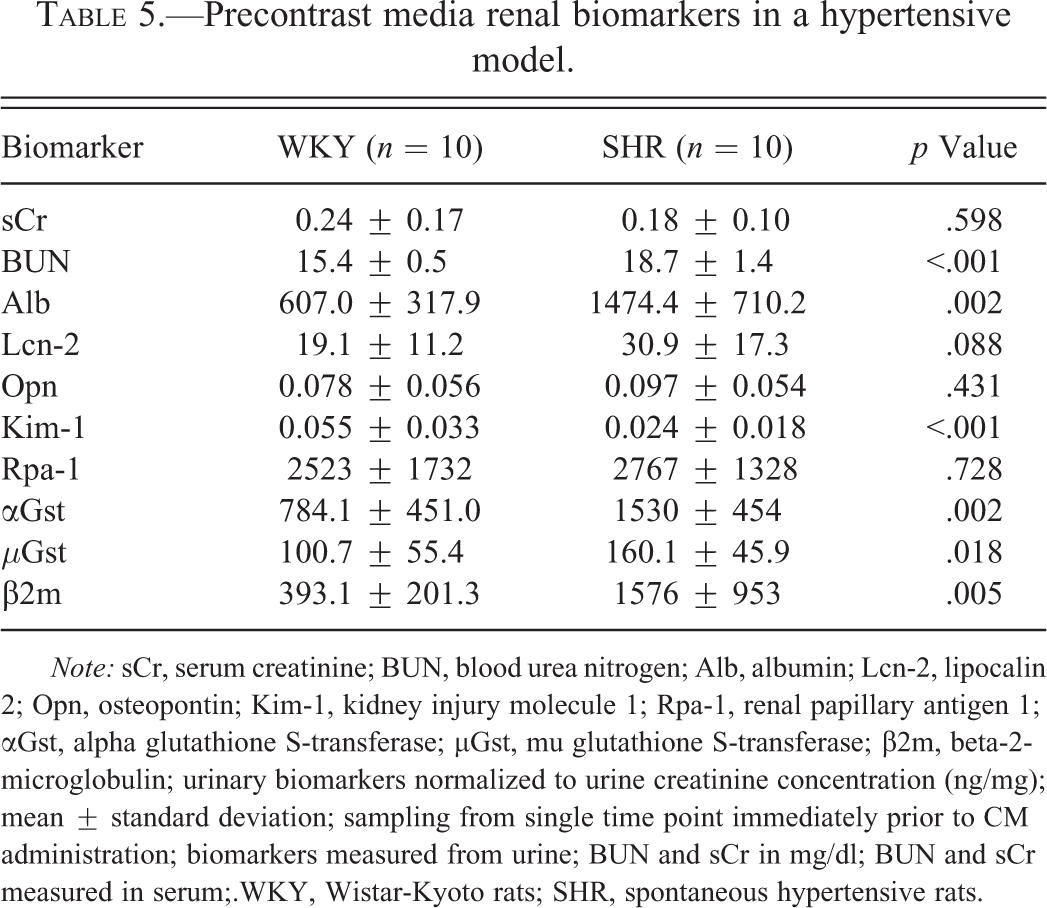
Note: sCr, serum creatinine; BUN, blood urea nitrogen; Alb, albumin; Lcn-2, lipocalin 2; Opn, osteopontin; Kim-1, kidney injury molecule 1; Rpa-1, renal papillary antigen 1; αGst, alpha glutathione S-transferase; µGst, mu glutathione S-transferase; β2m, beta-2-microglobulin; urinary biomarkers normalized to urine creatinine concentration (ng/mg); mean ± standard deviation; sampling from single time point immediately prior to CM administration; biomarkers measured from urine; BUN and sCr in mg/dl; BUN and sCr measured in serum;.WKY, Wistar-Kyoto rats; SHR, spontaneous hypertensive rats.
STZ-Induced Diabetic Sprague-Dawley Model
Prior to STZ treatment, SD rats were randomly grouped into treatment cohorts. Among these cohorts, there were no baseline differences in serum chemistries or urinary biomarkers of renal injury (data not shown). Following STZ treatment, serum chemistry revealed that diabetic rats (n = 14) had elevated alkaline phosphatase (1412.9 ± 313.8 vs. 250.3 ± 48.5; units/L; p < .001) and alanine aminotransferase (128.2 ± 54.4 vs. 55.9 ± 8.4; units/L; p < .05) compared to nondiabetic rats (n = 5). BUN and urinary levels of Lcn-2, Opn, αGst, µGst, and β2m were also increased in diabetic rats (Table 6). In contrast, sCr was significantly higher in nondiabetic rats.
Precontrast media renal biomarkers in a diabetic model.
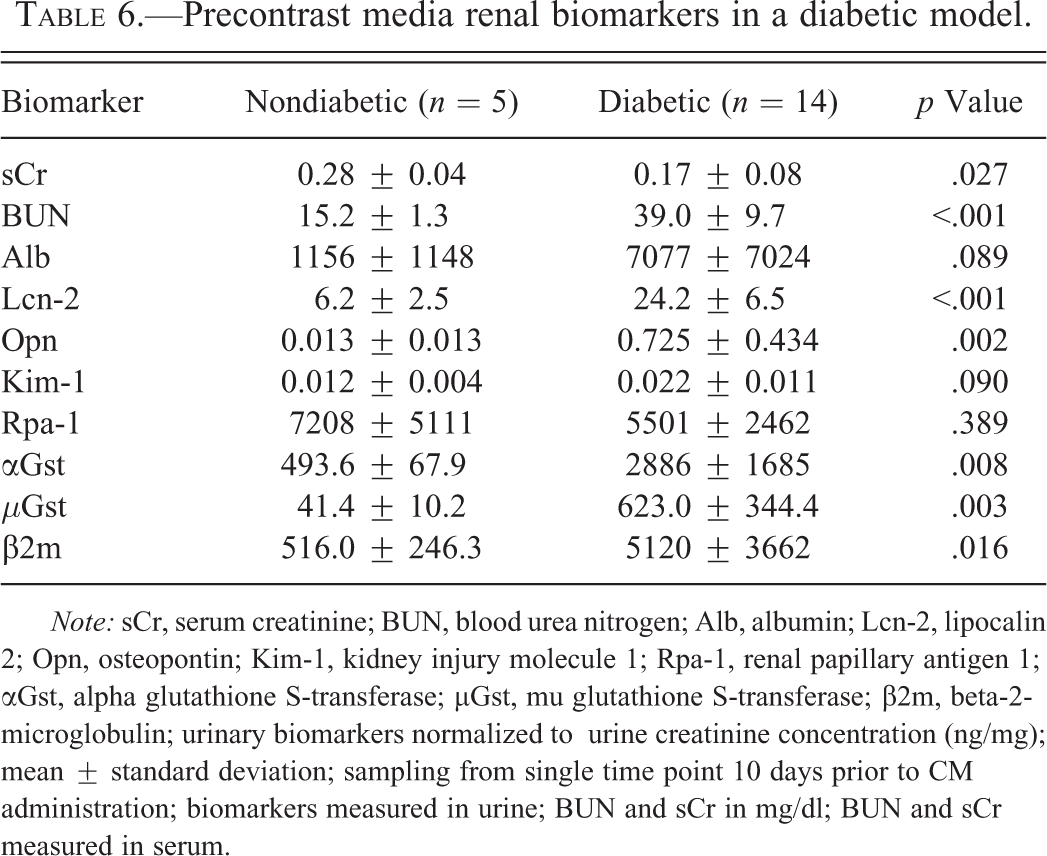
Note: sCr, serum creatinine; BUN, blood urea nitrogen; Alb, albumin; Lcn-2, lipocalin 2; Opn, osteopontin; Kim-1, kidney injury molecule 1; Rpa-1, renal papillary antigen 1; αGst, alpha glutathione S-transferase; µGst, mu glutathione S-transferase; β2m, beta-2-microglobulin; urinary biomarkers normalized to urine creatinine concentration (ng/mg); mean ± standard deviation; sampling from single time point 10 days prior to CM administration; biomarkers measured in urine; BUN and sCr in mg/dl; BUN and sCr measured in serum.
DSS Nephropathy Model
Values for serum biomarkers were not determined prior to starting the high-salt diet. Following the initiation of high-salt feeding but prior to CM administration, differences in serum biomarkers were limited to slight alkaline phosphatase elevations in DSR rats (n = 4) compared to DSS rats (n = 5; 375.8 ± 38.0 units/L vs. 214.9 ± 118.7 units/L, respectively; mean ± standard deviation; p < .001). This serum chemistry difference persisted throughout the study. Prior to feeding of the high-salt diet, there were no significant differences between DSR and DSS rats in the measured urinary biomarkers. After the high-salt diet was initiated, DSS animals developed significantly higher baseline levels of urinary albumin, Lcn-2, Opn, Kim-1, and β2m (Table 7). Thereafter, DSS rats maintained higher levels of these urinary biomarkers.
Precontrast media renal biomarkers in a nephropathy model.
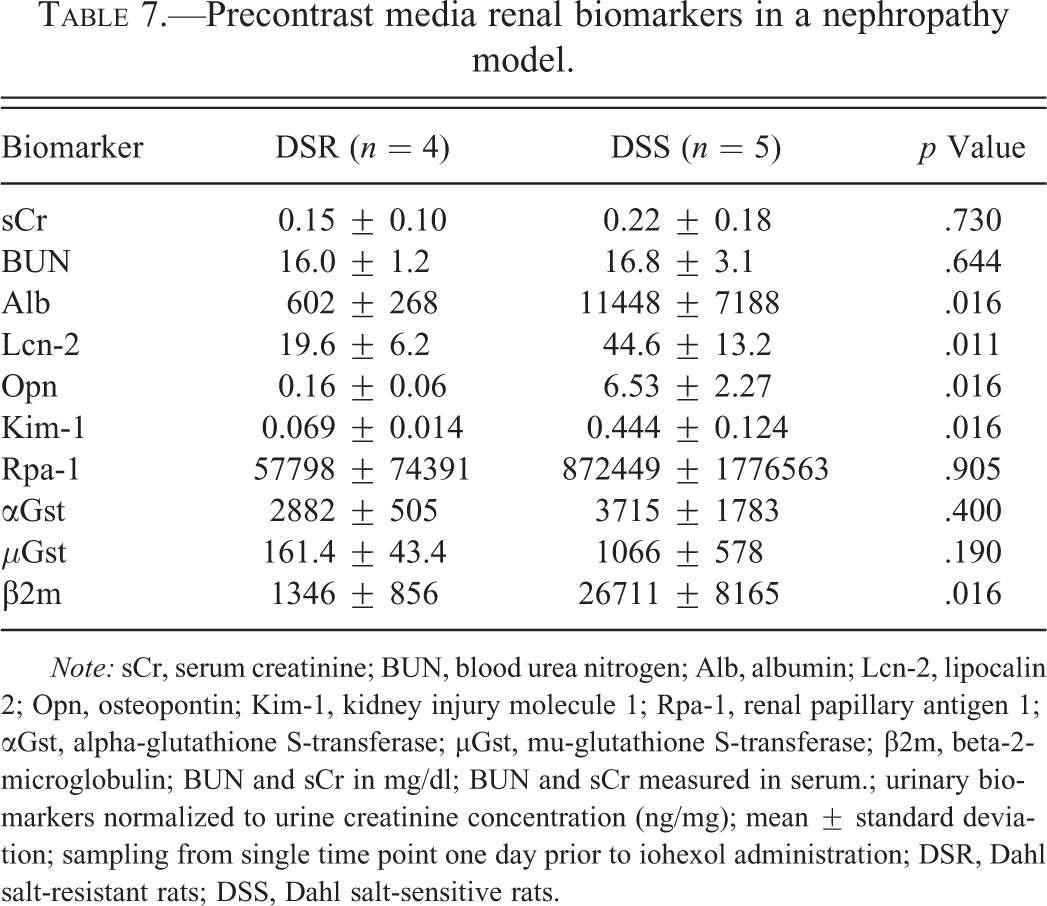
Note: sCr, serum creatinine; BUN, blood urea nitrogen; Alb, albumin; Lcn-2, lipocalin 2; Opn, osteopontin; Kim-1, kidney injury molecule 1; Rpa-1, renal papillary antigen 1; αGst, alpha-glutathione S-transferase; µGst, mu-glutathione S-transferase; β2m, beta-2-microglobulin; BUN and sCr in mg/dl; BUN and sCr measured in serum.; urinary biomarkers normalized to urine creatinine concentration (ng/mg); mean ± standard deviation; sampling from single time point one day prior to iohexol administration; DSR, Dahl salt-resistant rats; DSS, Dahl salt-sensitive rats.
Serum and Urinary Biomarkers—Post-CM Administration
An acute elevation in sCr is the accepted diagnostic hallmark of CIN. In the current study, some individual animals within all groups had elevations in their levels of sCr following CM administration, but no significant elevation in group mean was detected for any group (disease model or control).
SHR Model
In the hypertension model, four groups were evaluated: (1) WKY + saline; (2) WKY + CM; (3) SHR + saline; (4) SHR + CM. Throughout the experiment, SHRs had higher BUN levels than WKY rats but no significant differences were observed between strains or treatment groups for total protein, albumin, alkaline phosphatase, alanine aminotransferase, amylase, total bilirubin, calcium, phosphorus, glucose, sodium, potassium, globulins, and sCr (data not shown). No significant inter- or intrastrain changes in serum parameters were detected following administration of CM. No differences in any urinary biomarkers were observed between SHR + CM and SHR + saline saline, or between WKY + CM and WKY + saline (data not shown). Model-related differences in BUN, urinary albumin, and Kim-1 identified prior to CM were unaffected by subsequent CM exposure.
STZ-Induced Diabetic Sprague-Dawley Model
In this experiment, the following groups were examined: (1) nondiabetic SD rats receiving CM; (2) STZ-induced diabetic SD rats receiving CM. Differences in alkaline phosphatase and alanine aminotransferase between diabetic and nondiabetic rats observed prior to CM persisted following CM exposure. There was no significant change in sCr in either diabetic or nondiabetic rats following CM administration. The slight but significantly higher sCr observed in nondiabetic animals prior to CM exposure persisted following CM administration. Significant biomarker changes observed post-CM treatment are detailed in Table 8. In diabetic rats, BUN levels increased significantly 24 hr post-CM administration and Lcn-2 levels increased at 72 hr post-CM with a similar but nonsignificant trend in CM-treated nondiabetic rats. Significant decreases in µGst, Rpa-1, and β2m were observed in diabetic rats 72 hr following CM administration compared to their pre-CM levels and a similar nonsignificant trend was seen in αGst (p = .054). No additional biomarker increases were identified but the significantly higher levels of αGst and µGst identified in diabetic rats versus nondiabetic rats prior to CM were not observed after CM administration. Differences in BUN, Lcn-2, Opn, and β2m between diabetic and nondiabetic cohorts prior to CM were persistent without significant exacerbation or diminishment following CM exposure.
Postcontrast media renal biomarker changes in a diabetic model A. Increases following CM.
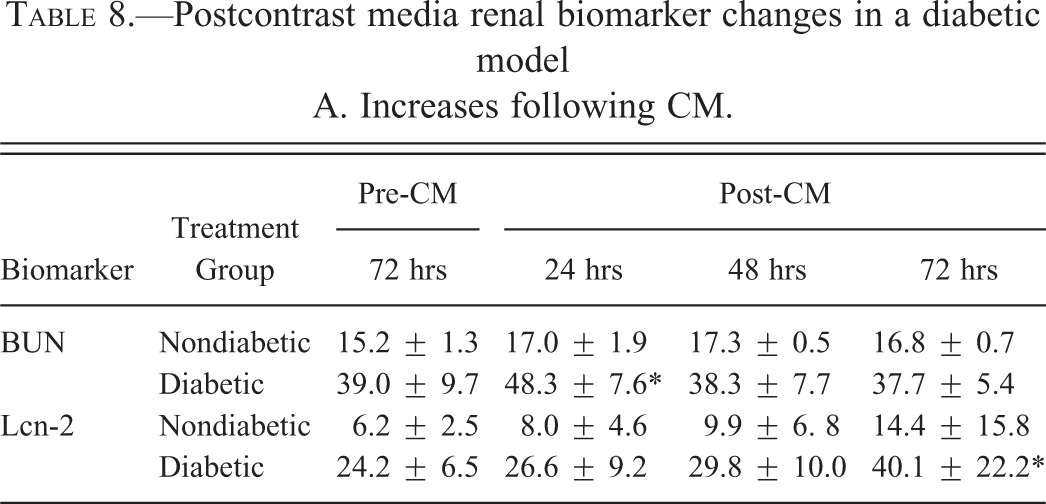
B. Decreases following CM.
Note: BUN, blood urea nitrogen; Lcn-2, lipocalin 2; BUN in mg/dl; αGst, alpha-glutathione S-transferase; µGst, mu-glutathione S-transferase; Rpa-1, renal papillary antigen 1; β2m, beta-2-microglobulin; normalized to urine creatinine concentration (ng/mg); CM, contrast media; mean ± standard deviation;; hr, hours either pre-CM or post-CM; diabetic n = 10 and non-diabetic n = 5.
*Indicates significant difference (p < .05) from pre-CM values.
DSS Nephropathy Model
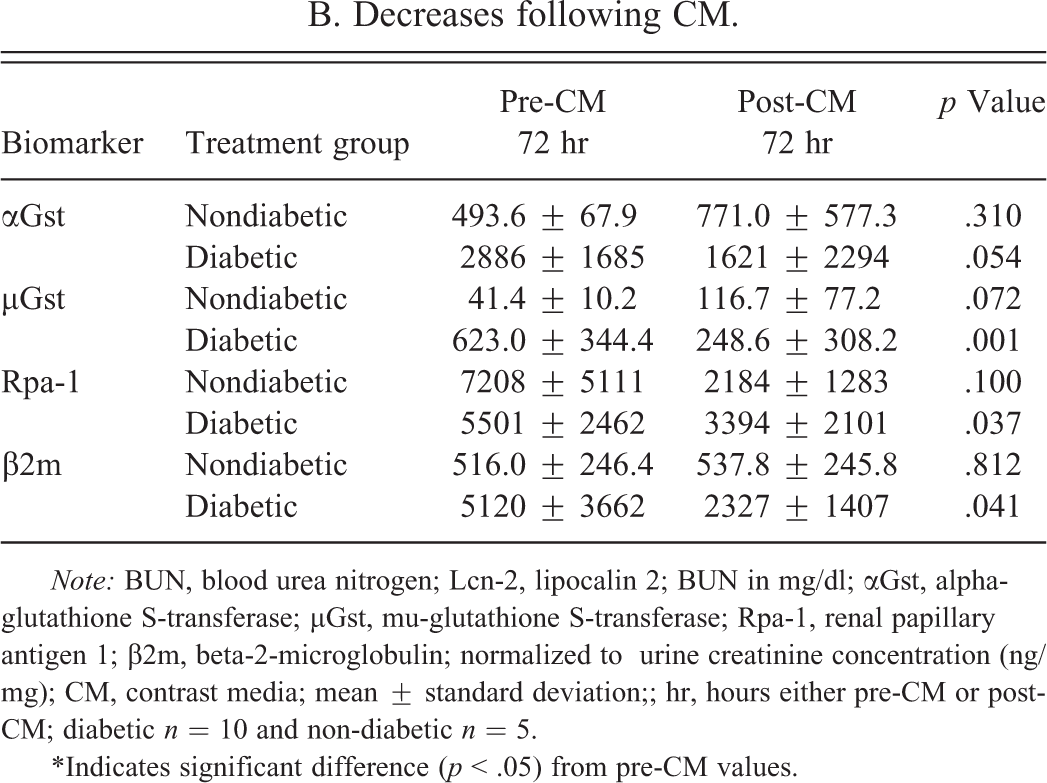
During nephropathy experiments, three groups were examined: (1) DSR + CM rats; (2) DSS + CM rats; and (3) DSS + saline rats. In one experiment (Study A), DSR and DSS rats were compared with one another before and after receiving CM. CM administration had no additional effect on serum alkaline phosphatase that remained significantly higher in DSR rats compared to DSS rats throughout the study (data not shown). Table 9 contains all the significant post-CM changes seen in this model. Urinary Lcn-2, Opn, Kim-1, and β-2m levels were unaffected by CM and remained higher in DSS rats throughout the study. Both αGst and µGst were significantly decreased in DSS + CM animals, resulting in a significantly lower level of these biomarkers in DSS + CM rats compared to DSR + CM rats. In a second experiment (Study B), DSS + CM rats were compared to DSS + saline rats. DSS + CM rats had no significant differences in any parameters when compared to DSS + saline rats.
Postcontrast media decreases in renal biomarkers in a nephropathy model.
Note: αGst, alpha-glutathione S-transferase; µGst, mu-glutathione S-transferase; normalized to urine creatinine concentration (ng/mg); mean ± standard deviation; CM, contrast media; DSR, Dahl salt-resistant rats; DSS, Dahl salt-sensitive rats; pre-CM sampling 7 days prior to CM administration; post-CM sampling 72 hours after CM administration; p value determined in paired t test; DSR n = 4 and DSS n = 5.
Disease Models, CM, and CIN
The correspondence between CIN and increases in urinary biomarkers was investigated across disease models in an ROC curve analysis (Figure 5A) of biomarker performance using a ≥1.5-fold change in sCr within 72 hr after CM administration as the criterion for true positives for CIN (Mehta et al. 2007). Among the biomarkers measured, absolute sCr concentration post-CM was the most predictive of CIN with an area under the curve (AUC) of 0.86. Albumin was not included in the analysis because it was detectable in only a very small subset of the total samples. However, in those animals with detectable albumin, an elevated albumin level was the superior urinary predictor of CIN (data not shown). None of the other biomarkers demonstrated a good correspondence to elevated sCr in response to CM.
Comparison of contrast-induced acute kidney injury in Dahl salt-resistant (DSR) and Dahl salt-sensitive (DSS) rats. A–D, CM-treated DSR rats; (A) moderate regeneration of tubular cells in the proximal tubules; (B) severe vacuolization of distal tubular cells in the cortex and marked tubular dilatation with multiple layers of vacuolated cells; (C) formation of tubular cyst due to marked distension of distal tubules and markedly vacuolated tubular cells; (D) vacuolization of epithelial cells in the collecting ducts. (E) DSS rat without CM treatment; severe interstitial infiltration with lymphocytes. F–H, DSS rats with CM treatment; (F) global sclerosis, severe thickening of Bowman’s capsule, remarkable increase in hyaline materials in Bowman’s space and mesangial matrix, and obliteration of capillary tuft; note: an apoptotic cell (cell shrinkage and nuclear condensation) within the glomerulus; wall of arteriole hyalinized and the lumen markedly narrowed; note: apoptotic bodies within the
Receiver–operating characteristic (ROC) curves demonstrating relative performance of biomarkers (A) predicting a fold-change in sCr ≥ 1.5 when contrast agent was administered; (B) predicting any histopathology; (C) predicting glomerular histopathology; (D) predicting tubular histopathology; BUN, blood urea nitrogen; sCr, serum creatinine; αGst, alpha-glutathione S-transferase; µGst, mu-glutathione S-transferase; Rpa-1, renal papillary antigen 1; β2m, beta-2-microglobulin; Lcn-2, lipocalin 2; Opn, osteopontin; Kim-1, kidney injury molecule 1.
ROC curves were also created with histopathology observations with and without CM as the determinant of true positives (histopathology changes present) and true negatives (histopathology changes absent) for kidney injury. Across all disease models and with any observed histopathology constituting a true positive (Figure 5B), Lcn-2 and β2m were the most reflective of histopathology with AUC of 0.90 and 0.89, respectively, followed by BUN (AUC = 0.83). The remaining biomarkers all performed above a random segregation (AUC = 0.50) ranging from 0.64 to 0.74. The only statistically significant difference in performance among biomarkers was between the top three and the bottom two (Rpa-1, Kim-1; p < .05). When true positives were defined only by histopathology changes in the glomerulus, the same three biomarkers (BUN, β2m, and Lcn-2) performed best (Figure 5C). All other biomarkers performed poorly with each having an AUC of 0.65 or less except for moderately performing Opn (0.75). BUN, β2m, and Lcn-2 each significantly (p < .05) outperformed all biomarkers except one another and Opn. Using histopathology observations in tubular epithelium as the determinant of true positives (Figure 5D), the performances of αGst, µGst, and Rpa-1 improved from their performances with glomerular injury as the determinant. BUN and β2m were still the best performers (with AUC of 0.90 and 0.86, respectively) and were significantly better than sCr, which was a poor predictor of tubular injury. Performance of the remaining markers was unchanged. ROC analyses conducted using interstitial inflammation and vascular injury as positive determinants indicated that none of the biomarkers accurately predicted these changes with AUC between 0.68 and 0.42 for all biomarkers in both analyses.
Biomarker performance was also evaluated by ROC analysis separately for each model. With CIN (≥50% sCr change from pre-CM) as the positive determinant, there was little difference in biomarker performance between the three models. Only the expected positive end point, absolute sCr concentration, significantly outperformed all other urinary biomarkers in each model. For the hypertensive and nephropathy models, BUN was the second best predictor of CIN and also significantly outperformed several of the urinary biomarkers. Although absolute sCr concentration post-CM was the top performer in the diabetic model, it was less predictive than in the other disease models and no other biomarker stood out as predictive of CIN in this disease model. Table 10 contains AUC values for all biomarkers using different determinants within each model.
Area under the curve (AUC) values for all models and all determinants.
Note: BUN, blood urea nitrogen; Alb, albumin; Lcn-2, lipocalin 2; Opn, osteopontin; Kim-1, kidney injury molecule 1; Rpa-1, renal papillary antigen 1; αGst, alpha-glutathione S-transferase; µGst, mu-glutathione S-transferase; β2m, beta-2-microglobulin.
a Indicates no positive cases by this determinant.
Discussion
Pathogenesis of CIN
The pathophysiology involved in the evolution of CIN is not completely understood but appears to be a complex interaction of CM osmolarity and the preexisting environment within individual components of the nephron. While CIN is expected in only a small proportion of the general population (1–2%), the risk for CIN is greatly increased in patients with preexisting cardiac disorders, diabetes-related renal insufficiency, and chronic kidney disease (Finn et al. 2006). Lesions ranging from mild vacuolization to acute necrosis of tubular epithelium have been attributed to CM administration and CM has been demonstrated to generally diminish renal perfusion, particularly in the outer medulla (Tumlin et al. 2006). Similar histopathology changes are described within the present study. Whether the tubular epithelial changes result from direct toxicity, hypoxia due to altered perfusion, or a combination thereof has not been determined.
Pathology-proven C-AKI in these rodent models has an important implication for understanding the pathogenesis of CIN and the role of risk factors. Many factors have been reported to influence CIN, such as hypertension, diabetes mellitus with renal impairment, high osmolarity of CM, advanced age, and nephrotoxic drugs (e.g., cyclosporine A, aminoglycoside, cisplatin, amphotericin, etc.). C-AKI in this study varied from mild tubular injury to severe global kidney lesions involving the glomeruli, tubules, interstitium, and blood vessels. The morphological differences in C-AKI were attributable to differences in the underlying kidney disease in each of the models. The degree of C-AKI increased with severity of the preexisting disease; the most severe being the salt-induced hypertension and protein-losing nephropathy in the DSS model and hypertension in the SHR model the least severe. This order of C-AKI was likely determined by the relative severity of the underlying conditions and the physical characteristics of the CM.
Biomarker Monitoring
Without CM administration, varying degrees of tubular cell and glomerular injury were present in all of the disease models. These kidney injuries provided sound reasoning to search for urinary biomarkers of tubular injury (Vaidya, Ferguson, and Bonventre 2008; Zhou et al. 2008), collecting duct injury (Zhang et al. 2008), decreased glomerular filtration rate (GFR; Sirota, Klawitter, and Edelstein 2011), and inflammation (Aigner et al. 2007; Wang et al. 2007) in rats with preexisting disease subjected to CM treatment. The expectation that CM administration might influence biomarker release is not unreasonable. However, the location, direction, degree, and consistency of this effect across underlying diseases have not been characterized.
The rodent disease models chosen for this study were intended to represent to varying degrees the clinical conditions predisposing patients to CIN. In this study, each of the models exhibited baseline elevations in one or more urinary biomarkers that correlated with preexisting kidney injury identified in the corresponding model. Urinary biomarker elevations in these disease models were not as prominent for the specific proximal tubule biomarker, Kim-1 (Ichimura et al. 2004; Prozialeck et al. 2007; Rached et al. 2008; Sieber et al. 2009; Zhou et al. 2008), as for the less specific biomarkers, Lcn-2 and Opn, that have both been associated with inflammation in multiple organs and in multiple locations within the nephron (Aigner et al. 2007; Bu et al. 2006; Kuwabara et al. 2009; Lebkowska et al. 2009; Makris et al. 2009; Malyszko et al. 2009; Persy et al. 1999; Sieber et al. 2009; Vaidya, Ferguson, and Bonventre 2008; Wang et al. 2008; Wang et al. 2007; Xie et al. 2001). Findings of severe periarteritis nodosa in the kidneys of DSS and SHRs as well as in the livers of DSS models should encourage researchers to evaluate the relationship between biomarkers of vascular injury (Zhang, Hanig, and De Felice 2012) and CIN.
Correlation between Baseline Biomarkers and Preexisting Kidney Injury
The elevated BUN and urinary albumin, αGst, µGst, and β2m noted in SHRs but absent in WKY rats were largely attributed to early glomerulosclerosis, tubular dilatation, protein casts, and epithelial vacuolization seen in SHRs. In support of this interpretation, urinary αGst and µGst have previously shown promise as proximal and distal tubular leakage markers for AKI (Seabra et al. 2011). Mild inflammatory changes in the liver were consistently described in all examined SHRs and WKY rats, regardless of CM treatment status. The persistent lower level of Kim-1 in SHRs relative to WKY rats was assumed to be a strain difference. Levels of Kim-1 for both strains were well within the normal range seen in previous experiments and the difference was not presumed to be related to injury.
Prior to CM, diabetic SD rats had significant elevations in serum alkaline phosphatase, alanine aminotransferase, and BUN relative to nondiabetic SD rats. Conversely, sCr was significantly higher in nondiabetic rats although the difference was considered clinically nonrelevant. Dehydration due to the extreme diuretic effect of hyperglycemia likely contributed to BUN elevations in diabetic SD rats. Diabetic SD rats had an approximate doubling of urine volume and demonstrated skin tenting despite a commensurate profound increase in water intake. Some of the observed biomarker differences (particularly sCr) between diabetic and nondiabetic rats may have been influenced by hydration status, renal perfusion, and renal hypertension or hypotension. Increased alkaline phosphatase and alanine aminotransferase activities were most likely secondary to diabetic hepatopathy. In the present study, no histopathology changes sufficient to cause these serum enzyme elevations were observed in the livers of diabetic rats that did not receive CM. A subset (30%) of CM-treated diabetic rats exhibited severe to very severe liver injury that was consistent with previously reported progressive STZ hepatotoxicity (Zafar et al. 2009a). Interestingly, hepatotoxicity did not correlate with any of the observed differences in serum or urinary biomarkers.
Prior to CM, the urinary kidney injury markers, Lcn-2, Opn, αGst, µGst, and β2m were elevated in diabetic rats relative to nondiabetic rats. These elevations likely reflect a global injury to the kidney (Persy et al. 1999) as described in the histopathology evaluations of untreated diabetic rats compared to untreated nondiabetic rats in the present study (glomerulosclerosis, proximal, and distal tubule vacuolization). Neither urinary Kim-1 nor albumin was significantly different in diabetic versus nondiabetic rats. Elevated urinary albumin, as would be expected with the glomerular injury described in diabetic nephropathy (Newman et al. 2005), was not observed. Kim-1 has been shown to be a very sensitive indicator of proximal tubular epithelial injury (Ichimura et al. 2004; Prozialeck et al. 2007; Rached et al. 2008; Sieber et al. 2009; Zhou et al. 2008). Baseline levels of Kim-1 were not significantly elevated in diabetic animals although early glycogenic vacuolization of proximal convoluted tubular epithelium related to uncontrolled glucosuria was described in this and previous studies (Maeda et al. 2003; von Eynatten et al. 2010). A previous study examined the progressive nephrotoxicity associated with STZ administration and concluded that changes were largely caused by the diabetic condition created by the STZ (Zafar et al. 2009b). Lesions in that study were consistent with progressive diabetic glomerulosclerosis and tubular epithelial degeneration advancing to necrosis. In the present study, examination of data from individual animals revealed considerable interanimal variability and some remarkable elevations in these biomarkers in individual animals. Individual resistance to diabetic complications and individual ability to compensate may account for the majority of the variability in the data. If progression of diabetic nephropathy is driven by glomerular injury with tubular damage being secondary, allowing further disease development may have helped elevate biomarker levels and minimize variability in this data.
DSS rats, once started on high-salt feed, had elevations in urinary albumin, Kim-1, Lcn-2, Opn, and β2m when compared to DSR rats (Table 7). When compared to pre–high-salt diet, a three- to fivefold increase in urine volume was observed in DSS and DSR rats when they were placed on a high-salt diet, although clinical signs and clinical chemistry findings did not suggest dehydration. Significant differences between DSS and DSR rats in renal perfusion and/or renal tension could have contributed to renal injury and, therefore, biomarker elevation in the DSS rats. These biomarker elevations correlated well with the more severe, pre-CM, histopathology-described, kidney injury (severe glomerulosclerosis, periarteritis nodosa, proximal cell regeneration, and inflammation as well as severe vacuolization of proximal tubules and hyaline arteriosclerosis) in DSS rats relative to DSR rats. DSS rats receiving CM had similar but more severe lesions than DSS rats not receiving CM. Elevations in these urinary biomarkers associated with diffuse kidney injury affecting all segments of the nephron have been described previously (Nagae et al. 2009; Zhang et al. 2000).
Clinically, CIN is defined by a decline in kidney function that is most frequently identified by an acute increase in sCr within 72 hours of CM administration. A high baseline sCr, indicating a preexisting decrease in kidney function, might be expected to impact the response and/or the ability to measure the response to CM administration. In this study, no elevated sCr concentrations were detected in the disease models before their exposure to CM. Different results and conclusions may have been forthcoming had the disease models been allowed to progress to renal insufficiency.
Correlation between CM-Related Changes in Biomarkers and in Kidney Injury
Across all models, the only significant increases in any of the assayed biomarkers following CM administration were transient increases in BUN and elevations in Lcn-2 in diabetic rats and increases in BUN in DSS rats. With CM administration, a subset (20–40%) of individuals within each of these models developed marked liver injury, but liver injury did not correlate with either kidney injury or biomarker changes. In addition, a similar increase in BUN occurred in DSS animals that did not receive CM, suggesting that progression of the underlying nephropathy may have also contributed to the increased BUN in CM-treated rats. Across all models, CM exposure exacerbated preexisting histopathology-defined kidney injury. However, this exacerbation was generally not associated with significant increases in urinary biomarker levels. Had preexisting kidney disease been more advanced, significant increases in biomarker expression may or may not have been more evident.
Interestingly, following CM administration, decreases in αGst and µGst were observed in all disease models. There is no clear explanation for why these decreases occurred although a similar response was previously reported for αGst and µGst (Harpur et al. 2011) in NPAA-treated rats that incurred collecting duct injury without proximal tubular cell injury (Betton et al. ;2012). Several models in the present study showed remarkable collecting duct injury and minimal proximal tubular injury, particularly the CM-treated diabetic model. Reduced glomerular filtration rate, increased renal vascular resistance, and decreased renal perfusion have been linked to CM administration (Thomsen and Morcos 2003). In the DSS model, this CM effect may be reflected in the significantly decreased urine volumes following CM administration. Similar decreases were not seen in all models given CM. However, in addition to CM exposure, these decreases may be a function of preexisting injury that was also most pronounced in the DSS model. These changes may also account completely or in part for the post-CM change in Gst levels as well as changes observed in other urinary biomarkers. The prominent sign of tubular injury within the models was degeneration and/or regeneration of epithelial cells and not acute tubular necrosis. Unlike the severe acute tubular necrosis in rats treated with gentamicin, mercury, or chromium (Zhang et al. 2008), this minimal injury might result in little or no Gst enzyme leakage, supporting a prerenal source for the original elevated Gst levels in urine that may have subsequently decreased with diminished renal perfusion. The general lack of acute tubular necrosis may also account for the low levels of Kim-1 detected across the majority of models within this study.
Biomarker Performance
The lack of sensitivity and specificity of sCr as a biomarker for kidney injury has spurred the investigation of new renal injury biomarkers including those in this study. Change in sCr is the currently accepted diagnostic criterion for CIN and increases of as little as 25% following CM administration have been considered significant by some investigators (Finn 2006). In the present study, sCr was used to benchmark the response of the urinary biomarkers to CM administration. To evaluate the predictivity of a biomarker for CIN, true positives were defined by elevations of 1.5-fold or greater in sCr levels within 72 hr following CM administration. This definition was used as the determinant in an ROC analysis for prediction of CIN. As might be expected, sCr concentration was the biomarker that was most predictive of CIN in this ROC analysis. Although this appears to be a circular argument, the biomarker under evaluation is the absolute level of a single measurement sCr and the determinant of CIN positive or negative is the degree of change in sCr after CM administration. A correlation no doubt exists between the positives and level of sCr because higher creatinine values are much more likely to represent a higher relative increase in sCr. However, this was not the case across all samples. Some animals started with higher creatinine values that decreased after CM administration (high value ≠ not positive) and some values increased 50% or more post-CM but were initially so low that the result was still a low value (low value = positive). This finding is also descriptive of the clinical environment. To date, a better diagnostic for CIN than sCr has not been identified.
BUN also performed well in the hypertension and hypertension/nephropathy models but did not predict CIN in the diabetic model. When detected, albumin was the urinary biomarker that gave the largest AUC for prediction of CIN but was not significantly better than BUN. In the ROC analysis and individual animal data, sCr changes did not correlate well with urinary biomarkers in these models. None of the other urinary biomarkers were predictive for CIN.
ROC analyses constructed around histopathology changes (including both disease model and CM-related changes) resulted in a very different interpretation of urinary biomarker performance. Across all models, β2m and Lcn-2 were the superior predictors of kidney histopathology although the functional biomarker, BUN, was also a good performer. Lesions within different areas of the nephron (glomerulus, tubules, interstitium, vasculature) were used as the positive determinant in separate ROC analyses. Glomerular injury was well predicted by BUN, Lcn-2, and β2m. Lower AUC was obtained for all biomarkers when tubular injury was used as the positive determinant. No significant results were returned with either interstitial injury or vascular injury as the positive determinant in the ROC. The best performance (highest AUC) and greatest difference in performance between biomarkers in the ROC analyses were observed for the end point of glomerular injury. β2m, Lcn-2, and BUN were the best predictors of glomerular injury, with β2m uniformly being the most sensitive. β2m levels in urine can be increased by impairment of tubular uptake, which can result from direct injury to tubules or when glomerular alterations cause leakage of high-molecular-weight proteins into the urine which compete with tubular uptake of β2m (Dieterle et al. 2010). For prediction of tubular injury, there was less difference in performance between most of the urinary biomarkers. Consistent with a previous report on gentamicin-induced AKI (Rouse et al. 2011), sCr was the poorest biomarker for prediction of tubular injury.
Biomarker performance was also analyzed within each model for each determinant. Since all models are included in calculating the overall biomarker relationships, it is not surprising that the relationships described by all models are generally reflected in each of the individual models. However, within each model specific deviations were observed. Often the top performer was the same in each model but better performance was observed in one model relative to the others. These data support combinations of biomarkers as being potentially predictive of injury location as well as severity.
The models used in this study had hypertension, diabetes, and/or nephropathy. These models were not maintained for a sufficient period of time to observe the progress from kidney injury to functional impairment. Although after CM administration changes were noted in sCr and BUN that were consistent with some prior definitions of CIN, BUN values never exceeded 60 mg/dl and sCr values remained below 1.0 mg/dl. Had marked functional impairment been reached, there may have been more of an observed effect on biomarkers prior to and following CM administration. Design of experiments that better segregate injury as glomerular, tubular, vascular, and so on would help to define biomarker profiles that are more reflective of injury location. The lack of tissues from nondiabetic rats without CM exposure had minimal impact on the data since nondiabetic rats with CM administration had only minimal tubular degeneration. However, the lack of tissues from DSR rats without CM treatment impairs interpretation of results in CM-treated DSR rats that had severe global changes in the kidney. Similar changes were seen in DSS rats both with and without CM. Although DSR exhibited no clinical signs, the lack of proper control tissues leave undetermined whether the severe kidney injury observed was strain related or a response to CM.
Conclusions
Each disease model of a risk factor for CIN produced some elevated serum and/or urinary biomarkers of kidney injury. CM exposure created no detectable histopathology changes specific to the exposure but exacerbated preexisting injury. There were little or no significant increases in serum and urinary biomarker levels following CM administration. Several urinary biomarkers suggestive of kidney injury actually decreased following CM treatment. In cases of mild to very severe kidney injury without significant functional impairment, CM did not increase biomarkers of kidney injury. Data were consistent with the suggestion that CIN is likely due to a direct effect of CM on kidney perfusion and glomerular filtration.
Footnotes
Acknowledgments
This work was supported by the Division of Drug Safety Research [operating budget], Office of Testing and Research, Office of Pharmaceutical Science, Center for Drug Evaluation and Research, U.S. Food and Drug Administration. The authors would like to acknowledge P. Scott Pine for his assistance in creating relevant figures from the complex data sets.
The author(s) declared no potential conflicts of interest with respect to the research, authorship, and/or publication of this article.
The author(s) received no financial support for the research, authorship, and/or publication of this article.