
Abstract
Alanine aminotransferase (ALT) is used as an indicator of hepatocellular injury. Since ALT consists of two isoenzymes, a better understanding of ALT isoenzyme biology in response to compounds that cause metabolic adaptive versus hepatotoxic responses will allow for a more accurate assessment of the significance of an ALT increase. The purpose of this study was to characterize the ALT isoenzyme response in mice treated with 25 or 75 mg/kg of dexamethasone, which is known to induce a progluconeogenic state, for 24 or 72 hr. Those mice treated with 75 mg/kg for 72 hr showed an increase in total liver ALT activity. Western blot showed that there was an increase in ALT2 at both doses and time points and there was a concurrent increase in ALT2 ribonucleic acid at 24 and 72 hr. The ALT isoenzyme response assessed by an activity assay showed an increase in ALT2. The increases in liver ALT were associated with an increase in liver glycogen and there was no hepatocellular necrosis. There was an increase in total serum ALT activity, although serum isoenzymes were not evaluated. Thus, the authors demonstrated that dexamethasone induced increases in hepatic and serum ALT, which reflect a hepatocellular progluconeogenic metabolic adaptive response.
Introduction
Alanine aminotransferase (ALT) has historically been used as a marker of hepatotoxicity in routine preclinical safety assessment studies. The kinetics of the release of ALT associated with classic hepatotoxicants and the characteristic histological changes are well documented (Giffen et al. 2002; O'Brien et al. 2002). This historical knowledge has been used to help assess the potential hepatotoxic risks when novel compounds are administered to people. Those compounds that are hepatotoxicants should be identified during routine preclinical safety assessment, and typically unless there is an acceptable therapeutic index, these drugs are not developed further since changes that occur in the preclinical species can often predict what will occur in people (Olson et al. 2000).
ALT also plays a significant role in gluconeogenesis and amino acid metabolism and thus is not just a marker of cellular injury. Liver ALT will increase in response to dietary protein, during fasting, and in diabetic animals (Rosen, Roberts, and Nichol 1959). This suggests some ALT elevations may reflect a metabolic adaptive response and not necessarily indicate hepatocellular injury and thus should not be considered adverse.
The different forms of ALT have not been considered in trying to determine the cause of the elevations; instead, the standard total activity–based assay has been utilized. It has been shown using classic biochemical techniques that there are at least two different isoenzymes of ALT (Swick, Barnstein, and Stange 1965). It was estimated based on cellular fractionation by differential centrifugation that 4 to 20% of the ALT enzyme was mitochondrial in origin (Kafer and Pollak 1961; Katunuma et al. 1962; Swick, Barnstein, and Stange 1965). This mitochondrial form has been designated ALT2, while the main isoenzyme present in the cytosol is referred to as ALT1 (Jadhao et al. 2004; Yang et al. 2002). Until recently, there have been limited tools to measure and better understand how these enzymes respond to hepatotoxic insults and adapt to different metabolic states. Both isoenzymes play an important role in gluconeogenesis and amino acid metabolism. They catalyze the reaction of 2-oxogluturate and alanine to pyruvate and
We demonstrated that both ALT1 and ALT2 are elevated in acetaminophen-induced hepatoxicity (Yang et al. 2009), and in this current study, we attempted to test the hypothesis that these enzymes might be induced as a part of a metabolic adaptive response and contribute to an increase in serum ALT activity. Dexamethasone is known to have both gluconeogenic and glycogenic properties (Vanstapel et al. 1982). It induces certain enzymes associated with intermediary metabolism including ALT (Hagopian, Ramsey, and Weindruch 2003), and particularly the mitochondrial form of ALT (Swick, Barnstein, and Stange 1965), and thus it provides a good tool to assess the ALT isoenzyme response to a progluconeogenic response. The purpose of this study was to investigate the hepatic ALT response in mice treated with dexamethasone for 1 to 3 days to determine how the different isoforms of ALT respond using new tools to detect ALT1 and ALT2 protein expression, mRNA, and activity.
Material and Methods
Animals
Thirty C57/BL6 mice (7-week-old, Charles River, Wilmington, DE) were randomly assigned into six different groups (n = 5/group). Mice received intraperitoneal injections of corn oil only, 25 mg/kg or 75 mg/kg of dexamethasone (Sigma-Aldrich, St Louis, MO) dissolved in corn oil, for a single injection or daily for three injections. Mice that received a single injection were fasted overnight and then sacrificed 24 hr after the single dose. The remaining animals received three daily doses, were fasted overnight, and were sacrificed at 72 hr. Blood was collected by cardiac venipuncture at the time of sacrifice, serum was separated using standard techniques and frozen at −80°C prior to analysis. After collecting blood, part of the liver was frozen in liquid nitrogen for Western analysis, activity assays, and ribonucleic acid (RNA) extraction, and the rest of the tissue was formalin fixed for routine histopathological examination. Tissues were processed to slides using standard techniques. Slides were stained with hematoxylin and eosin and selected slides were stained with periodic acid-Schiff (PAS) stain. All animal procedures were approved by the University of Maryland Animal Care and Use Committee.
Preparation of Liver Homogenates for Glycogen and ALT Activity Assays
Liver tissue was homogenized using a Qiagen Tissue Lyzer (Qiagen, Valencia, CA). Approximately, 200 mg of flash-frozen tissue was placed in a 2-ml vial on wet ice with 1 ml of cold phosphate buffered saline (PBS) with 12.5% glycerol and homogenized for 90 sec at 30 cycles per second. The homogenate was centrifuged, the supernatant removed, aliquoted, and stored at −80°C.
ALT Activity, Total Protein Assays, and Clinical Chemistry Parameters
Serum and liver ALT activity, liver homogenate total protein concentrations, aspartate aminotransferase (AST), or alkaline phosphatase (ALP) were measured using a Roche/Hitachi 917 chemistry analyzer and Roche reagents (Roche Diagnostics Corp., Indianapolis, IN). Glutamate dehydrogenase (GLDH) was measured using a Roche/Hitachi 917 chemistry analyzer using Randox reagents (Randox Laboratories, Kearneysville, WV).
ALT Isoenzyme Antibodies
Polyclonal antibodies were generated in rabbits against recombinant rat ALT1 (rALT1) and rat ALT2 (rALT2) proteins using routine immunization techniques (AbboMax, San Jose, CA). The antisera were processed using both antigen-based depletion and absorption protocols to increase specificity. Briefly, 5 mg of rat ALT recombinant protein was covalently immobilized to CNBr-activated Sepharose 4B resin according to the manufacturer’s instruction (GE Healthcare, Piscataway, NJ). To obtain rALT1-specific antibody, 1 ml of rALT1 antiserum was diluted 1× in Tris buffered saline and was first passed through rALT2-affinity column to deplete rALT2 cross-reactivity. The flow-through fraction was then loaded on a rALT1-affinity column. After washing with 15 ml 1×Tris buffered saline, rALT1-specific antibody was obtained by eluting the ALT1-affinity column-absorbed antibody with 2 ml of glycine buffer (pH 2.7) into a tube containing 0.2 ml of 1 M Tris–HCl buffer (pH 8.0). A similar procedure was used to purify rALT2-specific antibody. Specificity of these antibodies in mice and rats have been previously shown (Yang et al. 2009).
Western Blot Assay
Frozen liver tissues were minced and then homogenized using a Dounce homogenizer in NP40 lysis buffer containing 0.5% NP40, 50 mM Tris–HCl (pH 7.5), and 150 mM NaCl. Lysate supernatants were collected after centrifugation at 3000g for 10 min. Protein lysate, 20 ug, was loaded per lane and was electrophoresed on 7.5% polyacrylamide gels. Following electrophoresis, proteins were transferred onto polyvinylidene difluoride membranes, probed with primary ALT antibody, and developed with electrochemiluminescence. The concentration of the ALT proteins was determined by measuring the density of the Western blot signals by FluorChem (Cell Biosciences, Santa Clara, CA). β-actin (anti-β-actin, Sigma-Aldrich, St. Louis, MO) was used as a loading control to ensure similar quantities of protein were loaded in each lane.
RNA Analysis
RNA was extracted from frozen liver tissues of five mice from each group treated with vehicle, dexamethasone 25 mg/kg/day or 75 mg/kg/day for 1 or 3 days by Trizol and RNeasy column purification (Qiagen, Valencia, CA). Reverse transcription (RT) was done (Promega, Madison, WI) using 1 µg RNA in 10 µl reaction. Real-time polymerase chain reaction (PCR) was performed on Roche Lightcycler 480 (Roche Molecular Diagnostics, Pleasanton, CA) using ABI gene expression assay primer and probe set for mouse Gpt1 (Mm00805377_g1), Gpt2 (Mm00558020_m1), and β actin (Mm00607939_s1) in a 10 µl reaction containing 0.5 µl of above cDNA. Relative gene expression changes compared to control group were calculated using 2−ΔΔCT method.
ALT1 and ALT2 Activity Based Assay
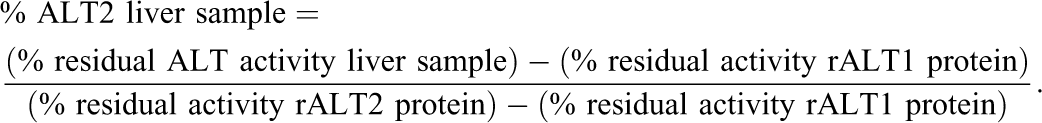
Liver ALT isoenzyme activities were determined based on the differential inhibition of the isoenzymes by
Liver Glycogen Assay
Glycogen was measured in liver homogenates using the method described by Passonneau and Lauderdale (1974). Briefly, liver homogenate samples plus assay calibrators, rabbit liver, type III glycogen (Sigma-Aldrich, St. Louis, MO) were precipitated using 0.3M perchloric acid. Tissue polysaccharides (primarily glycogen) were digested using amyloglucosidase (Sigma-Aldrich) in 50 mM NaAcetate, 0.02% bovine serum albumin, pH 5.5. Increases in glucose concentration measured over baseline levels, using a routine hexokinase assay on the Roche/Hitachi 917 chemistry analyzer (Roche Diagnostics Corp., Indianapolis, IN), were used to calculate tissue glycogen content.
Statistics
Statistical analyses to compare the differences in total ALT and ALT isoenzyme activity, protein and gene expression levels between groups were performed with unpaired two-sided Student t test. p values of ≤ .05 were considered statistically significant. Correlation coefficients were also determined to assess the relationship of ALT isoenzymes as assessed by the activity versus by Western blot assays.
Results
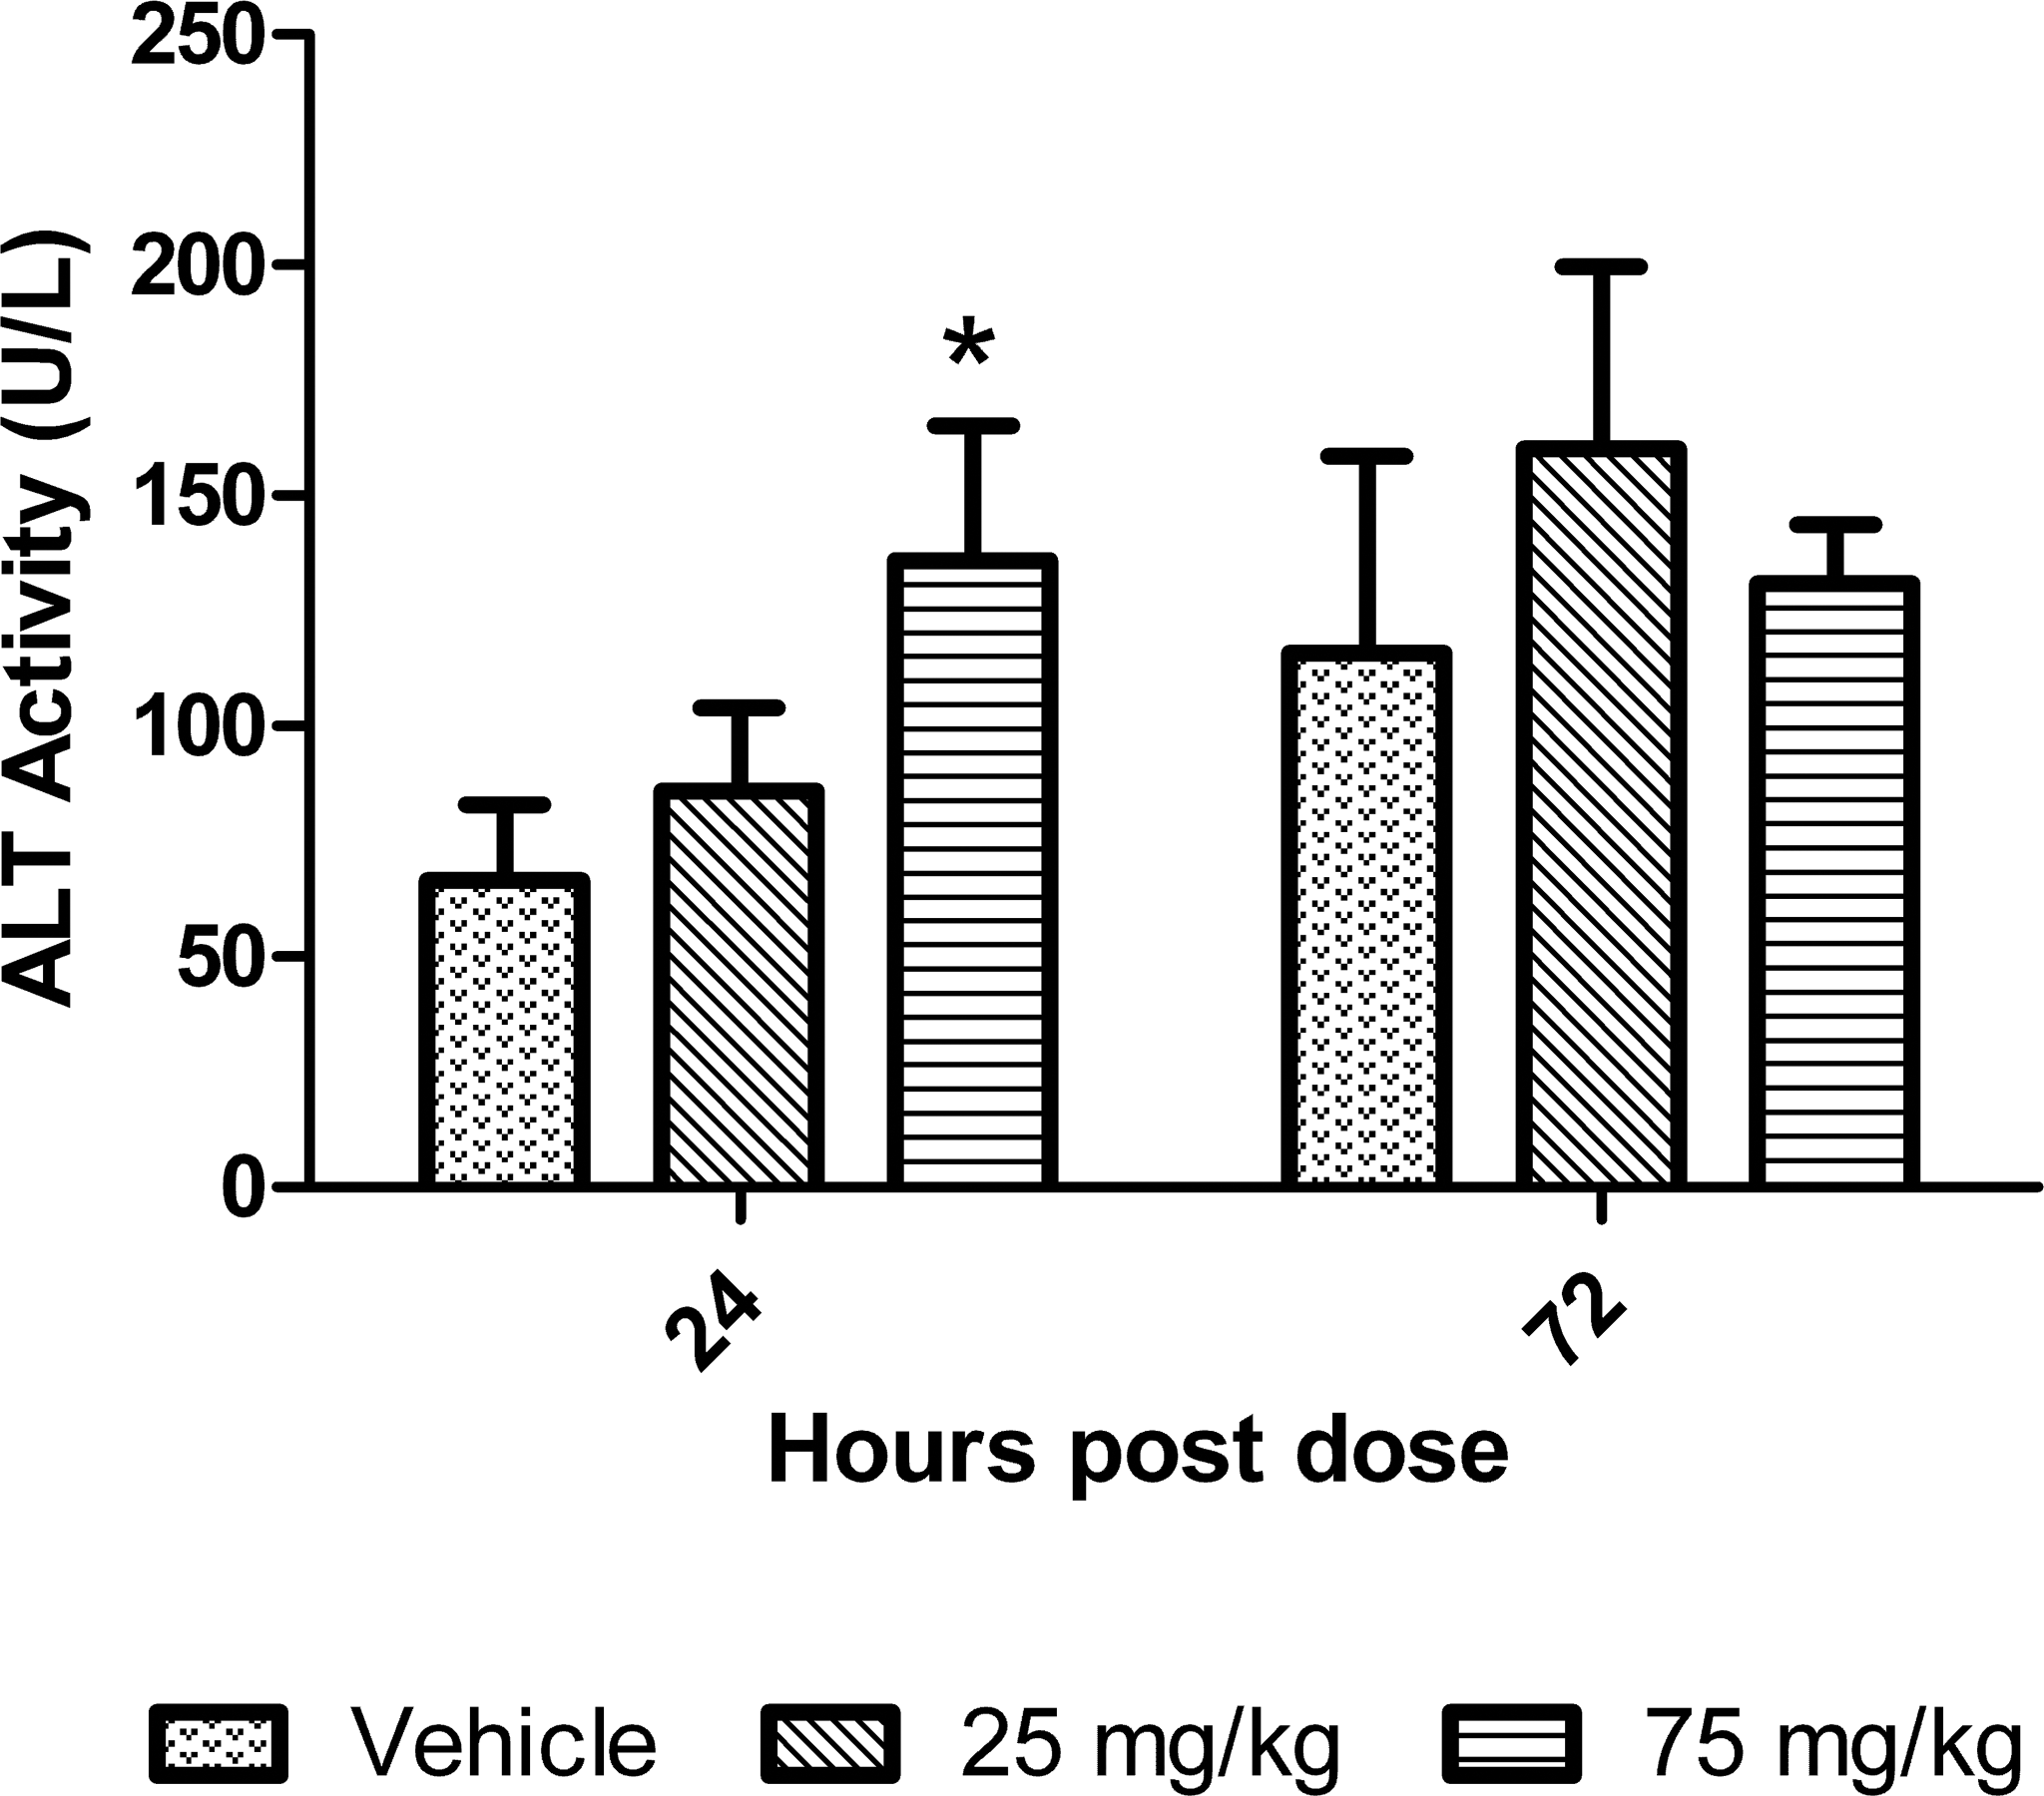
Hepatic ALT measured by the standard biochemical technique showed no increase in total liver ALT activity 24 hr after treatment with either 25 or 75 mg/kg of dexamethasone. The total ALT levels were increased on a mean basis at 72 hr by 1.3-fold and 1.6-fold relative to controls in the 25 and 75 mg/kg dose groups, respectively (Figure 1). Although the ALT levels for the 25 mg/kg dose group at 72 hr were similar to the control values after 24 hr of treatment.
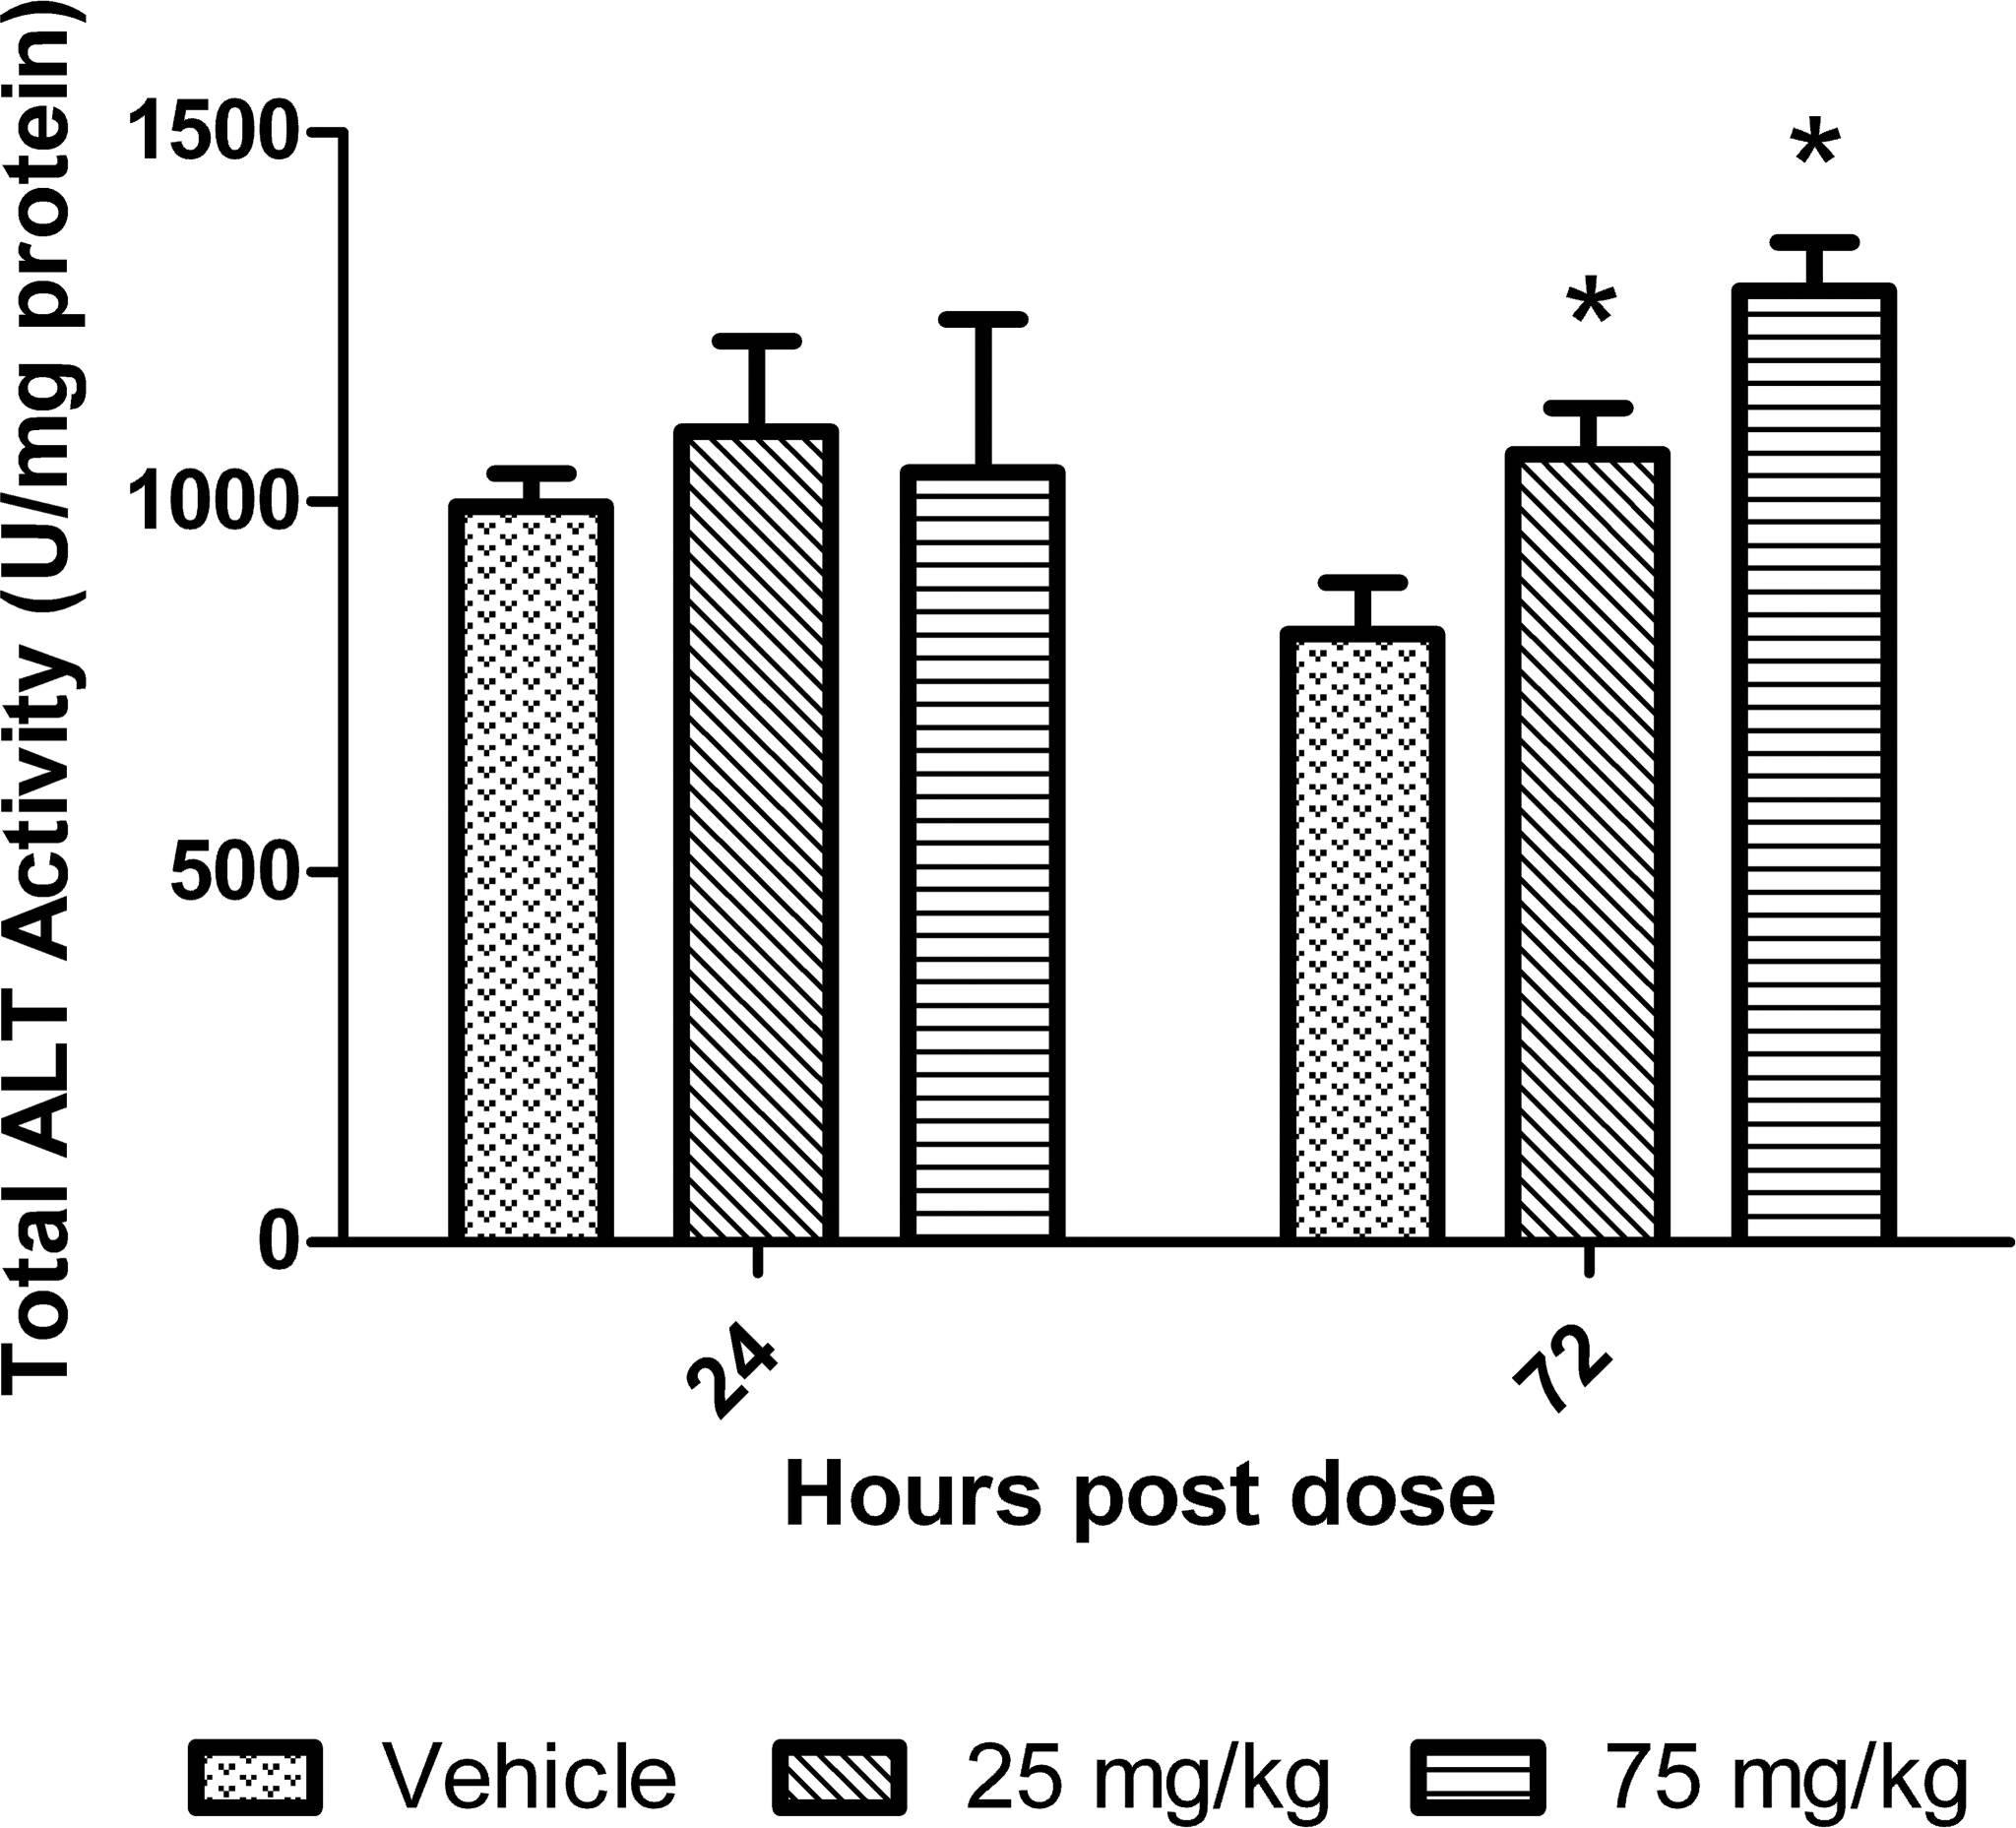
Total ALT activity in livers of mice treated with dexamethasone. Data are expressed as mean ± standard deviation. Asterisk indicates p value ≤ .01.
To determine which isoenzyme of ALT was primarily responsible for the increase in total liver ALT activity, Western blots were performed on the liver tissue using affinity purified anti-ALT1 and ALT2 polyclonal antibodies. Western blot results from mice treated with 25 and 75 mg/kg of dexamethasone for 24 hr and 72 hr showed there were increases in ALT2 at both time points; in contrast, there is no increase in ALT1 at either time point (Figure 2A and 2B) with ALT1 actually decreasing slightly at 72 hr in the 25 mg/kg dose group. Quantification of hepatic ALT2 protein expression by Western blot showed there was an increase of 1.6- and 1.7-fold at 24 hr and 2.3- and 3.0-fold relative to mean control values at 72 hr in the 25 and 75 mg/kg dose groups, respectively.
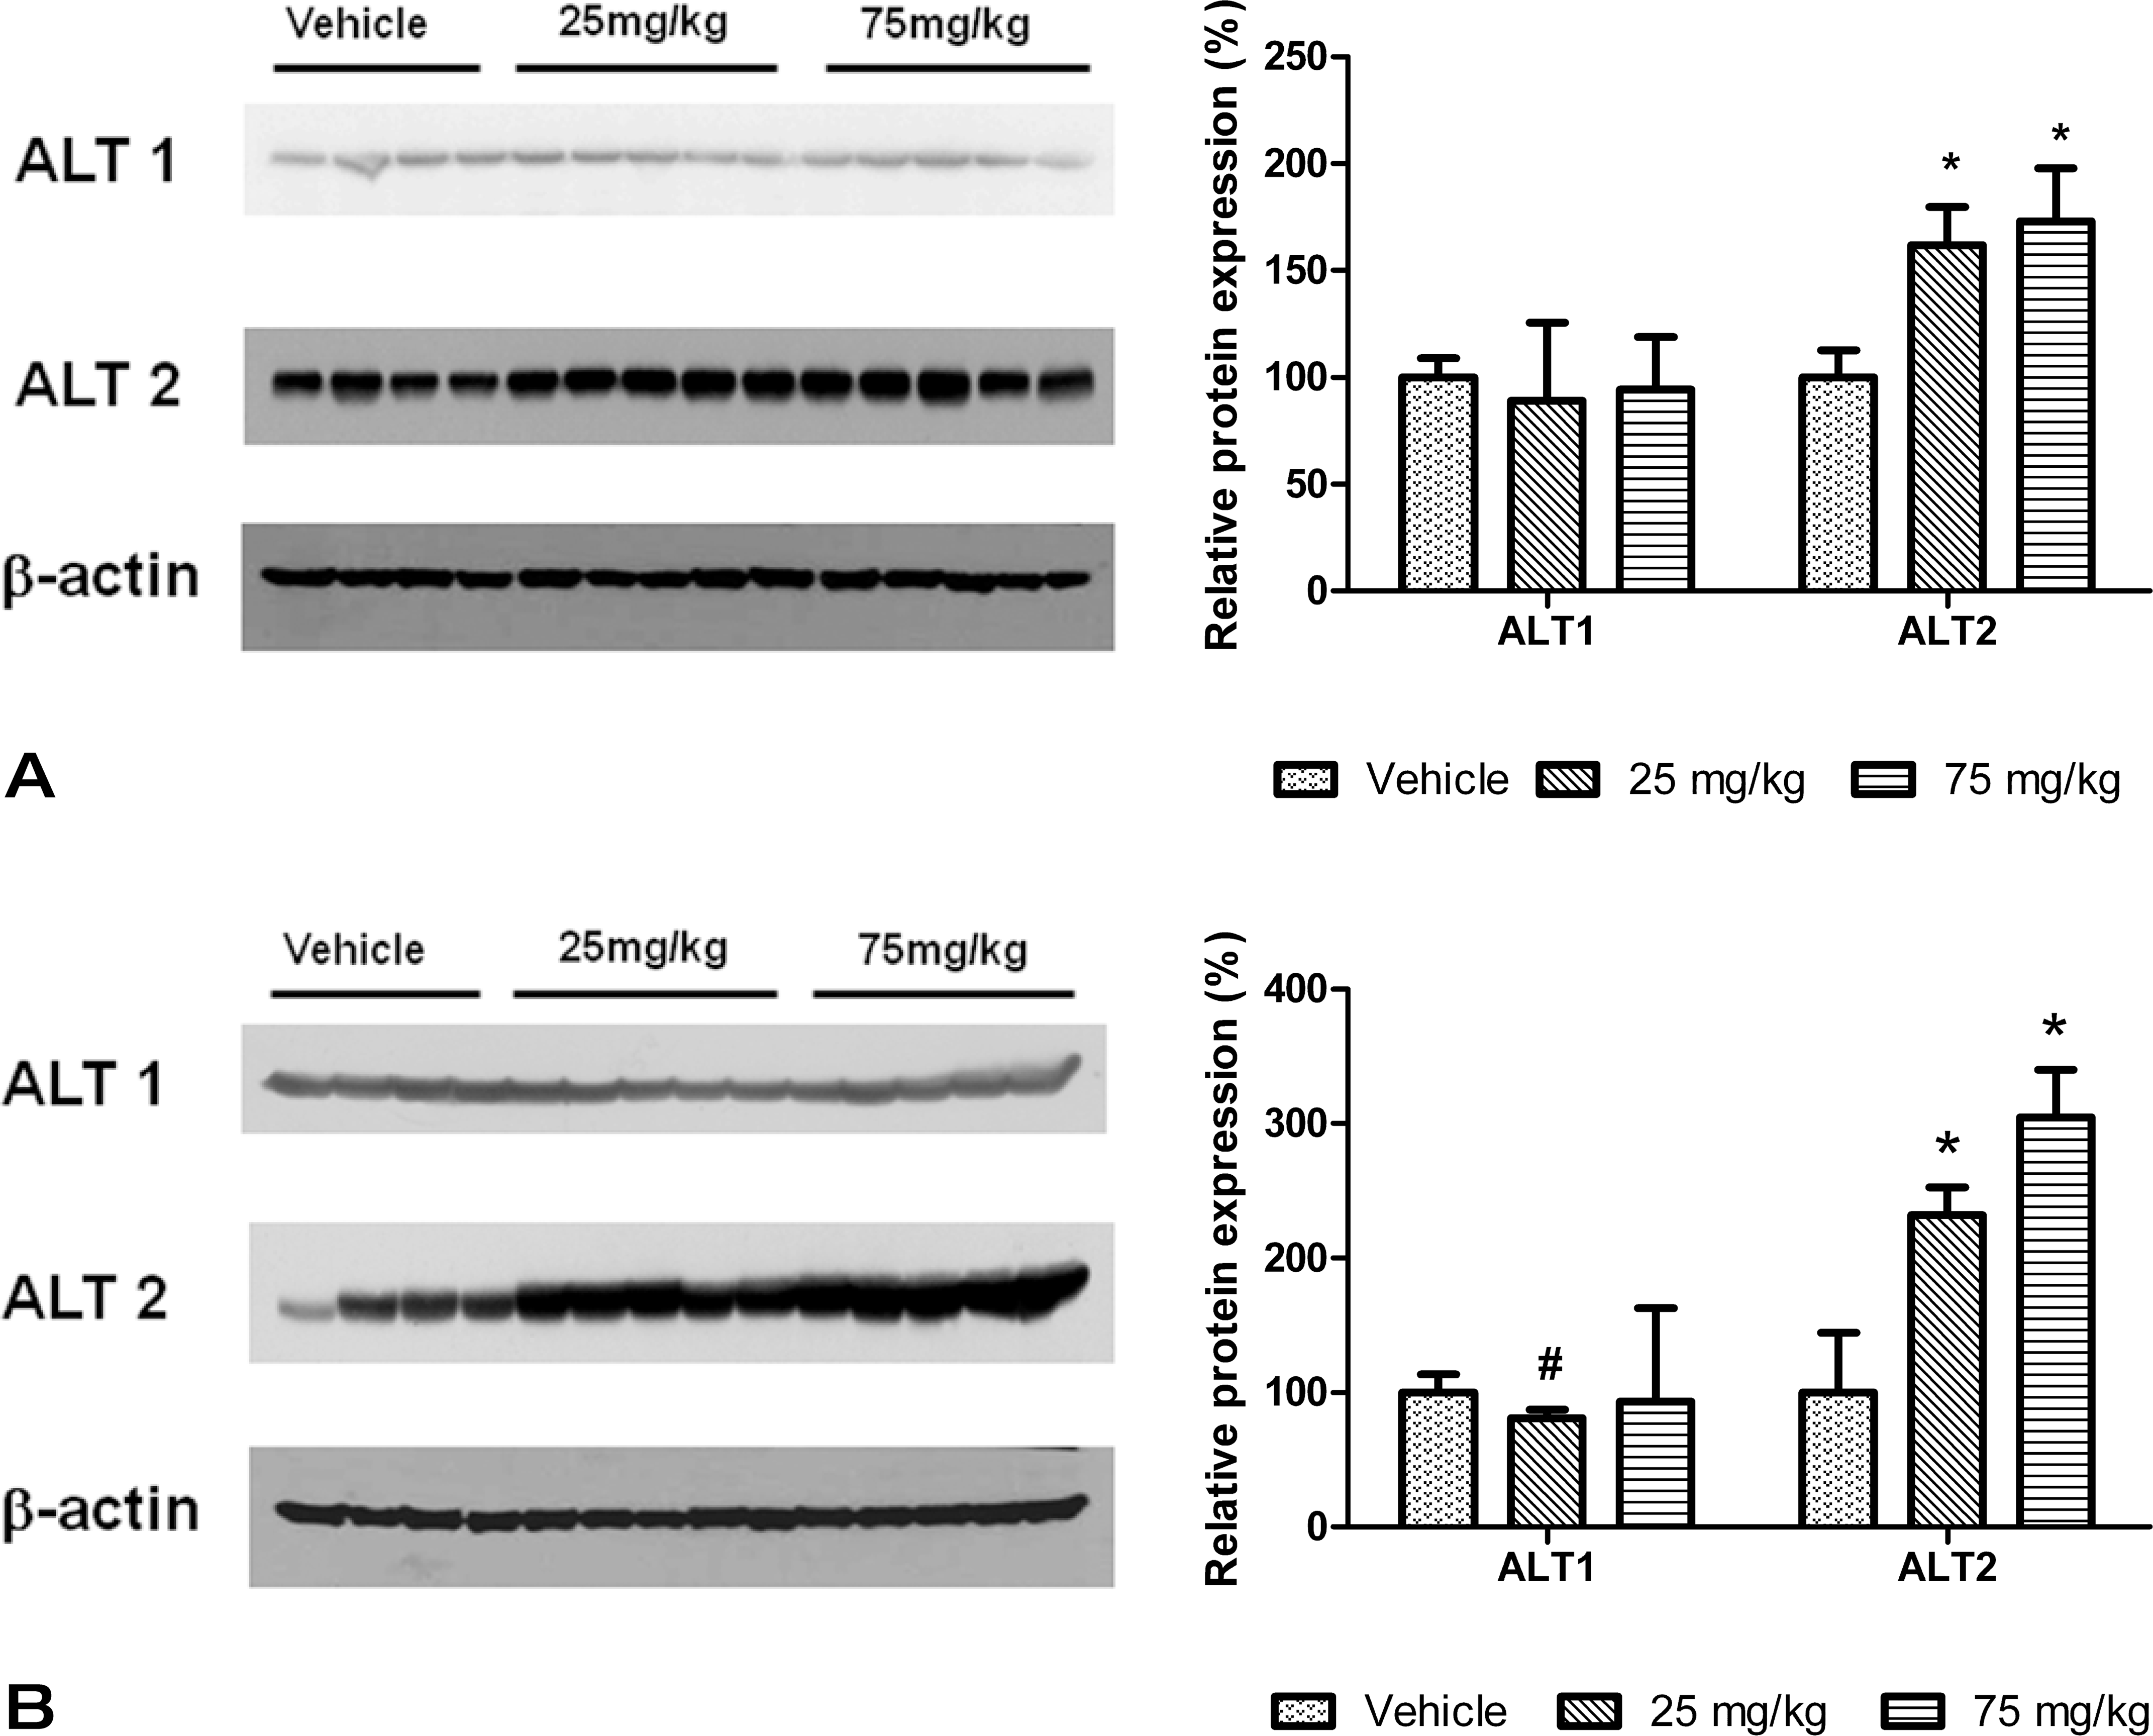
Western blots of liver protein extracts of mice treated with dexamethasone for 24 (2A) and 72 (2B) hr. The graphs to the right of the blots represent the quantitation of the response with the data expressed as mean ± standard deviation of the percentage change relative to the control group. Asterisk indicates p value ≤ .01 and # indicates p value ≤.05.
To determine whether the increases in protein concentrations were due to increase in the RNA expression, real-time PCR was performed on RNA isolated from the liver. Relative gene expression changes compared to control groups showed that there were no increases in ALT1 expression at 24 or 72 hr postdose (Figure 3A). ALT2 increased 1.4-fold relative to mean control values at 24 hr and 2.3-fold at 72 hr for the 75 mg/kg dose group (Figure 3B).
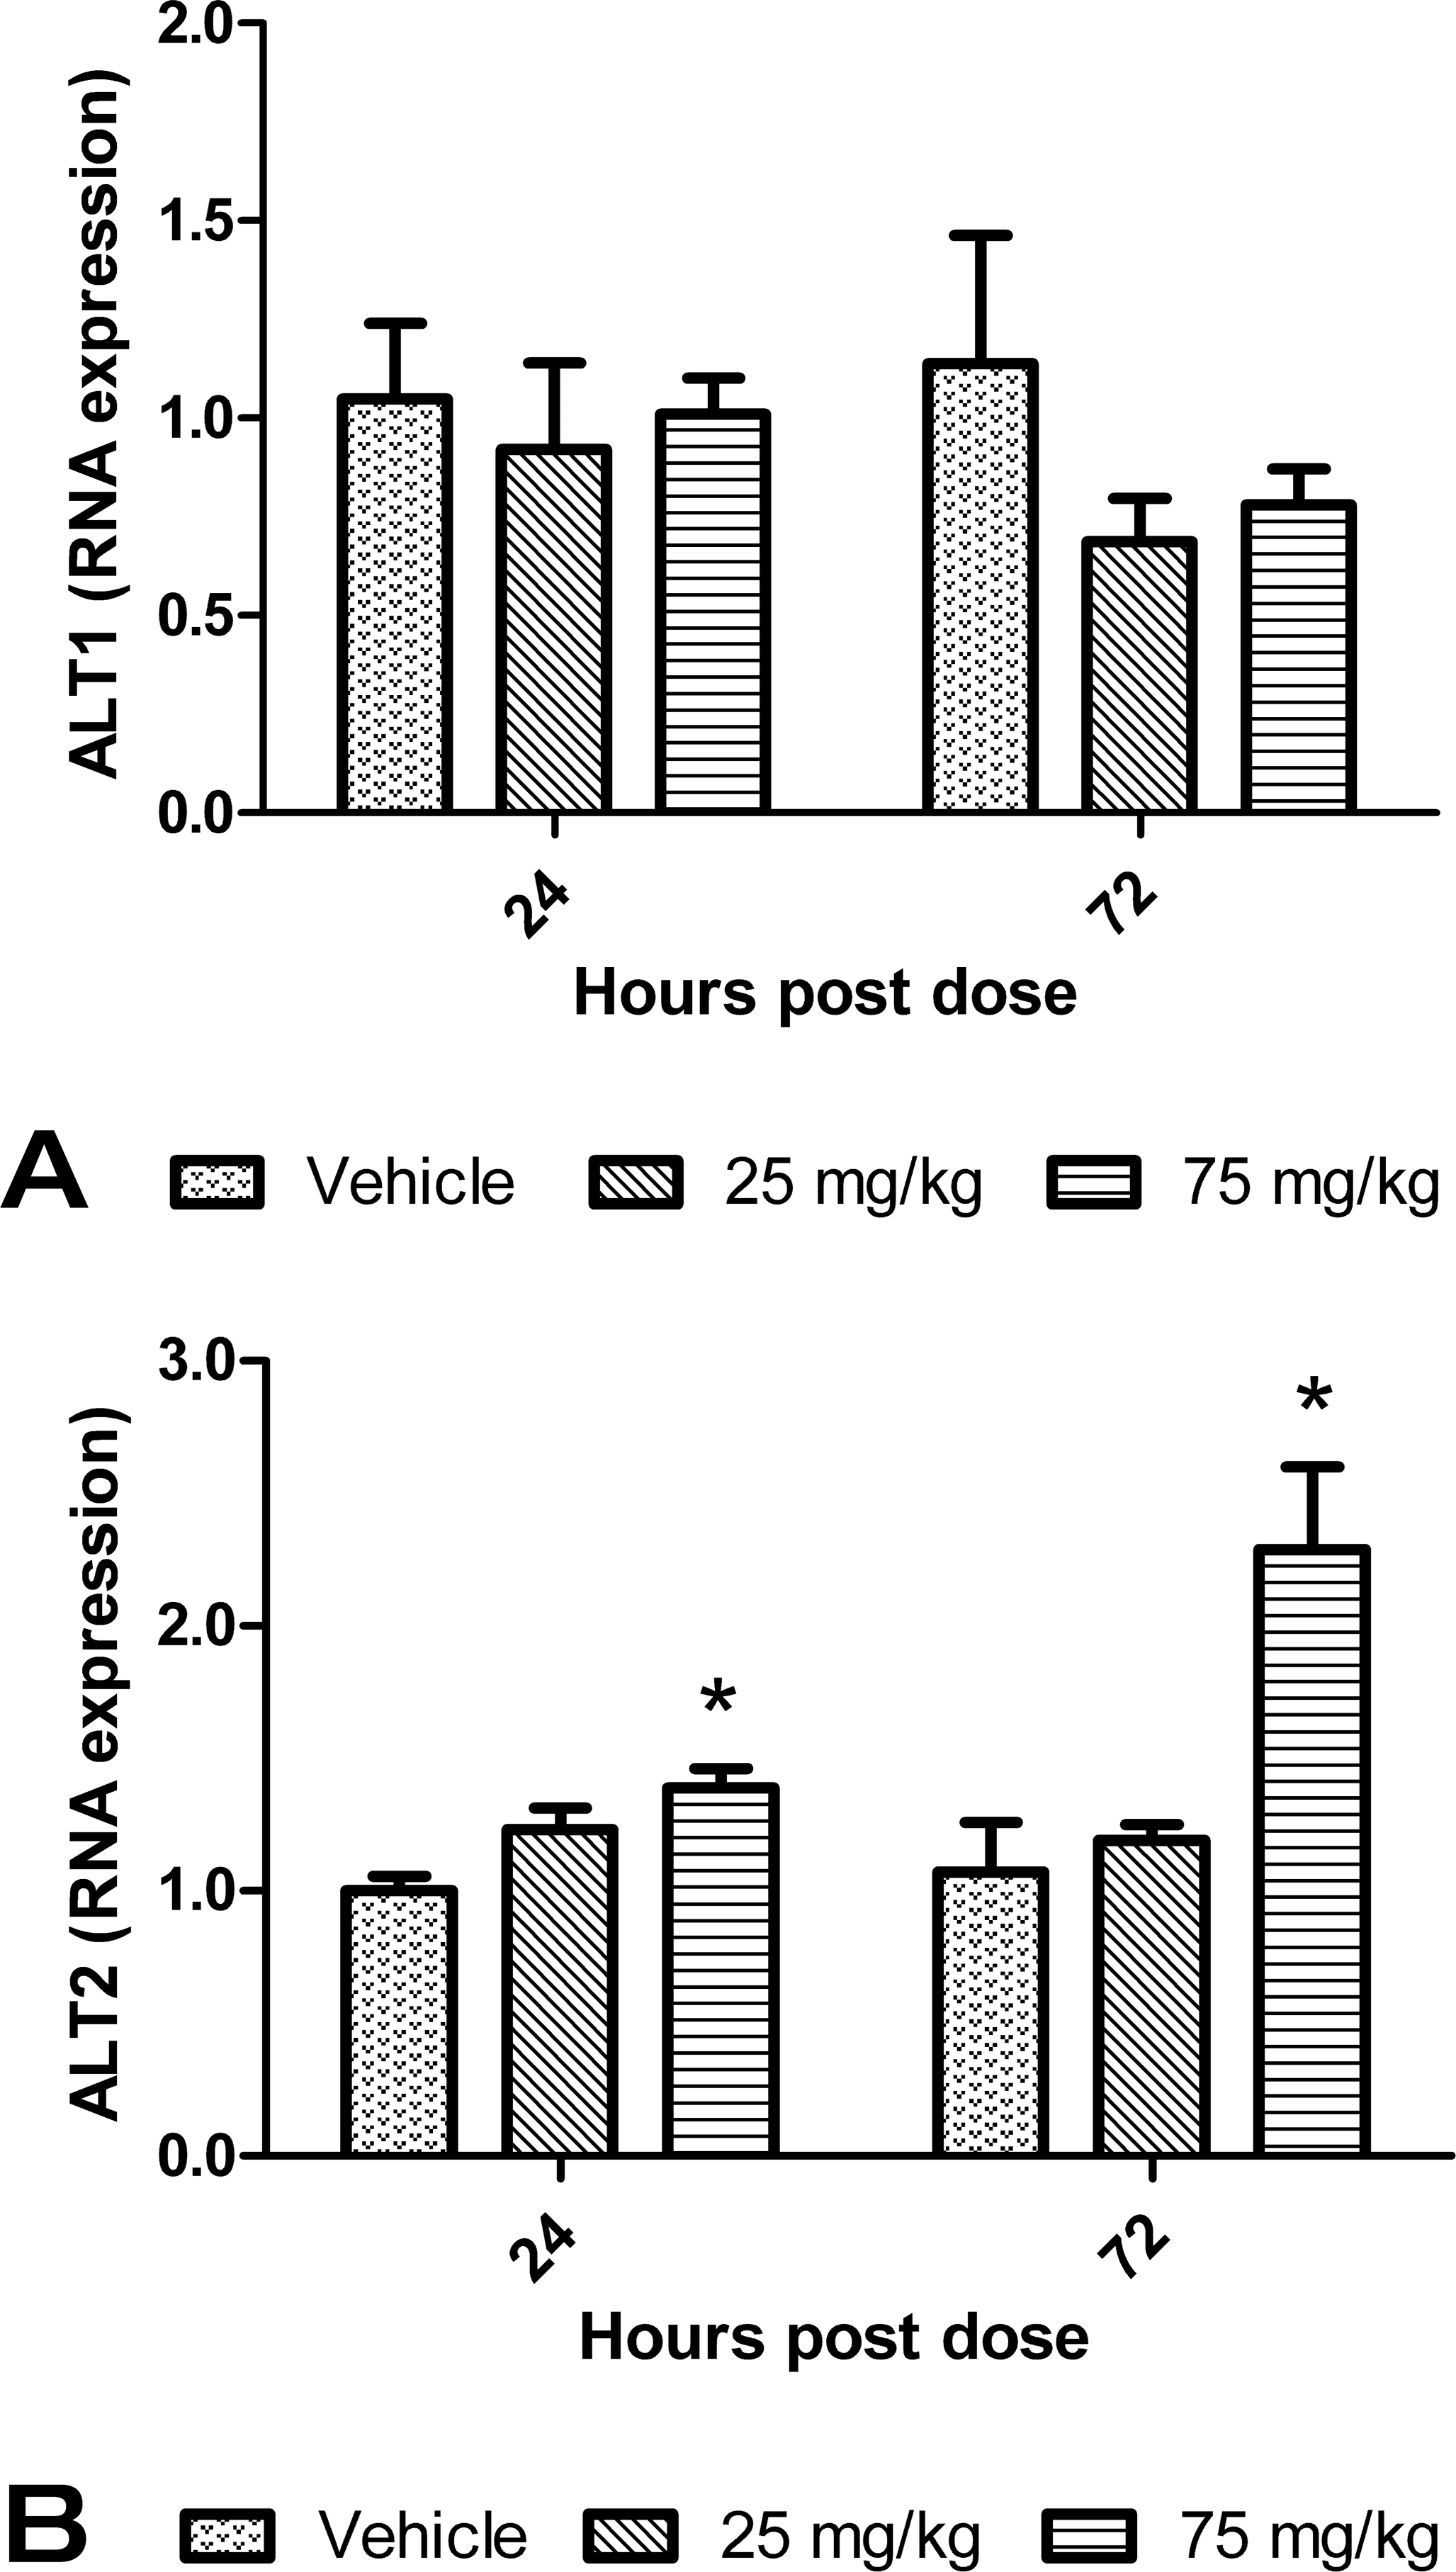
ALT1 isoenzyme quantitative RNA expression in livers of mice treated with dexamethasone for 24 (3A) and 72 (3B) hr. Data are expressed as mean ± standard error of the fold change relative to the control group. Asterisk indicates p value ≤ .01.
An activity-based assay was also used to measure ALT1 and ALT2 isoenzymes at 24 and 72 hr after treatment to compare these results to those obtained by Western blot. ALT1 did not show an increase at 24 hr at either dose, but at 72 hr there were increases of 1.1 to 1.3-fold relative to control in ALT1 activity at the 25 and 75 mg/kg dose groups, respectively (Figure 4). Although the ALT1 levels in both dose groups at 72 hr were similar to the control values after 24 hr of treatment.
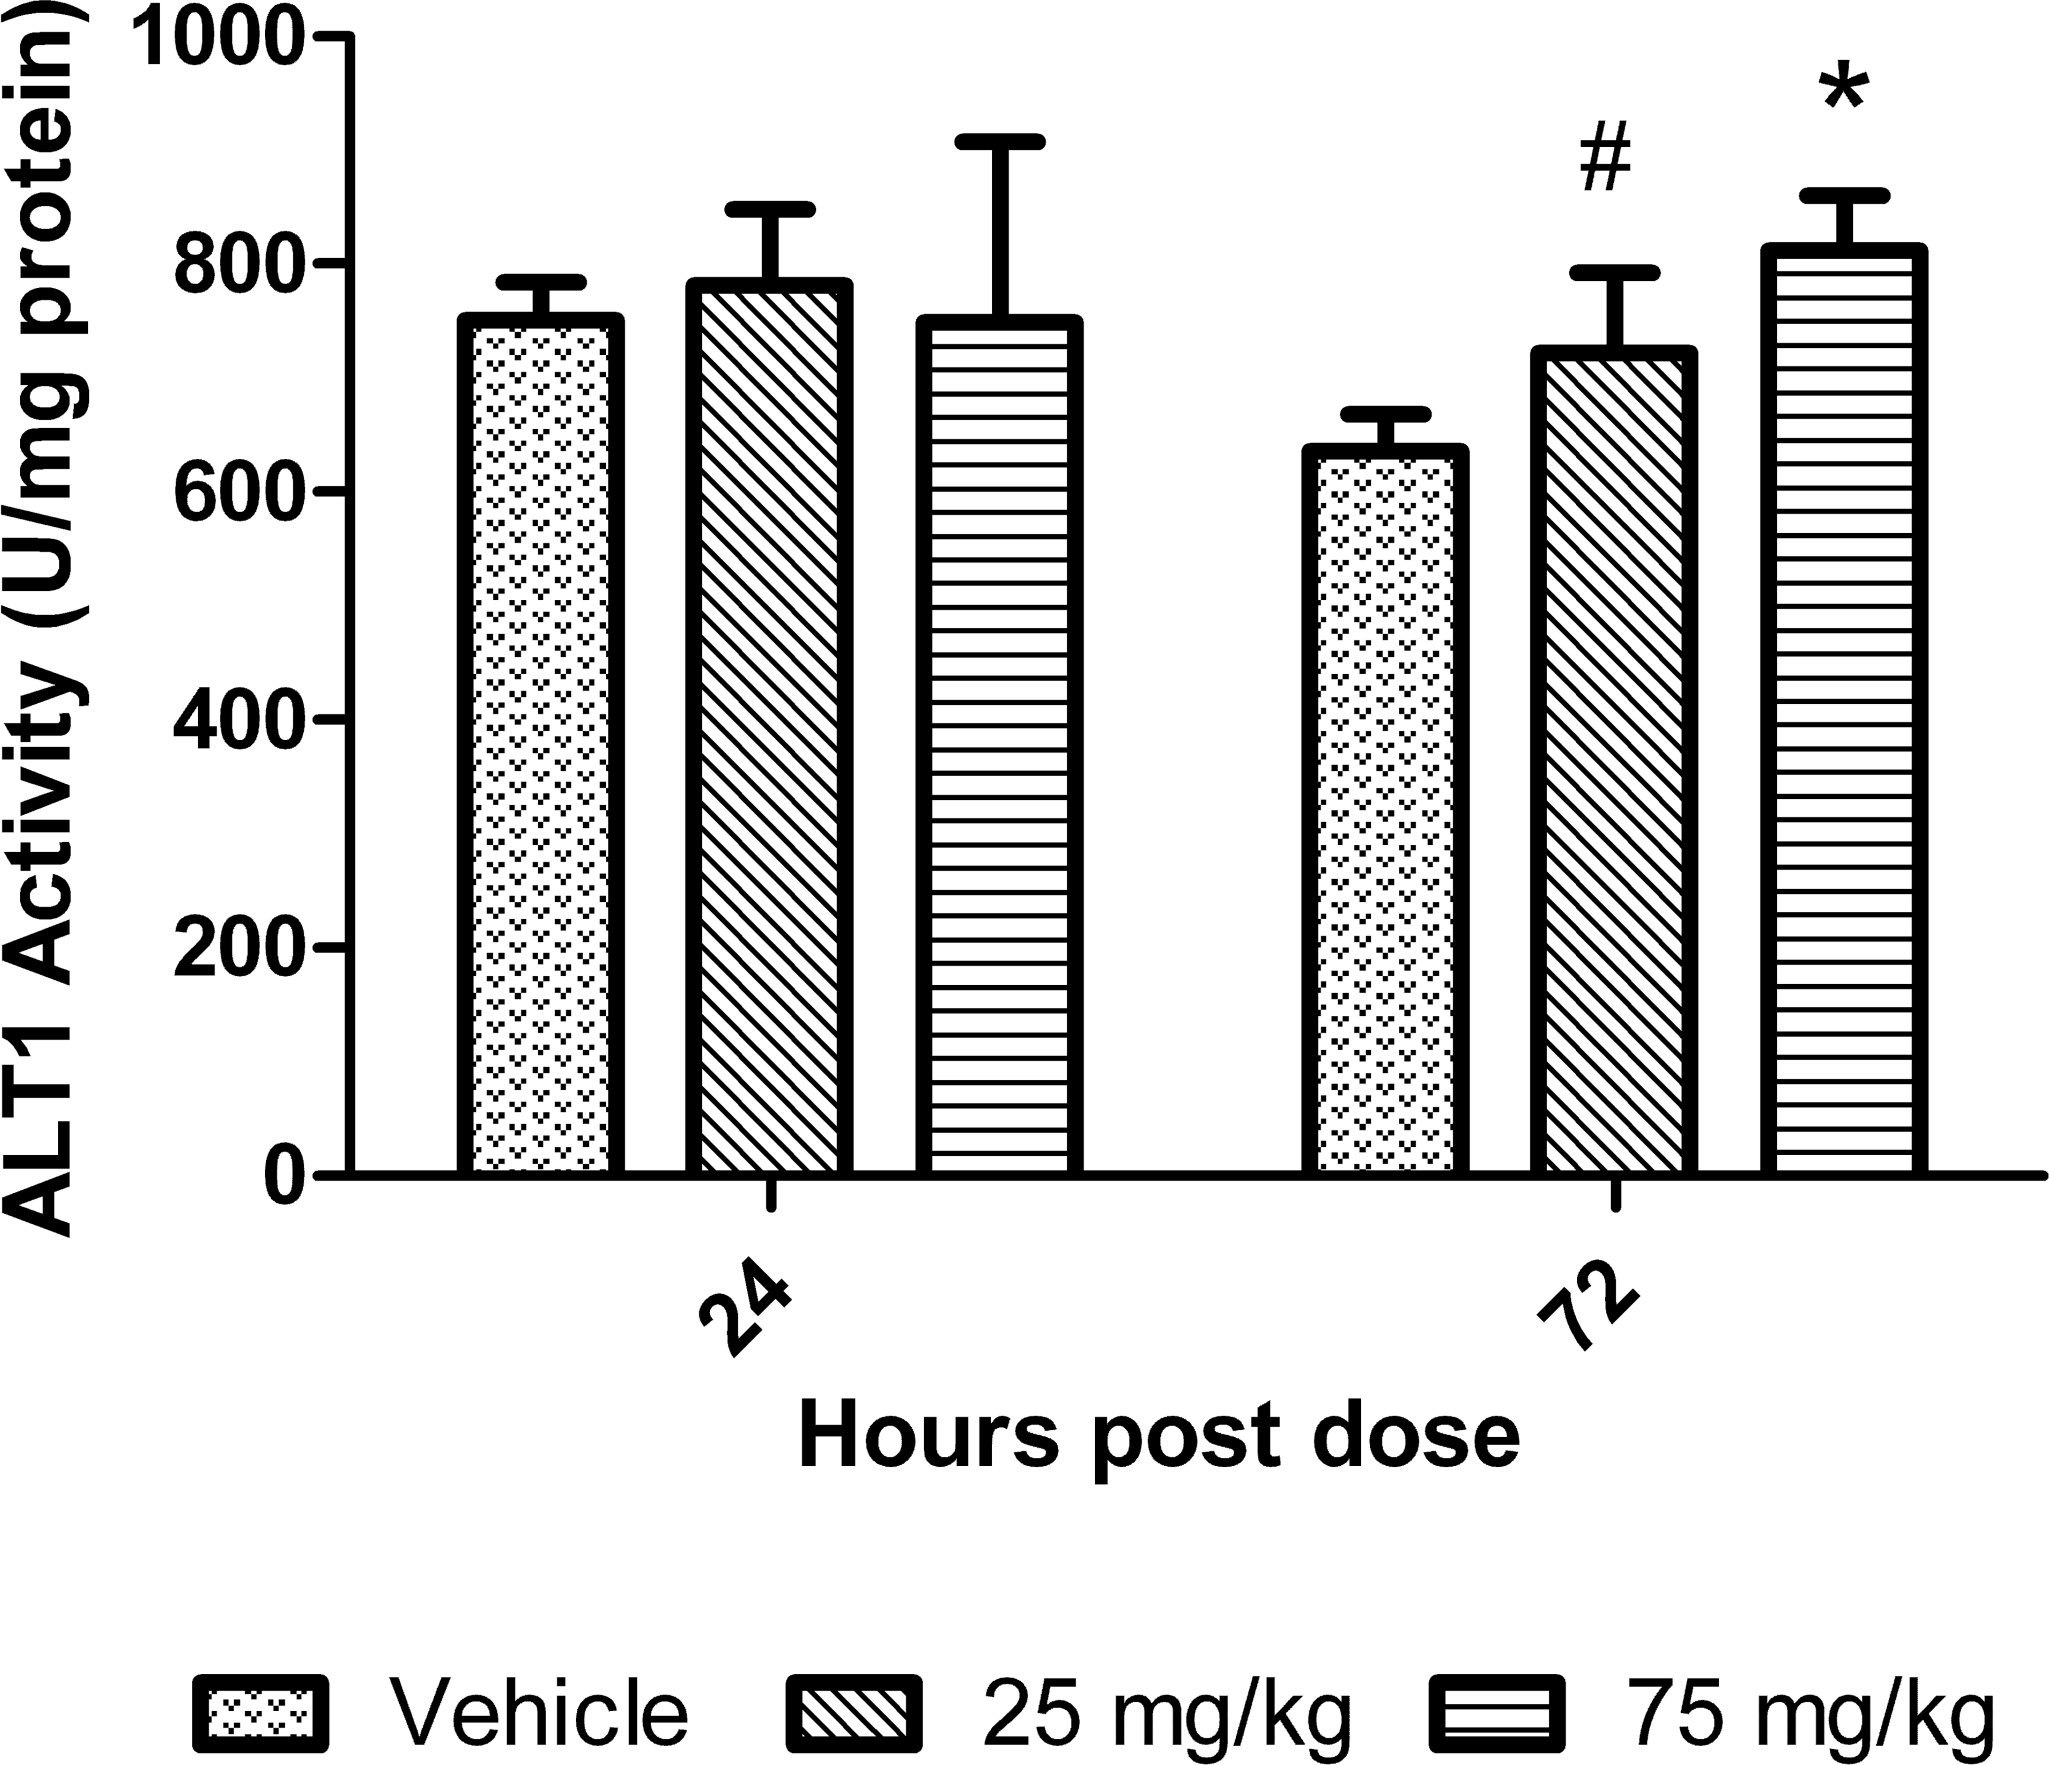
ALT1 isoenzyme activity in livers of mice treated with dexamethasone. Data are expressed as mean ± standard deviation. Asterisk indicates p value ≤ .01 and # indicates p value ≤ .05.
ALT2 activity did increase 1.3-fold relative to control at the 25 mg/kg dose at 24 hr postdose. At 72 hr, there were increases of 1.8 to 2.5-fold relative to mean control values in ALT2 activity at the 25 and 75 mg/kg dose, respectively (Figure 5). The comparison of ALT2 by Western blot to the ALT2 concentrations determined by the activity-based assay can be described by the equation y = 0.7x + 0.2 (R 2 = .757). The comparison of ALT1 by Western blot to the ALT1 concentrations determined by the activity-based assay can be described by the equation y = −.02x + 1.1 (R 2 = .002).
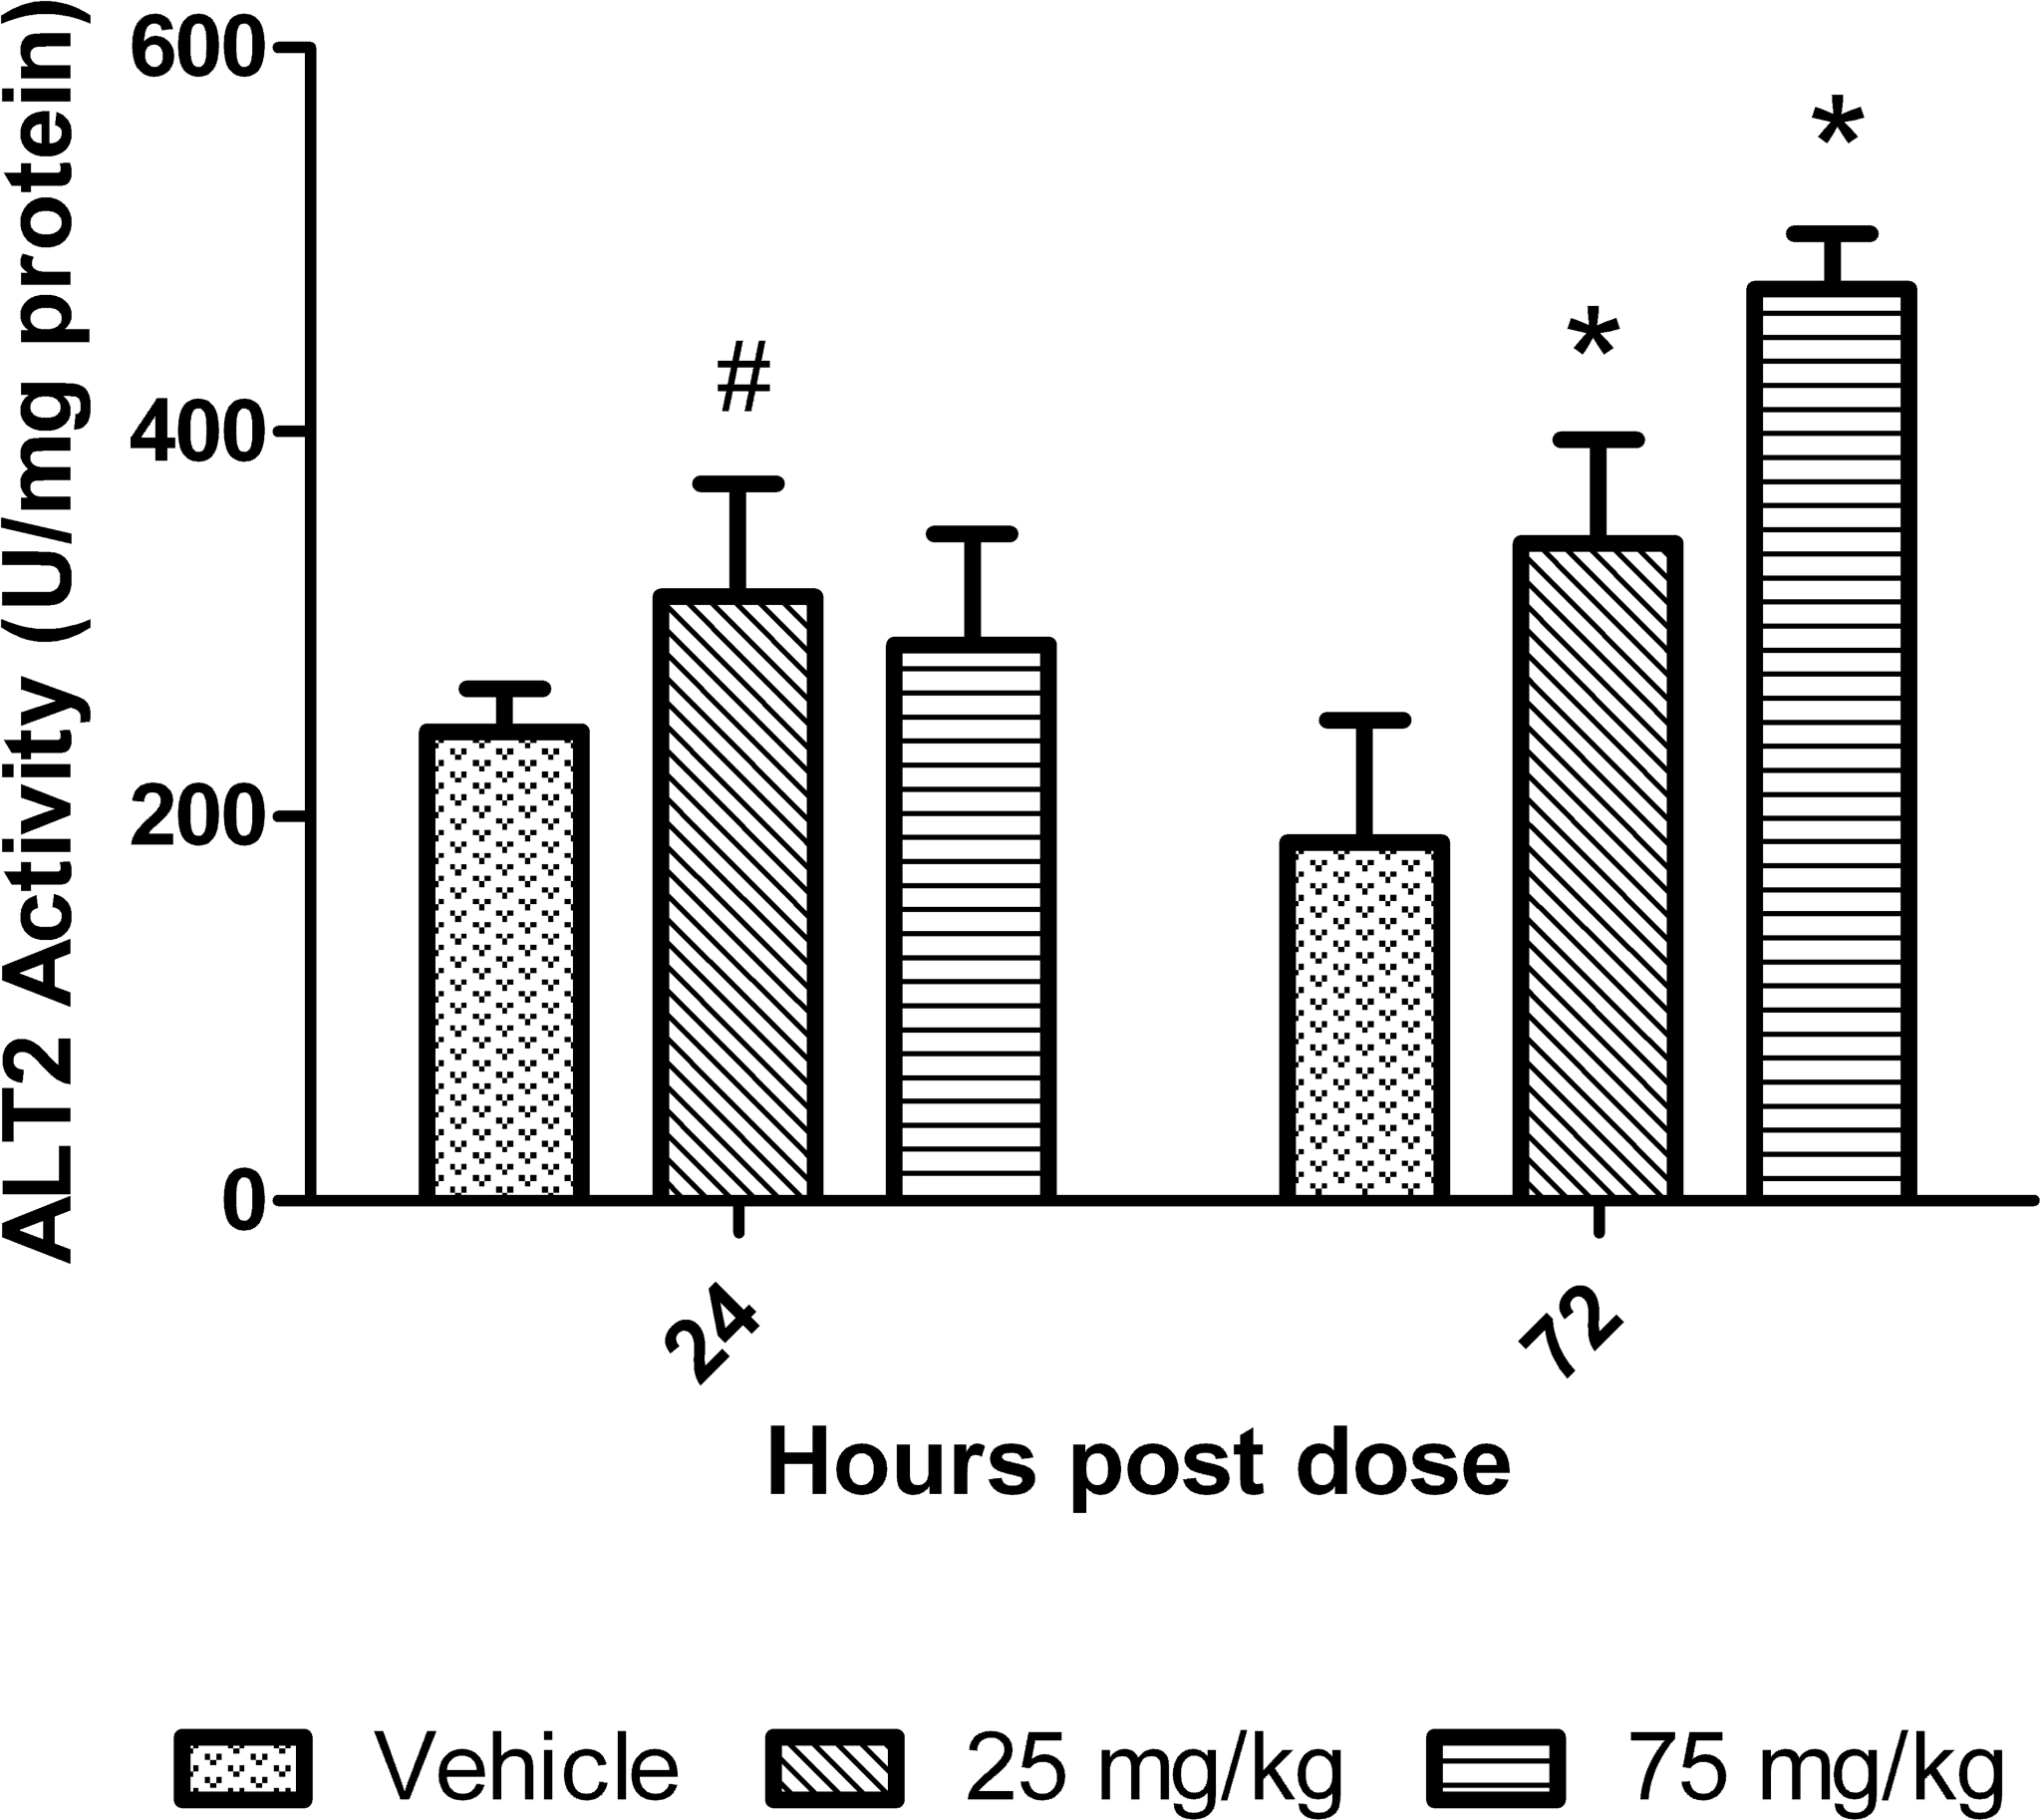
ALT2 isoenzyme activity in livers of mice treated with dexamethasone. Data are expressed as mean ± standard deviation. Asterisk indicates p value ≤ .01 and # indicates p value ≤ .05.
To assess whether a potential underlying metabolic state that may be associated with the increase in ALT was present in the liver, glycogen was measured using a standard amyloglucosidase digestion technique. Hepatic glycogen content peaked at 24 hr, 24.3- and 23.2-fold increases relative to controls for the 25 and 75 mg/kg dose groups, respectively (Figure 6). The glycogen concentrations were still elevated at 72 hr with increases of 18.8- and 18.5-fold relative to controls at 25 and 75 mg/kg dose groups, respectively.
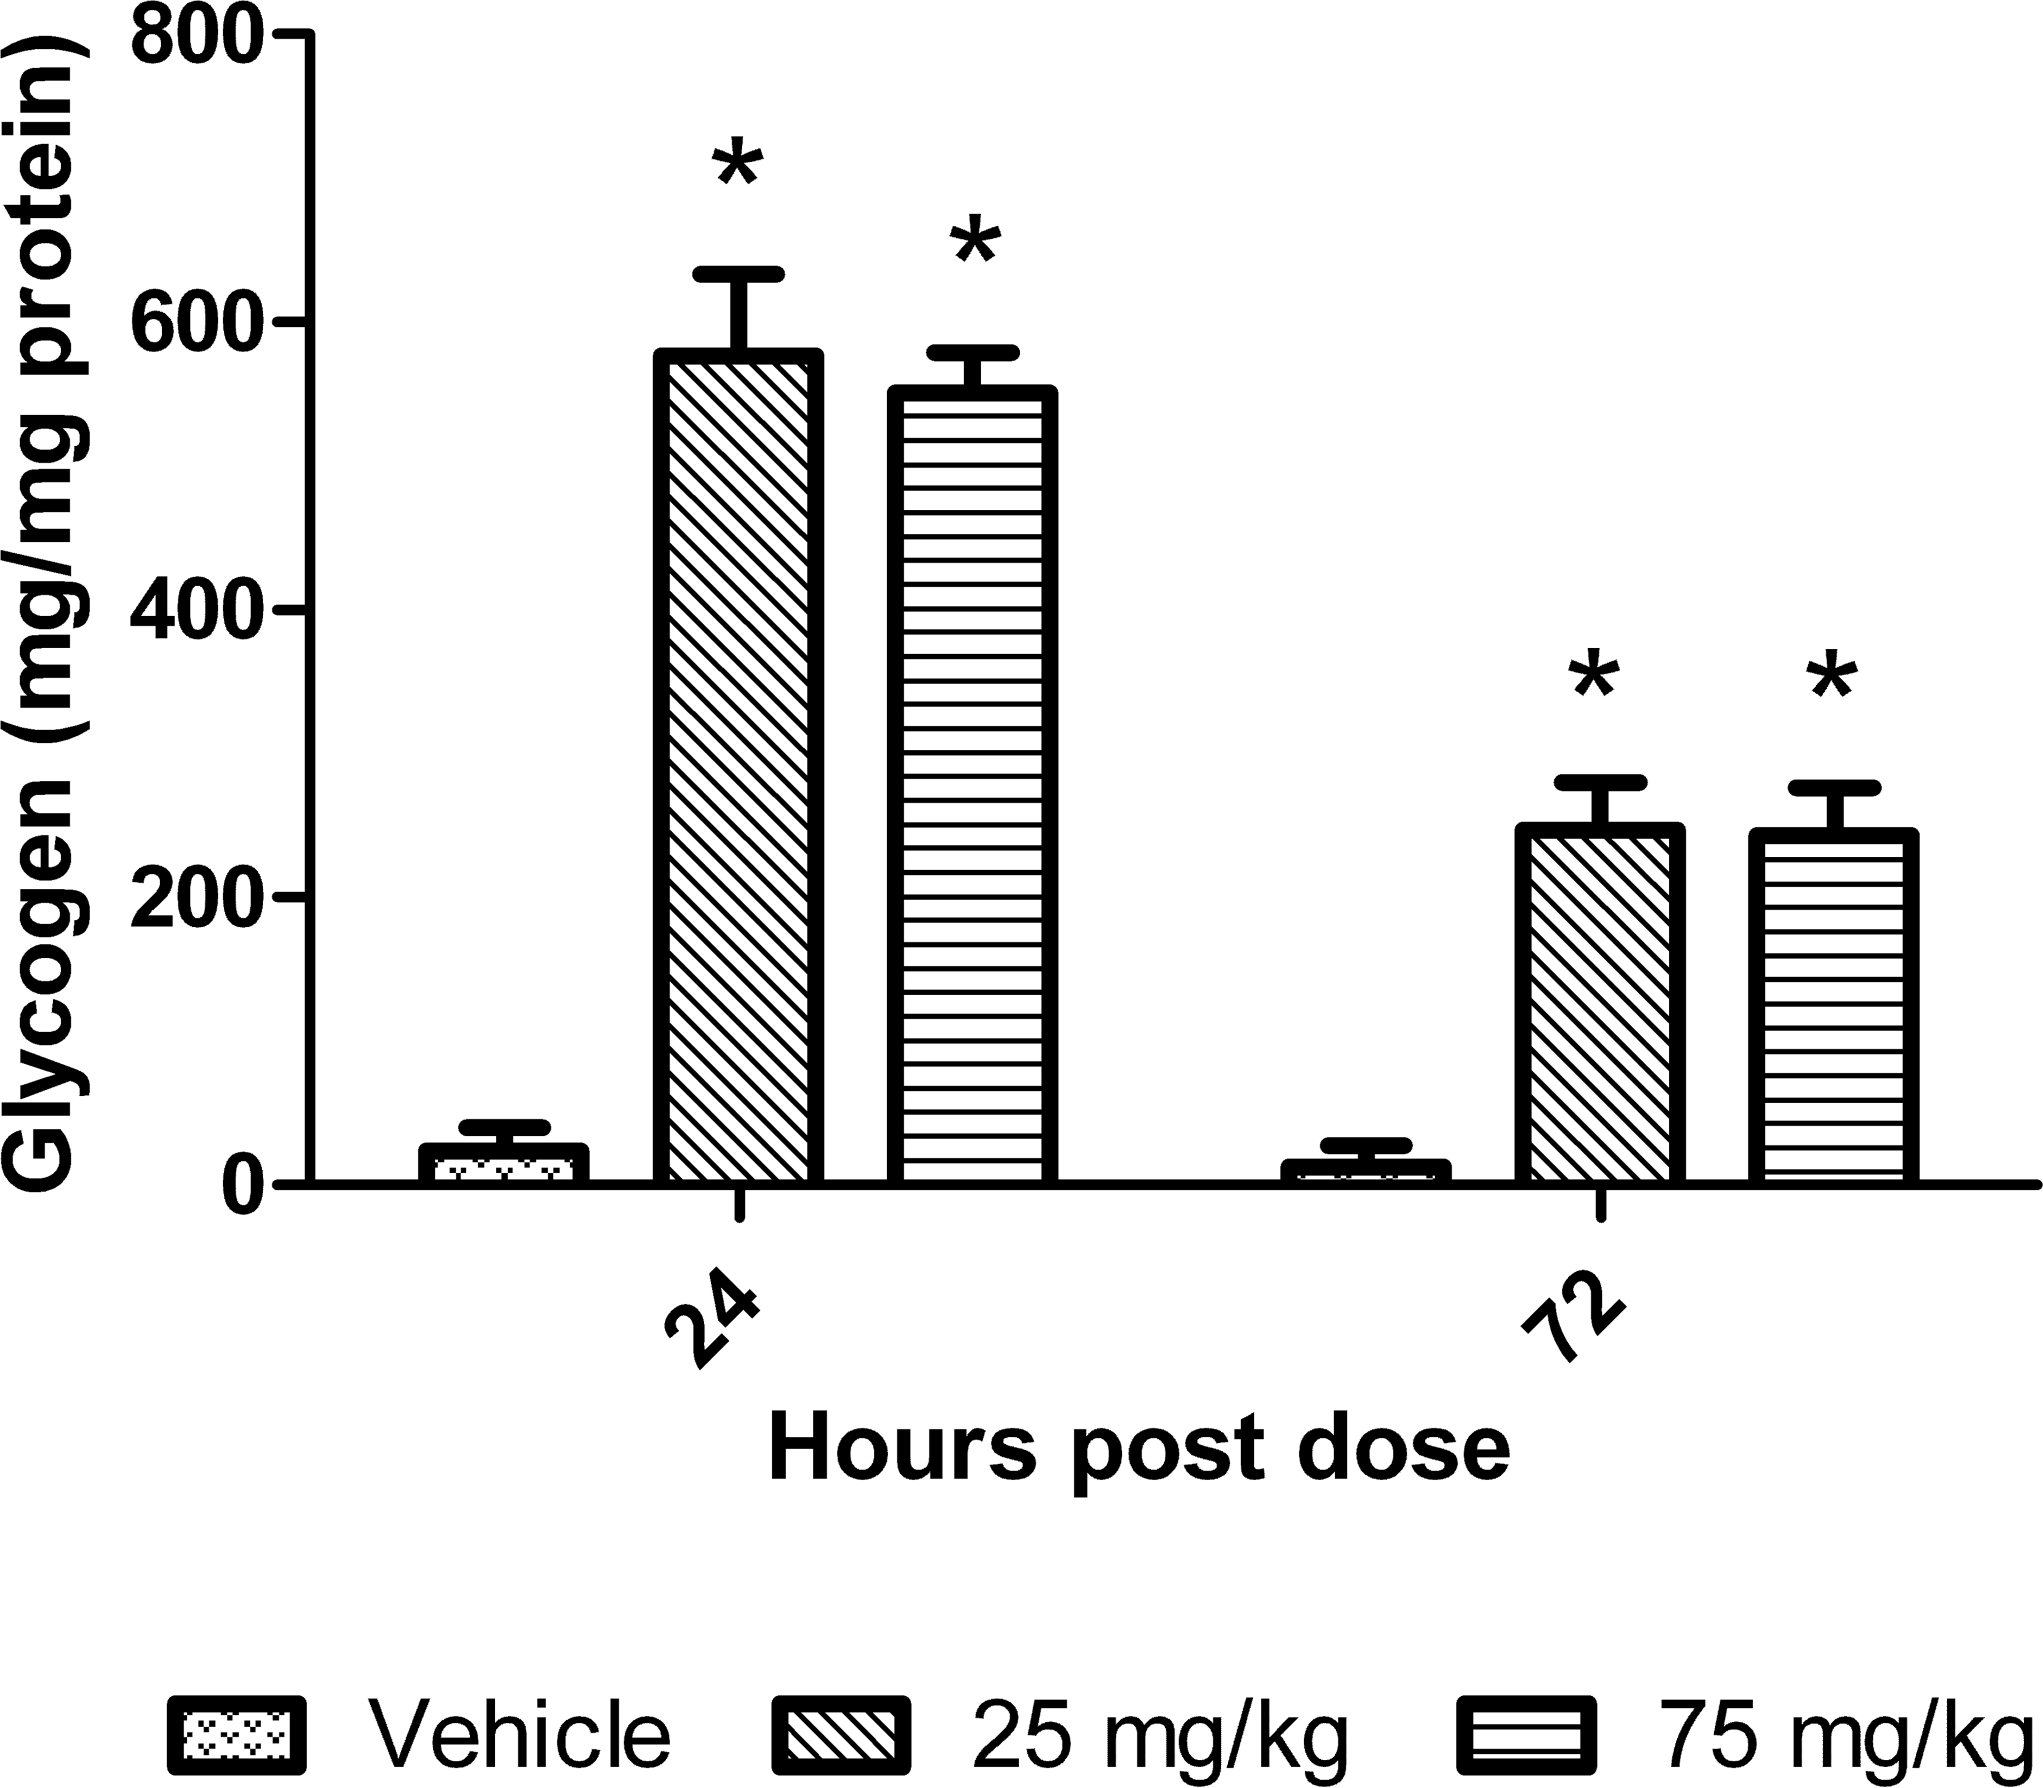
Liver glycogen in mice treated with dexamethasone. Data are expressed as mean ± standard deviation. Asterisk indicates p value ≤ .01.
Histological evaluation of the livers was also done and summarized in Table 1 and shown in Figures 7 and 8. The main feature noted was that there was an indistinct vacuolar change compatible with glycogen accumulation present in animals treated with 25 and 75 mg/kg for 24 or 72 hr. At 24 hr, the severity grade for the vacuolar change was greatest and there was a moderate diffuse increase in glycogen in the liver of all treated animals. The accumulation was present in most hepatocytes without differences between the 25 and 75 mg/kg dose groups. At 72 hr, the glycogen accumulation was graded mostly minimal to mild in severity. The hepatocytes from the centrolobular area did not have as much glycogen present at the 72-hr time point compared to 24 hr. There was no evidence of hepatic necrosis at either time point. PAS staining was done on a subset of the liver sections and showed PAS positive staining material compatible with glycogen accumulation. All vacuoles did not contain PAS positive material, but this likely represents the fact that the much of the glycogen was washed out in processing. The biochemical measurement of glycogen provided a more accurate assessment of glycogen content of the liver.
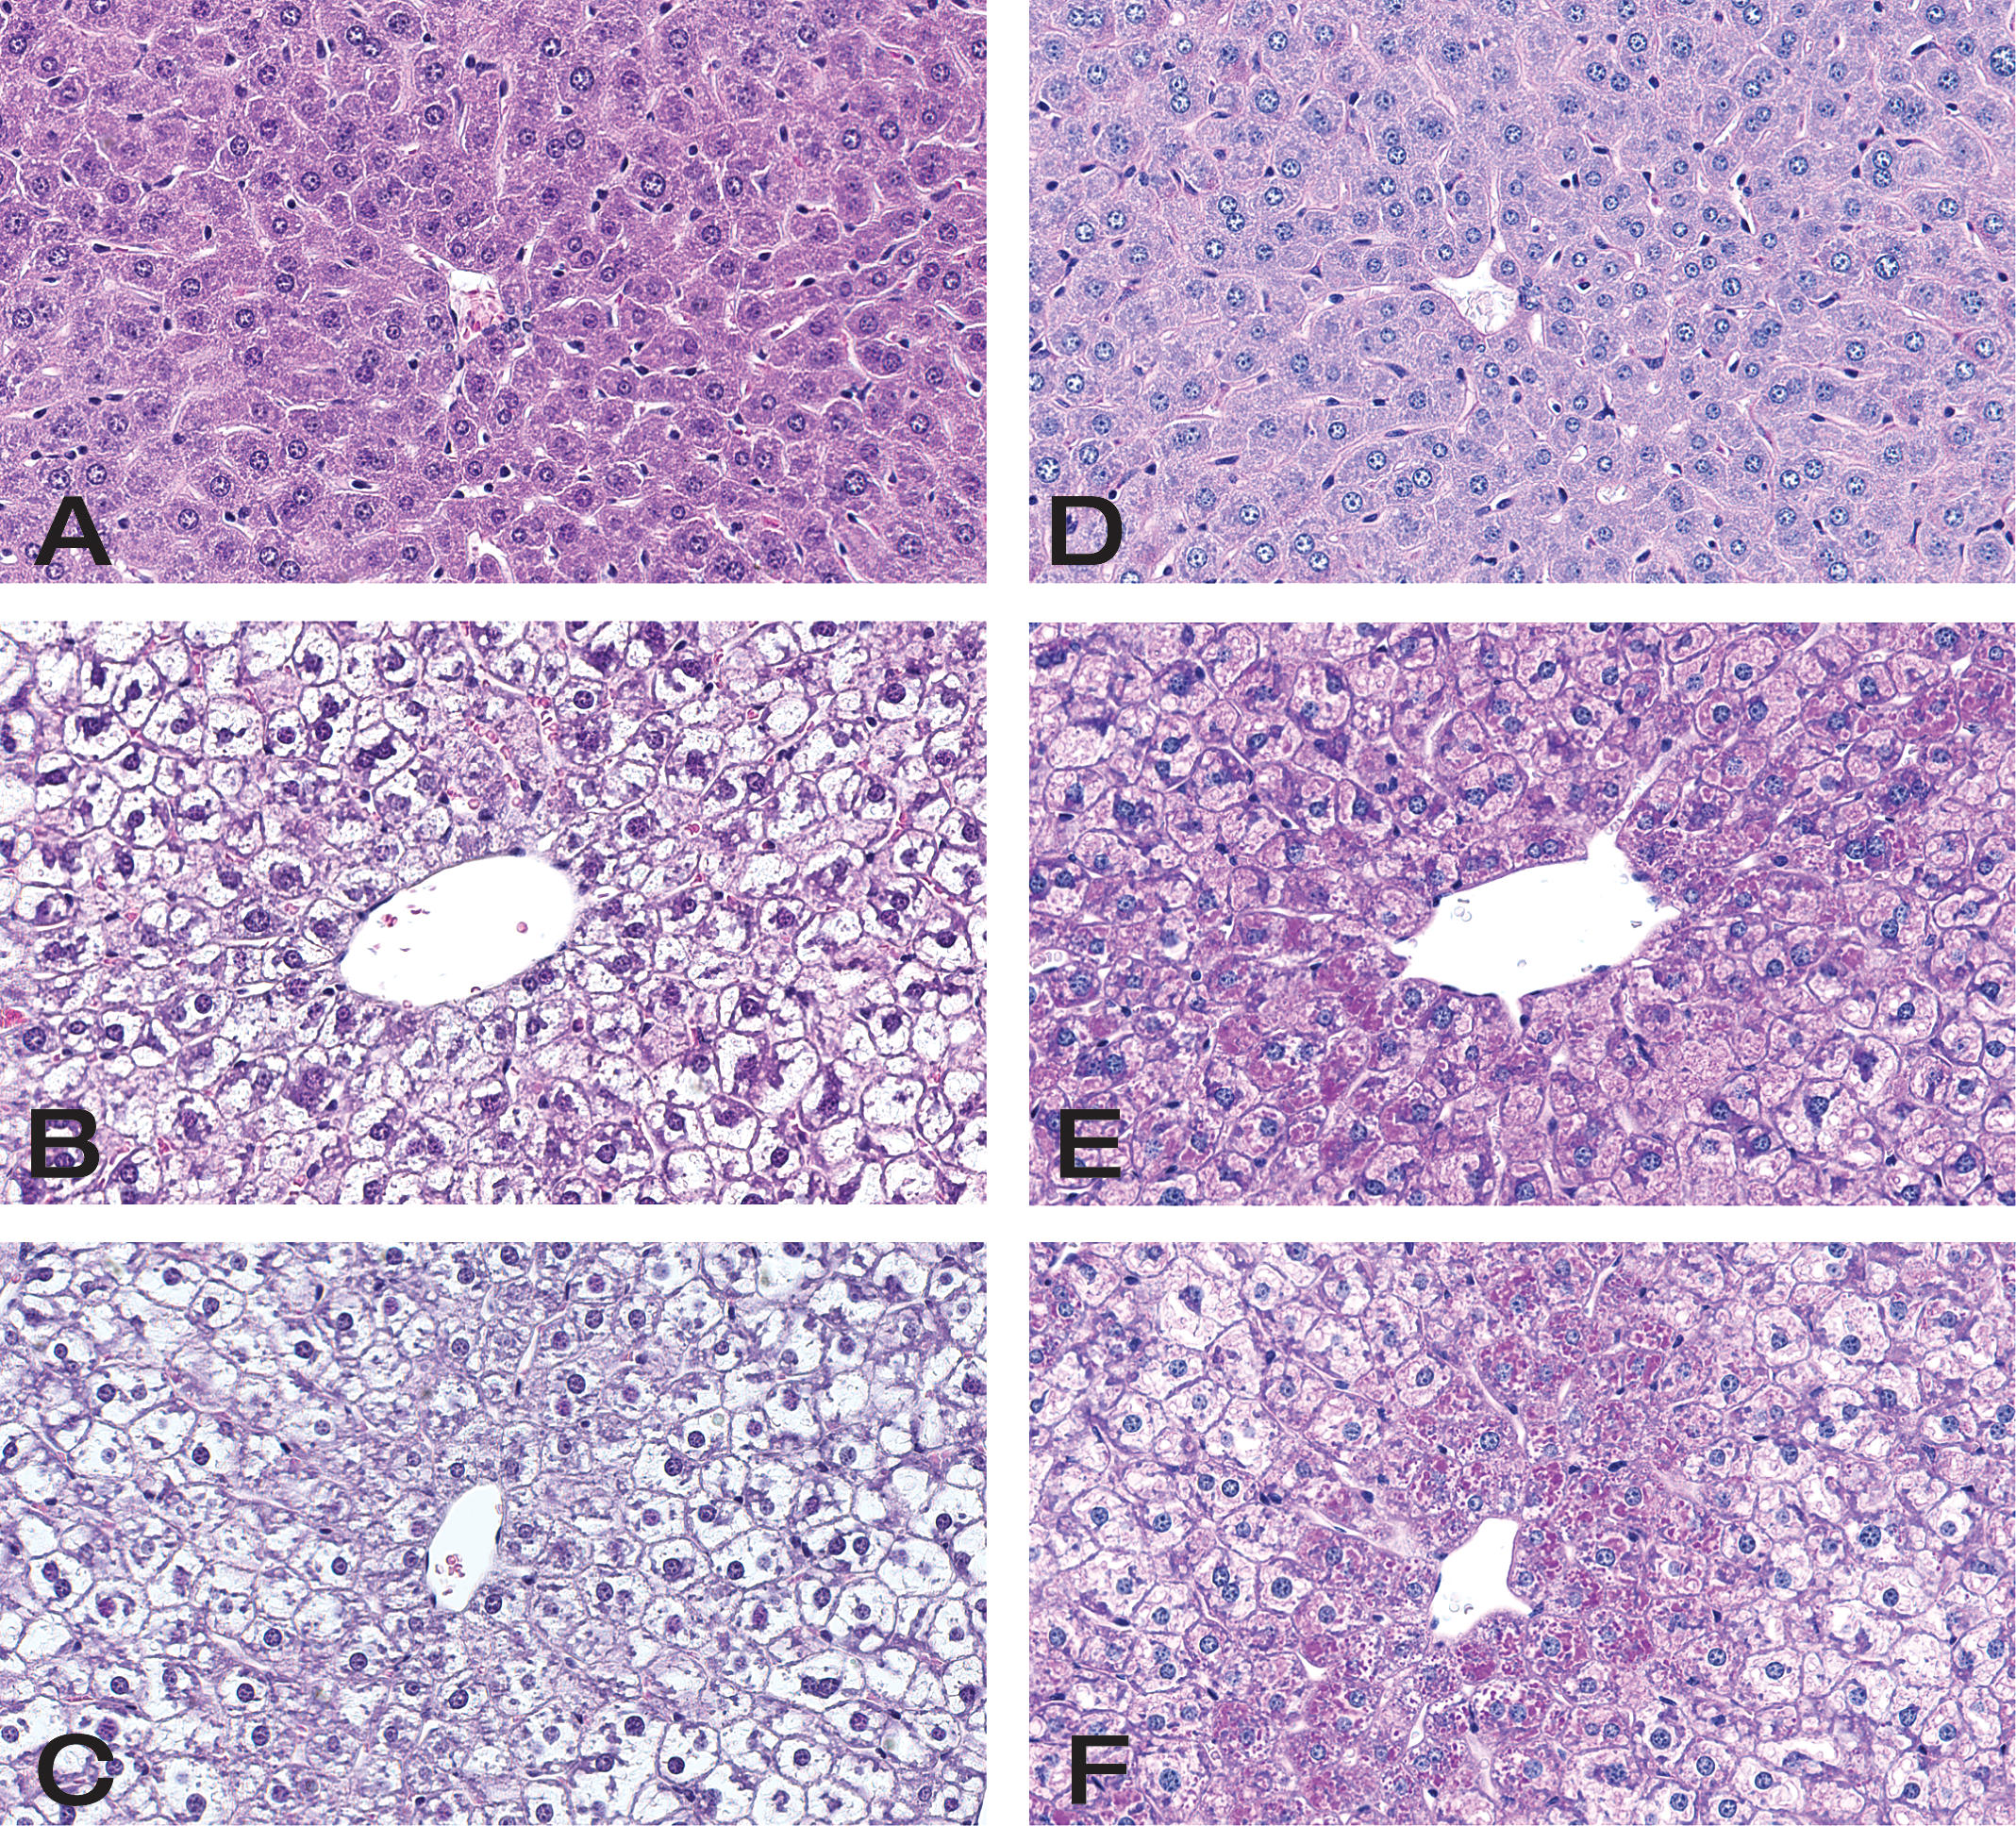
Histological sections of hematoxylin and eosin and PAS-stained livers from control and mice treated with dexamethasone for 24 hr. (A) Vehicle-treated control mouse, severity score 0, H&E; (B) mouse treated with 25 mg/kg of dexamethasone, severity score 3, H&E; (C) mouse treated with 75 mg/kg of dexamethasone, severity score 3, H&E. Vacuolar change was graded using the following scale 0 = none, 1 = minimal, 2 = mild, and 3 = moderate. (D), (E), and (F) are sections from same mice noted above, vehicle, 25 mg/kg, and 75 mg/kg dexamethasone-treated animals, respectively, stained with PAS. Dexamethasone treated mice show PAS positive staining material compatible with glycogen accumulation. All vacuoles did not contain PAS positive material but this likely represents the fact that the much of the glycogen was washed out in processing. Original magnification ×400.
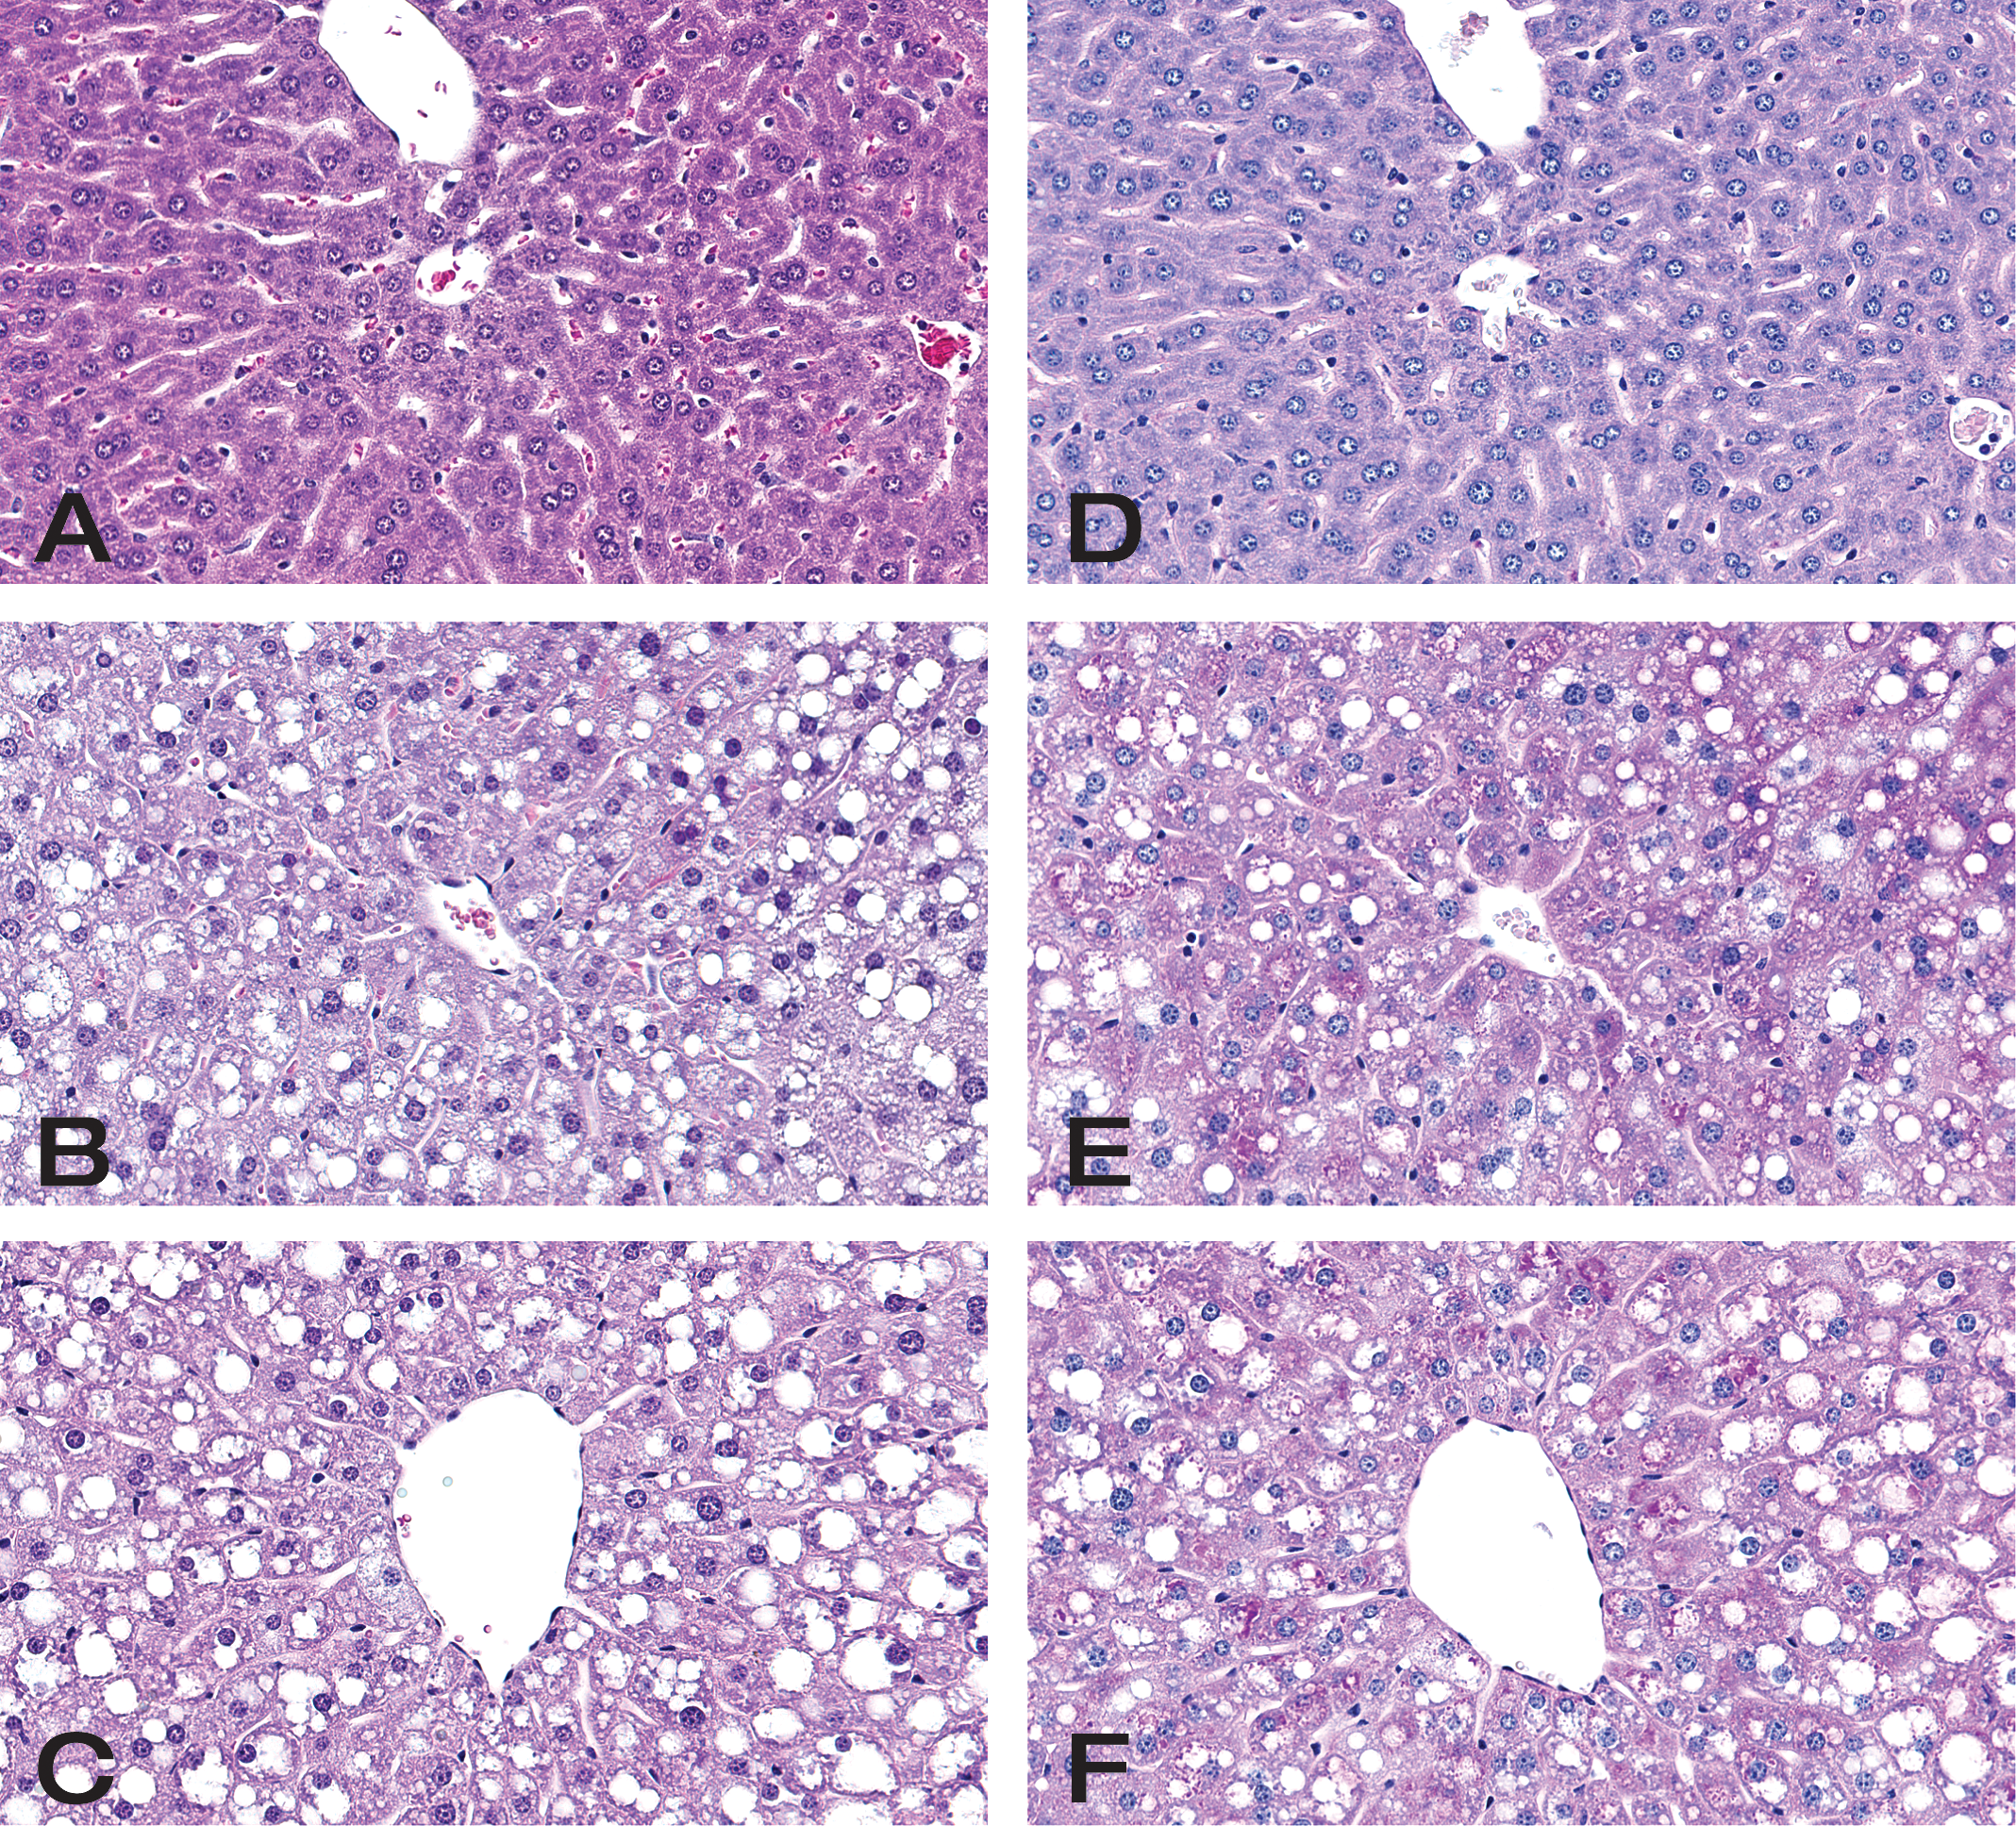
Histological sections of hematoxylin and eosin and PAS-stained livers from control and mice treated with dexamethasone for 72 hr. (A) Vehicle-treated control mouse, severity score 0, H&E; (B) mouse treated with 25 mg/kg of dexamethasone, severity score 2, H&E; (C) mouse treated with 75 mg/kg of dexamethasone, severity score 2, H&E. Vacuolar change was graded using the following scale 0 = none, 1 = minimal, 2 = mild, and 3 = moderate. (D), (E), and (F) are the sections from same mice noted above, vehicle, 25 mg/kg, and 75 mg/kg dexamethasone-treated animals, respectively, stained with PAS. Dexamethasone-treated mice show PAS positive staining material compatible with glycogen accumulation. All vacuoles did not contain PAS positive material but this likely represents the fact that the much of the glycogen was washed out in processing. Original magnification ×400.
Histological assessment of vacuolar change/glycogen content of livers.
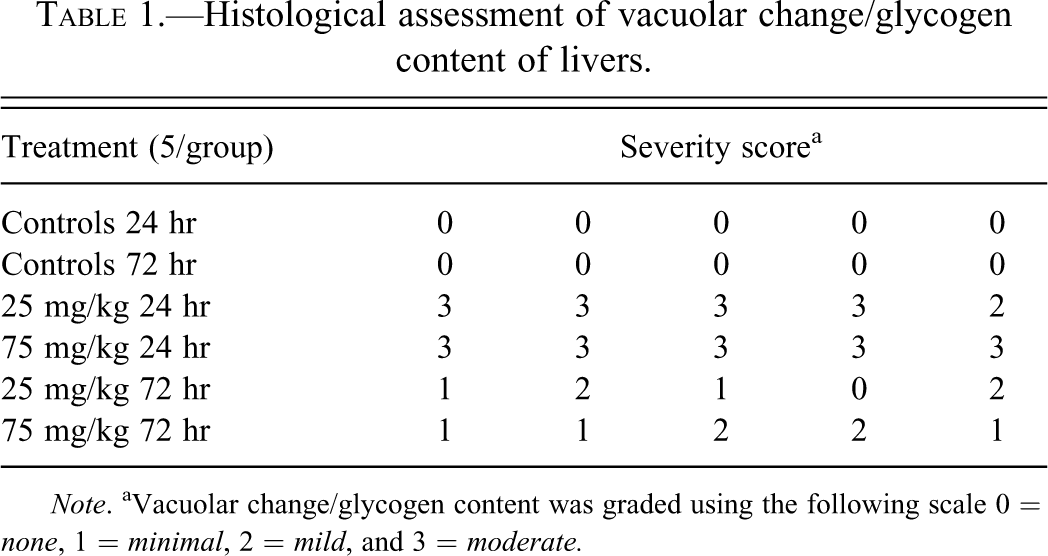
Note. aVacuolar change/glycogen content was graded using the following scale 0 = none, 1 = minimal, 2 = mild, and 3 = moderate.
To see whether liver ALT increases may be reflective of serum ALT levels, total serum ALT activity was assessed in conjunction with other common liver enzymes. We did not measure serum isoenzyme activity because no optimized technique was available.
There was a significant increase (p < .01) in serum total ALT activity at 24 hr but not at 72 hr compared to controls (Figure 9.). Mean serum ALT concentrations were increased 2.1-fold in the 75 mg/kg dose group at 24 hr. There were no significant increases in serum GLDH, AST, or ALP at either time points (data are not shown).
Total serum ALT activity in mice treated with dexamethasone. Data are expressed as mean ± standard deviation. Asterisk indicates p value ≤ .01.
Discussion
Total serum ALT activity has historically been used as a marker of hepatocellular injury due to the greatest concentration of this enzyme present in liver relative to other tissues (Boyd 1983), as well as its rapid release into the circulation after treatment with hepatotoxicants (Giffen et al. 2002; O'Brien et al. 2002). Although there are greater concentrations of ALT in the liver, this enzyme is not liver specific and is also present in other tissues, including skeletal muscle, heart, intestine, fat, kidney, and brain (Boyd 1983). ALT plays a significant role in gluconeogenesis and amino acid metabolism and thus is not just a marker of cellular injury. Therefore, increases in ALT in the circulation may not always indicate liver injury but could be elevated due to release from other tissues as well as associated with a metabolic adaptive response in the liver. It has been shown that people treated with PPARα agonists have increases in ALT and AST and this was thought to be indicative of an adaptive response due to enzyme induction and not hepatocellular injury (Thulin et al. 2008). There is also a relationship between the levels of ALT and insulin levels in obese patients, which is thought to be due to the increase in gluconeogenesis needed in the face of insulin resistance (Iacobellis et al. 2007).
Recently, there has been a much better understanding of the different forms of ALT that are present in the liver and other tissues. The genes for ALT1 and ALT2 have been cloned from mice (Jadhao et al. 2004), humans (Sohocki et al. 1997; Yang et al. 2002), and recently rats (Yang et al. 2009). In humans, the original ALT gene that was cloned was designated GPT (Sohocki et al. 1997; Yang et al. 2002). Gong et al. cloned and expressed a homolog of GPT, which has been designated GPT2 (Yang et al. 2002). GPT2 (ALT2) shares about 68% identity at the protein level compared to GPT (ALT1) and has been shown to have functional ALT activity. The expression of GPT2 by Northern blot analysis occurred mainly in the muscle, kidney, liver, brain, and fat (Yang et al. 2002). There was moderate expression of GPT in the kidney, liver, heart, and fat. In mice, the cDNA of ALT1 and ALT2 have also been cloned (Jadhao et al. 2004). Based on the expected peptide sequence, murine ALT1 and murine ALT2 share 87% and 93% identity, respectively, with the human peptide sequence. Murine ALT1 is highly expressed in the colon, white fat, intestine, and liver. Murine ALT2 is mainly expressed in the muscle, liver, and white fat, and to a lesser extent in brain, kidney, and heart. Although the initial characterization of the ALT isoenzymes, in mice has been documented, how they adapt to different metabolic conditions is not well understood.
New tools developed in our group (Yang et al. 2009) have allowed us to measure these ALT isoenzymes, and we have applied these tools to better understand the response seen in the liver of mice treated with dexamethasone, which is known to induce a progluconeogenic metabolic response. We compared the total ALT activity response in the liver to the isoenzyme response, by both Western blot, which assesses protein concentration, and by an activity-based assay. An activity-based assessment of ALT is used more commonly in preclinical and clinical safety assessment than assays that are dependent on antibodies to assess protein concentration.
We showed by the standard activity-based assay that total ALT increased in the liver of mice treated with dexamethasone at 72 hr, but not at 24 hr. The isoenzyme response assessed by Western blot showed an increase in ALT2 at 24 and 72 hr postdose. RNA expression data also showed that there was an increase in ALT2 expression at both time points and no increase in ALT1 expression. Therefore, the differential expression of ALT1 and ALT2 is at least partially regulated at the gene level. We did not determine whether this was due to an increase in transcription rate. Gene regulation of ALT1 is better understood than for ALT2. Increases in ALT1 mRNA have been documented in HepG2 cells, primary hepatocyte cultures, and human hepatoma cells (HuH-7) treated with fenofibric acid (Edgar et al. 1998; Thulin et al. 2008). Cytosolic AST mRNA was also measured and shown to be increased in HepG2 cells (Edgar et al. 1998). The increase in ALT1 and cytosolic AST was shown to be at least partially regulated by increases in transcription rate, based on nuclear run-on assays. Total ALT enzyme activity was also increased in the HepG2 cells and there was no indication of cellular damage based on morphological assessment, LDH leakage, or neutral red uptake (Edgar et al. 1998). Interestingly, it was further shown that ALT1 expression decreases in C57BL/6 mice treated with fibrates and this effect is reversed in PPARα deficient mice. The PPAR effect of ALT1 is thought to be a direct transcriptional mechanism involving a PPAR response element/elements, which was identified in the promoter region of the human ALT1 gene (Thulin et al. 2008).
Assessing the liver isoenzyme response by the activity-based assay showed there was a minimal increase in ALT1 at 72 hr in animals treated with 25 and 75 mg/kg of dexamethasone when comparing to the concurrent controls, but this effect was not remarkable when also comparing to the controls at 24 hr. There was an increase (1.8- to 2.5-fold increase) in ALT2 isoenzyme activity at 72 hr. There was also an increase in ALT2 isoenzyme activity seen as early as 24-hr postdose, but this was not reflected in an increase in total ALT. This may be due to the relatively limited overall percentage of ALT2 that is present in the liver relative to the amount of ALT1. Four to twenty percent of the ALT enzyme is the mitochondrial form, ALT2 (Kafer and Pollak 1961; Katunuma et al. 1962; Swick, Barnstein, and Stange 1965).
There was a good correlation comparing the ALT2 activity-based assay to the ALT2 Western blot results (R2 = .757). In contrast, no increase in ALT1 was noted at either time point by Western blot. Overall, there was a poor correlation of the results of ALT1 determined by the activity-based assay versus by Western blot analysis (R2 = .002). The narrow range of values used to assess any correlation between these two techniques could have contributed to the poor R2 value determined.
The increases in the ALT isoenzymes in the liver were associated with an increase in glycogen accumulation in the liver. Dexamethasone is known to increase glycogen storage in the liver, which is mainly due to an increase in the enzyme glycogen synthase, but also in some cases thought to inhibit glycogen phosphorylase which is critical in glycogen utilization (Baque et al. 1996; La Loux, Stalmans, and Hers 1983). This metabolic state would likely lead to an inability to utilize glycogen effectively for glucose production and thus further stimulate a hepatic metabolic progluconeogenic response. Dexamethasone was shown to increase glycogen and total liver ALT in a time course study in rats (Jackson et al. 2008). Total liver ALT will increase not only in response to corticosteroids but also have been shown to increase in response to dietary protein, fasting, and in diabetic animals (Rosen, Roberts, and Nichol 1959), all of which can be stimuli for gluconeogenesis. Hagopian showed that short-term (1 month) and long-term (28 months) calorie restriction in mice showed significant increases in liver transaminases including ALT and AST as well as multiple other gluconeogenic enzymes, including pyruvate carboxylase, phosphoenopyruvate carboxykinase, fructose-1-6-biphosphatase, and glucose-6-phosphatase (Hagopian, Ramsey, and Weindruch 2003). The transaminases are important to effectively utilize amino acids for gluconeogenesis during caloric restriction. Since we did not assess food consumption in this study, we cannot assess the role this may have played in the increases in liver ALT, although dexamethasone has been shown to increase food consumption in diet-induced obese mice (Gounarides et al. 2008 ). Both ALT isoenzymes catalyze the reversible reaction transferring α amino group of alanine to the α keto group of oxoketoglutarate to form pyruvate and glutamate. Some suggest the mitochondrial form, ALT2, favors the forward ALT reaction, thus being more progluconeogenic (Swick, Barnstein, and Stange 1965) and therefore it is reasonable to hypothesize that an ALT2 response may be greater than an ALT1 response during these conditions and our results support this hypothesis. It has been shown previously using classical biochemical purification techniques that glucocorticoids will increase the amount of the mitochondrial form of ALT in the rat liver (Swick, Barnstein, and Stange 1965). We now have the ability to measure ALT1 and ALT2 with antibody and activity-based assays, which will provide an easier way to try to measure these different isoenzymes and to better understand how they respond to different drug treatments.
Total serum ALT activity increased in mice treated with dexamethasone at 24 hr. Due to the increase of ALT2 in the liver at 24 hr, the increase in ALT in the serum may be due to ALT2 released from the hepatocytes but we were unable to measure serum isoenzymes because an optimized assay was not available. There were no increases in total serum ALT at 72 hr but this may have been due to variability in the total serum ALT levels in the control mice at this time point. The release of ALT into the circulation may have occurred due to the normal hepatocellular turnover since there was no indication of hepatocellular damage based on the lack of histologial evidence of hepatocellular necrosis as well as the lack of increase in other hepatocellular enzymes in the serum. Gores et al. described a process of membrane blebbing, which can result in serum ALT increases without frank necrosis (1990). Thus, the ALT response in the serum may be due to the release of ALT from the liver without the loss of cell integrity. Recently, Diaz-Juarez et al. (2006) reported that, during partial hepatectomy-induced liver regeneration in rats, liver mitochondrial proteins appear to be released predominantly in the serum without evidence of mitochondrial injury. Liu et al. showed that serum and liver ALT2 protein levels increased 1.9- and 4.7-fold, and ALT1 increased 1.7- and 2.3-folds, respectively, in an experimental nonalcoholic steatohepatitis (NASH) mouse model with no evidence of hepatocellular necrosis (Liu, Pan, and Whitington 2009). ALT1 and ALT2 in the liver appear to have unique responses to different pathophysiological conditions, such as metabolic adaptation seen after dexamethasone treatment, which indicates a potential diagnostic value of these isoenzymes. Optimization of an assay to measure serum ALT isoenzymes will be necessary to determine whether the isoenzyme response in the liver truly reflect those seen in the peripheral blood. It has been suggested in preclinical species that a 2- to 4-fold increase or higher of serum ALT in individuals or group mean data should be an indicator of potential adverse hepatic injury unless an alternative explanation can be found for the increase (Boone et al. 2005). To determine whether an ALT elevation is adverse or not depends on multiple variables including what are the changes in other hepatocellular and hepatobiliary enzymes, liver function parameters, organ weight, macroscopic and microscopic examination, enzyme induction data, and relationship to dose and duration (Boone et al. 2005). Measurement of ALT isoenzymes may provide an additional tool to assess if an elevation in ALT is adverse or not. Additional work is needed to understand the kinetics of ALT1 and ALT2 in response to other compounds that cause metabolic adaptation as well as those that cause hepatocellular injury to further show that a metabolic adaptive isoenzyme response can be distinguished from a hepatic injury response.
Footnotes
Acknowledgment
The authors thank Carlin Okerberg for assistance with photomicrographs.
This research was supported in part by a grant to the Gong research laboratory from Pfizer Worldwide Research and Development. The study was partially supported by grants of the Mid-Atlantic Nutrition and Obesity Research Center (DK072488), the Baltimore Diabetes Research and Training Center, from the National Institutes of Health.