
Abstract
We investigated the kinetics of circulating biomarker elevation, specifically correlated with morphology in acute myocardial injury. Male Hanover Wistar rats underwent biomarker and morphologic cardiac evaluation at 0.5 to seventy-two hours after a single subcutaneous isoproterenol administration (100 or 4000 µg/kg). Dose-dependent elevations of serum cardiac troponins I and T (cTnI, cTnT), and heart fatty acid–binding protein (H-FABP) occurred from 0.5 hour, peaked at two to three hours, and declined to baseline by twelve hours (H-FABP) or forty-eight to seventy-two hours (Serum cTns). They were more sensitive in detecting cardiomyocyte damage than other serum biomarkers. The Access 2 platform, an automated chemiluminescence analyzer (Beckman Coulter), showed the greatest cTnI fold-changes and low range sensitivity. Myocardial injury was detected morphologically from 0.5 hour, correlating well with loss of cTnI immunoreactivity and serum biomarker elevation at early time points. Ultrastructurally, there was no evidence of cardiomyocyte death at 0.5 hour. After three hours, a clear temporal disconnect occurred: lesion scores increased with declining cTnI, cTnT, and H-FABP values. Serum cTns are sensitive and specific markers for detecting acute/active cardiomyocyte injury in this rat model. Heart fatty acid–binding protein is a good early marker but is less sensitive and nonspecific. Release of these biomarkers begins early in myocardial injury, prior to necrosis. Assessment of cTn merits increased consideration for routine screening of acute/ongoing cardiomyocyte injury in rat toxicity studies.
Keywords
Introduction
In man, serum levels of cardiac troponin I (cTnI) and cardiac troponin T (cTnT) are widely used in the detection of acute myocardial infarction and to a lesser extent, a range of other cardiac conditions (Adamcova et al. 2005; Apple et al. 2005; Christenson and Azzazy 1998; Dolci and Panteghini 2006; Dybdahl et al. 2005; Mair 1997; Panteghini 2004). Although the use of serum cardiac troponins (cTn) in the detection of cardiac injury (Adamcova et al. 2005; Bertinchant et al. 2000; Bertsch et al. 1999; Herman et al. 1998; Walker 2006; York et al. 2007) is not as well established in laboratory animal species, one of the most rapidly growing applications is in preclinical toxicity testing. Wallace et al. (2004) reviewed the usefulness of cTn as biomarkers of drug-induced cardiac toxicity in preclinical safety assessment studies.
To refine and improve the spectrum, accuracy and clinical predictivity of preclinical toxicologic biomarkers and to strengthen the interface between preclinical laboratory studies and clinical trials, the ILSI HESI Cardiac Troponins Working Group concluded that additional validation work was required for serum cTn and other circulating biomarkers. This work would investigate the kinetics of serum cTn and H-FABP release following acute injury, the association with histopathological changes, the variability of different assay platforms within and between species, and any potential diagnostic advantages offered by individual cTn measurements or their combination. The data were expected to contribute interpretive guidance in relation to serum biomarkers of cardiomyocyte injury.
Administration of isoproterenol (ISO), a potent, short-acting, synthetic β agonist, at high doses in the rat rapidly induces infarct-like areas of myocardial necrosis; the severity of the lesion is directly proportional to the dosage administered (Ferrans et al. 1969; Rona et al. 1959). Several studies investigating the utility of cardiac troponins in rat models of adrenoceptor agonist–induced cardiac damage have been published (Table 1 ). Serum cTnT and cTnI concentrations were reported to be increased as early as one hour post-dosing (50,000 µg/kg i.p.) in female Hanover Wistar rats and to be superior to the other markers in cardiac tissue specificity and magnitude of change (York et al. 2007). Increases in cTn precede the onset of significant light microscopic changes, particularly at low ISO doses. The magnitude of cardiac Tn elevations generally correlate well with the progression of associated cardiac histologic lesion(s) observed at later time points (≥ one hour) and/or higher doses (Bertinchant et al. 2000; Herman et al. 2006; O’Brien et al. 2006; York et al. 2007).
Summary of previous biomarker validation time course studies conducted with ISO or orciprenaline in the rat.
a In these studies, histopathologic assessment was conducted only at the specified time points (in addition to clinical biochemistry).
b This study used the β-adrenergic agonist orciprenaline.
Transmission electron microscopic (TEM) investigations have shown that cardiomyocyte damage was not detected until one hour following a high single s.c. dose of 100,000 µg/kg ISO in the rat (Noronha-Dutra et al. 1984). Therefore, it is not known whether elevated biomarker levels and/or morphological changes are present in the earliest stages of myocardial injury (less than one hour) prior to morphological changes consistent with myofiber necrosis.
More recently, H-FABP (Fabp3) has been investigated as an early marker for cardiomyocyte injury and associated cell membrane disruption in man and the rat (Alhaidi and Fox 2004; Glatz et al. 2002; Knowlton et al. 1989; Meng et al. 2006; Zhen et al. 2007). This low molecular weight protein (15 kDa) is abundant in cardiac muscle, rapidly released following the onset of cardiomyocyte injury, and its use in conjunction with cardiac troponin measurement has been advocated in the diagnosis of myocardial injury (Glatz et al. 2002; Meng et al. 2006). However, it does lack cardiospecificity, with significant distribution in skeletal muscle in the rat, particularly in the soleus muscle, which is abundant in type I myofibers and is elevated in skeletal muscle injury (Zhen et al. 2007).
The purpose of the present study was to provide a more expansive investigation into the onset and magnitude of serum cTn increases between 0.5 and seventy-two hours following administration of single s.c. doses of ISO in male Hanover Wistar rats; to assess the onset and nature of microscopic cardiac changes; and to correlate results with cTn data (generated using three different analytical platforms) and with a variety of other blood biomarkers including H-FABP. The dose of 100 µg/kg was selected as a low-threshold dose to investigate the sensitivity of different platforms measuring cTn, compared with traditional biomarkers and morphological changes. It is the first time course study of ISO-induced cardiotoxicity in the rat that provides analysis at early time points; direct comparison of the magnitude and kinetics of serum cTn and plasma H-FABP with detailed characterization and specific correlation of concurrent histopathologic cardiac lesions; ultrastructural investigation, and the use of anti-cTnI immunohistochemistry (IHC).
Preliminary findings of these investigations have been reported in abstract and thesis forms (Brady 2008; Clements et al. 2008).
Materials and Methods
Animals
Male Hanover Wistar rats (Harlan UK, Oxon, UK) were allowed to acclimatize for at least seven days before the study commenced. The animals (N = 170; eight to ten weeks of age; mean weight 228.7 g) were randomly assigned to thirty-four groups (n = five/group). Each group occupied one cage, with ad libitum access to diet (Extruded Global Rodent Diet, Harlan Teklad, Oxon, UK) and tap water. Environmental conditions were temperature: 20°C ± 2°C; light: regular twelve-hour light/dark cycle, lights on at 7:00 AM; relative humidity: 40–60%. Animals were weighed daily throughout the acclimatization and study periods. All animal procedures were conducted under local ethical committee guidelines and approval for Home Office Project and Personal Licenses, and followed the U.K. Home Office (1989) Code of Practice for the Housing and Care of Animals Used in Scientific Procedures.
Administration of ISO
Isoproterenol hydrochloride (Sigma-Aldrich Ltd., UK) was dissolved in phosphate buffered saline (PBS) at concentrations of 20 and 800 µg/mL. Solutions were prepared fresh and used within 30 minutes of preparation. Animals were given a single s.c. injection of ISO at levels of 0 (PBS, vehicle control), 100, or 4000 µg/kg. Body weights were recorded immediately before PBS/ISO administration, daily up to seventy-two hours post-dosing, and before necropsy.
Necropsy Procedures and Sample Collection
Animals from each ISO dose level (0, 100, and 4000 µg/kg) were evaluated at 0.5, one, two, three, four, six, eight, twelve, twenty-four, forty-eight, and seventy-two hours post-dosing for clinical chemistry and cardiac histology. An additional group of control (vehicle-treated) rats were similarly evaluated at 0 hour (time of ISO administration). At necropsy, animals were killed by exsanguination under deep isoflurane (Abbott Laboratories Ltd, UK) anesthesia. Blood was drawn from the abdominal aorta for the preparation of serum and plasma.
Serum/Plasma Clinical Chemistry
Serum Clinical Chemistry
Blood was collected into Microtainer SST tubes (Microtainer, Becton Dickinson), allowed to stand for 2.5 hours, and centrifuged for five minutes at 2500 relative centrifugal force (RCF). Serum was removed and stored at -80°C until analysis. Serum cardiac troponin I (cTnI) levels were measured by automated immunochemiluminescence on the ACS: 180SE (Bayer Diagnostics; Bayer platform) as previously described (York et al. 2007), or on the Beckman Coulter Access 2 (Beckman platform), an automated chemiluminescent immunoassay system using Access AccuTnI reagents (Beckman Coulter Clinical Diagnostics Division, CA, USA). Manufacturer-established lower limits of detection for these assays were 0.03 and 0.006 µg/L, respectively. Serum cardiac troponin T (cTnT) levels were measured by automated immunochemiluminescence on the Elecsys 2010 (Roche Diagnostics, UK; Roche platform), with a lower limit of detection of 0.01 ug/L. Confirmation of the cross-reactivity of the respective assays with rat cTn had been demonstrated previously (Apple et al. 2008).
Serum samples were analyzed on the Advia 1650 (Bayer Diagnostics) for levels of aspartate aminotransferase (AST), total lactate dehydrogenase (LD), and total creatine kinase (CK) activity. Heart fatty acid–binding protein (H-FABP) was measured by a rat-specific, solid-phase enzyme-linked immunosorbent assay (ELISA: Hycult Biotechnology, The Netherlands).
Plasma Clinical Chemistry
Blood was collected into lithium heparin microtainer tubes (Microtainer PST LH, Becton Dickinson, Franklin Lakes, NJ, USA), mixed for five minutes, and centrifuged for five minutes at 3500 RCF. Plasma was stored at -80°C until analysis. Plasma total creatine kinase (CK) and total lactate dehydrogenase (LD) activities were analyzed on the Advia 1650 (Bayer Diagnostics, Newbury, Berkshire, UK) using the manufacturer’s assay kits. Lactate dehydrogenase isoenzyme (LD1-5) and CK isoenzyme (CK-BB, CK-MB, CK-MM) activities were measured by electrophoresis on the SAS-1 plus / SAS-2 Platinum Electrophoresis System (Helena Biosciences Europe, Sunderland, UK).
Histopathologic Techniques
At necropsy, hearts were weighed and placed in 10% neutral buffered formalin for a minimum of fourteen days. Hearts were cut and trimmed to generate a single block containing a longitudinal section of both atria/basal ventricles, a transverse section of the left and right mid-ventricular region, and a longitudinal section of the left and right ventricular apex (Isaacs 1998). Three-micrometer paraffin sections were stained with hematoxylin and eosin (H&E). Selected sections of hearts were stained with Martius's Scarlet Blue (MSB) and phosphotungstic acid hematoxylin (PTAH) according to standard methods. Sections from control and ISO-treated animals at each dose/time point were selected for immunostaining with goat anti-human cTnI antibody (BiosPacific, Emeryville, CA, USA; G-129-C) raised against cTnI peptide 3 (amino acids 27–40). Sections were dewaxed and incubated for fifteen minutes with 1% hydrogen peroxide/ethanol to inhibit endogenous peroxidase activity. Antigen retrieval was carried out by microwaving for twenty minutes in a high-pH target retrieval system (Dako, UK; S3308), then protein blocked with Dako Protein-Block Serum-free (X0909) for fifteen minutes. Incubation with primary antibody (10 µg/mL) was carried out at 4°C overnight. Additional sections were incubated with equivalent concentrations of goat F(ab′)2 IgG primary antibody (Serotec STAR118PE) as negative controls. Secondary antibody (biotinylated rabbit anti-goat diluted 1/100 (Dako E0466)) was added for thirty minutes at ambient temperature. Immunostaining was visualized using the streptavidin-ABC-HRP method (Dako K0377, K3466) according to the manufacturer’s instructions. Sections were counterstained in Mayer’s hematoxylin.
Transmission Electron Microscopy
Samples of formalin-fixed left apical ventricle/interventricular septum from one vehicle-treated control animal and all ISO-treated animals killed at the 0.5-hour time point (100 and 4000 µg/kg) were washed overnight in Millonig’s phosphate buffer. Tissue samples were then secondary fixed in 1% Millonig’s buffered osmium tetroxide (Agar Scientific, UK), dehydrated in graded alcohols, and infiltrated with/embedded into Agar 100 low-viscosity resin (Agar Scientific). Semi-thin (survey) sections of approximately 1 µm were cut and stained with toluidine blue (Agar Scientific). Areas of interest (i.e., myofibers showing evidence of morphologic changes) were determined by pathologist review (PC) of the toluidine blue sections. From survey sections, ultrathin sections (60 to 90 nm) were stained with uranyl acetate and lead citrate, and examined using a Hitachi H7500 transmission electron microscope (Hitachi-High Technologies, UK) operated at 60 kV.
Histopathologic Evaluation
A single standard section (H&E) from all control and ISO-treated animals was examined microscopically by one pathologist (PC). Findings were then independently peer-reviewed by two additional pathologists (BB and IM).
Lesions were graded semiquantitatively on a severity scale of 0 to 4: 0 = no abnormalities detected (NAD); 1 = minimal; 2 = mild; 3 = moderate; and 4 = marked (Table 2 ). The primary grading criterion was the number of affected myofibers in the left ventricle (LV) and interventricular septum (IVS). Lesion distribution was a secondary criterion.
Definitions of myocardial diagnostic terminology and lesion severity scores.
Immunostained sections were evaluated for the pattern and degree of positive cTnI-staining in cardiomyocytes.
Statistical Analysis
Data were analyzed using one-way analysis of variance (ANOVA) followed by Dunnett’s test for post hoc multiple comparison. In cases of violation of the assumptions for parametric testing, the Kruskal-Wallis test was used in combination with Dunn’s posttest. For correlation analyses, the two-tail Pearson test was used. Statistical analysis was performed using GraphPad Prism, version 3.00 for Windows (GraphPad software, CA, USA, April 1999).
Results
Survival
All animals survived to their scheduled kill.
Serum and Plasma Clinical Chemistry
Isoproterenol administration induced time- and dose-dependent changes of varying magnitude in all serum and plasma clinical chemistry parameters measured (except total AST, CK, LD, and CK-MBmass activities at 100µg/kg) and returned to comparability with controls by the end of the experimental period.
Serum cTnI (Bayer ACS: 180SE)
The group mean cTnI level at 4000 µg/kg ISO was elevated at 0.5 hour (0.718 µg/L, a twenty-four–fold increase over the concurrent control mean value of 0.030 µg/L [p < .001]; Figure 1 ). At this dose, group mean cTnI peaked at three hours, at 20.540 µg/L, a 685-fold elevation above the concurrent control value (0.030 µg/L; p < .001). At 100 µg/kg ISO, the group mean cTnI concentration at 0.5 hour was 0.440 µg/L (a fifteen-fold increase; p < .05) and peaked at two hours (Figure 2 ), 196-fold above the concurrent control mean, at 5.878 µg/L (p < .05). At forty-eight hours and seventy-two hours, cTnI levels in both dose groups were comparable to concurrent control values (≤ 0.030 µg/L).
Group mean serum cardiac troponin (cTn) levels in rats treated with a single subcutaneous dose of isoproterenol (ISO) at 0 (control) and 4000 µg/kg at time points up to seventy-two hours post-dosing, measured using the Bayer ACS: 180S, Beckman Access, and Roche Elecsys platforms. Values are means, SD as error bars; n = 5 for control and ISO-treated rats, except at 0 hour, one hour, two hours, and three hours 0 µg/kg (control), and at eight hours, 4000 µg/kg, where n = 4.
Group mean serum cardiac troponin I (cTnI) levels in rats treated with a single subcutaneous dose of isoproterenol (ISO) at 0 (control), 100 µg/kg at time points up to seventy-two hours post-dosing, using the Bayer ACS: 180S, Beckman Access, and Roche Elecsys platforms.Values are means, SD as error bars; n = 5 for control and ISO-treated rats, except at 0 hour, one hour, two hours, and three hours 0 µg/kg (control), and at twenty-four hours, 100 µg/kg, where n = 4.
Serum cTnI (Beckman Coulter Access 2)
The group mean cTnI level at 4000 µg/kg ISO was increased at 0.5 hour (0.936 µg/L, a 233-fold elevation above the concurrent control value, 0.004 µg/L; p < .001, Figure 1). The peak was at three hours, at a group mean value of 18.195 µg/L, a 3638-fold increase above the concurrent control mean (0.005 µg/L; p < .001). At seventy-two hours post-dosing, cTnI was still elevated fifteen-fold above concurrent control mean (p < .001). At 100 µg/kg ISO, the group mean serum cTnI level was 0.624 µg/L (p < .001), 155-fold above the concurrent control mean at 0.5 hour post-dosing (Figure 2). The peak in cTnI concentration occurred at the two-hour sampling point, where the group mean was 6.330 µg/L, a 2109-fold increase over the concurrent control mean value (0.003 µg/L; p < .05). At forty-eight and seventy-two hours, cTnI levels were at concurrent control values (≤ 0.03 µg/L).
Serum cTnT (Roche Elecsys 2010 )
The group mean cTnT level at 4000 µg/kg ISO was increased at 0.5 hour (0.240 µg/L, a twenty-four–fold increase above the mean concurrent control value of 0.010 µg/L (p < .001, Figure 1). It peaked at three hours post-dosing (3.374 µg/L, a 336-fold increase above control levels; p < .001). Levels of cTnT remained elevated above concurrent control values until forty-eight hours, twenty-nine–fold above the mean control value (NS). At 100 µg/kg ISO, group mean cTnT was elevated at 0.5 h, 0.132 µg/L, a thirteen-fold increase over the control value 0.010 µg/L (p < .001; Figure 2). At this dose, mean cTnT levels peaked at three hours, 1.200 µg/L, a 120-fold increase above control mean (0.010 µg/L; p < .05), and had returned to concurrent control levels (≤ 0.01 µg/L) by forty-eight hours.
Serum H-FABP
At 4000 µg/kg ISO, group mean serum H-FABP levels were greater than controls at 0.5 hour (25.74 ng/mL, a twenty-fold increase above the mean concurrent control value of 1.29 ng/mL; p < .001; Figure 3 ). At this dose, mean H-FABP peaked at two hours (36.87 ng/mL; a twenty-two–fold increase above the concurrent control value of 1.64 ng/mL; p < .001) and was comparable with the concurrent control mean at twelve hours. At 100 µg/kg ISO, H-FABP was greater than controls at 0.5 hour and one hour (NS), and from two hours, values were comparable with concurrent control levels. H-FABP values were variable at both dose levels, as shown by the large standard deviations at each time point.
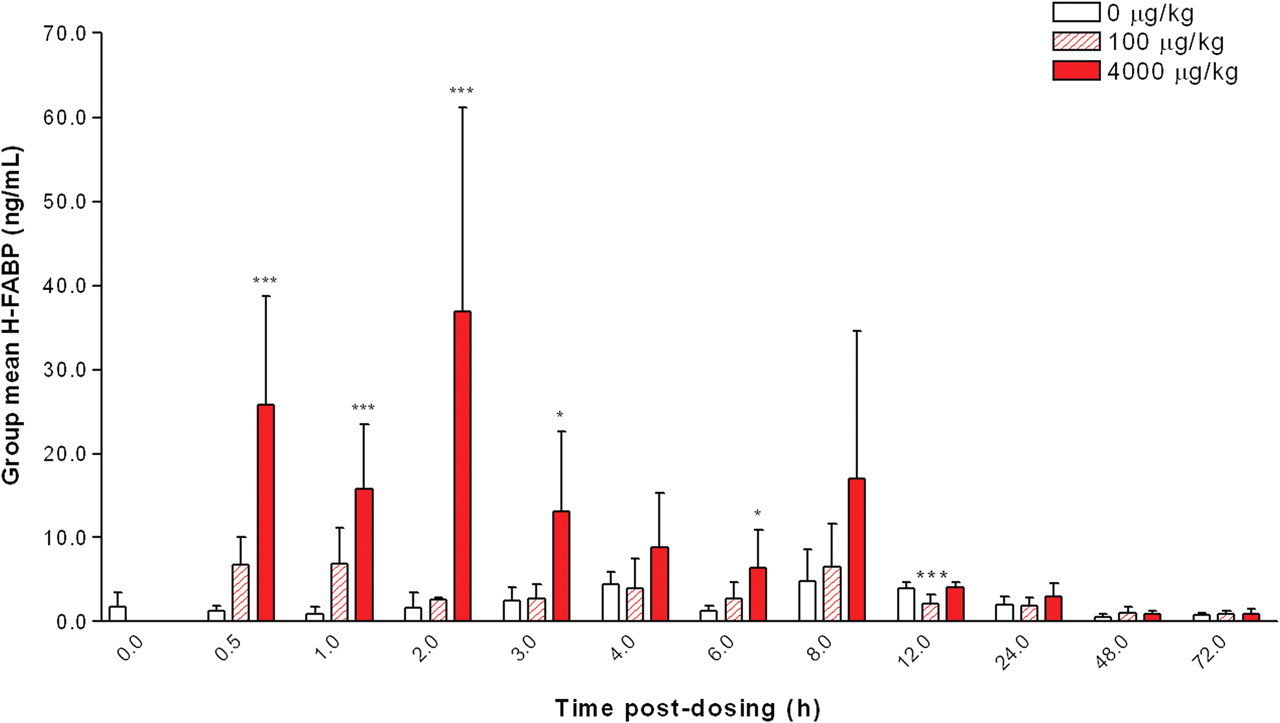
Group mean serum heart fatty acid–binding protein (H-FABP) levels in rats treated with a single subcutaneous dose of isoproterenol (ISO) at 0 (control), 100, and 4000 µg/kg at time points up to seventy-two hours post-dosing. Values are means, SD as error bars; n = 5 for control and ISO-treated rats, except at one hour, 0 µg/kg (control) and at eight hours, 4000 µg/kg, where n = 4. *Significantly different from the concurrent control, p < .05; *** p < .001.
Minimal and statistically significant changes were noted (generally at 4000 ug/kg) in the historical parameters (serum AST, plasma CK, CK-MB, and total LDH activities). At 100 μg/kg day, these parameters showed no difference from concurrent controls, with the exception of the LD isoenzymes.
Plasma LD isoenzymes (LD1, LD2)
At 100 µg/kg ISO, LD1 activities in some animals were greater than individual control levels at two hours, although this increase was not statistically significant. The mean LD2 activity was increased significantly (p < .05) at 0.5 hours. The peak in plasma LD2 in the rats treated with 100 µg/kg ISO occurred at four hours post-dosing, where the group mean activity was increased to 51.2 U/L, a 5.1-fold change (NS).
Relative Heart Weights
Administration of ISO at 4000 µg/kg induced significant increases in relative heart weights (to body weight) from six to seventy-two hours, with a maximal response (21% increase) observed at twenty-four hours compared with concurrent controls.
Histopathology
Light Microscopy
ISO-related histopathological changes (described in Table 2) were observed at all time points at 100 and 4000 µg/kg ISO and showed a temporal progression and a dose-dependent increase in severity (Table 3 ). Predilection sites for myocardial lesions were the subendocardial myocardium of the left ventricular apex/interventricular septum.
Correlation of light microscopic hematoxylin and eosin and cTnI IHC findings with mean circulating cTnI.
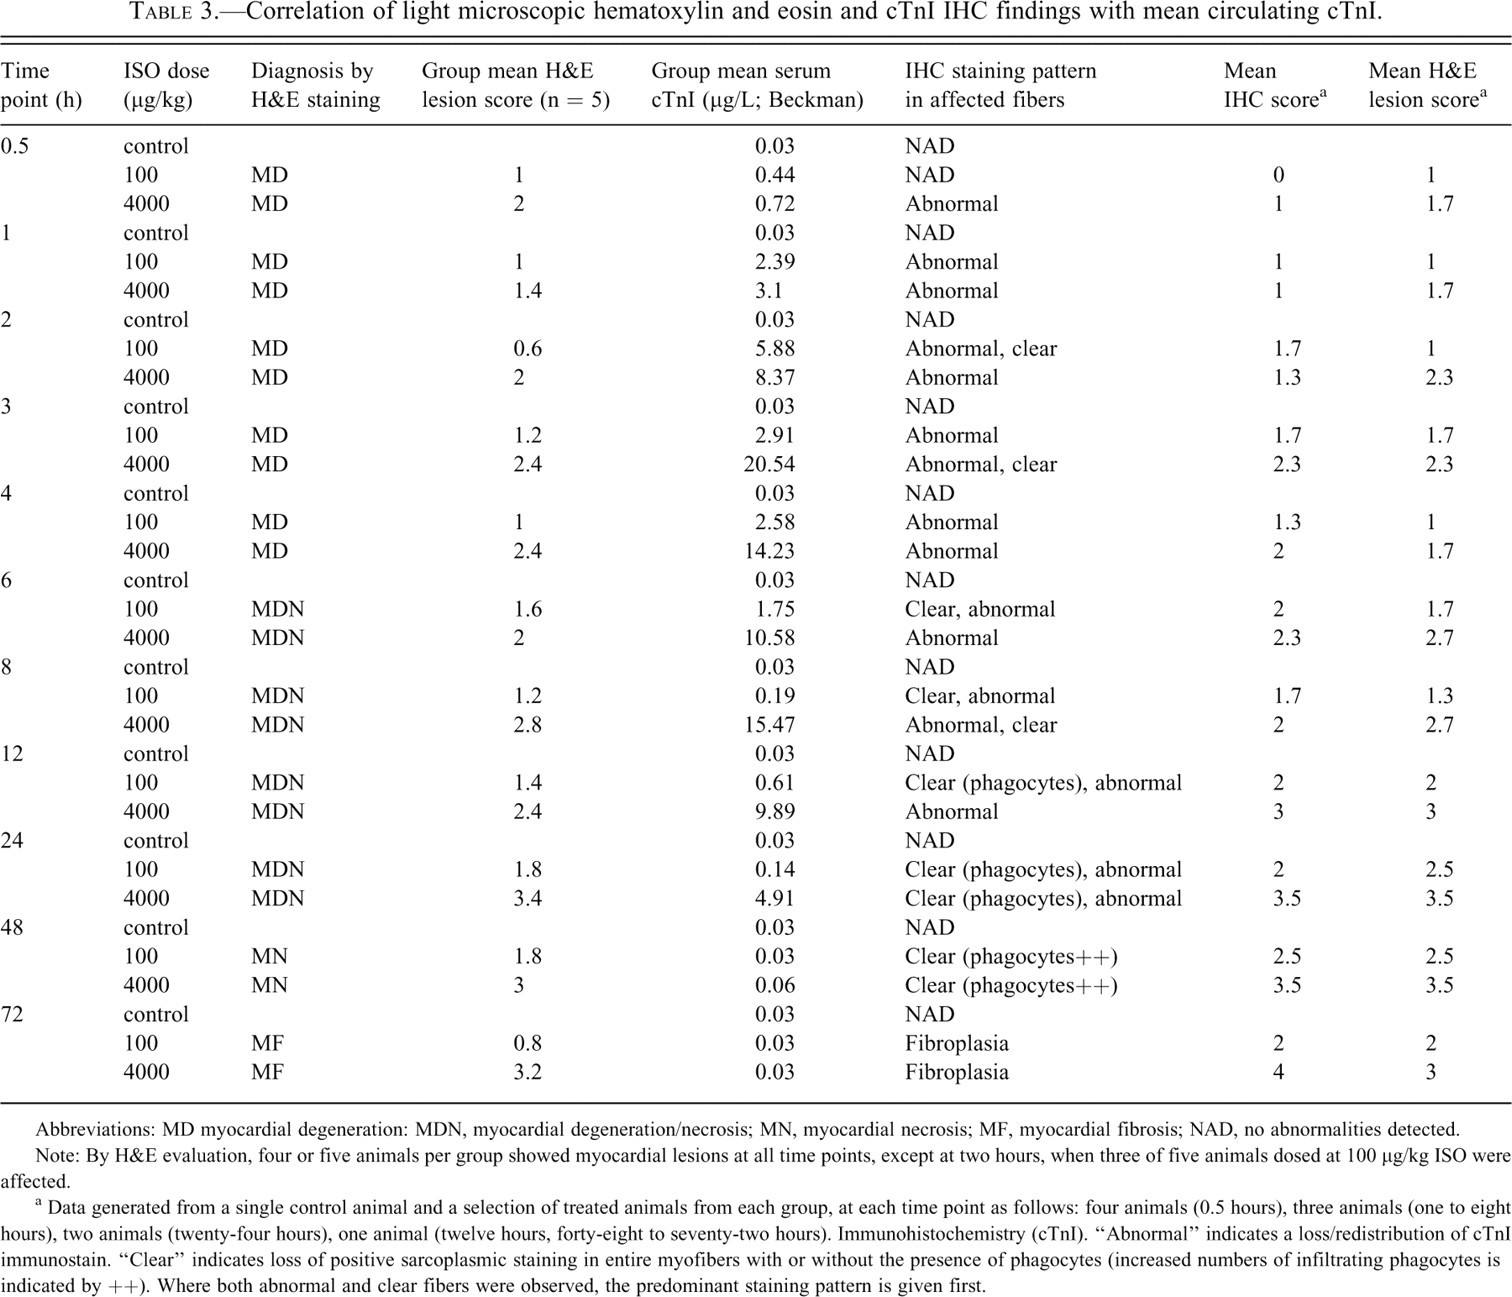
Abbreviations: MD myocardial degeneration: MDN, myocardial degeneration/necrosis; MN, myocardial necrosis; MF, myocardial fibrosis; NAD, no abnormalities detected.
Note: By H&E evaluation, four or five animals per group showed myocardial lesions at all time points, except at two hours, when three of five animals dosed at 100 μg/kg ISO were affected.
a Data generated from a single control animal and a selection of treated animals from each group, at each time point as follows: four animals (0.5 hours), three animals (one to eight hours), two animals (twenty-four hours), one animal (twelve hours, forty-eight to seventy-two hours). Immunohistochemistry (cTnI). “Abnormal” indicates a loss/redistribution of cTnI immunostain. “Clear” indicates loss of positive sarcoplasmic staining in entire myofibers with or without the presence of phagocytes (increased numbers of infiltrating phagocytes is indicated by ++). Where both abnormal and clear fibers were observed, the predominant staining pattern is given first.
Myocardial degeneration (minimal to moderate; H&E and PTAH staining) was present at 0.5 to four hours post-dosing (Table 3; Figure 4A–4D).
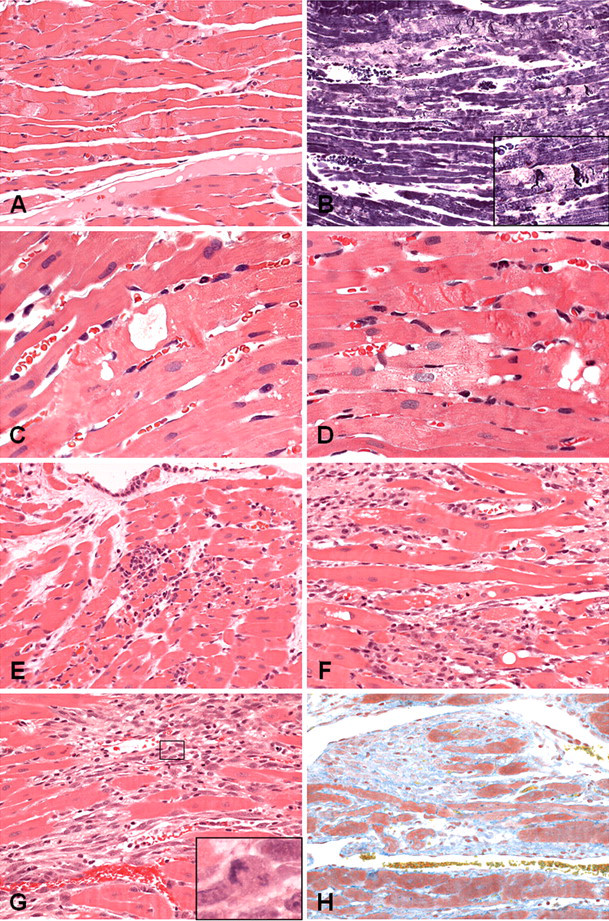
H&E (A, C–H), PTAH (B), and MSB (I) images of left ventricular myocardium showing progression of myocardial degeneration through degeneration/necrosis, necrosis, fibrosis. (A–D) Myocardial degeneration present from 0.5 hour illustrating change characterized by contraction banding, loss of myofiber cross-striations, swelling of the myofibers and sarcoplasmic rarefaction, granular to fragmented sarcoplasm, and a variable microvesicular/coarse vacuolation. Inset in (B) shows higher magnification of contraction banding and sarcoplasmic rarefaction. (E) Myocardial degeneration/necrosis showing degenerative changes, plus a proportion of necrotic myofibers with neutrophilic to mixed inflammatory cell infiltrate and variable intermyofiber edema. (F) Myocardial necrosis showing necrotic fibers and mononuclear phagocytic cell infiltrate. (G) Myocardial fibrosis, with expansion of a densely cellular interstitium composed of variably sized oval to spindle-shaped cells, some with large nuclei and lightly basophilic cytoplasm and occasional mitotic figures (shown in inset). (H) Same animal as in (G), showing an increase in interstitial collagen (MSB positive). Original magnification: A, B, E, F, G, H ×200; C, D ×400.
Myocardial degeneration/necrosis (minimal to moderate), was observed at six to twenty-four hours post-dosing (Table 3; Figure 4E). Initially, the inflammatory cell infiltration was predominantly neutrophilic, and it became predominantly mononuclear cell/histiocytic with time. At 100 µg/kg, six animals showed minimal to mild myocardial degeneration/necrosis in the absence of biomarker elevation, from eight to twenty-four hours.
Myocardial necrosis (minimal to marked) was observed at the forty-eight–hour sampling point (Table 3; Figure 4F).
Myocardial fibrosis (minimal to marked) was observed at seventy-two hours post-ISO administration (Table 3; , 4G-7H).
In individual animals at 0.5 hour, minimal myocardial degeneration correlated with lowest cTnI values of 0.29 and 0.30 ng/mL.
Six treated animals showed no morphological evidence of myocardial injury. Three of these animals (100 µg/kg, two- and three-hour time points) showed cTn elevation above control levels (cTnI 0.77–4.23 µg/L,).
Cardiac TnI IHC: Cardiomyocytes showed a loss of normal cTnI immunoreactivity, which was observed only in areas where morphological damage was detectable by H&E staining (Table 3; Figure 5 ). Abnormal immunoreactivity was first detectable at 0.5 hour (4000 µg/kg) and one hour (100 µg/kg) as pale (negative) areas of sarcoplasm, with loss of cross-striation, and positive staining in contraction bands, sarcoplasmic globules, or granules. Elevations of serum cTnI correlated with progressive loss of cTnI immunoreactivity, particularly in the early stages of degeneration up to two to three hours. Up to twelve hours, affected myofibers showed a loss of sarcoplasmic staining with increasing numbers of clear (immunonegative) myofibers. At twenty-four hours and beyond, all affected fibers were clear/unstained, concurrent with the decline in serum cTnI. From six to twelve hours, the presence of clear/unstained cardiomyocytes was predominant in animals at 100 μg/kg, compared to 4000 μg/kg.
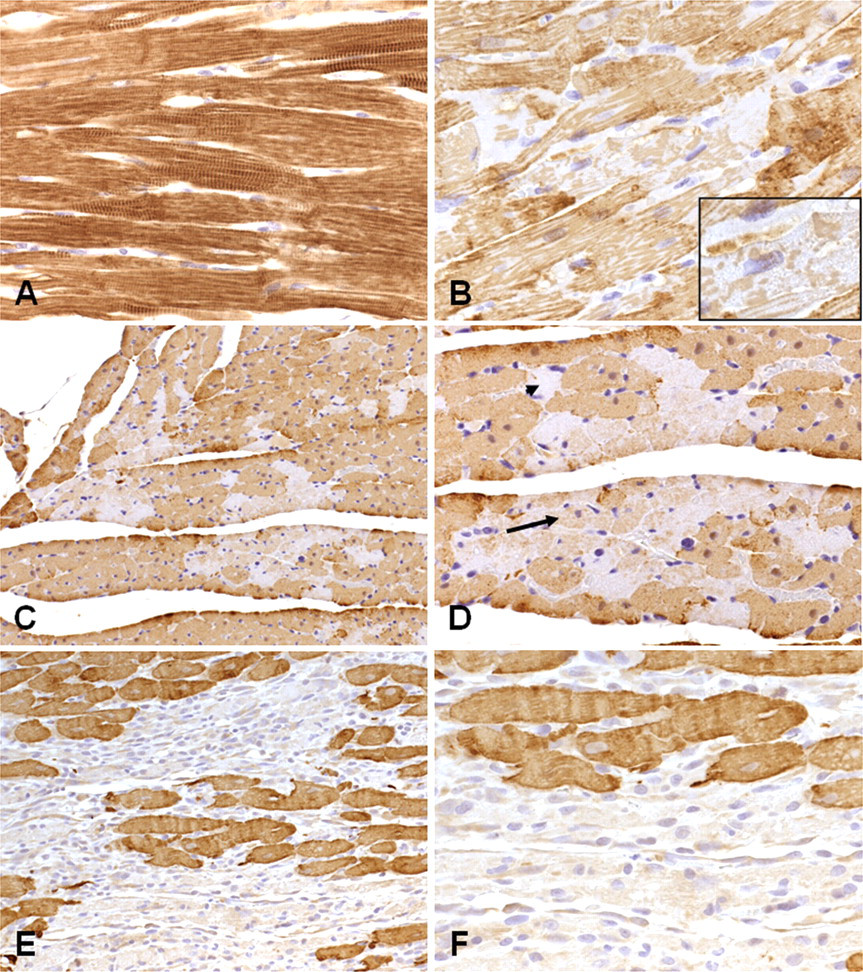
Patterns of cTnI immunoreactivity in the rat left ventricular myocardium. (A) Control heart showing normal pattern of cTnI immunostaining. (B–F) Heart from treated animals. (B) 0.5 hour, 4000 µg/kg showing loss of normal staining, with pale, granular sarcoplasm and patchy myofibrillar immunopositivity (shown at higher magnification in inset). Normal nuclear morphology is maintained. (C, D) Same animal, two hours, 100 µg/kg, showing single or small groups of myofibers with reduced, granular immunostaining (arrow) and “clear” fibers showing absence of specific immunoreactivity (arrowhead). (E, F) Same animal, forty-eight hours, 4000 µg/kg, showing some very faint immunostaining in mononuclear phagocytes infiltrating necrotic myofibers and interstitial cells in affected areas. Original magnification: C, E ×200; A, B, D, F ×400.
Transmission Electron Microscopy
At 0.5h, TEM showed contraction bands and areas of myofibrillar degeneration (Figure 6B–D , F), consistent with light microscopic observations, in a small number of fibers at both doses. The contraction bands were characterized by myofibrils with shortened sarcomeres, thick and fuzzy Z-lines, and a loss of the normal sarcomeric banding in the sarcomere. Myofibrillar degeneration was characterized by lysis, disorganisation and clumping of the myofilaments.
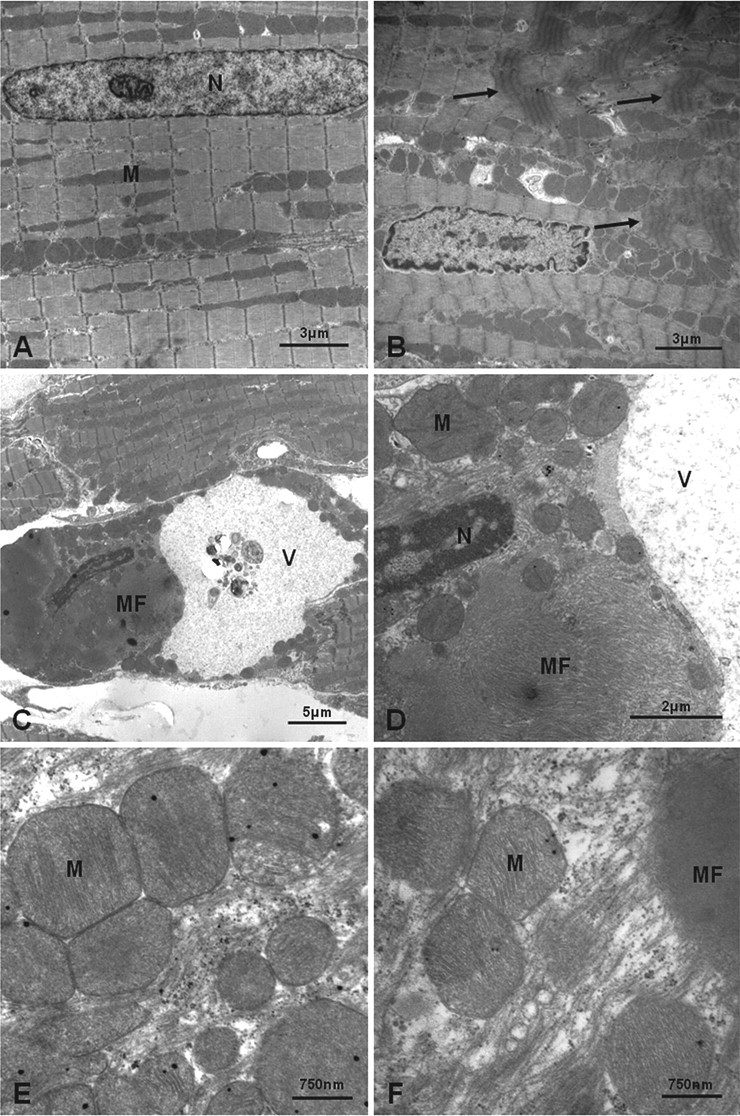
Transmission EM images of rat apical left ventricular myocardium. All images shown are from animals at 0.5 hour post-injection. (A) Control rat myocardium showing normal nuclear (N) and mitochondrial (M) morphology with normal myofilament architecture and sarcomeric periodicity. (B) Animal dosed at 100 µg/kg, showing myofilament disorganization with contraction band formation (arrows). Nuclear morphology remains within normal limits, showing slight crenation of the nuclear membrane associated with sarcomeric shortening and myofilament disorganization. There is also intermitochondrial vacuolation (electron-lucent spaces), which may represent sarcotubular dilation. (C) Cardiac myofiber containing a large vacuole (V) and a large mass of disorganized myofilaments (MF). The nucleus also is dense and heterochromatic. (D) Higher power of C. The large mass of disorganized myofilaments (MF) can be seen more clearly. The nucleus (N) is dense and heterochromatic, with marginated chromatin. The vacuole (V) contains dispersed flocculent material; mitochondria (M) appear normal. (E, F) Animal dosed at 4000 µg/kg. High power of mitochondria (M) from affected cardiomyocytes showing retention of normal ultrastructure, and absence of changes (e.g., flocculent densities) indicative of the early stages of cell death. In (F), myofibrillar degeneration is shown by disorganized myofilaments (MF) adjacent to normal mitochondria in the same cardiomyocyte.
In the degenerate myocytes, a few of the nuclei had a crenated profile and were denser and more heterochromatic (Figure 6B–D), with mitochondrial ultrastructure generally well maintained (Figure 6E, 6F). Some mitochondria contained fewer cristae and showed a loss of matrix density, although this feature was also seen in nondegenerate myocytes.
Discussion
The aims of the present study were to establish the kinetics of cTnI and cTnT and rat-specific H-FABP levels in the rat following a single s.c. dose of ISO at 100 and 4000 µg/kg, and to correlate increases in these biomarkers with detailed morphologic changes in the heart. This study extends previous work in this model with evaluation of organ weight data, early time points (from 0.5 hour) and specific correlation of biomarker levels to temporal phases of morphologic injury, cTnI IHC at all time points, and TEM investigation at 0.5 hour.
The time course of H-FABP serum increases has been characterized in the present study. Heart fatty acid–binding protein is an early marker of cardoimyocyte injury; it was increased at 0.5 hour following 4000 µg/kg ISO administration, in parallel with histopathological changes. For the 4000 µg/kg ISO group, the diagnostic time window for H-FABP was brief, from 0.5 hour to eight hours post-dosing. Serum H-FABP was similarly increased between one and eight hours at higher ISO doses (10 mg/kg SC) in Sprague Dawley rats, but it lacks cardiospecificity (Zhen et al. 2007). In man, the peak in serum H-FABP levels (after the onset of symptoms of acute myocardial infarction, or MI) occurs about five to ten hours, and levels rapidly return toward baseline (Tanaka et al. 1991). However, at 100 µg/kg ISO, H-FABP levels were not significantly elevated above the mean control value at 0.5 hour (when cTn concentrations were raised significantly on all platforms). Individual variability in H-FABP at lower levels of cardiac injury may therefore confound interpretation. It is necessary to further evaluate the changes in serum levels of H-FABP and cTnI in models of cardiac injury in rats to define the full utility of this marker.
Measurement of AST and total activities of plasma CK, CK-Mbmass, and LD were not considered to provide additional evidence of cardiac injury at the lower ISO dose level of 100 µg/kg, and only minimal elevations were apparent in the animals given 4000 µg/kg.
Myocardial degeneration was observed at 0.5 hour at both 100 and 4000 µg/kg ISO. This is the earliest time point at which light microscopic changes have been observed using routine H&E staining, with concomitant reductions in cardiomyocyte cTnI IHC and elevated serum cTnI, cTnT, H-FABP, and LD2. These biomarkers can be viewed as sensitive early markers of cardiac injury, but only the cTns are considered to be completely tissue specific. If the fold increases of the various markers are compared, it can be seen that the peak levels (as fold increases) of cTnI and cTnT are markedly higher than those for other biomarkers.
Of the fifty-five rats dosed at 100 µg/kg, three animals (two at two hours and one at three hours) showed cTn elevation above control levels (cTnI 0.77–4.23 µg/L, cTnT 0.26–0.90 µg/L) in the absence of histopathological lesions. Because lesions were observed in other animals at 0.5 hour, with cTn values lower than these, it is possible that focal morphological lesions were not sampled in the single section examined (standard practice in preclinical rat toxicology studies).
Throughout the early stages of myocardial degeneration, there is a correlation between morphologic lesion severity and elevation of serum cTnI and cTnT. In contrast, other studies have shown the presence of similarly elevated serum cTn values at early time points in the absence of microscopic changes (Bertinchant et al. 2000; Bleuel et al. 1995; Herman et al. 2006; O’Brien et al. 2006; York et al. 2007) or in the presence of morphologic changes not detectable by routine H&E staining (Mikaelian et al. 2008). Definition of the diagnostic window highlights the importance of the timing of serum/plasma measurement in nonclinical studies, when correlating acute/ongoing morphologic injury and establishing significant biomarker thresholds. For example, Zhang et al. (2008) quoted serum cTnT levels of 0.07–0.27 µg/L associated with morphological changes at three and six hours at s.c. doses of 32–64 µg/kg in the rat. These cTnT levels may or may not represent peak cTnT release, because earlier time points were not examined.
This study also demonstrates the temporal progression of dose-dependent, pathologic changes of myocardial injury and repair in response to ISO administration. These findings are in general agreement with and extend published data (Bertinchant et al. 2000; Herman et al. 2006; Mikaelian et al. 2008; O’Brien et al. 2005; Rona et al. 1961; York et al. 2007; Zhang et al. 2008).
Increases in heart weight can indicate cardiomyocyte injury without hypertrophy. At 4000 µg/kg ISO, dose-related increases in the relative heart weights from six hours, peaking at twenty-four hours, are considered to correlate with interstitial edema, influx of inflammatory cells and fibroplasia during myocardial degeneration, necrosis, and fibroplasia.
From eight to twenty-four hours at 100 µg/kg, six animals showed minimal to mild myocardial degeneration/necrosis in the absence of biomarker elevation. This finding could be explained by (i) small affected foci, compared with others at the same dose/time point which showed more extensive foci associated with low positive cTnI values (0.07–1.89 µg/L; data not shown); and/or (ii) significant mononuclear phagocyte infiltration associated with the onset of the resolution phase of injury. This result contrasts with the higher proportion of fibers showing degenerative changes at 4000 μg/kg at eight to twenty-four hours and is also reflected in the shorter window of group mean biomarker elevation at 100 µg/kg. At both doses, as the resolution phase continues (forty-eight and seventy-two hours), minimal to marked myocardial necrosis and fibroplasia are observed, when cTn elevations are small or absent.
Cardiomyocyte cTnI immunopositivity on tissue sections was reduced from 0.5 hour and correlated well with H&E lesion severity. The temporal disconnect between lesion severity and circulating biomarker levels at later time points is consistent with release of these biomarkers in the early degenerative/necrotic phases of cardiomyocyte damage but not during the phagocytic and reparative fibroplastic phases. This finding is supported by the immunostaining and ultrastructural investigations. Loss of cTnI immunoreactivity could also be owing to loss of epitopes by masking, conformational changes, or proteolysis. However, because anti-cTnI antibodies used for both IHC and clinical chemistry were directed toward N-terminal residues, the data are considered to reflect cTnI release into the circulation. At 100 µg/kg, affected fibers, although fewer in number, showed a more rapid progression, as shown by the predominance of clear/unstained cardiomyocytes at six, eight, and twelve hours (compared with animals at 4000 µg/kg) and a more rapid reduction (shorter window) in circulating cTn. Because loss of normal cTnI immunostaining was observed only in areas where characteristic changes were present in H&E section, the use of cTnI IHC is not considered to offer any significant diagnostic advantages over standard cardiac histopathology in detecting acute cardiomyocyte damage in this model.
Electron microscopic changes at 0.5 hour were consistent with myocardial degeneration and are considered not to signify cell necrosis at this stage. Although the point at which a degenerative cell becomes necrotic is usually not precisely discernible (Cheville 1994), two of the earliest ultrastructural indicators of lethally injured cells (significant margination of nuclear chromatin, flocculent mitochondrial matrix densities; Ghadially 1997b) were not present in the current study at 0.5 hour. A few of the affected cardiac myofibers showed heterchromatic nuclei, suggesting reduced metabolic activity, but such mild degrees of chromatin margination are considered reversible (Ghadially 1997a). Similar ISO-induced ultrastructural changes have been shown at one hour, with granular/linear mitochondrial deposits observed only at three hours (Noronha-Dutra et al. 1984).
It is considered unlikely that necrotic foci were present at 0.5 hour but not sampled. Tissue for ultrastructural evaluation was taken from the left ventricular apex/interventricular septal subendocardial myocardium, a region preferentially affected by ISO in the rat in this and in other studies (Rona et al. 1961).
Therefore, the ultrastructural and light microscopic data indicate that, in this model of acute cardiomyocyte injury, an increase in circulating biomarkers such as cTn and H-FABP was a very early event initially associated with minimal cardiomyocyte degeneration in the absence of clear morphological evidence of cardiomyocyte necrosis. For the cTns, this may represent initial release from a cytoplasmic pool as a result of an initial increase in cell membrane permeability prior to sarcolemmal rupture. Because H-FABP is a low molecular weight cytoplasmic protein (Meng et al. 2006), it is also expected to be rapidly released in the event of increased cardiomyocyte permeability.
In conclusion, the present study shows that ISO-induced acute cardiomyocyte injury may be detected by cTn measurements and histopathological evaluation where the cTn signal indicated active or ongoing cardiomyocyte injury, reflecting perturbation, myofiber degeneration, or necrosis. However, the highest histological lesion scores occur from twenty-four hours post-dosing, during the phase of declining cTnI values, when cardiomyocyte phagocytosis and fibroplasia are occurring. Therefore, there is a “temporal disconnect” between maximal cTn (and H-FABP) values and the histopathological response in this experimental model, such that minimal to moderate lesions consistent with myocardial necrosis may be observed in the absence of cTn elevation. We have also demonstrated a progressive loss of normal cTnI imunoreactivity on heart sections from 0.5 hour onward, correlating with myocardial degeneration and elevation of circulating cTnI. Concerning the validation of the cTns as novel serum markers of cardiomyocyte injury, this study has shown that cTnI and cTnT are the markers of choice in cardiac injury and should be included in any assessment of ongoing cardiomyocyte damage in rat toxicology studies. Measurement of H-FABP, used in conjunction with cardiac troponin measurements, may provide added value in the detection of initial onset of myocardial injury resulting in cardiomyocyte disruption or onset of further injury with repeat dosing.
Footnotes
This research received no specific grant from any funding agency in the public, commercial, or not-for-profit sectors.
Acknowledgments
The authors would like to thank John Bowles for his technical assistance in preparation of the images/photomicrographs. We also gratefully acknowledge the assistance of the technical staff at the School of Pharmacy for care of the animals and the technical support of the Clinical Pathology and Histology groups of GlaxoSmithKline, UK, and the Clinical Pathology Laboratories of AstraZeneca, UK. SB acknowledges the support of GlaxoSmithKline, UK, and the School of Pharmacy.