
Abstract
Rodent studies have shown that furan is a hepatocarcinogen. Previous studies conducted with high doses showed tumors at nearly 100% incidence at all doses. In this paper, a ninety-day gavage experiment conducted with lower doses (0.0, 0.03, 0.12, 0.5, 2.0, and 8.0 mg/kg bw) to identify a no-observed adverse effect level for hepatotoxicity and to characterize non-neoplastic effects including gross changes and histopathology, clinical biochemistry, hematology, and immunotoxicology is reported. As indicated by changes in serum biomarkers, increased liver weights and gross and histological lesions, the liver is the major target organ affected by furan. There were no changes in body weights, food consumption, or histology in other organs. Some of the serum electrolyte markers, including phosphorus, were altered. There was a significant increase in serum thyroxine and triidothyronine in males. This increase was not accompanied by histological thyroid changes. Immunophenotypic analysis showed that thymic lymphocyte maturation was altered in male rats. Although altered clinical biochemistry and hematological parameters were observed at a dose of > 0.5 mg/kg bw, mild histological lesions in the liver were observed at > 0.12 mg/kg bw. Based on this finding, a furan dose of 0.03 mg/kg bw was proposed as the no-observed adverse effect level for hepatic toxicity.
Introduction
Heat-induced food contaminants have attracted the attention of both the scientific community and the public in recent years (Crew and Castle 2007; Moser et al. 2009; Wenzl et al. 2007). Furan is a colorless, volatile, lipophilic compound that is formed during traditional heat treatment processes such as cooking, canning, and baking (Morehouse et al. 2008). A recent survey performed by the United States Food and Drug Administration (FDA) on approximately 300 food samples showed that furan is present in a wide range of foods up to levels greater than 100 μg/g. For example, it is found in cooked and canned meats, roasted coffee, beer, and wheat breads (Bolger et al. 2009; Crew and Castle 2007; Maga 1979; Morehouse et al. 2008). These data have been supported by similar findings by the European Food Safety Authority (2004) and the Swiss Office of Public Health (Reinhard et al. 2004). Derivatives of furan are also used as flavoring agents in food and tobacco products (Lucas et al. 1999; Maga 1979). Furan is formed in many common foods during the thermal treatment of either ascorbate, carbohydrates (with or without amino acids), unsaturated fatty acids, carotenes, or organic acids (Becalski and Seaman 2005; Crew and Castle 2007; Hasnip et al. 2006; Maga 1979; Morehouse et al. 2008). Furan is formed from these compounds either directly via the degradation of these compounds or via the recombination of smaller fragments (Lancker et al. 2009). Although furan is found in a wide variety of foods, there does not appear to be a correlation between food composition and furan formation. Hence, multiple pathways have been proposed for furan formation in foods.
Besides the occurrence in food, furan is used as an intermediate in the synthesis of many chemicals and pharmaceutical agents such as solvents, resins, and lacquers (Carfagna et al. 1993). Furan has been detected in surface water, smog, industrial effluents, acid hydrolysates, and steam distillates of pentose-containing agricultural by-products such as oat hulls and corn cobs, and in air. However, the frequency of detection and the concentrations were low. In humans, furan has been observed in breast milk samples (one in twelve milk samples obtained from women in four different urban areas) and in the breath of both smokers and nonsmokers (Butterworth et al. 1994; IARC 1995; Mugford et al. 1997). Hence, based on the widespread use and potential exposure to furan, the toxic properties of this compound are a public health concern.
A two-year gavage study using 2, 4, and 8 mg/kg bw of furan in male and female Fischer-344 rats showed increased incidences of cholangiocarcinoma and hepatocellular neoplasms of the liver (NTP 1993). Increased incidences of hepatocellular neoplasms were observed in the livers of male and female B6C3F1 mice with doses of 8 or 15 mg/kg bw (NTP 1993). Rats were more sensitive to the carcinogenic effects of furan than mice, with nearly 100% tumor incidence in all treated groups. Because all the doses of furan induced cholangiocarcinomas in rats, no dose-related carcinogenic effect on cholangiocarcinomas could be determined. The data gap for carcinogenicity was not addressed in this paper. These studies did not identify a threshold for toxicity in the liver, which is the major target organ for furan.
No human studies of the relationship between exposure to furan and cancer have been reported. Based on available data in rodents, furan is considered as “reasonably anticipated to be a human carcinogen” (NTP 1993) and is classified by the International Agency for Research on Cancer as possibly carcinogenic to humans (IARC 1995). In humans, the mean dietary exposure to furan, based on measured concentration in numerous foods, was calculated by the Center for Food Safety and Applied Nutrition, FDA to be 0.26 μg/kg bw per day in adults, 0.41 μg/kg bw per day for children, and 0.9 μg/kg bw per day for infants consuming formula as the primary source of nutrition (Morehouse et al. 2008). The effects of low levels of furan exposure are not currently known. To address this data gap using a rodent model, and to obtain more information on toxicity, a ninety-day study was designed using low doses of furan. The study was designed to identify a no-observed adverse effect level (NOAEL) in rats for hepatotoxicity and to better characterize effects on hematology, clinical biochemistry, gross morphology, and histopathology parameters.
Materials and Methods
Animal Experiments
Test Compound and Dosing Solutions
Furan was mixed with Mazola corn oil to final concentrations of 0.03, 0.12, 0.5, 2.0, and 8.0 mg/mL. Each dose was prepared separately on a volume-to-weight (v:w) ratio. Chilled corn oil was weighed to the nearest milligram in a conical flask. Chilled furan solution was drawn up in a Hamilton syringe, measured to the nearest microliter, injected into the corn oil, and mixed using a magnetic stir bar. Dosing solutions were dispensed into brown glass vials and capped with plastic closures adapted with silicon septa. Dosing solutions were stored in a refrigerator at 4°C. Fresh solutions were prepared every fourteen days. Previous studies have demonstrated the stability of furan dosing formulations for at least fourteen days under these conditions (NTP 1993).
Animal Studies
Fischer-344 male and female rats were obtained from Charles River Laboratories Inc. (St.-Constant, QC) at five to six weeks of age and were acclimatized for a period of twelve days before studies began. Animal handling and treatment procedures were conducted according to the Guidelines of the Canadian Council of Animal Care and were approved by the Health Canada Animal Care Committee (Ottawa, ON, Canada). Rats were identified by markings on the tails and housed two per cage. Animals were fed Purina Rodent Chow 5001 (Agribands Purina Canada, East Strathroy, ON, Canada) and city tap water ad libitum. The temperature and humidity of the room were targeted for 18°C-26°C and 30%-70%, respectively, and monitored continuously. Animals were observed for signs of illness twice daily during weekdays and once daily on weekends and holidays. Sentinel animals for health surveillance were housed in the same room as study animals and remained disease free throughout the study. Animals received treatment by gavage over a ninety-day period, dosed five days a week (as in the NTP protocol, 1993) to deliver a dose of furan at 0.0, 0.03, 0.12, 0.5, 2.0, and 8.0 mg/kg bw per day to groups of twelve females and twelve males. These animals were weighed daily on weekdays prior to gavage. Food consumption was measured on a weekly basis.
Organ Weights, Gross Necropsy, and Histopathology
At the end of the study, animals were killed by exsanguination via the abdominal aorta under isoflurane anaesthesia, and a complete gross examination was performed on each rat. Liver, kidneys, thymus, spleen, stomach, thyroid, adrenals, pancreas, testes, epididymides, prostate (ventral), seminal vesicles, ovaries, uterus, and vagina were collected for histological examination. The testes were immersion-fixed in Bouin’s solution. The other tissues were immersion fixed in 10% neutral buffered formalin (NBF). The liver, kidneys, spleen, thymus, testes, prostate, seminal vesicles, ovaries, and uterus were weighed prior to fixation. Hearts were also weighed and formalin-fixed, but not processed further. Paired organs were weighed separately. After weighing, halves of the right kidney, spleen, and thymus, each cut in cross-section, were retained in NBF. The other portions were submitted fresh for other analyses.
After fixation, the tissues were routinely embedded in paraffin, and 5 µm sections were cut. Mayer’s hematoxylin and eosin–stained slides were examined by light microscopy. The liver, kidney, thymus, and spleen from all dose groups were examined. Stomach, thyroid, parathyroid when in thyroid section, adrenals, pancreas, testes, epididymides, prostate, seminal vesicles, ovaries, uterus, and vagina from the control and high-dose groups only were examined.
Photographs were taken on an Axiophot Zeiss microscope (Germany) with a digital camera linked to an image analysis system (Progres camera, ROCHE image analysis and archiving system).
Analysis of Serum Clinical Biochemistry
At the time of sacrifice under isoflurane anaesthesia, blood from the abdominal aorta was collected in SST Vacutainer tubes (Becton-Dickinson, Franklin Lakes, NJ) and allowed to clot at room temperature. Serum was separated by centrifugation at 700 g and stored at −80°C until analysis. Clinical parameters were analyzed using a Roche Hitachi 917 biochemistry analyzer with corresponding reagents. The measured markers were serum amylase (U/L), albumin (g/L), globulin (g/L), albumin:globulin ratio, alkaline phosphatase (U/L), alanine transaminase (ALT-U/L), aspartate transaminase (U/L), γ-glutamyl transpeptidase (U/L), bicarbonate (mmol/L), conjugated bilirubin (μmol/L), total bilirubin (μmol/L), calcium (mmol/L), chloride (mmol/L), cholesterol (mmol/L), creatinine (μmol/L), creatine kinase (U/L), glucose (mmol/L), lipase (U/L), magnesium (mmol/L), phosphorous (mmol/L), potassium (mmol/L), sodium (mmol/L), sodium: potassium ratio (NKR), total protein (g/L), uric acid (μmol/L), triglycerides (mmol/L), uric acid (μmol/L), and urea (mmol/L). Thyroxine (T4-nmol/L) and triiodothyronine (T3-nmol/L) levels in serum were analyzed using an Immulite 2000 instrument and reagents (Diagnostic Products Corporation, Los Angeles, CA, USA).
Hematology and Flow Cytometry
Blood was collected in EDTA tubes and analyzed using a Coulter-Counter Model S-PLUS IV system (Counter Electronics, Hialeah, FL, USA). The following parameters were measured: red blood cell count, hematocrit, hemoglobin, mean corpuscular volume, mean corpuscular hemoglobin concentration, red blood cell distribution width, platelet counts, mean platelet volume, and white blood cell counts (total and differentiated).
Thymocyte Phenotyping
Thymocyte suspensions were prepared in Dulbecco’s phosphate-buffered saline (Gibco/Invitrogen, Grand Island, NY, USA) by gently crushing tissues in a 70-µm nylon cell strainer (BD Falcon, Bedford, MA, USA) and rinsing into a 50-mL tube. Prior to staining, thymocyte suspensions were standardized to 2 × 10⁷ cells in 1 mL buffer. Immunophenotypic analyses were conducted using the following mouse anti-rat monoclonal antibodies (BD Biosciences, Mississauga, ON, Canada): CD45 phycoerythrin protein-cyanin 5 (PE-Cy 5) clone OX-1, Leucocyte Common Antigen; CD3 allophycocyanin (APC) clone 1F4, T lymphocyte; CD4 phycoerythrin (PE) clone OX-35, T helper (Th) lymphocyte; CD8a fluorescein isothiocyanate (FITC) clone OX-8, T suppressor/cytotoxic (Tc) lymphocyte. Stained samples were prepared by mixing and incubating thymocyte suspensions with antibodies, followed by fixation in formaldehyde solution. Lymphocyte subset analyses were performed by flow cytometry using a BD FACSCalibur System (BD Biosciences, Mississauga, ON, Canada) within twenty-four hours. The percentage of T-lymphocyte subsets were analyzed following gating on lymphocytes expressing leucocyte common antigen (CD45+).
Furan Residue Analysis
Chemicals
Furan (CAS No. 110-00-9, >99% purity) and d4-furan (CAS No. 6142-90-1; isotope >99% purity) were purchased from Sigma-Aldrich Canada (Oakville, ON, Canada). Methanol (>99.9%, purity, HPLC grade) and anhydrous sodium sulphate (Tracepur, 10-60 mesh granular) were purchased from EMD (Gibbstown, NJ, USA). Prior to use, sodium sulphate was muffled at 500°C for twelve hours. Deionized water (DI) was obtained from Millipore MilliQ Gradient A10 purification system (Bellerica, MA). Unlabelled (native) furan was quantified using the isotope dilution method to account for matrix effects, for example, partition in lipids. The isotope dilution method employed d4-furan as an internal standard. The standard was added to tissue samples as an aqueous solution.
Headspace Solid Phase Micro Extraction Gas Chromatography-Mass Spectrometry (HS-SPME-GC-MS) Analysis
Prior to running a sequence, the fiber was baked at 300°C in split flow (50:1) for thirty minutes. For analysis, the fiber was loaded (HS extraction) at 30°C with agitation (250 rpm) for fifteen minutes.
Analytical conditions were as follows: Injector CIS4-PTV (Gerstel, Linthicum, MD): 1 mm SPME Liner. Splitless for one minute, then 50:1 split. Hold 200°C for twelve minutes, ramp at 12°C/s up to 280°C, hold five minutes. Fiber remained in injector (desorption) for a total of four minutes (200°C). Helium column flow: 1.7 mL/min (constant flow). Oven temperature profile: initial, 50°C/one minute; ramp at 10°C/minute to 150°C; ramp at 40°C/minute to 270°C: hold four minutes. MS transfer line, 250°C; MS source, 230°C; ionization 70 eV EI+, acquisition mode: selected ion monitoring; ions (m/z): 39, 68, and 69 for furan, 42 and 72 for d4-furan, dwell time 100 ms each ion.
Sample Preparation
For furan residue analysis, liver samples from the median liver lobe (ranging from 1.0 to 3.4 g) were collected at necropsy, placed in 20-mL, screw-top teflon tubes lined with teflon septa caps, and stored at −80°C until analysis. All reagents, glassware, and the polytron probe were chilled to 0°C. Approximately 1 g of slightly thawed liver sample was weighed in an aluminum dish and immediately transferred to the 10-mL headspace vial containing 1 mL of DI water. One mL of water was spiked with d4-furan at 5 ng/g, and this was added to the vial. The liver sample was homogenized with the polytron (PT 10/35 with generator PTA-10TS 12mm OD; Kinematica, Littau-Lucerne, Switzerland) for less than five seconds on ice. One gram of Na2SO4 was added and the vial cap was crimped. The vial was then gently vortexed for a minimum of one minute, sonicated in an ultrasonic bath for twenty minutes at 50°C, and shaken on a table shaker at room temperature at 200 rpm for thirty minutes.
Calibration Solutions
Stock solutions of furan and d4-furan solutions were prepared in methanol at 3000 ng/μL and stored at −20°C. Intermediate furan and d4-furan solutions were prepared in methanol at 30 ng/μL and 3 ng/μL, respectively. Calibration samples for SPME were prepared using a protocol similar to that used for liver samples, however homogenization was omitted because the liver sample was substituted by 1 mL of DI water and the 1-mL internal standard solution was replaced by 1 mL of a calibration solution.
Apparatus
A 6890-5973N Gas Chromatograph Mass Spectrometer (GC-MS) (Agilent, Santa Clara, CA, USA) equipped with CP-PoraBOND Q; 25m × 0.25mm × 3 μm column (Varian, Lake Forest, CA, USA) was interfaced with MPS 2 autosampler with a solid-phase micro-extraction (SPME) adapter (Gerstel, Baltimore, MD, USA) containing a SPME Fiber, 75-μm Carboxen-PDMS; 23-G needle (Supelco, Bellefonte, PA, USA).
Statistical Analysis
Furan residue analysis data are presented as mean + confidence interval (p < .05). Body weight, food consumption, clinical biochemistry, hematology, immunology, and organ weights are expressed as in mean + standard deviation. Statistical comparisons of control rats and furan-treated rats were performed by one-way analysis of variance (ANOVA) followed by Tukey’s multiple comparison test. Linear trend analysis was also performed. A value of p < .05 was considered statistically significant.
Results
Furan Residue Analysis
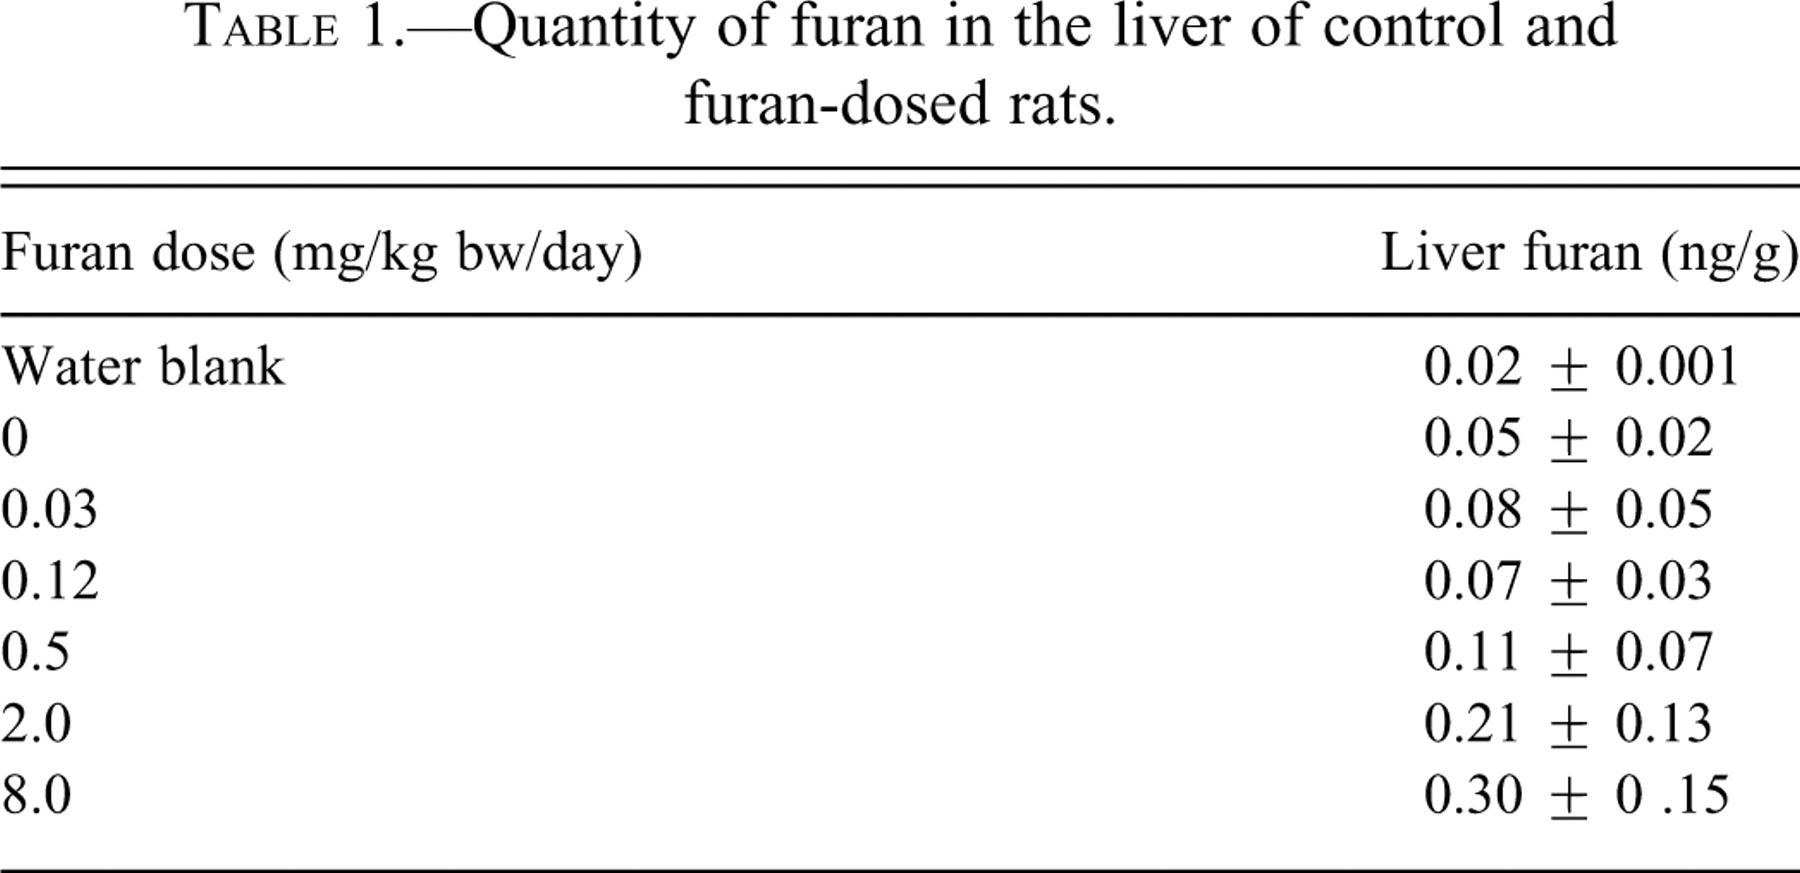
Residue analysis in the liver showed that sentinel, control (corn oil), and animals gavaged with 0.03 and 0.12 mg/kg bw all had similar liver furan levels, ranging from 0.05 to 0.08 ng/g of liver. The animals dosed with furan at 0.5, 2.0, and 8.0 mg/kg bw had approximately 0.11 ng/g, 0.21 ng/g, and 0.30 ng/g of liver furan, respectively (Table 1).
Quantity of furan in the liver of control and furan-dosed rats.
Body Weight, Organ Weights, and Food Consumption
In all study groups the animals appeared healthy for the duration of the study. There were no changes in behavior, posture, or gait in either sex. Overall body weight and weight gains were comparable for controls and treatment groups (data not shown). Food consumption was also similar between groups (data not shown). At the highest dose (8.0 mg/kg bw), the absolute liver weights increased significantly by 14%–22% in both males and females (p < .01) (Table 2). No other organs showed significant changes in their absolute or relative weights.
Absolute liver weights (g) in male and female rats.
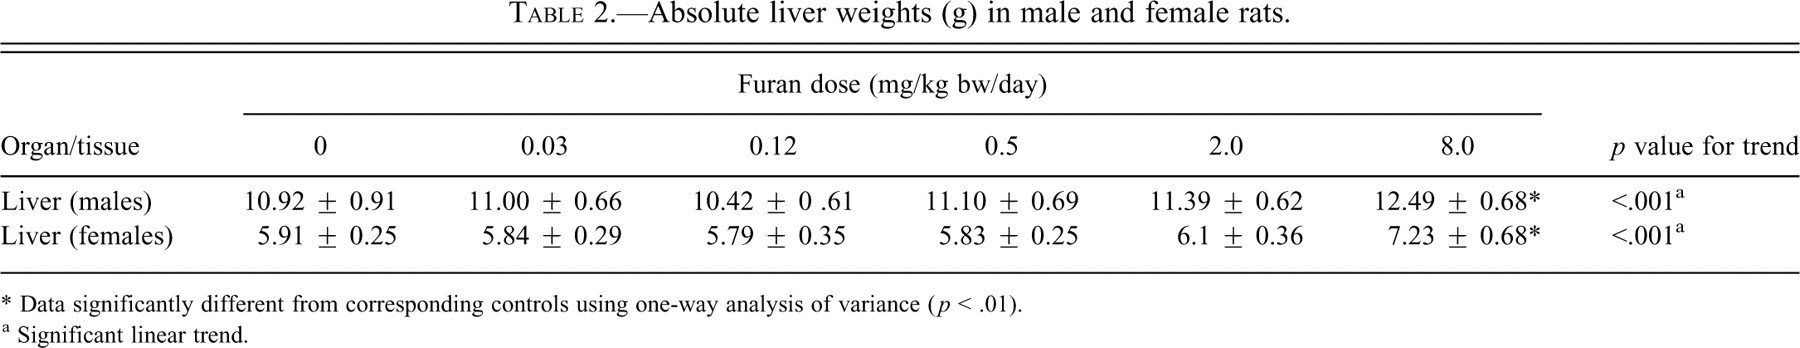
* Data significantly different from corresponding controls using one-way analysis of variance (p < .01).
a Significant linear trend.
Gross Observations and Histology in Organs
Of the tissues examined, there were no dose-related gross observations or histological changes in the kidneys, thymus, spleen, stomach, thyroid, adrenals, pancreas, testes, epididymides, prostate (ventral), seminal vesicles, ovaries, uterus, or vagina. Gross or histological changes were observed only in the liver.
Gross Observation of the Liver
In both male and female rats, gross morphologic changes were observed in 100% of the livers at 8.0 mg/kg bw. The caudate lobe and the left lateral lobe were the primarily affected areas (Figure 1). Single or multiple small, firm, white and/or yellow nodules were evident on the margins of these lobes. In some cases, the entire caudate lobe was affected, giving it an irregular surface. In some animals, the lesions were more pronounced on the margin of the left lateral lobe, extending a few millimeters from the dorsal margin. There was also a greenish-yellow discoloration of the surface and curling of the margin of the affected areas of the liver.
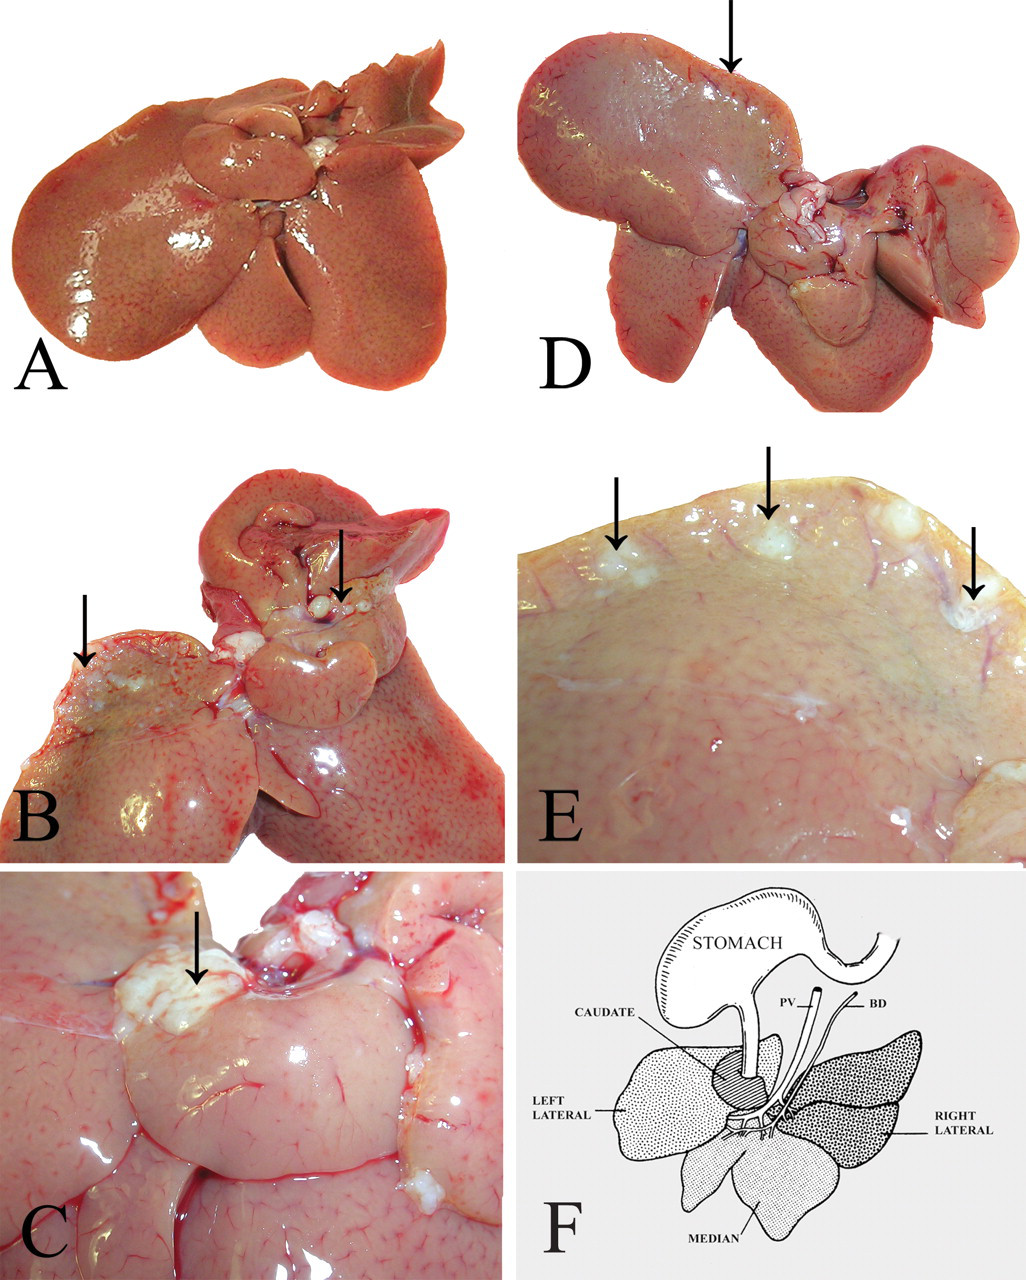
Gross pathological lesions in the liver. Images were obtained from the livers of (A) control rats; (B–E) rats treated with 8.0 mg/kg bw of furan; (B) grayish-white nodules in the left lateral and caudate lobes (arrow); (C) close-up showing nodules in the caudate lobe (arrow); (D) greenish tinge in left lateral lobe (arrow); (E) close-up showing nodules in the left lateral lobe; (F) schematic diagram of the lobes of the liver, as well as the bile duct (BD) and portal vein (PV) (from Elmore and Sirica 1991).
Histological Changes in the Liver
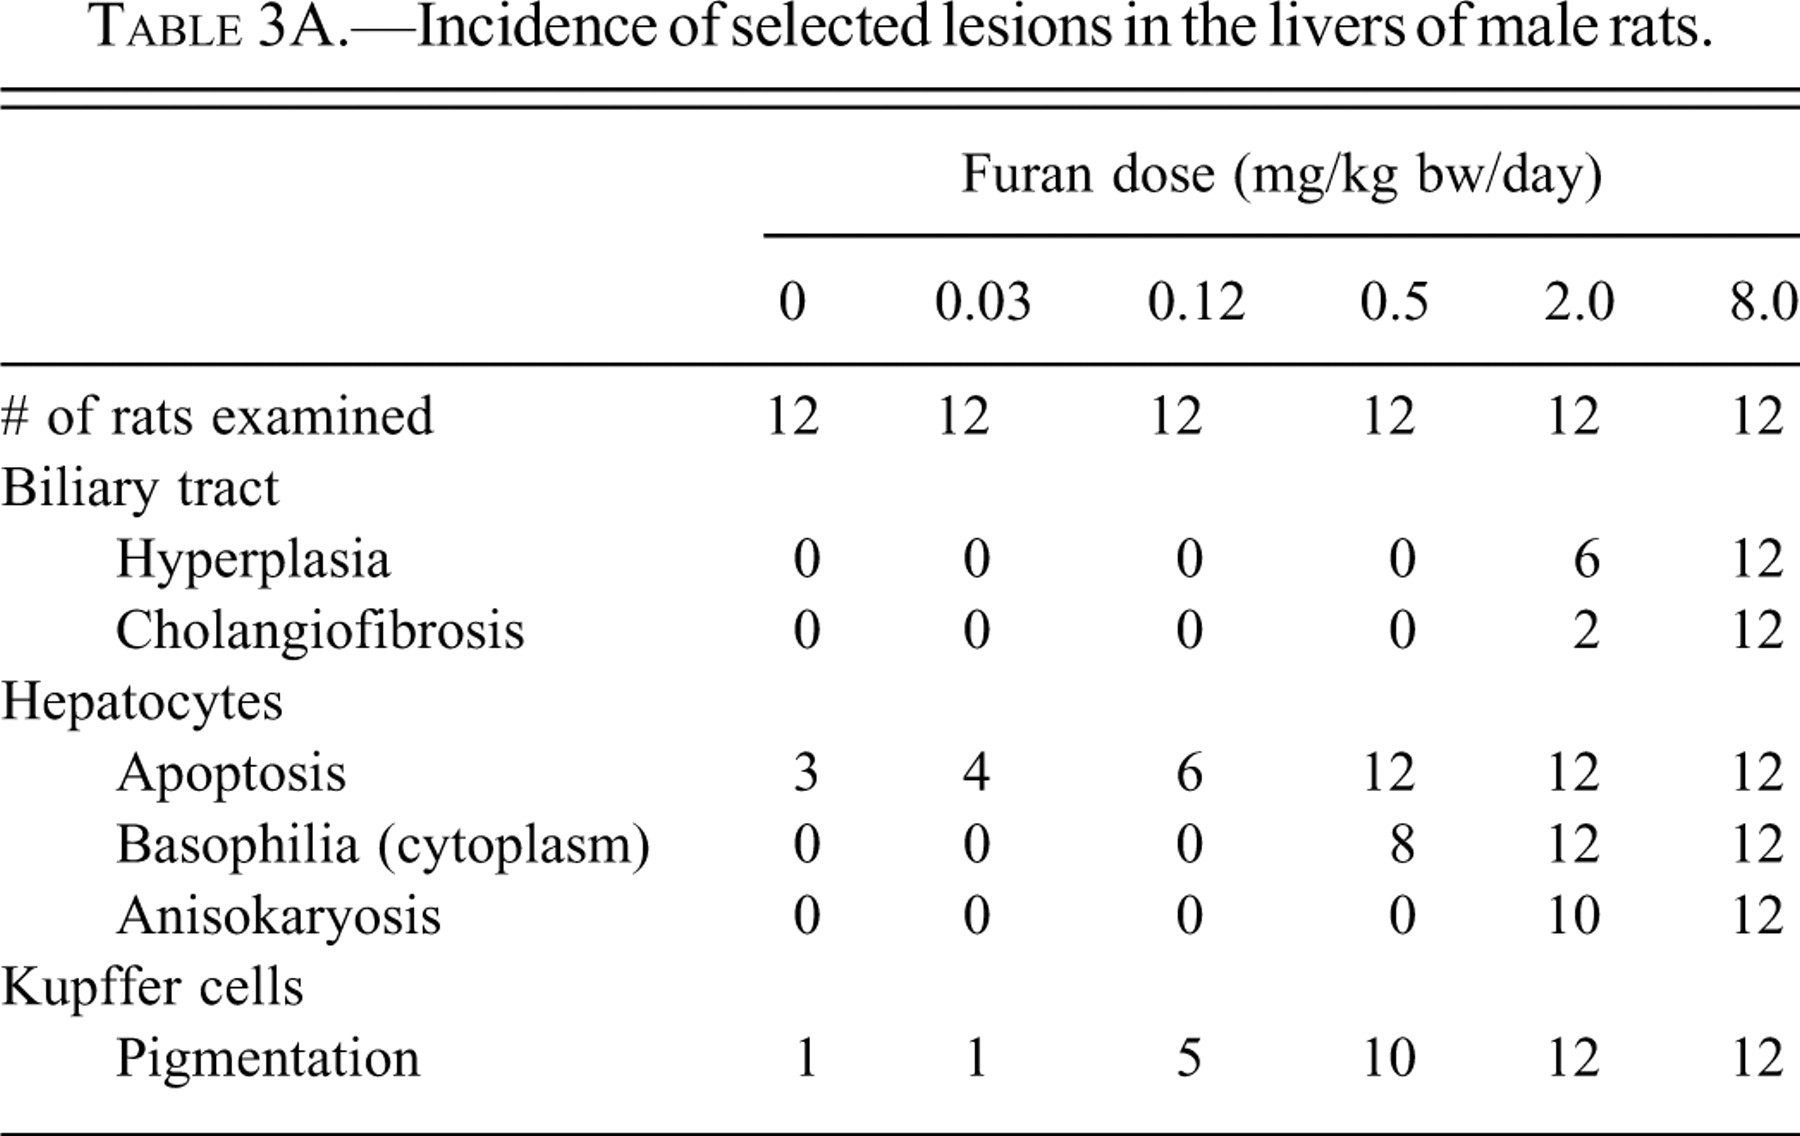
Mild histological lesions were observed in the caudate lobe of both males and females at furan doses ≥0.12 mg/kg bw (Tables 3A and 3B). There was a progression of severity of liver lesions with increasing dose of furan. At doses ≥0.5 mg/kg bw, all animals per dose group were affected and lesions appeared in the left lobe as well. At 8.0 mg/kg bw, mild lesions were also detected in other liver lobes. There appeared to be no difference in severity between males and females.
Incidence of selected lesions in the livers of male rats.
Incidence of selected lesions in the livers of female rats.
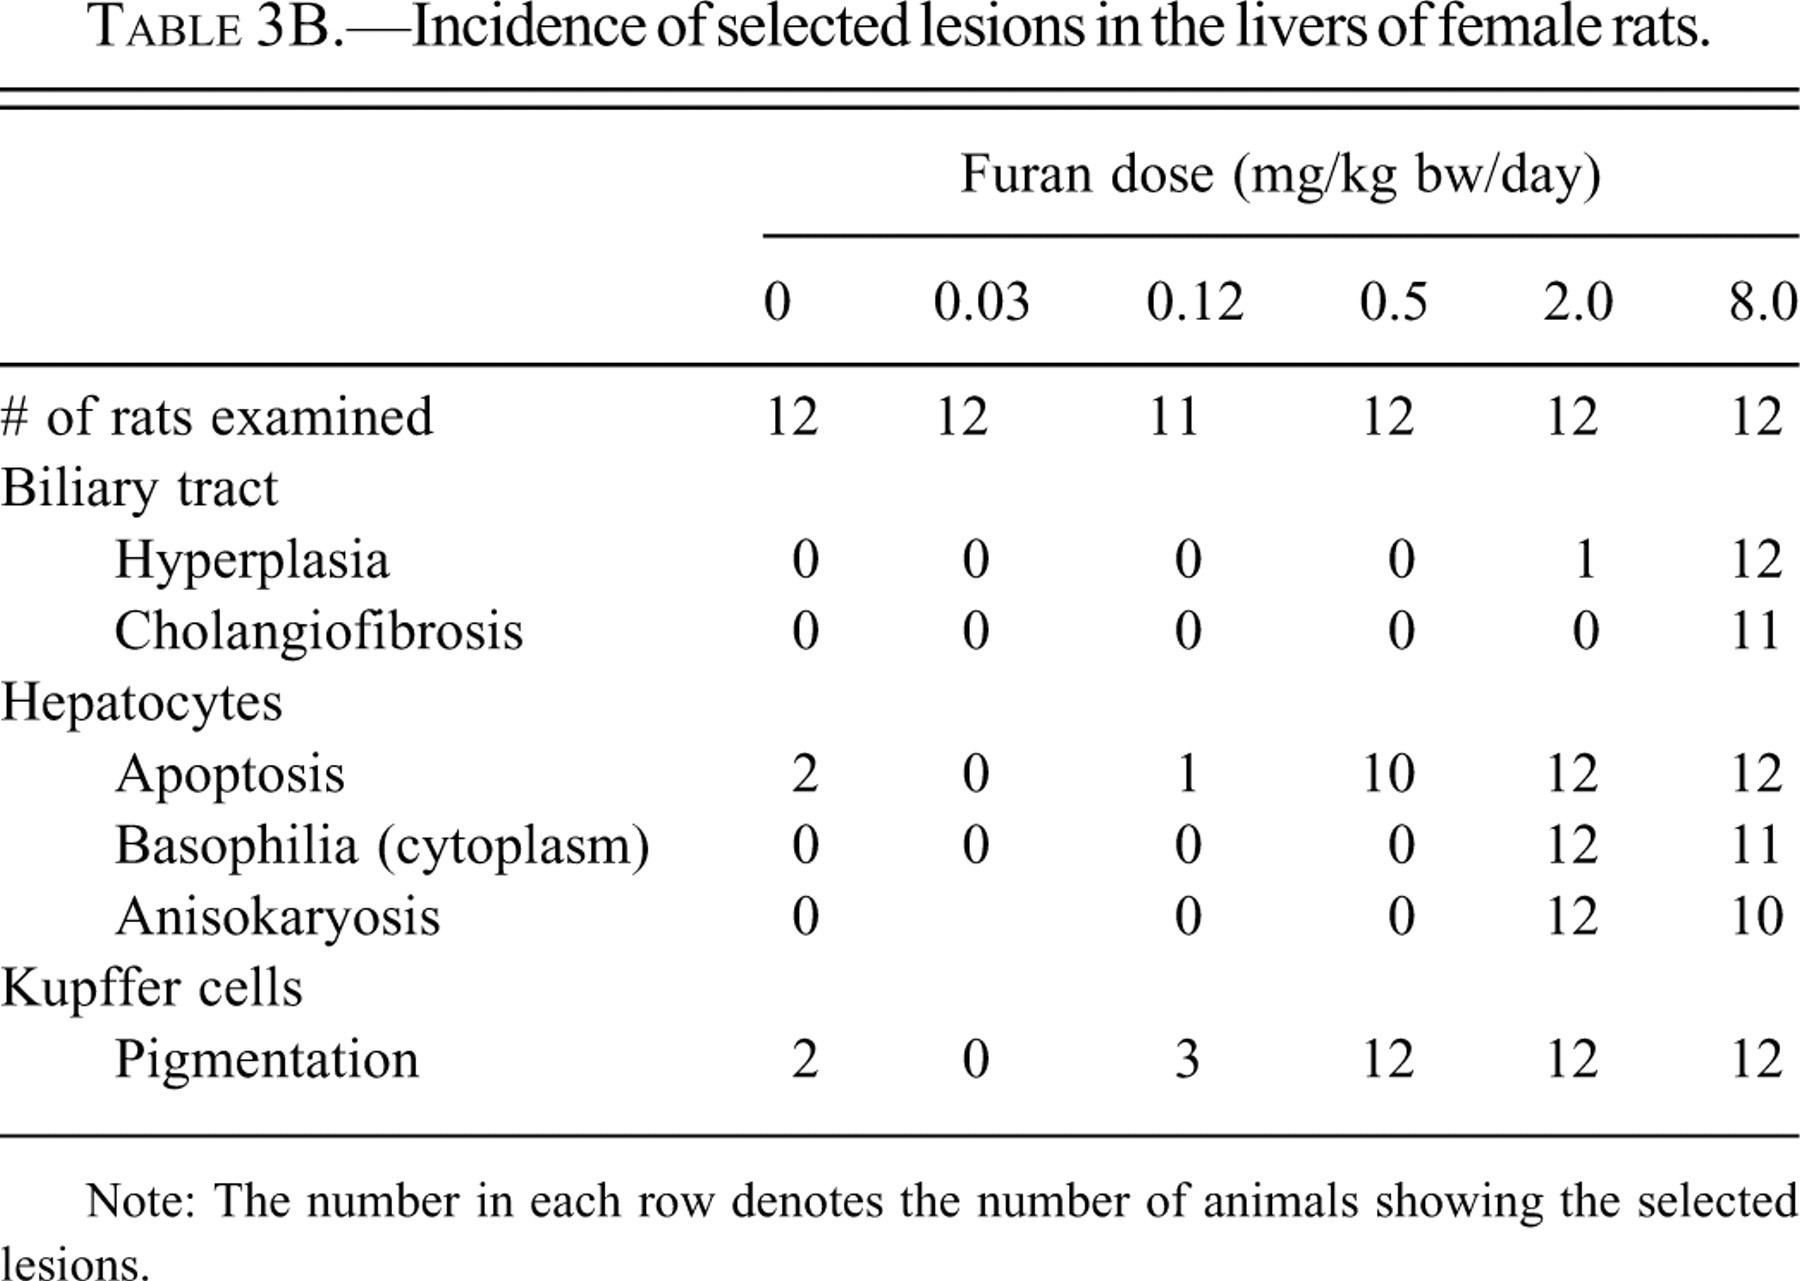
Note: The number in each row denotes the number of animals showing the selected lesions.
In the dose group given 0.12 mg/kg bw of furan, rare to occasional apoptosis of hepatocytes, Kupffer cells filled with yellow pigment, and small foci of inflammatory cells were observed immediately subcapsular. These features were restricted to the dorsal margin and visceral surface (i.e., that closest to the stomach) of the left lateral and caudate lobes.
In the dose group given 0.5 mg/kg bw of furan, the above lesions were similarly located and were subjectively graded as occasional to numerous (Figures 2B and 2E). Interior to these subcapsular lesions was a layer one to two cells thick of hepatocytes with cytomegaly, karyomegaly, and dark, homogeneous, slightly basophilic cytoplasm.
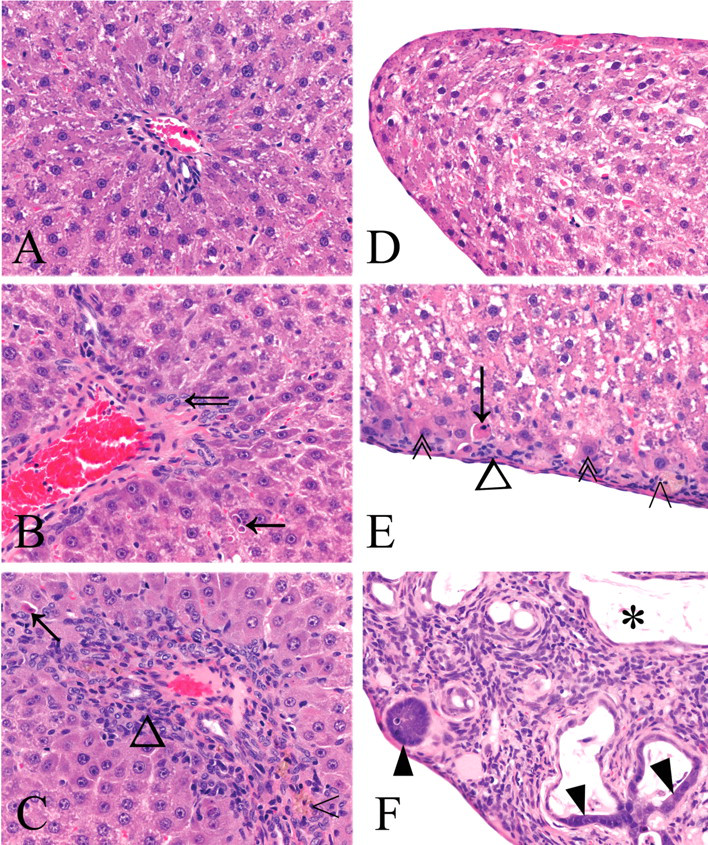
Photomicrographs of rat liver fixed in 10% neutral-buffered formalin and stained with hematoxylin and eosin (H&E). Images A–C depict zone 1 (40×). A: caudate lobe from a male control rat; B: caudate lobe from a male rat treated with 0.5 mg/kg bw of furan showing apoptotic hepatocyte (solid arrow) and mild oval cell hyperplasia (open arrow); C: left lobe from a female rat treated with 8.0 mg/kg bw of furan showing apoptotic hepatocyte (arrow), mix of oval cells and inflammatory cells (triangle), and pigment-laden Kupffer cells (open arrowhead). D: caudate lobe margin of a control rat (40×). E: subcapsular region of caudate lobe of a male rat treated with 0.5 mg/kg bw of furan (40×) showing apoptotic hepatocyte (arrow), pigment-laden Kupffer cell (open arrowhead), hepatocytes with slightly basophilic homogenous cytoplasm (double arrowheads), and inflammatory cell small focus (triangle) (40×). F: caudate lobe margin of a male rat treated with 8.0 mg/kg bw of furan (20×) showing cholangiofibrosis. The section shows intestinal-type glands (solid triangles) and cyst (asterisk) mixed inflammatory cell infiltrate, oval cell hyperplasia, interstitial fibrosis, and no normal liver parenchyma.
In the dose group given 2.0 mg/kg bw of furan, there was an increase in the incidence of hepatocyte apoptosis and Kupffer with cells filled with yellow pigment and distribution as compared to the animals administered 0.5 mg/kg bw. The subcapsular inflammatory cell infiltrate was focal to segmentally continuous. The bordering layers of hepatocytes with cytomegaly, karyomegaly, and slightly basophilic cytoplasm were up to five cells thick. Hepatocytes of similar appearance were evident in zone 1 of the parenchyma close to the affected liver margins. There was mild cytomegaly and increased vacuolation of zone three hepatocytes. In the more severely affected animals of this group, there was more extensive subcapsular and/or periportal proliferation of oval cells, bile duct hyperplasia, inflammatory cell infiltrate, and fibrosis. Bridging of a few portal tracts was observed in one animal and a form of variable cellular and nuclear morphology of hyperplastic bile duct epithelium was noted in another animal.
In the 8.0 mg/kg bw furan dose group, lesions were similar but more severe in nature and extensive in distribution, than those of the 2.0 mg/kg bw dose group. Of note were the greater oval cell and bile duct epithelial cell hyperplasia, bile duct metaplasia, and interstitial fibrosis, which formed the grossly observed raised lesions and replaced areas of normal hepatic parenchyma (Figures 2C and 2F). The hyperplastic ductular structures varied in appearance from normal-looking bile ducts, intestinal gland-like structures with flattened to tall columnar epithelium, and interspersed mucus-producing cells to cystic structures of variable size and shape containing eosinophilic material and cell debris. These lesions of cholangiofibrosis were focal (subcapsular and periportal), bridging portal tracks, thereby forming islands of normal hepatic parenchyma or completely replacing hepatic parenchyma. The caudate lobes were most severely affected, but variable and considerable areas of the left lateral lobe were also affected.
Clinical Biochemistry
Liver Markers
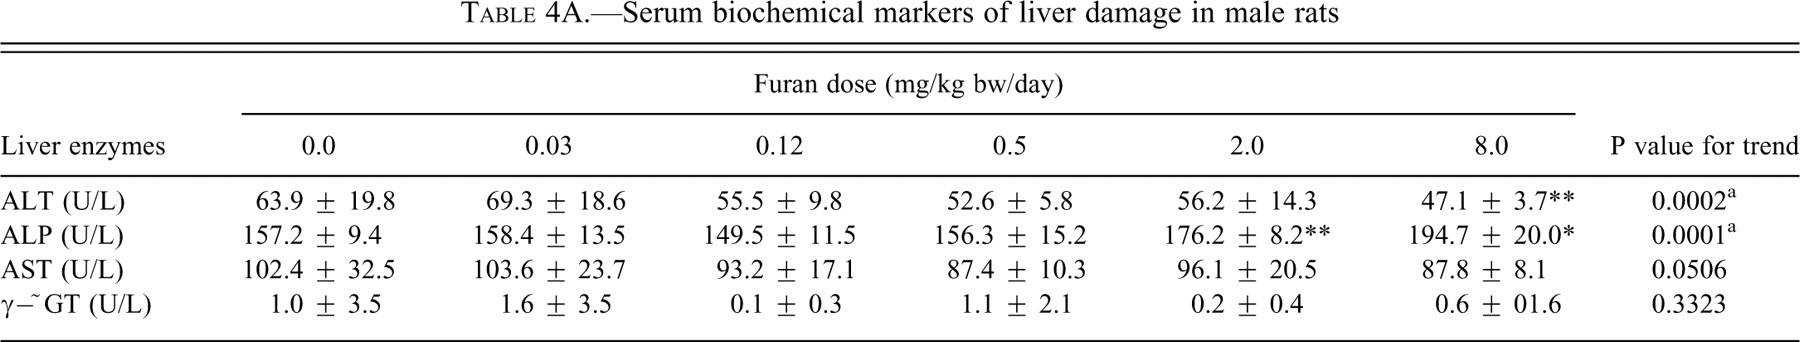
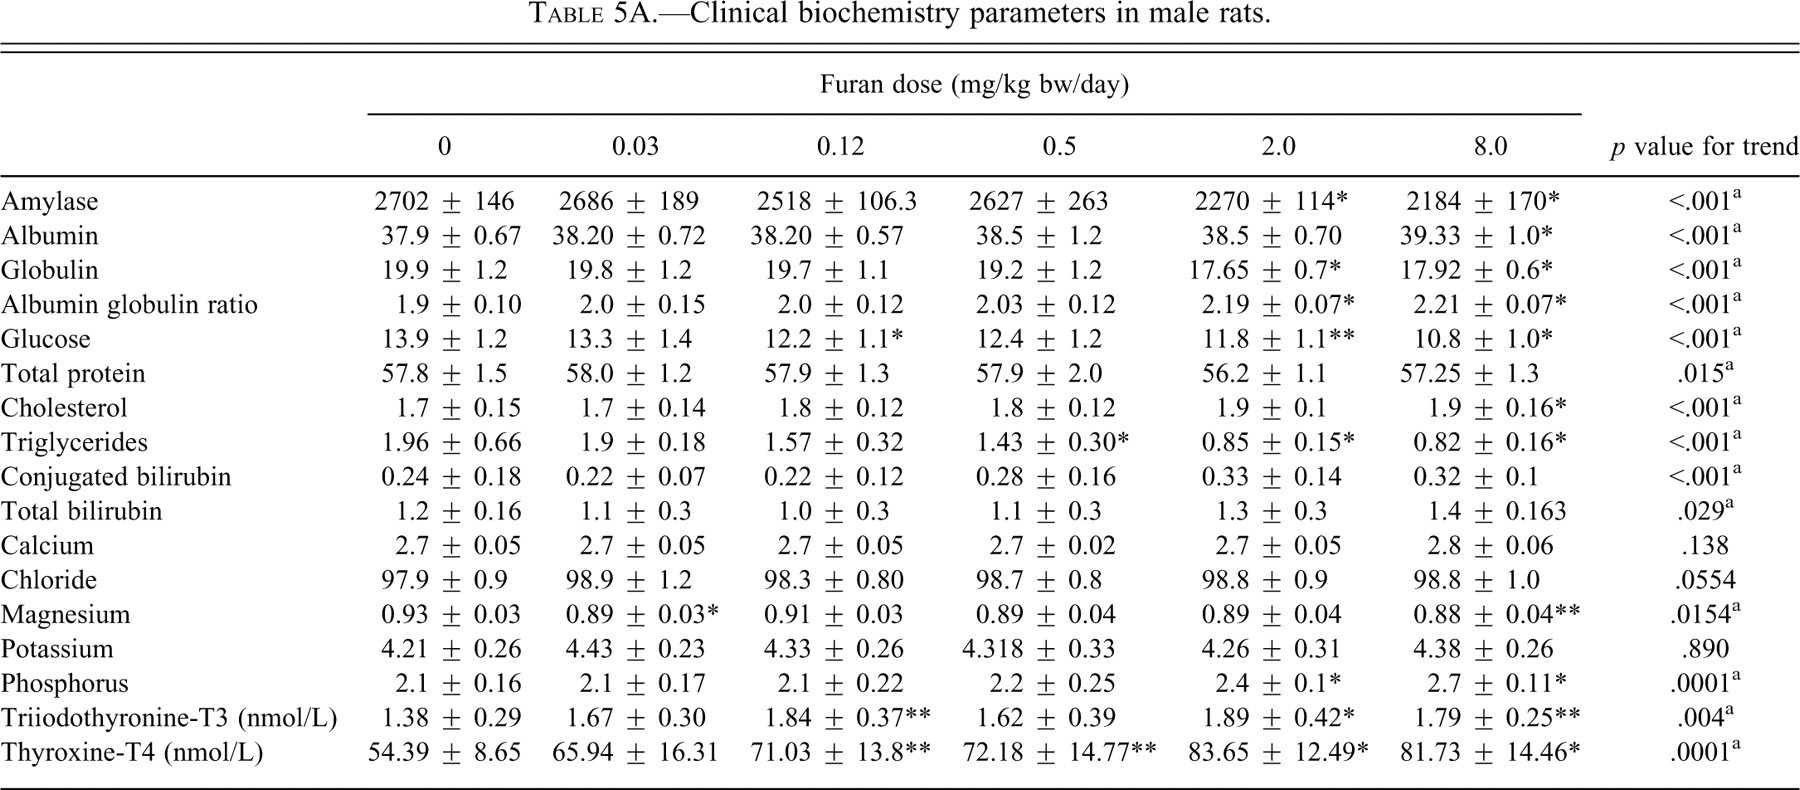
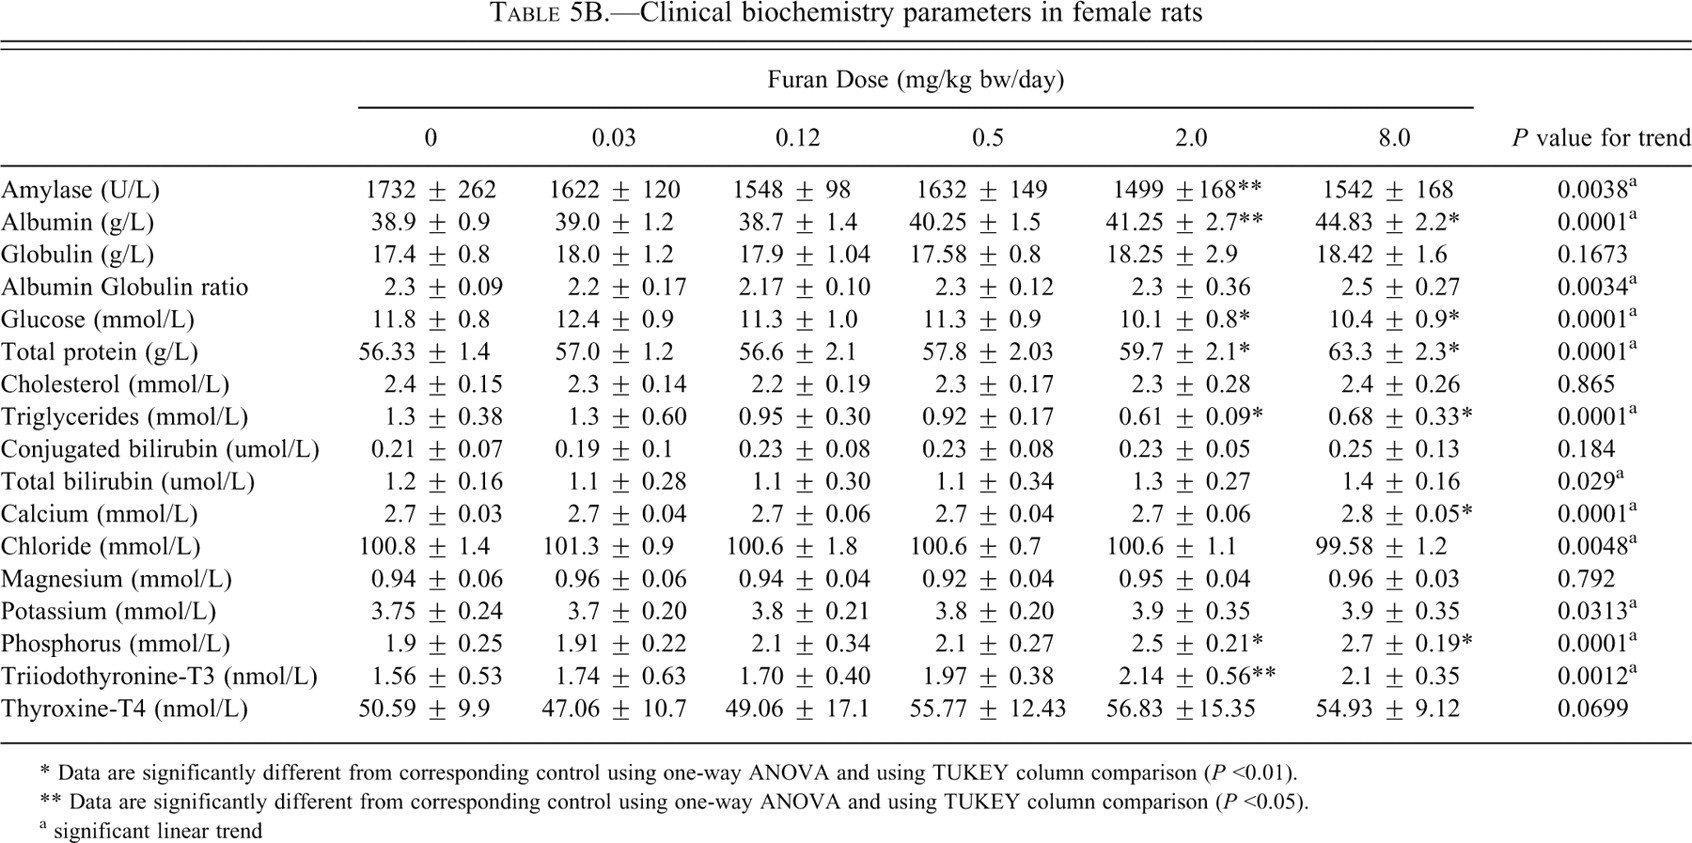
Levels of the enzyme activities of ALT, AST, ALP, and γ-GT in the serum, which can be indicative of liver injury, are shown in Tables 4A and 4B. ALT activity was significantly decreased in the males at 8.0 mg/kg bw (p < .05) and decreased in females at 2.0 and 8.0 mg/kg bw (p < .01) of furan. ALP levels were significantly increased at 2.0 and 8.0 mg/kg bw (p < .05) and (p < .01), respectively, in the males, but there were no significant changes in the females. AST activity in the females was significantly decreased at 8.0 mg/kg bw (p < .05) and showed a significant decreasing trend with increasing dose of furan, whereas in the males, the same trend did not achieve significance. γ-GT was not altered in any dose group. Conjugated bilirubin and total bilirubin levels showed a significant increasing dose-related trend in the males. Only the total bilirubin showed a significant trend in the females (Tables 5A and 5B).
Serum biochemical markers of liver damage in male rats
Serum biochemical markers of liver damage in female rats
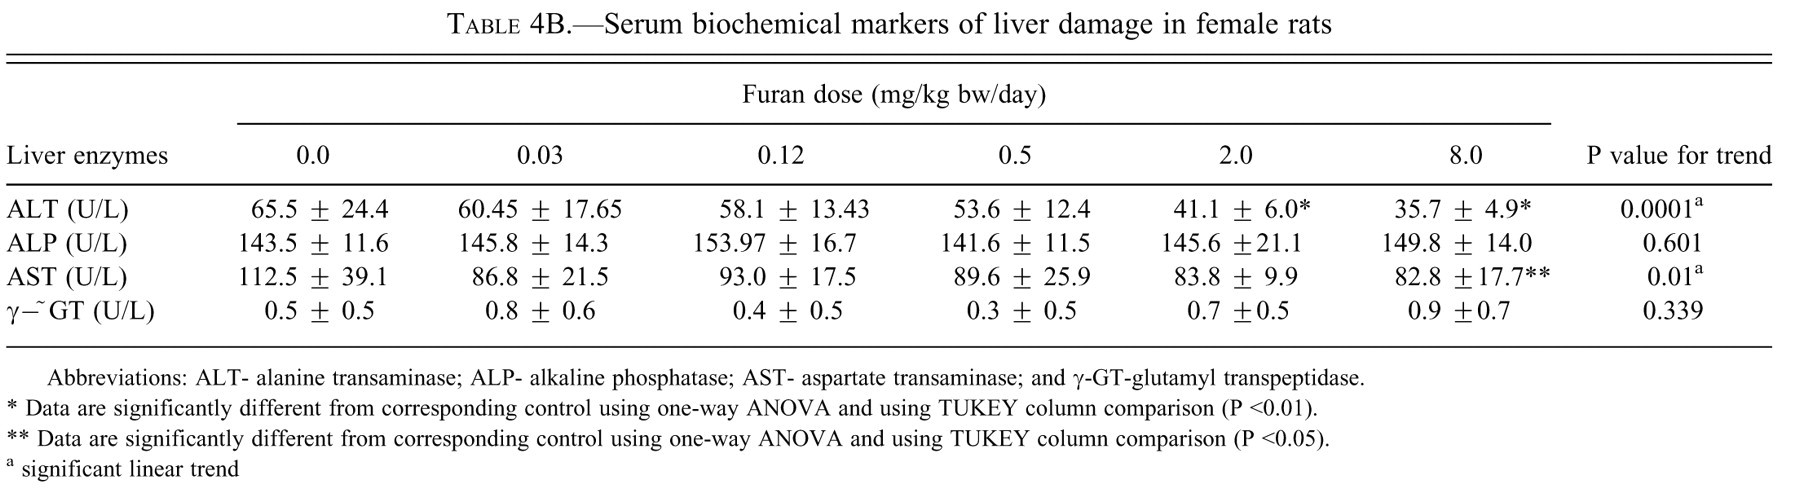
Abbreviations: ALT- alanine transaminase; ALP- alkaline phosphatase; AST- aspartate transaminase; and γ-GT-glutamyl transpeptidase.
* Data are significantly different from corresponding control using one-way ANOVA and using TUKEY column comparison (P <0.01).
** Data are significantly different from corresponding control using one-way ANOVA and using TUKEY column comparison (P <0.05).
a significant linear trend
Clinical biochemistry parameters in male rats.
Clinical biochemistry parameters in female rats
* Data are significantly different from corresponding control using one-way ANOVA and using TUKEY column comparison (P <0.01).
** Data are significantly different from corresponding control using one-way ANOVA and using TUKEY column comparison (P <0.05).
a significant linear trend
Platelet levels (× 109/L) in male and female rats.
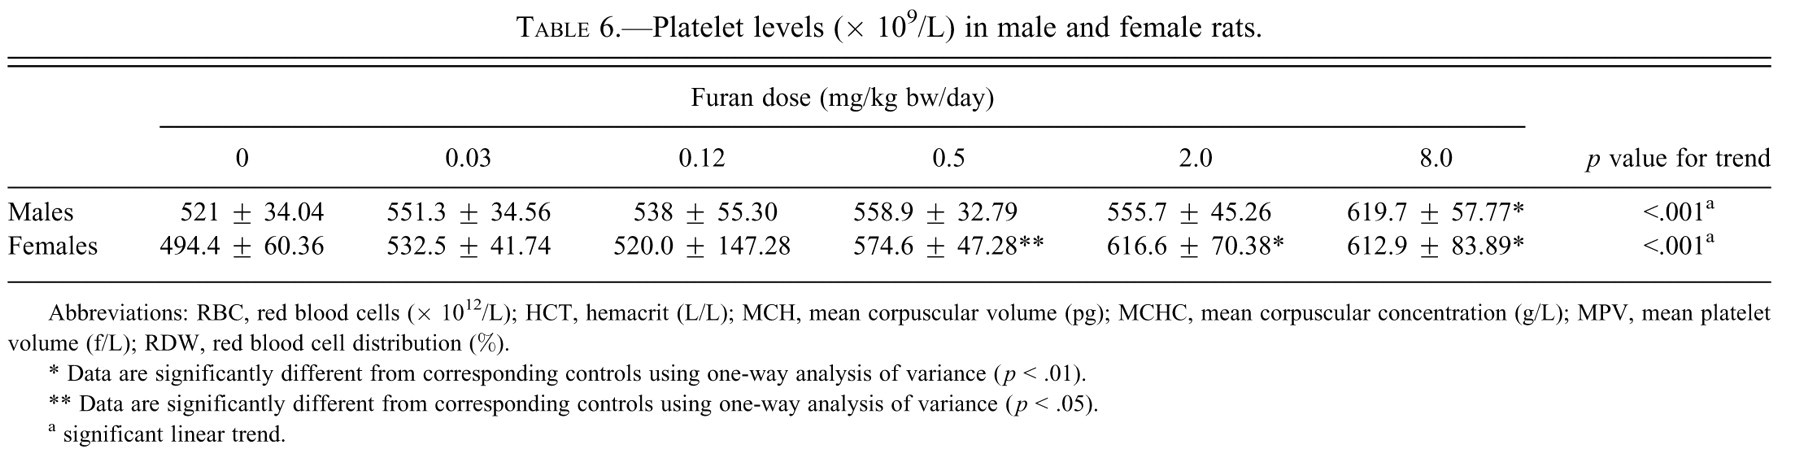
Abbreviations: RBC, red blood cells (× 1012/L); HCT, hemacrit (L/L); MCH, mean corpuscular volume (pg); MCHC, mean corpuscular concentration (g/L); MPV, mean platelet volume (f/L); RDW, red blood cell distribution (%).
* Data are significantly different from corresponding controls using one-way analysis of variance (p < .01).
** Data are significantly different from corresponding controls using one-way analysis of variance (p < .05).
a significant linear trend.
Serum amylase demonstrated a significant decreasing trend and was significantly decreased (p < .01) by approximately 15% in males at 2.0 and 8.0 mg/kg bw and in females at 2.0 mg/kg bw (p < .05) (Tables 5A and 5B). In males, the albumin levels were significantly increased at 8.0 mg/kg bw (p < .01) of furan, and the albumin:globulin ratio levels were increased significantly at 2.0 and 8.0 mg/kg bw (p < .01) of furan. In females, the albumin level was increased at 2.0 mg/kg bw (p < .05) and 8.0 mg/kg bw (p < .01), and the albumin: globulin ratio had only a significant dose-related trend. Glucose levels were also significantly decreased in both males and females at the same doses. Total protein increased significantly (p < .01) in females at 2.0 and 8.0 mg/kg bw, whereas there was a significant decreasing trend in males. Cholesterol was significantly increased (p < .01) in the highest dose group of males but was not affected in females. Triglycerides were decreased significantly at 0.5, 2.0, and 8.0 mg/kg bw (p < .01) in males and in females at 2.0 and 8.0 mg/kg bw (p < .01) of furan. Lipase was not significantly affected at any dose in either sex (data not shown).
Electrolyte Changes
The changes in the serum electrolyte markers were assessed (Tables 5A and 5B). Phosphorous levels were significantly increased in the 2.0 and 8.0 mg/kg bw dose groups (p < .01) in both sexes. Calcium levels were not affected in the males but showed a significant increase in females at the highest dose. Chloride was not affected in the males, whereas in the females there was a significant decreasing trend (Table 5A and B). Magnesium was significantly decreased in males at the 8.0 mg/kg bw group (p < .05) whereas there was no effect in females. Potassium was not affected in the males however there was a significant increasing trend in the females.
Endocrine Function
The changes in total serum T3 and T4 were monitored in the serum (Tables 5A and 5B). T3 was increased significantly in males at the dose groups of 0.12 (p < .05), 2.0 (p < .01), and 8.0 (p < .05) mg/kg bw, whereas in females there was significance at the 2.0 mg/kg bw (p < .05) dose group. T4 levels were significantly increased in males at 0.12 (p < .05), 0.5 (p < .05), 2.0 (p < .01), and 8.0 (p < .01) mg/kg bw. There was no significant change in T4 levels in any furan-treated group of females.
Hematology Parameters
In males and females there were no significant changes in the hematological parameters including ethrocytes and leucocyte counts, hemolysis, icterus, and hemoglobin levels (data not shown). Platelets were significantly increased in females at 0.5, 2.0, and 8.0 mg/kg bw, whereas they were significantly increased in males only at 8.0 mg/kg bw of furan (Table 6).
Thymic Lymphocyte Phenotype
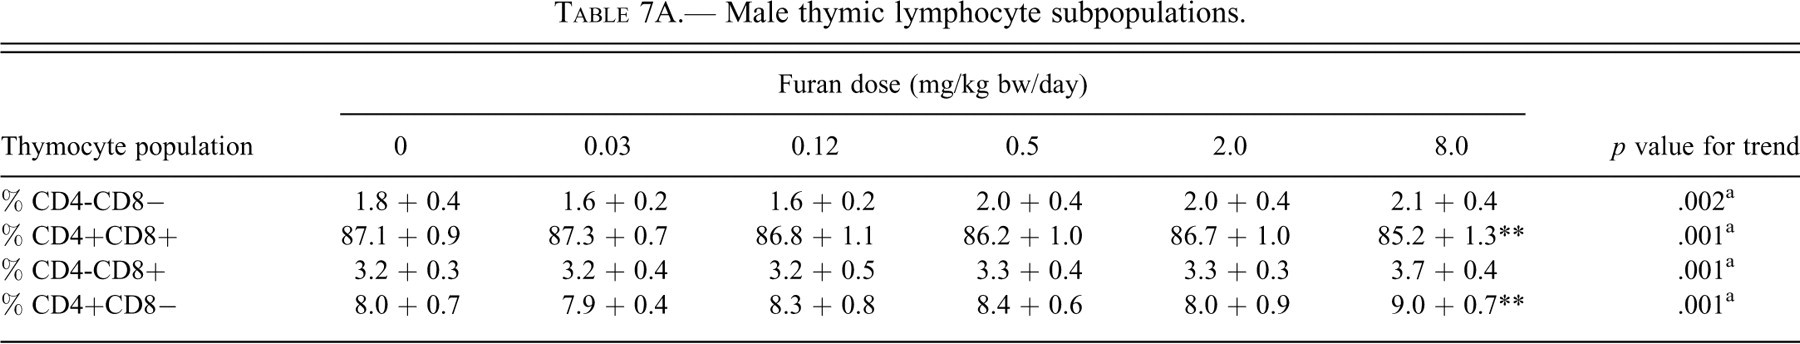
Changes in percentage lymphocyte subpopulations in the thymus of rats exposed to furan are summarized in Table 7. In male rats, there was a minor but significant dose-dependent trend toward decreased % CD4+8+ cells. This trend was accompanied by increased % CD4-8-, CD4-8+, and CD4+8− cell populations. The changes in % CD4+8+ and CD4+8− populations were significant (p < .01) for the 8.0 mg/kg bw furan dose group when compared with controls (Table 7A). In females, there was a minor but significant dose-related trend of decreased % CD4+8+ cells concurrent with increased % CD4+8− cells (Table 7B). In both male and female rats, CD3+ cells represented less than 15% of the total thymocytes and their frequency was not altered in the furan-treated rats (data not shown).
Male thymic lymphocyte subpopulations.
Female thymic lymphocyte subpopulations.
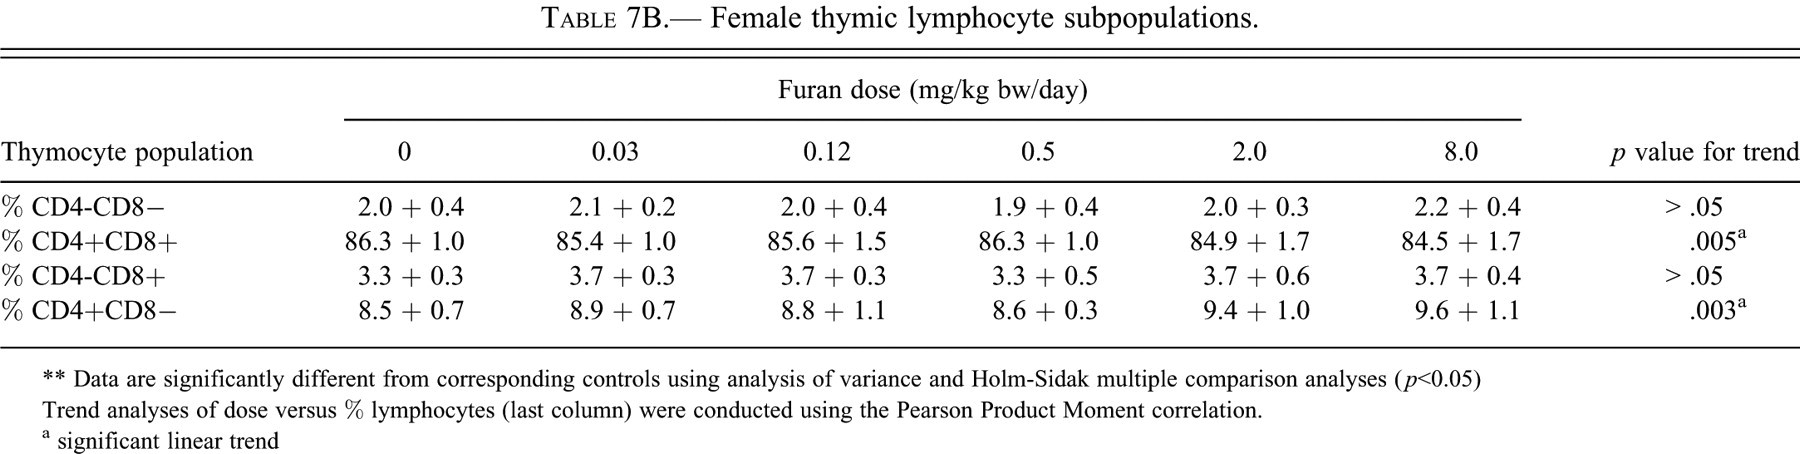
** Data are significantly different from corresponding controls using analysis of variance and Holm-Sidak multiple comparison analyses (p<0.05)
Trend analyses of dose versus % lymphocytes (last column) were conducted using the Pearson Product Moment correlation.
a significant linear trend
Discussion
A ninety-day study was conducted with Fischer-344 rats to establish a NOAEL for furan oral toxicity. To first confirm that increasing dose was associated with increased accumulation, residue analysis was performed. The data illustrate that similar amounts of furan were present in sentinels, controls (vehicle), and animals gavaged with 0.03 and 0.12 mg/kg bw. At these two lowest doses, the concentration of furan observed in the liver is likely a result of the rapid clearance of furan. However, at higher doses (0.5, 2.0, and 8.0 mg/kg bw), the amount of furan in the liver increased with dose. At these doses, the accumulation was associated with a dose-dependent increase in cytotoxicity in the liver of both male and female rats. The changes in the biochemical serum markers indicative of liver damage were supported by gross and histological changes in the liver. These changes are comparable with those reported by other researchers (Elmore and Sirica 1991, 1992, 1993; Maronpot et al. 1989, 1991; NTP 1993; Sirica 1996; Wilson et al. 1992). However, in the present study, the changes were also detected at a lower daily dose of furan. Mild, immediately subcapsular lesions (hepatocyte apoptosis, Kupffer cells laden with pigment, and small foci of inflammatory cells) were evident at 0.12 mg/kg bw of furan in the caudate lobe. With an increasing dose of furan there was a progression from these mild lesions in the caudate lobe to extensive areas of cholangiofibrosis in the caudate and the left lobes of the high-dose animals. The caudate lobes were most severely affected, but variable and considerable areas of the left lateral lobe were also affected. In a few animals, the lesions were also evident in the margin of the right lateral lobe.
Three possible explanations have been proposed for the differential lobe susceptibility to furan. One speculation for the differential response between lobes is the route of portal venous circulation through the liver, which could allow a higher concentration of furan exposure to the caudate liver lobe in contrast to the median, right, and left lobes. In addition, there could be interhepatic lobe differences in furan metabolism (Elmore and Sirica 1991). The third possibility for the necrosis, inflammation, and fibrosis along the subcapsular surface of the left or caudate lobes of the liver is that these lobes are located immediately adjacent to the stomach, hence it is likely there is direct diffusion of furan through the stomach to these lobes (Butterworth et al. 2004; Wilson et al. 1992).
Serum AST, ALT, ALP, γ−GT, conjugated bilirubin, and total bilirubin are the most sensitive biomarkers for hepatic damage because they are released into the circulation after cellular damage (Smith et al. 2002). In this study, ALT and AST were significantly decreased in both males and females. These findings are similar to the results for rats at the nine-month interim evaluation in the two-year gavage studies of furan (NTP 1993). A similar decrease of serum ALT and AST activity was observed in animals exposed to cadmium, pesticides, fungicide, benzene, lead, and mercury (Al-Attar 2004; Muthuviveganandavel et al. 2008). Conjugated bilirubin and total bilirubin had an increased dose-related trend in both sexes, but more significantly in the males. This slight increase is also indicative of liver damage. Increases in total bilirubin can be the result of cholestasis subsequent to impairment of intrahepatic or extrahepatic bile flow. If there was retention of bile, this could be a potential source of the yellowish color of liver margins observed grossly and the pigment in Kupffer cells seen histologically. However, Maronpot et al. (1991) believed the pigment in the Kupffer cells to be lipofuscin. The pigment composition has yet to be resolved. Lending some support to the bilirubin theory is the increased ALP in males and females, significantly so in males. This increase of ALP results predominantly from the inflammation of the biliary tract cells. Cholestasis can lead to the induction and the release of membrane-bound hepatic enzymes such as ALP and hence increasing their serum activities. γ-GT was not affected in either sex.
Other supplemental biomarkers of hepatic metabolic function were altered in the present study. Both total protein and albumin were increased in females at 2.0 and 8.0 mg/kg bw, whereas in males these increases were to a much lower extent. The significant increase in total protein is not surprising, because albumin is one of the major serum proteins and it was significantly increased. In males there was a significant decrease in globulin levels in the serum at 2.0 and 8.0 mg/kg bw, whereas there was no significant change in females. Hence, the albumin-to-globulin ratios increased to a greater extent in males than in females. Platelet numbers significantly increased starting at 0.5 mg/kg. Although the increases in albumin, globulin, and platelets could be indicative of dehydration, there were no significant changes in body weight or food consumption of dosed animals compared with the control animals in either females or males.
Cholesterol was significantly increased at the 8.0 mg/kg bw in males but not in females. In addition, triglycerides were decreased at 2.0 and 8.0 mg/kg bw in both sexes, suggesting that lipid metabolism was altered. A 20% reduction in glucose levels was also observed at the highest dose (8.0 mg/kg bw). These changes in cholesterol, triglycerides, and glucose are typically reflective of general metabolic events rather than serving as indicators of specific target organ toxicity (Smith et al. 2002). The exact mechanism contributing to the changes in serum levels is not known, but several factors including food consumption and body weight changes, hormone balance, and liver dysfunction can be involved. In this study, liver dysfunction may have contributed to these changes, since histological data and liver biomarkers indicative of injury were observed.
Serum amylase was decreased significantly, to a greater extent in males than females. The major contributor to serum amylase is the pancreas, suggesting that the pancreas may have been affected. However, lipase, the other marker of pancreatic injury, was not affected in either sex and there were no observed histological changes in the pancreas. Amylase has been shown to be decreased in animals with liver disease and infections (Dere et al. 2007).
Some of the serum electrolytes were altered by furan exposure. Phosphorus was significantly increased in both males and females at 2.0 and 8.0 mg/kg bw. Calcium was significantly increased at the highest dose in males only. Chloride and potassium showed an increasing trend in females. In males, only magnesium showed a significant decrease. These changes in electrolytes could be a result of multiple metabolic changes, including gastrointestinal and renal dysfunction. Although, the increase in phosphorus, calcium, and potassium are suggestive of renal injury, the major markers of renal injury, blood urea nitrogen and creatinine, were not altered and no histological changes were observed in the kidney.
To determine whether furan interferes with thyroid hormone homeostasis, serum T3 and T4 were measured. Both of these hormones were significantly increased in males. In the females, T4 was not changed and T3 showed an increasing linear trend. These changes could be a result of biosynthesis, secretion, absorption, or metabolism (Christian and Trenton 2003; Zoeller and Tan 2007). Since T4 is the principal hormone secreted from the thyroid gland, these changes suggest injury in this organ. However, there were no histological changes observed in this organ in this study. The two-year study (NTP 1993) showed hyperplasia in the thyroid at an equivalent dose of furan. It has been shown that the metabolism of these hormones occurs primarily in the liver (Christian and Trenton 2003), suggesting that the changes in the T3 and T4 levels may be owing to injury in the liver. The changes in the serum hepatic enzymes and extensive histological damage in the liver support this hypothesis. Immunotyping identified mild changes in thymic lymphocyte populations with furan exposure, reflecting changes in immune cell maturity. T-lymphocytes differentiate in the thymus and then circulate to the blood. CD4-CD8− thymocytes include immature T-cells. During maturation, thymocytes up-regulate both CD4 and CD8, becoming (CD4+CD8+). Finally, mature CD4 T-cells are CD4+CD8+ and CD8 T-cells are CD4-CD8+. In response to furan, thymic lymphocyte subpopulations shifted toward a decline in CD4+CD8+ cells and a corresponding increase in all other populations of thymocytes (CD4-CD8−, CD4+CD8−, CD4-CD8+). These changes reflect altered thymic lymphocyte maturation, which could be related to furan toxicity in the thymus. However, there were no accompanying changes in the thymus weight and histology.
In conclusion, this study demonstrates a dose-dependent increase in furan-induced cytotoxicity of the liver in both male and female Fischer-344 rats. The liver was the only organ that showed an increase in absolute weights. The platelet counts were affected in both sexes. There were changes in thymic lymphocyte subpopulations at the highest dose, suggesting possible effects on the immune system. Changes in clinical biochemistry and hematological parameters were observed at a dose of >0.5 mg/kg bw. The histological changes in the liver were observed at >0.12 mg/kg bw in the caudate lobe, and at higher doses, these changes were also consistently observed in the left lobe in both sexes. Based on the histological data, a NOAEL of 0.03 mg/kg bw per day of furan in the rat is suggested.
Footnotes
Acknowledgments
We thank Don Demers, Kevin Kittle, Dominque Patry, Martha Navarro, and Wendy Lezama for their help during the animal phase of the study. We would also like to thank Dr. Rudi Mueller and Pascale Bellon-Gagnon for their assistance with the necropsies.