
Abstract
Cholangiofibrosis is a structural anomaly that precedes the development of cholangiocarcinoma in some rodent models. In this article, the authors examine the contribution of the epithelial and mesenchymal cells in the pathogenesis of this complex lesion. Furan was administered to rats by gavage in corn oil at 30 mg/kg b.w. (five daily doses per week) and livers were sampled between eight hr to three months. Characteristically the administration of furan caused centrilobular injury, and restoration was accomplished by proliferation of hepatocytes. Some areas of the liver were, however, more severely affected, and here, injury extended into portal and capsular areas, which resulted in a rapid proliferation of ductular cells that extended into the parenchyma accompanied by a subtype of liver fibroblasts. These ductules either differentiated into hepatocytes, with loss of the associated fibroblasts, or progressed to form tortuous ductular structures that replaced much of the parenchyma, leading to cholangiofibrosis. Although it is unclear what determines the difference in the hepatic response, a loss of micro-environmental cues that instigate hepatocyte differentiation and termination of the hepatocyte stem cell repair response may be perturbed by continual furan administration that results in an irreversible expansile lesion that may mimic the features of cholangiocarcinoma.
Keywords
Introduction
Experimental models of cancer development in animals support the hypothesis of a multistage process requiring the accumulation of a number of critical mutations in genes that control cell proliferation and cell death (Vogelstein and Kinzler 1993). For carcinogenesis in the liver, morphological stages have been described that imply sequential acquisition of a transformed and then a malignant phenotype (Bannasch 1996). However, the picture is often complex in chemically induced carcinogenesis as repair and carcinogenic processes may occur synchronously, making the interpretation of salient morphologic features of carcinogenesis difficult (Goldsworthy, Hannigan, and Pitot 1986). This is particularly so in rat models of cholangiocarcinoma (CC), as a number of the agents used are clearly potent genotoxic carcinogens whereas others are not. The has led to debate on the relationship between the precursor lesion cholangiofibrosis (CF) and its role in the development of CC. CF is characterized by extensive fibrosis and inflammation associated with bile duct proliferation with areas of intestinal metaplasia (IM) (Tatematsu et al. 1985). The metaplastic intestinal cells resemble crypts of Lieberkuhn, and similar IM is recorded clinically in patients with chronic biliary inflammation, hepaolithiasis, and choledochal cyst, conditions that have an increased risk of CC in man (Ren, Silberg, and Sirica 2000).
Following the administration of the genotoxin nitrosomorpholine to the rat, Bannasch and Reiss (1971) describe a sequence of stepwise morphologies through bile duct proliferation to CF leading to cholangiofibroma and CC. However, bile duct proliferation is a common sequel to persistent hepatic damage (Michalopoulos and De Frances 1997), and CF itself has been considered irrelevant to the carcinogenic process (reviewed in Evans 1983). Three unresolved issues are the drivers for CF, the sequence of events leading to CC, and the molecular lesion(s) that distinguish the benign from the malignant state.
In the furan rodent model of CC, Sirica and his colleagues have described the development of CF from areas of ductal biliary cell proliferation that show overexpression of the cell receptors Neu and Met within areas of CF. Although these cells were defined as “altered,” there was no evidence of mutation of key genes Ki-ras or p53 (Sirica, Cole, and Williams 1994; Sirica, Radaeva, and Caran 1997). We have also examined the progressive development of CF and CC in rats given furan over a nine-month period and similarly could find no evidence of specific point mutations in these genes (Hitchcock et al. 2003; Hickling et al. 2010 [this issue]). However, the studies of Maronpot et al. (1991) show that, once CF is induced by furan, it will generally progress to CC even in the absence of further furan treatment.
The pathogenesis of CF remains elusive. It is known that differentiation and repair of epithelium is dependent on epithelial-mesenchymal interaction and proliferation of stem cells, both of local and distant origin (Yuasa 2003; Erickson and Bacellos-Hoff 2003). Furthermore, these interactions are orchestrated not only by direct cell-to-cell interactions but also by a plethora of complex signaling molecules released into the environment of the cells.
In this article, using a detailed time course study, we describe the early changes that occur in epithelial and mesenchymal cell populations of the liver following the administration of furan for up to three months. We have investigated aspects of the cellular response of the liver using immunocytochemical markers to elucidate further the complexity of liver injury, repair, and progression to carcinogenesis.
Materials and Methods
The studies were conducted in accordance with the standards of animal care and ethics described in “Guidance on the Operations of the Animals (Scientific Procedures) Act 1986” issued by the U.K. Home Office. Male Sprague Dawley Crl CD® BR rats (190-240g, 6-8 weeks old) were obtained from Charles River, UK. They were housed in groups of five in solid-bottom cages maintained at 21 ± 2°C, twelve hr light and twelve hr dark, and given access to R&M no. 1 diet and tap water ad libitum. Acclimatization was for at least five days prior to commencement of treatment.
Furan (CAS 110-00-9, Sigma-Aldrich Co. Ltd, Dorset, UK, >99% pure) was prepared in corn oil vehicle on the day of use and stored in sealed brown bottles. It was administered daily by gavage in corn oil at 30mg/kg using a dose volume of 10 ml/kg. This dose and the conditions of administration were similar to those used by Maronpot et al. (1991). Control animals received corn oil under similar conditions to test animals. Animals (n = 5 per time point) were euthanized by i.p. overdose of sodium pentobarbitone (in accordance with U.K. Home Office license procedures) at eight hr; one, three, seven, ten, twelve, and twenty days; and one, two, and three months of furan treatment. Control animals were included at the one-day, one-month, and three-month time points. In addition, an off-dose recovery group (n = 5) was included at the three-month time point (one month off-dose) to enable assessment of lesion reversibility.
At necropsy samples of caudate, right, median, and left lobes of the liver were fixed in 4% paraformaldehyde in 0.1M phosphate buffer pH 7.2 at room temperature for sixteen to twenty-four hr prior to processing to paraffin wax. Four micron (μm) sections were cut using a Leica 2155 microtome. Sections were baked onto Superfrost™ plus microscope slides overnight at 37°C prior to storage at room temperature. Additional samples were immersed in liquid nitrogen, and frozen sections were cut using a Leica cryostat set at 5 μm. Sections were placed on Superfrost™ plus microscope slides and fixed in acetone/chloroform (50:50) for five min, air-dried, and then either used immediately or stored at –80°C until use.
Immunohistochemistry
A minimum of three animals were selected from each time point for immunocytochemical investigation. The antibodies and detection system used are listed in Table 1 . Epithelial cytokeratin markers such as OV-6 and BD1 that label biliary cells and hepatocyte progenitor cells (HPC) (Alison 1998; Dunsford and Sell 1989) were applied alongside cell-junctional and adhesion markers such as connexins (Cx32 and Cx43), HCAM, E-Cadherin, and integrin β4 to aid detection of altered phenotype and changes in cell-communication during differentiation. Pan-cytokeratin and β-catenin were included as general markers of epithelia. A panel of fibroblast markers, glial fibrillary associated protein (GFAP) (Neubauer et al. 1996), alpha smooth muscle actin (αSMA) (Bhunchet and Wake 1992), desmin (Cassiman et al. 2002), and Thy-1 (Koumas et al. 2003), together with matrix proteins fibulin II (Knittel et al. 1999), laminin, and fibronectin (Sato, Suzuki, and Senoo 2003), were selected based on their collective ability to discriminate liver fibroblast phenotypes since there is no selective fibroblast marker. Further cellular discrimination of Thy-1 expressing cells was provided by CD45 that demonstrated circulating leukocytes and CD2 for lymphocytes and dendritic cell antigen to demonstrate dendritic cells. Sinusoidal endothelial cells and other vasculature were identified by expression of CD31. Markers of proliferation included PCNA and Ki67. Expression of hepatocyte growth factor (HGF) and its receptor c-Met were also investigated by application of respective antibodies as described by Radaeva, Ferreira-Gonzalez, and Sirica (1999). Finally, investigation of basement membrane components of intestine and liver was performed utilizing antibodies to laminin subtypes β2 and β3, which discriminates laminin chains associated with intestinal cell differentiation (Simon-Assmann et al. 1998).
Antibodies and detection systems.
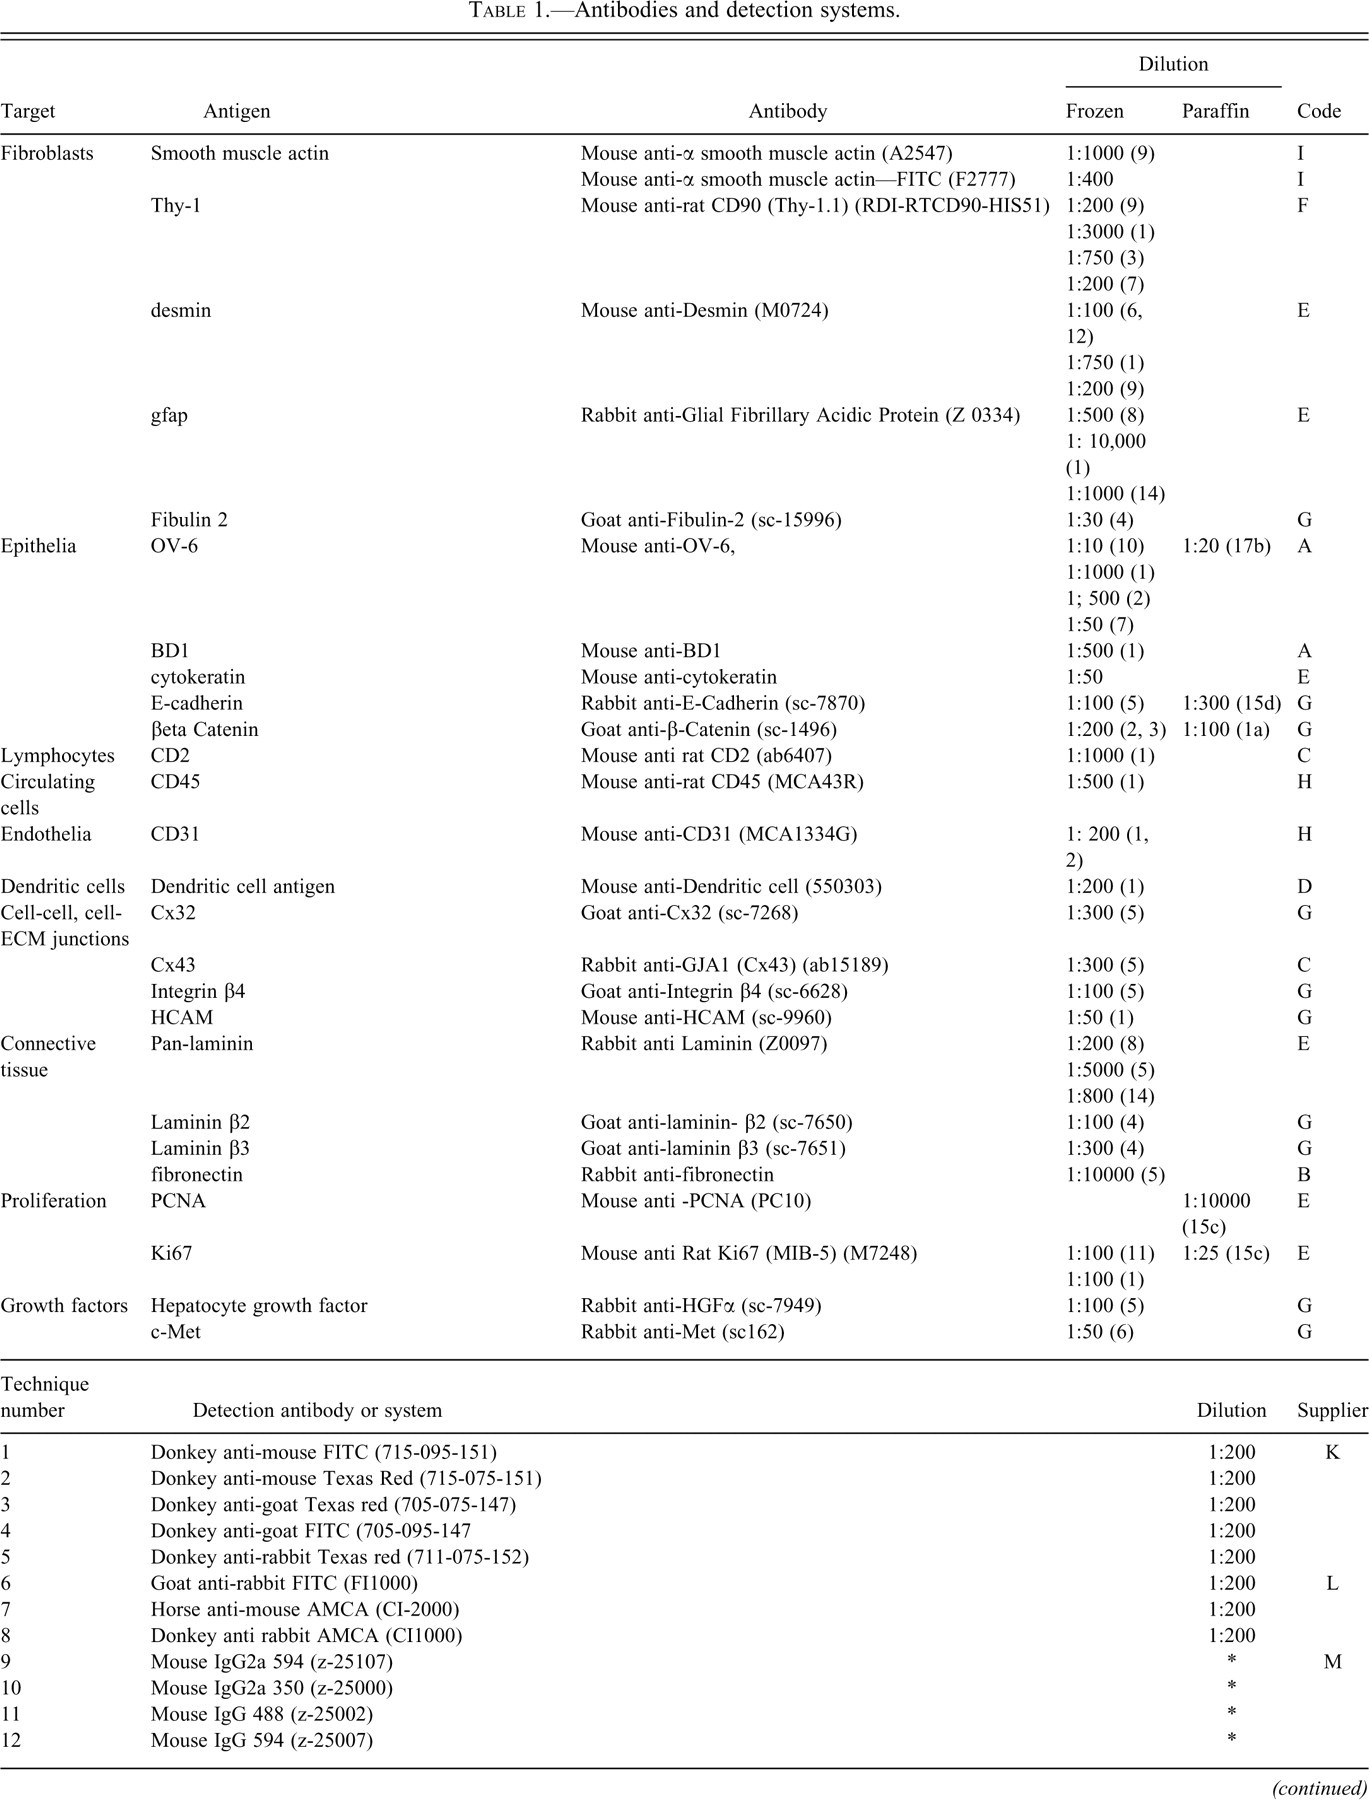
Antigen retrieval methods: When antigen retrieval was required, sections were subjected to (1) microwave-induced boiling in Vectashield for 10 min and left to cool in the solution for twenty min, (2) microwave-induced boiling in 0.37% EDTA (pH8) for ten min and left to cool in the solution for twenty min, (3) microwave-induced boiling in 0.01M citrate buffer (pH6) for ten min and cooled immediately, or (4) pressure cooking in Vectashield™ for two min and left to cool in the solution for twenty min. An asterisk (*) indicates application per supplied instructions.
Immunocytochemical Methods
Similar methods were used for fluorescent and colorimetric techniques. The applied techniques for wax sections are based on methods outlined by Miller (2002). Colorimetric detection was by an avidin streptavidin horse radish peroxidase (HRP) method using 3,3′-diaminobenzidine tetrahydrochloride (DAB) as the chromogen. Frozen sections were bought to room temperature and air-dried for thirty min before being fixed in 0.04% paraformaldehyde in PBS for three min followed by washing in PBS before being stained by a standard indirect immunofluorescent technique. Prior to drying and mounting, sections were postfixed in 4% paraformaldehyde in PBS for five min. For dual and triple labeling, sections were stained as above but, following a wash in PBS, were reincubated with further primary antibodies labeled prior to application with the appropriate Zenon™ reagent (Molecular Probes Inc., Eugene OR USA) that bound alexafluor dyes of complementary fluorescent color to these additional primary antibodies. Incubation was for one hr at room temperature.
Specificity was demonstrated by the exchange of the primary antibody for isotype control, nonimmune serum or immune serum of the same isotype against an unrelated antigen. For certain antibodies, the target antigen was also added to the primary antibody solution to adsorb the antibody to prevent staining. Titration of primary antibody was performed to select an optimum concentration that showed no or minimal background staining. Sections were examined using an Axiocam 2 fluorescent microscope (Carl Zeiss, Welwyn Garden City, UK) fitted with an Axiocam camera and running Axiovision software. Digital images were postprocessed, where necessary, by computer software to reproduce the tone and stain intensity of the original microscope slide.
Quantitative Estimation of Cell Parameters
For assessment of the number of HSC per unit area of parenchyma, the number of GFAP positive HSC were counted within a minimum of 20 microscopic field at nominal ×20 magnification. For assessment of the proliferative indices of fibroblast populations, the proportion of cells coexpressing Ki67 amongst cells stained with either GFAP, desmin, or Thy-1 were counted. A minimum of 500 cells of each fibroblast type were assessed.
Limited Three-Dimensional Reconstruction of Cholangiofibrosis
Using serial 4-μm sections, three-dimensional (3D) reconstruction of areas of early CF was performed from a rat taken from the day 20 time point with extensive CF. The sections were stained for OV-6 antigen to demonstrate biliary cells and a chromogenic (DAB) label applied. Photographs of the same areas within each section were taken (Axioplan 2 imaging, Carl Zeiss Light Microscopy), which were subsequently rotated using standard image processing software (Paint Shop Pro 7) so that the sections were in correct orientation. These were then post-image-processed on a Zeiss KS400 version 3.0 (Imaging Associates Ltd, Bicester, UK) to isolate stained cells from background. The sections were then superimposed and reconstructed in 3D using “Inside 4D™” 3D reconstruction software (Carl Zeiss Light Microscopy). This software allowed rotation and slicing of the composite image in 3D to track the origin and interconnectivity of OV-6 positive biliary ducts and their relation to IM.
Results
Gross Findings
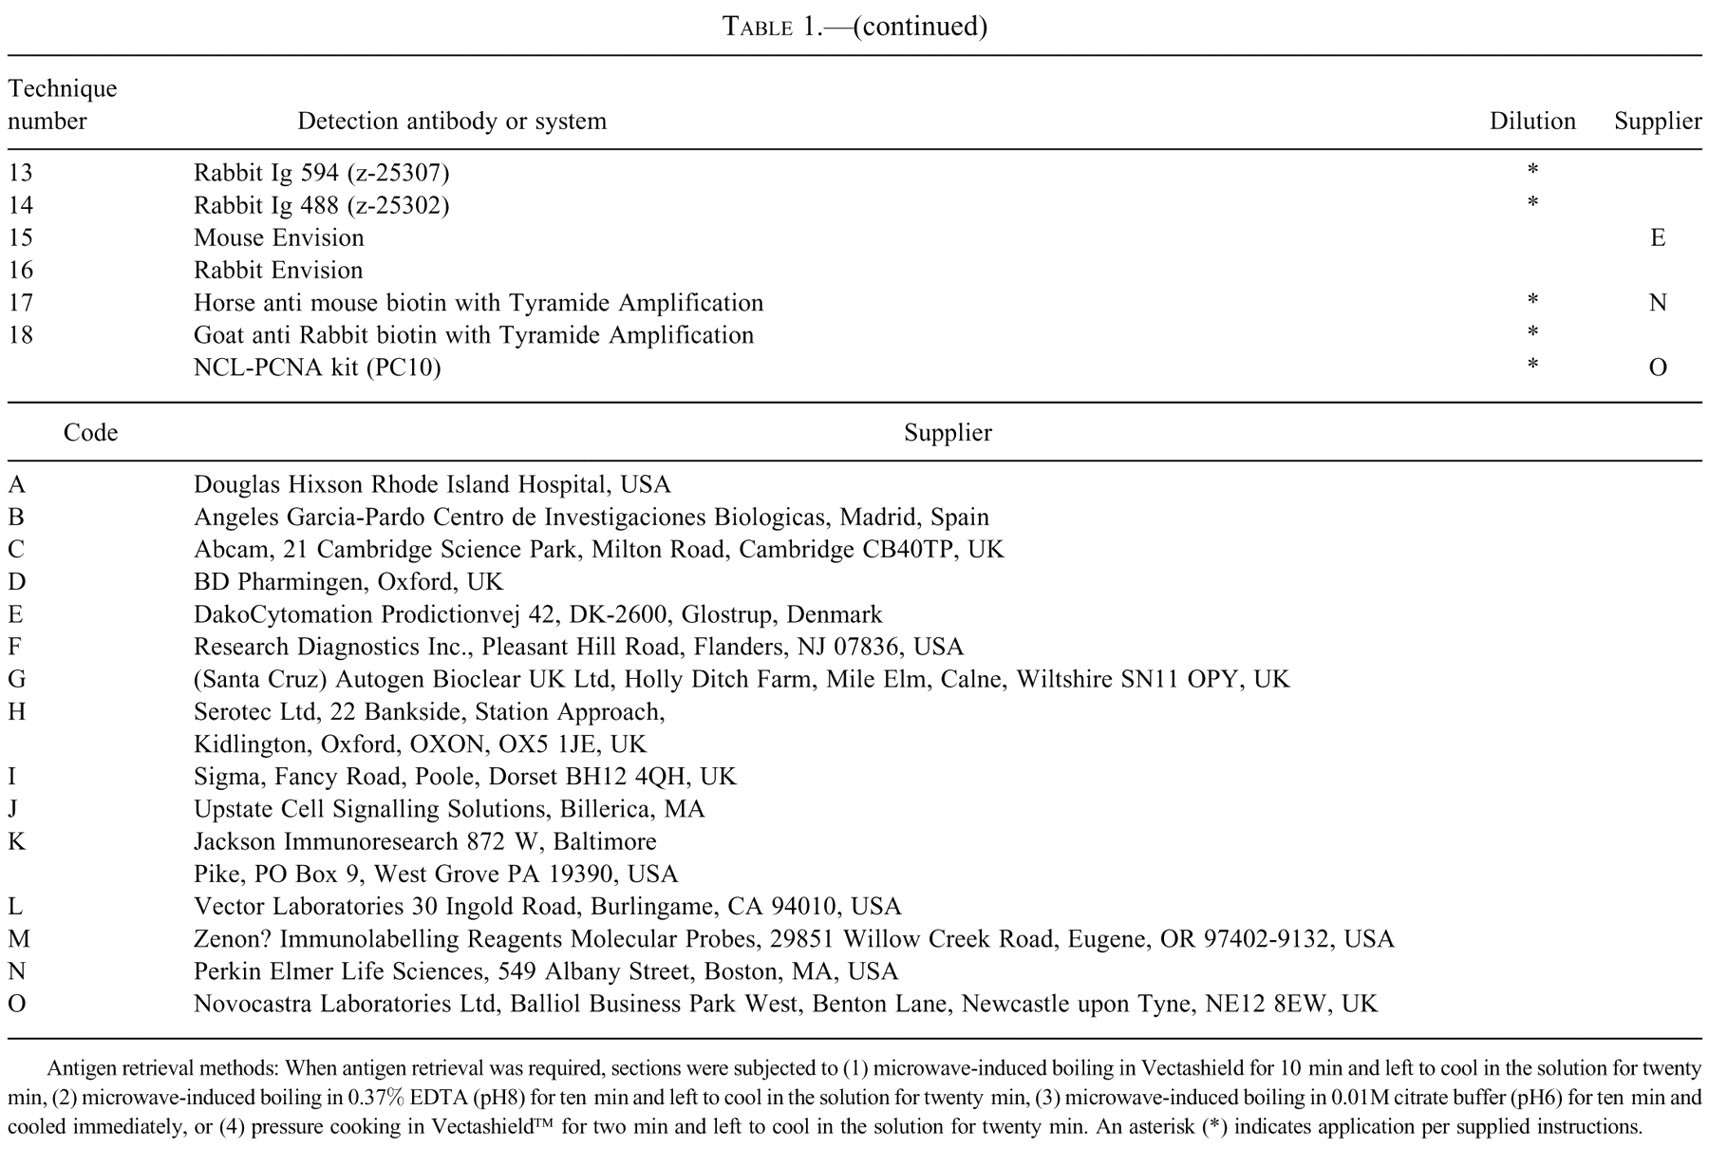
At seven days, the liver was pale with swelling and distortion of the caudate and right anterior lobe. This change was more marked at ten and twelve days, and the lateral edge of the left lobe was also pale. In addition, small nodularities appeared on the left lateral edge and anterior surface of the right and caudate lobes. By twenty days, there was marked swelling and distortion of the caudate and right lobes and, on occasion, fusion between the lobes, making identification of the individual lobes difficult. By three months, all lobes appeared pale tan or yellow in color with marked surface irregularities (Figure 1).
Rat liver after 3 months of furan treatment. Caudate right and left (target) lobes appear pale and nodular (arrows). Surface irregularities are present on all lobes.
Histological and Immunocytochemical Findings
Control Liver
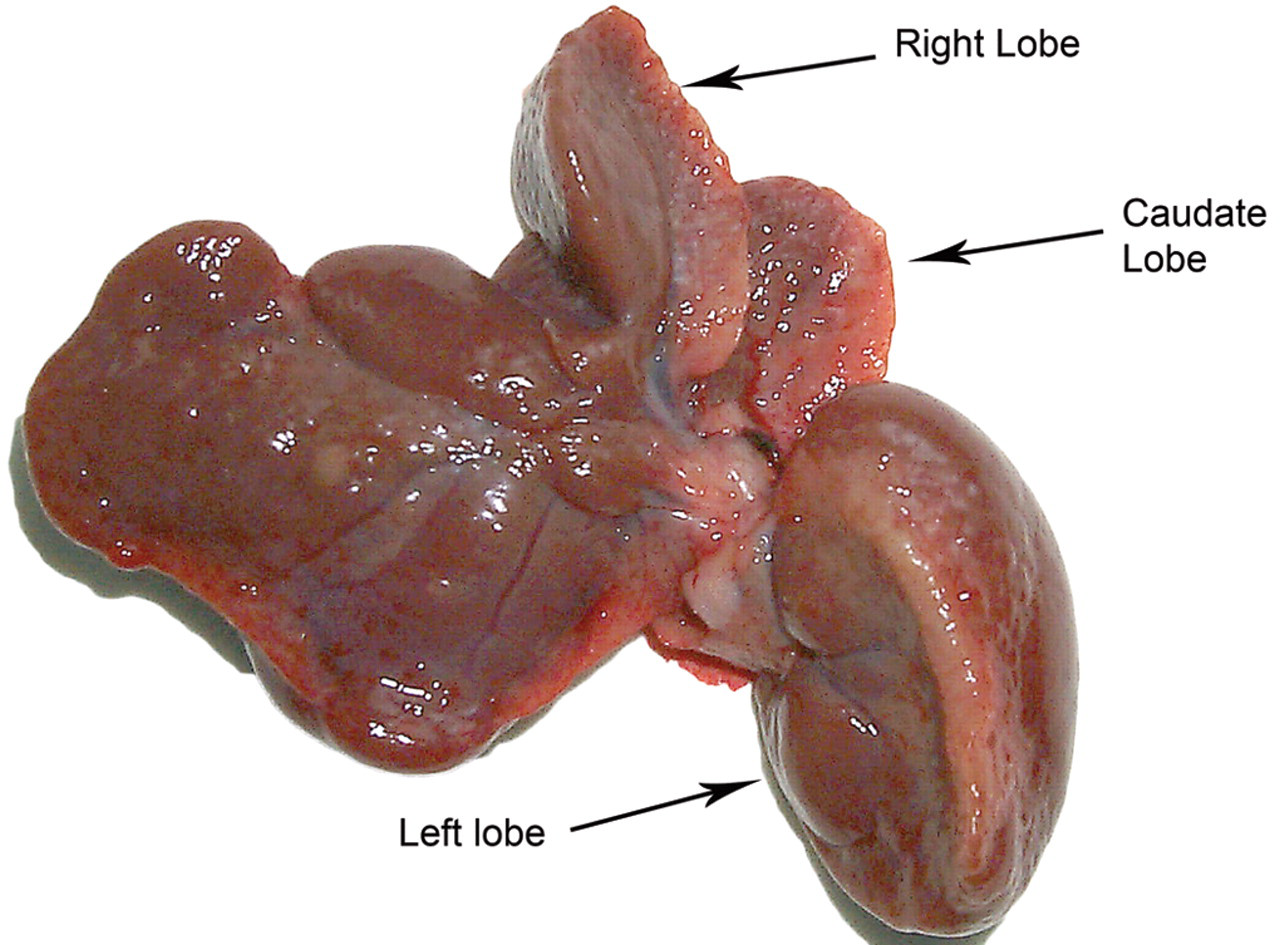
The histology of control liver was typical for rats of this strain and age. β-catenin was evenly distributed on the plasma membrane of hepatocytes and biliary cells while Cx32 showed a typical punctuate pattern consistent with staining of Cx plaques of hepatocytes (De Maio, Vega, and Contreras 2002). In contrast, E-cadherin and HCAM weakly stained mature hepatocytes. Biliary epithelium stained strongly with OV6, BD1, integrin β4, E-cadherin, Cx43, and HCAM (Figure 2). There was no visible staining of hepatocytes for HGF. The receptor for HGF, c-Met, showed low-intensity staining of hepatocytes and biliary epithelium. Fibronectin, laminin, and collagen within basement membrane and connective tissue appeared essentially as described by Martinez-Hernandez and Amenta (1993).
Diagram showing variation in intensity of immunocytochemical hepatic epithelial cell markers in control liver. OV-6 and Cx43 were selected as key markers of biliary epithelium for this investigation.
Four distinct fibroblast phenotypes were seen in control liver. The first population was identified as hepatic stellate cells (HSC) that populated the parenchyma. HSC were largely GFAP positive and desmin and αSMA negative within midzonal and centrilobular areas of the liver lobe and GFAP and variably desmin and αSMA positive in periportal areas. CD31 staining of endothelial cells demonstrated a close relation between HSC and hepatic sinusoidal endothelium. A second fibroblast population, vascular associated fibroblasts (VAF), was identified around all liver vasculature apart from hepatic sinusoids. This population was desmin positive but GFAP negative, with some cells αSMA positive. A third fibroblast population could be found in close association with bile ducts. These cells were Thy-1 positive and GFAP and desmin negative and were called biliary associated fibroblasts (BAF). An additional fourth fibroblast population was found in close association with nerve ganglia of portal areas. These cells were Thy1 and GFAP positive and, as they did not respond to hepatic injury, are not described further. These findings are summarized in Table 2 .
The fibroblast populations of control rat liver.
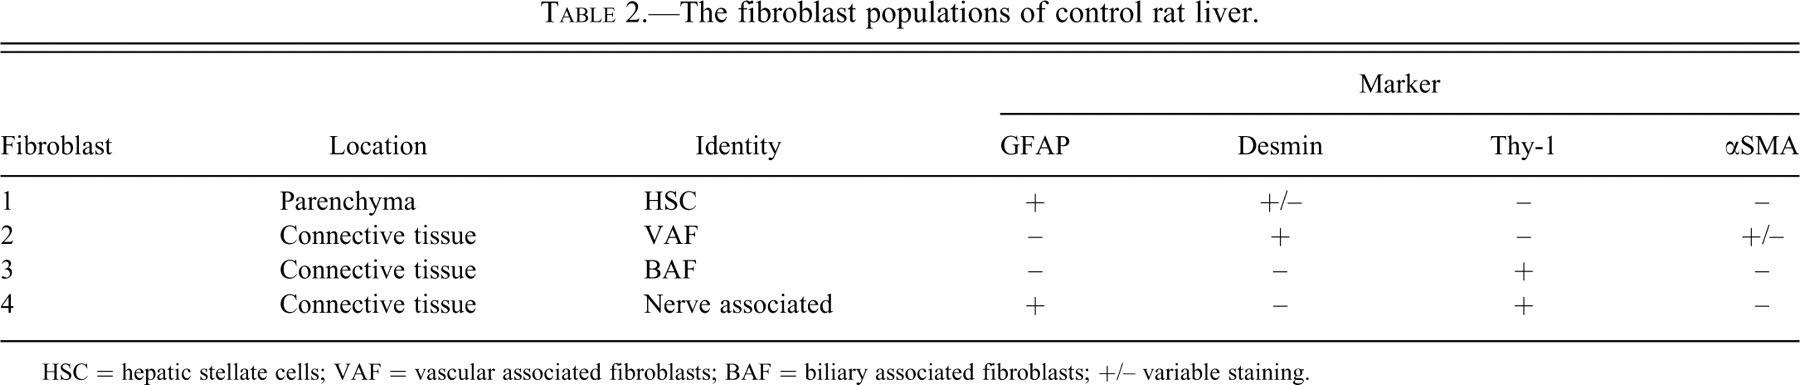
HSC = hepatic stellate cells; VAF = vascular associated fibroblasts; BAF = biliary associated fibroblasts; +/– variable staining.
The Response of Liver Following Furan Treatment
By eight hr, vacuolation, chromatin aggregation, karyorrhexis, and karryolysis were evident in hepatocytes of the centrilobular regions of all lobes but particularly in the subcapsular region near the lateral surface. These changes were more extensive and severe in the target right and caudate lobes and on occasion the lateral edge of the left lobe.
By twenty-four hr, subcapsular and centrilobular necrosis was extensive in all lobes (Figure 3a and b). The necrosis was pan-lobular in some areas of target lobes and was associated with a marked inflammatory cell infiltrate (Figure 3c). Uninjured hepatocytes in portal regions had, like control livers, a consistent membranous distribution of β-catenin together with plaques of Cx32. This distribution was lost in areas of damage at eight and twenty-four hours (Figure 4a). Such areas were associated with extensive deposits of fibronectin (Figure 4b). HSC showed retraction of their cell processes that, in control or undamaged areas, extended along endothelial cells (Figure 4c and 4d). There was also an increase in the proportion of GFAP positive HSC costaining for desmin, although the overall number of HSC per unit area of parenchyma was not changed (data not shown). There was a qualitative increase in the number of VAF, some of which also stained for αSMA, within necrotic areas around central veins. Concurrently there was an inflammatory cell infiltrate, characterized by a high proportion of CD45 positive mononuclear cells (indicative of circulating nonresident cells). Some of these cells also costained for Thy-1 or desmin, which is indicative of circulating fibrocyte origin (Bucala et al. 1994). These were most notably present where damage involved the immediate subcapsular region. Endothelium appeared to be relatively resistant to the immediate toxicity of furan, as the pattern of CD31 staining of sinusoidal capillaries of naïve liver was maintained.
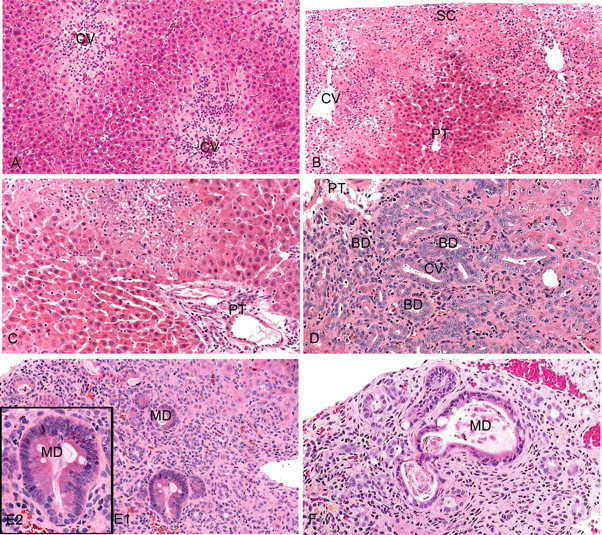
Rat liver following furan administration. H&E stain. (A) eight hr post-furan dose showing centrilobular hepatocyte degeneration, necrosis, and inflammatory cell infiltrate. (B) Extensive degeneration, necrosis, and inflammation at twenty-four hr post-furan dose around central vein of subcapsular region of target lobes. Periportal hepatocytes surrounding a portal tract appear relatively unaffected. (C) Focal areas of more extensive degeneration, necrosis, and inflammation at twenty-four hr post-furan dose extending across the liver lobe to portal areas in target lobes. (D) Biliary ducts expand from portal tracts into severely injured areas of target lobes after seven days of treatment. (E) Area of CF at twenty days of furan treatment showing several areas of IM (MD, metaplastic duct) (magnified in E2). (F) Area of CF at one month furan treatment showing a degenerate metaplastic duct and an increase in extracellular matrix. (CV—central vein, SC—subcapsular, PT—portal tract, BD—biliary duct.)
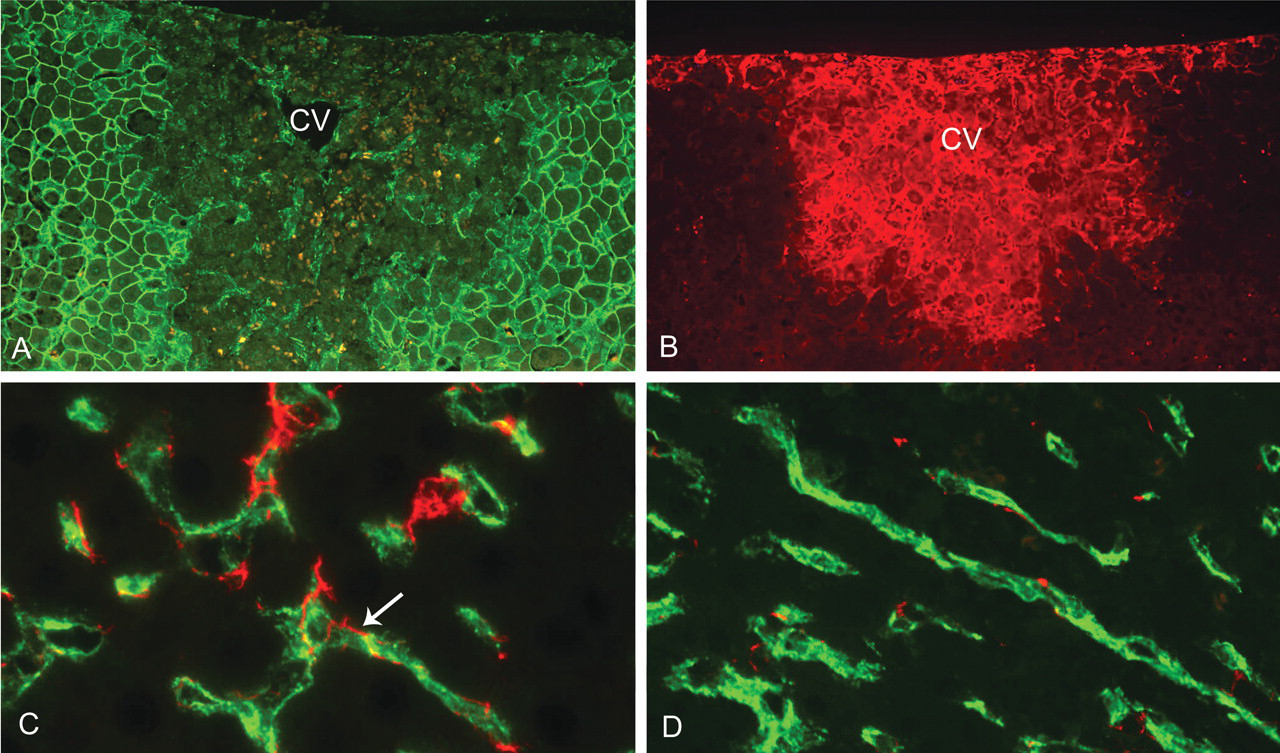
Immunocytochemistry of liver after a single dose of furan. (A) Loss of membranous β-catenin staining of hepatocytes (dark areas) in centrilobular and subcapsular areas of target lobes at twenty-four hr post-furan dose. The intense membranous green-fluorescence indicates surviving hepatocytes at the boundary of the lesion. (CV—central vein.) (B) Fibronectin deposition (fluorescent red) in similarly injured centrilobular and subcapsular regions to 4A at twenty-four hr post-furan dose. There is no fibronectin deposition in uninjured parenchyma bordering the lesion. (C) HSC (GFAP—red) with cell processes in intimate contact with sinusoidal endothelium (CD31—green) (example arrowed) of control liver parenchyma. (D) HSC (GFAP—red) in areas of liver damage twenty-four hr post-furan dose following a single dose of furan showing retraction of cell processes from the unaffected sinusoidal endothelium (CD31—green).
By three days, most of the necrosis, inflammation, and fibronectin deposition in the centrilobular region had resolved, and although individual necrotic hepatocytes could still be seen, hepatocyte replacement had occurred through the proliferation of adjacent hepatocytes. The normal β-catenin staining pattern of hepatocytes was also mostly restored (Figure 5a). This mechanism of repair resulted in the replacement of the majority of lost centrilobular parenchyma apart from focal areas, predominantly in the subcapsular region of target lobes (Figure 5b). Occasionally evidence of residual pan-lobular injury incorporating portal tracts was also apparent. Within injured portal tracts there was now a notable proliferation of OV-6 positive biliary cells, a response that was not observed in areas where repair had occurred by proliferation of surviving hepatocytes. Also, within these areas of failed repair, fibronectin deposition and inflammation were still evident in the injured parenchyma, and although there was no increase in the overall number of GFAP positive HSC per unit area of parenchyma, a further increased proportion now costained for desmin. A response of VAF and BAF was apparent with a number of these cells now being costained for αSMA, laminin, and fibronectin. The response to injury of both VAF and BAF was significantly amplified where parenchymal injury was adjacent to the liver capsule. Indeed, the proliferative indices of these cells in liver capsule, as detected by costaining with the proliferative marker Ki67, were of far greater magnitude than the liver parenchyma. For desmin positive cells, this was apparent from day 3, when 45% of desmin positive cells in the liver capsule were costained for Ki67. In contrast the response of HSC within the parenchyma was of lower magnitude (illustrated in Figure 6a, b).
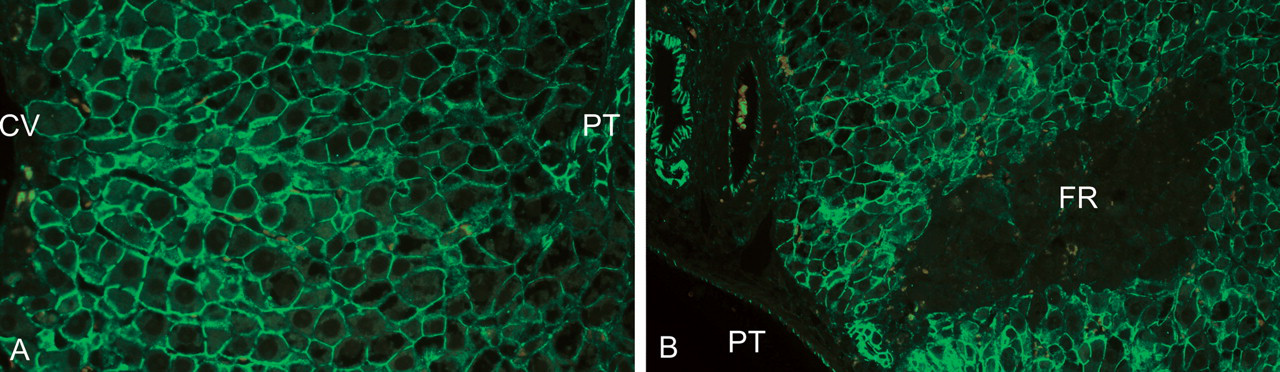
Immunocytochemistry of hepatocyte repair after three days of furan treatment. (A) Restoration of membranous β-catenin staining (green) of hepatocytes in centrilobular areas similar to Figure 4A after three days of furan treatment, indicating replacement of the majority of lost hepatocytes. (B) Following 3 days of furan treatment, there are still isolated focal areas of remaining injury in target lobes that are shown as dark areas in the parenchyma outlined by β-catenin stained hepatocytes (green). (CV—central vein, PT—portal tract, FR—failed repair.)
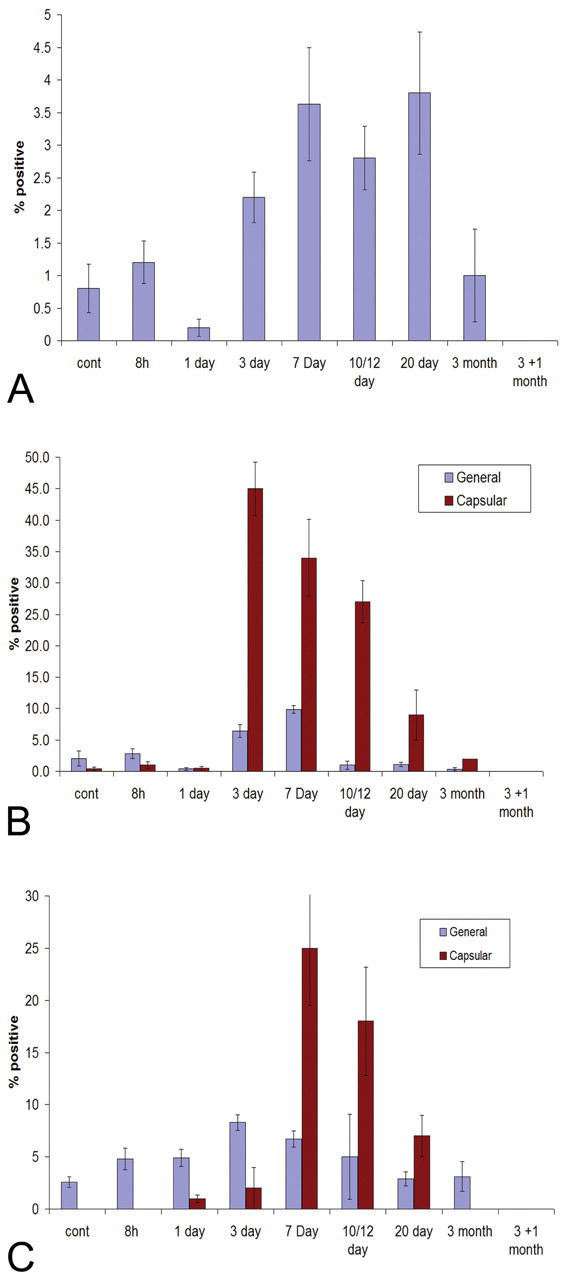
Proliferative indices of mesenchymal cells during furan administration. (A) GFAP stained HSC in growth phase (Ki67 costained) in liver parenchyma during furan administration. Increase in the percentage of GFAP cells costained with Ki67 from three to twenty days of furan treatment. This increase was of far smaller magnitude to desmin and Thy-1 stained fibroblasts. GFAP stained cells were rarely seen in the liver capsule. (B) Desmin stained fibroblasts in growth phase (Ki67 costained) in liver parenchyma and capsule during furan administration. Although representing a heterogeneous fibroblast population, a peak of proliferative activity in both capsule and parenchyma was seen at three to twelve days of furan treatment. There was a near tenfold increase in the number of proliferative desmin stained cells in the liver capsule compared to the parenchyma at these points. (C) Thy-1 stained fibroblasts in growth phase (Ki67 costained) in general liver and capsule during furan administration. Although of smaller magnitude to VAF, there was a marginal increase in Thy-1 cells costained with Ki67 at three to twelve days of furan treatment in general liver tissue. The peak of proliferative activity in the liver capsule occurred at a later time point to VAF with a far greater proportion of Thy-1 cells costained for Ki-67 in the liver capsule after seven to twelve days of furan treatment. (N = 500 cells from three animals per time point; error bars = SEM.)
By seven days, the proliferating biliary ducts had extended beyond the confines of the portal tracts into the parenchyma (Figures 3d, 7a, and 7b). As well as the marker OV-6, these ductular biliary cells showed intense staining for Cx43, E-cadherin, and integrin β4 (as indicated in Figure 2). There was increased expression of HGF and c-Met in proliferating and expanding ductular cells (Figures 8a, 9a). There was also a peak of proliferative activity for both GFAP positive HSC and desmin positive VAF populations at this time point (Figure 6a and b) and a similar increase in the proliferative indices of Thy-1 positive spindle-shaped cells in the capsular region such that 25% of capsular Thy-1 cells now also stained for Ki67 (Figure 6c).
Expansion of biliary ducts into remaining injured areas after seven days of furan treatment. (A) Biliary cells (stained by IHC for OV-6—brown) expanding from a portal tract into injured target lobe. (B) Similar area and cells to 7A stained for PCNA by IHC (brown) illustrating the enhanced proliferative state of the expanding biliary ducts.
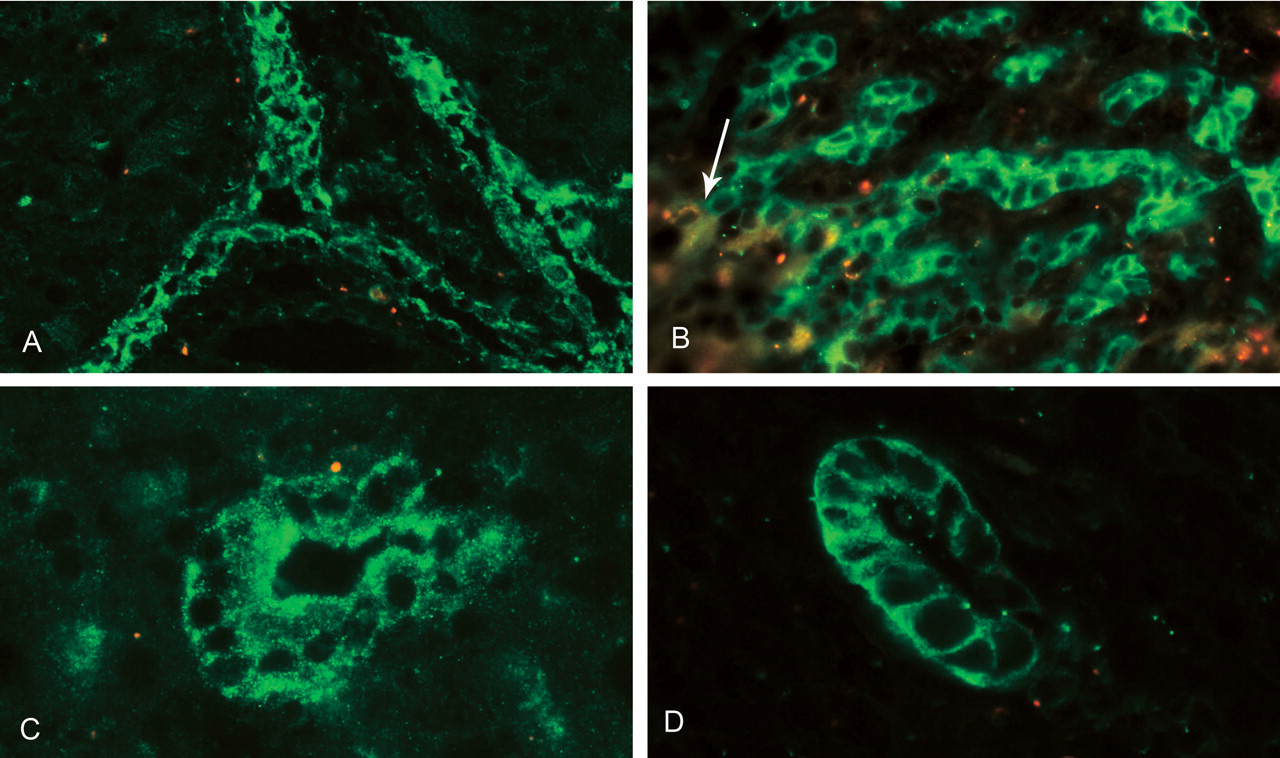
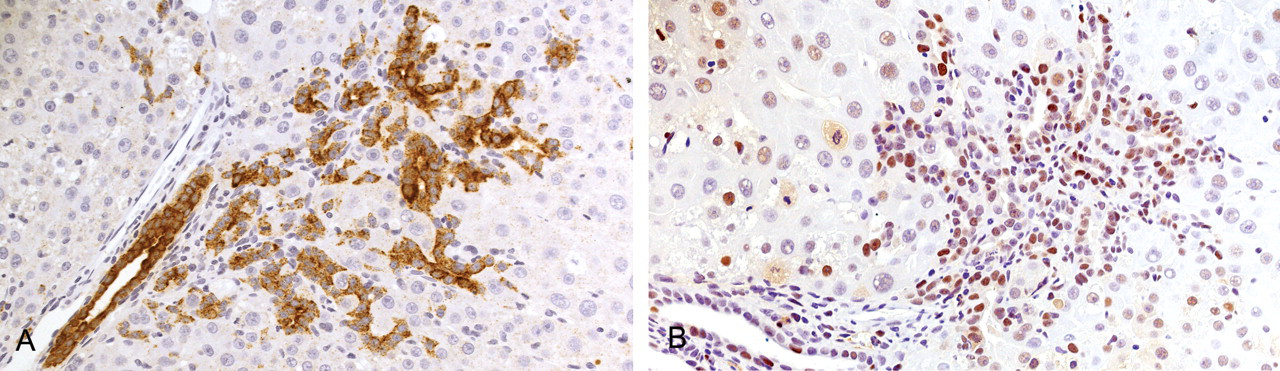
Pattern of HGF and c-Met staining during furan treatment. (A) Localization of HGF (green) to biliary cells of responding portal tracts after ten days of furan treatment. (B) Localization of c-Met staining (green) to the expanding biliary ducts and loss of staining on conversion to hepatocytes (example arrowed) after ten days of furan treatment. (C) Localization of HGF to intestinal metaplastic duct after one month of furan treatment. (D) Localization of c-Met to similar intestinal metaplastic duct to 11C after one month of furan treatment.
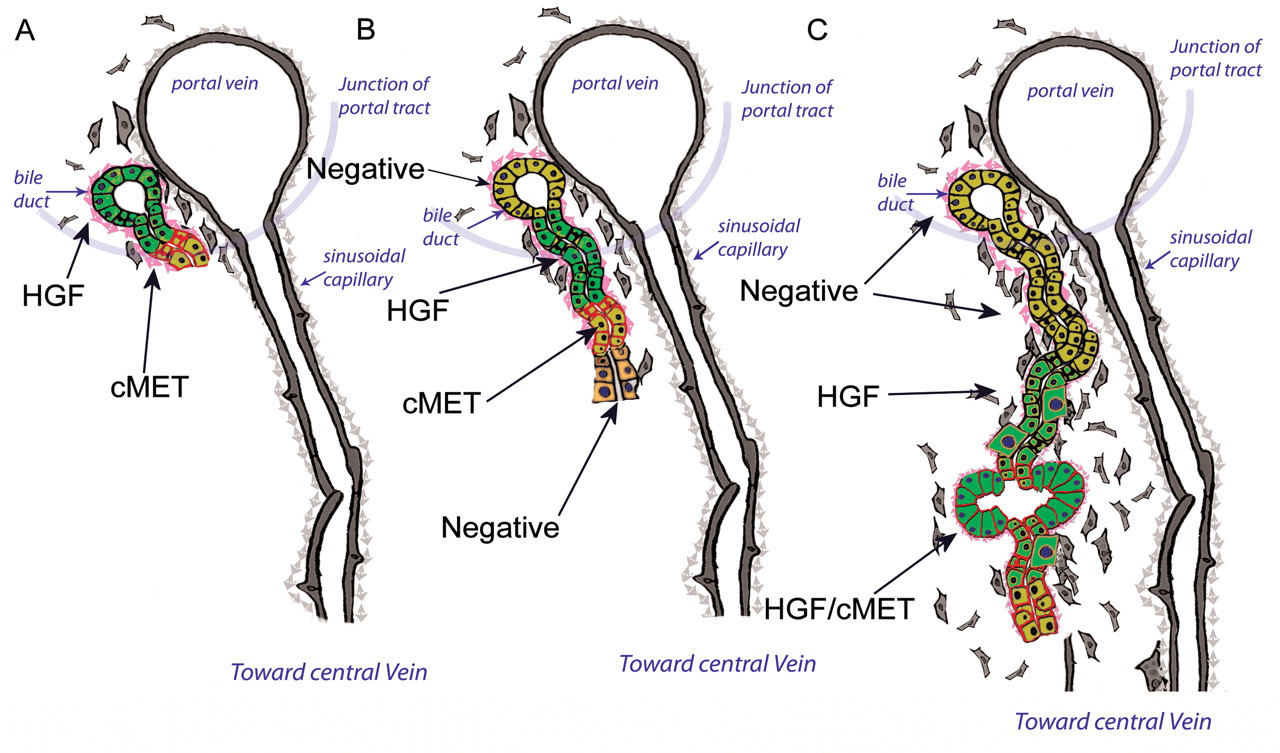
Diagram of temporal changes to HGF and c-Met expression during furan treatment. (A) After seven and ten days of furan treatment, HGF (light green cytoplasm) is confined to existing biliary ducts whilst c-Met (red membranous stain) is expressed on biliary ducts expanding into injured parenchyma. (B) After twelve and twenty days of furan treatment, HGF (light green cytoplasm) staining increase in biliary ducts situated behind the growing edges while c-Met (red membranous stain) was now most intense at the leading edge of the growing ducts and is lost on conversion to hepatocytes. (C) In areas of dysregulated repair, a similar pattern to 9B is generally seen, but in certain biliary ducts and metaplastic intestinal ducts, colocalization of HGF (light green cytoplasm) and c-Met (red membranous stain) is seen.
By twelve days, the cells of the emerging biliary ducts showed evidence of typical and atypical forms of differentiation. The typical form (seen in target and on occasion nontarget lobes) was most frequently observed close to portal areas that were still in continuity with hepatic plates. Here, the biliary cells within the expanding ducts lost the characteristic phenotype of biliary epithelium and acquired a phenotype characteristic of small hepatocytes. The transitional zone between cell phenotypes was abrupt with immediate loss of biliary markers OV-6 (Figure 10a), BD1, and Cx43. Only staining for integrin β4 was retained in cells with hepatocyte phenotype in the immediate vicinity of the interface with the biliary duct. Staining for basement membrane components such as laminin showed that the expansion of biliary epithelium was contained by a laminin-rich basement membrane (BM). Degradation and loss of the BM coincided with differentiation to the hepatocyte phenotype (Figure 10b). Thy-1 positive BAF now varyingly costained for laminin, fibronectin, αSMA, and desmin were closely associated with the BM of proliferating biliary ducts emerging from portal areas (Figure 11a and b). VAF were also associated with ductular expansion, but these cells lay deeper in the associated matrix. As ductal cells differentiated into hepatocytes in the process of ordered biliary to hepatocyte repair, the adjacent BAF cells were lost. Furthermore, the still intact sinusoidal endothelium appeared to provide the scaffold that directed the course of expanding biliary ducts prior to the differentiation of the ductular biliary cells to hepatocytes. In summary, these changes appeared to represent a normal repair process, as they were not associated with a transient inflammatory response or significant matrix deposition.
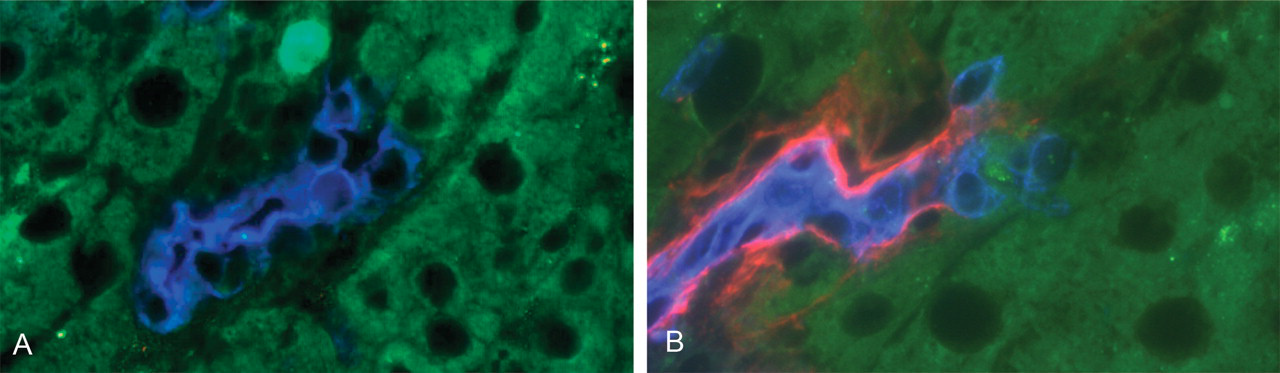
Ordered conversion of expanding biliary cells to hepatocytes after ten and twelve days of furan treatment. (A) Biliary cells (OV-6—blue) showing abrupt loss of this marker at the junction of phenotypic change to hepatocytes (autofluorescent green). (B) Similar area to 10A showing abrupt loss of basement membrane (laminin—red) at the point of conversion of biliary cells (OV-6—blue) to a hepatic phenotype (green—autofluorescence).
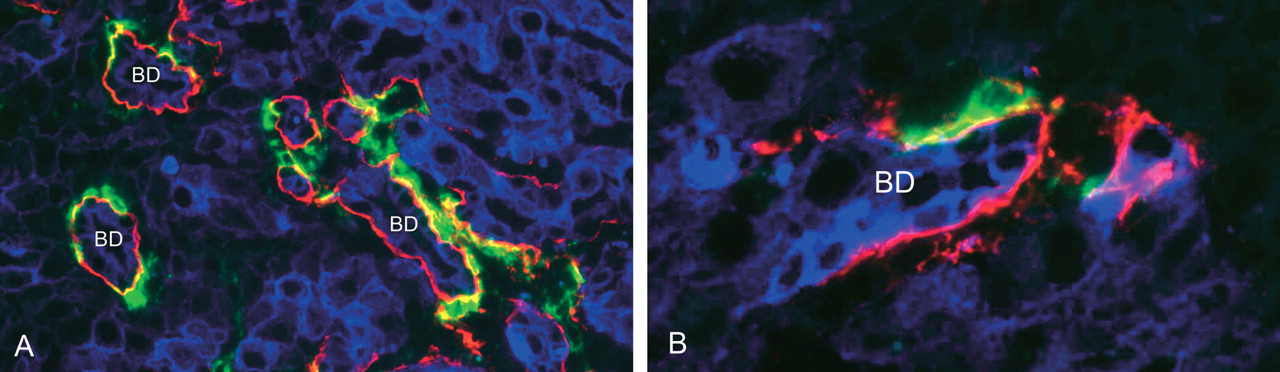
Localization of BAF to expanding biliary ducts at ten, twelve, and twenty days of furan treatment. (A) Low-power view of areas of biliary duct (BD) expansion (pan-cytokeratin—blue) with BAF (green—Thy-1) localized to the basement membrane (laminin—red) of the ducts. (B) High-power view of similar area to 11A that identifies BAF (Thy-1—green) lying immediately below the basement membrane (laminin—red) of a BD.
An atypical form of this repair process was, however, observed in target lobes where the initial injury was extensive. Here, the process of abrupt differentiation of the expanding biliary ductular cells to hepatocytes did not occur, and focal tortuous extension of the ductular system was observed within the parenchyma with persistence of a BM, Cx43, and integrin β4 staining. In such areas there was occasional differentiation of individual or clusters of biliary cells to cells with hepatocyte phenotype within the confines of the ductular BM (Figure 12a). These cells could be considered an intermediate phenotype as there was also persistence of expression of the biliary marker OV-6 in some hepatocyte-like cells (Figure 12b) and absence of organized Cx32 staining. In addition, at day 10 and beyond, within the confines of a basement membrane, focal areas of biliary cells phenotypically changed to become columnar in appearance with a prominent brush border and a basally placed nucleus. This feature preempted the appearance of a completely metaplastic phenotypic change to cells of an intestinal phenotype (hereafter described as intestinal metaplasia [IM]) by day 12 (Figure 3e1 and e2). Staining for laminin subtypes within the basement membrane showed abundant laminin β1 but did not detect appreciable amounts of laminin β2 or β3, indicating that laminin 5, a form characteristic of intestinal BM, was not present. The metaplastic intestinal cells stained for OV-6, BD1, and E-cadherin and in this respect resembled biliary epithelium although there was absence of significant Cx43 staining. Conversely, these cells showed increased staining, compared with normal biliary epithelium, for HCAM, which is consistent with the normal intestinal phenotype. There was, however, increased staining for integrin β4 when compared with both normal biliary epithelium and normal small intestine. The metaplastic intestinal cells were more frequently positive for PCNA than adjacent cells of biliary phenotype, indicating an active proliferative state. These outgrowths of biliary ducts showed intense staining for c-Met (Figure 8b, 9b). As the ducts extended into the hepatic parenchyma, c-Met staining was maintained at the leading edge of outgrowths, whereas HGF staining was more intense just behind the leading edge. This pattern incorporated areas of IM (illustrated in Figure 9c). These features, together with associated extracellular matrix (ECM) deposition, were considered typical of early CF. This expanding ductal system became associated with a mixed fibroblast population of BAF, VAF, and HSC. A gradient of decreasing VAF number could be seen that commenced from the subcapsule into the deeper parenchyma, indicating migration from the subcapsule into these areas. Compared to the influx of VAF there was a more limited but still significant increase in BAF-like cells in the injured liver at these time points but these remained concentrated to the capsule. A proportion of BAF and VAF coexpressed αSMA, indicating activation to myofibroblast forms.
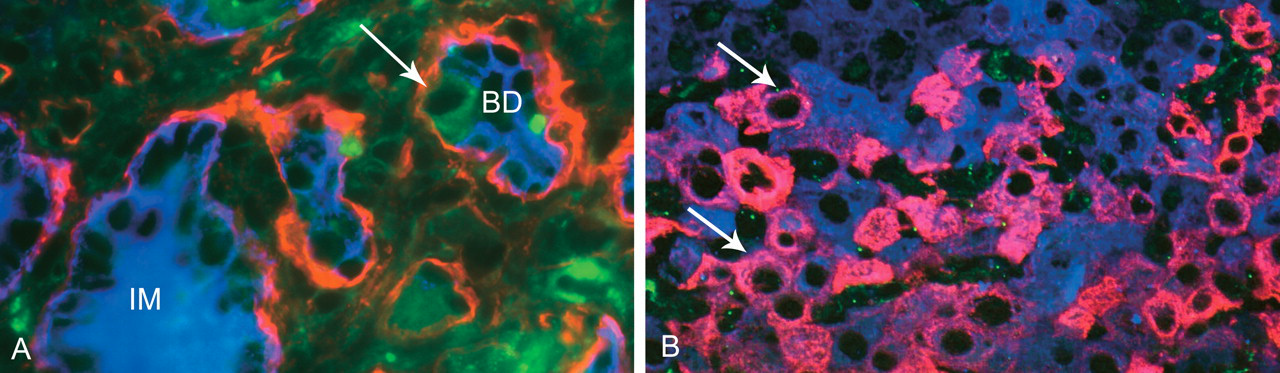
Dysregulation of biliary repair process at day 12 and day 20 of furan treatment. (A) Cross-section of biliary duct (BD) (biliary cells blue by OV-6) encapsulated by basement membrane (laminin—red) showing loss of OV-6 and alteration of cell phenotype to hepatocyte morphology (arrowed autofluorescent green) whilst still retained within the duct by a BM. An area of intestinal metaplasia (IM) (still positive with OV-6—blue) is also present. (B) Persistence of biliary marker OV-6 (now pink fluorescence, examples arrowed) in cells with hepatocyte morphology. OV-6 positive and negative hepatocytes are costained blue by pan-cytokeratin.
There was commencement of a gradual increase in general ECM deposition around the central veins of both target and nontarget lobes indicative of centrilobular fibrosis. Although more severe in target lobes, the appearance and progression of centrilobular fibrosis appeared independent of the focal, target lobe specific, appearance of CF. The proliferation of VAF-like cells located in the liver capsule and parenchyma had returned to control values by ten days; however, a raised proliferate rate of GFAP positive HSC (although always of lower magnitude compared to VAF) was maintained (Figure 6a and b).
By twenty days, proliferating biliary ducts now replaced much of the parenchyma of injured target caudate and right lobes. On occasion the expanding ducts had tracked completely across the lobule to populate centrilobular regions where centrilobular fibrosis had become established. Bridging centrilobular fibrosis therefore became conduits for expansion of CF across the liver lobe. CD31 staining of endothelium detected significant vascular remodeling of sinusoids, and a branching vascular network became apparent within CF. At certain sites of developing CF, CD31 immunostaining became granular and inconsistent, indicative of breakdown of sinusoidal structure. Within the regions of CF both reactive and degenerate areas were observed. In degenerate areas, certain ducts were now distended with cellular debris and mucin (Figure 3f). The limited 3D reconstruction of areas of CF observed at 20 days revealed that sites of IM appear as small outgrowths or dilatations from proliferating biliary ducts (Figure 13a and b). They also show that the ducts remain connected to the main bile duct system within the portal tract (Figure 13c and d) and form a complex of branched interconnections with each other. The pattern suggests that the ducts of CF are composed of a series of loops, rather than a single tortuous duct or multiple ducts originating from the portal tract. The instigation of CF was not associated with a marked change in phenotype of the resident population of parenchymal HSC in uninjured areas. These remained essentially GFAP positive and desmin negative, characteristic of the quiescent state.
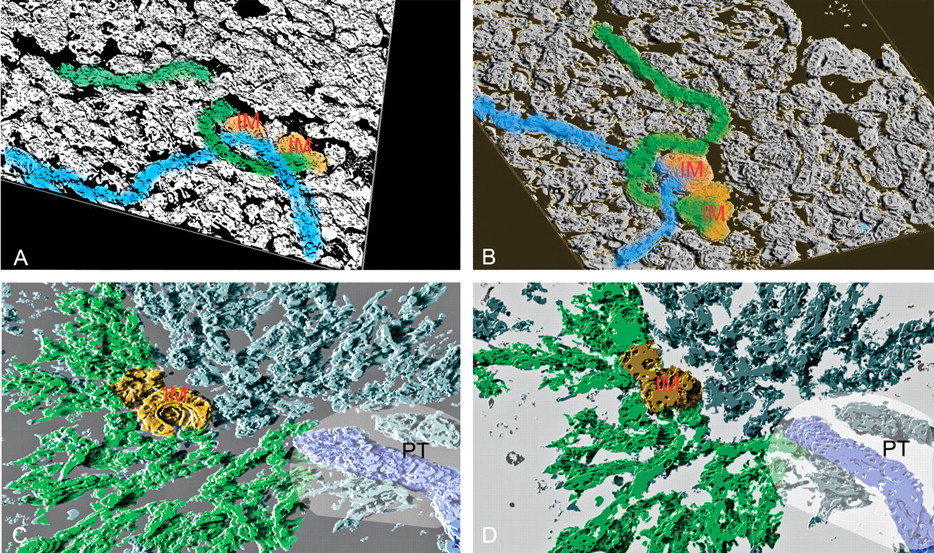
3D reconstruction of area of CF after twenty days of furan treatment. (A) and (B) show two views of the same area of CF, illustrating that two adjacent areas of metaplasia arise from different ducts. The IM is highlighted orange whilst the associated ducts are blue and green. (C) and (D) show views from the top of and underneath a reconstruction showing the direct relation between the major bile duct of a portal tract, the biliary ducts of the associated CF, and their linkage to an area of IM. In both reconstructions, it is likely that all ducts are connected, as they appear as a series of loops off adjacent ducts. The IM is colored orange, the bile duct of the portal tract is colored blue, and the linking ductular system is highlighted green. The approximate location of the portal tract (PT) is shown. (IM—intestinal metaplasia, PT—portal tract.)
Beyond twenty days to three months and three months with one-month off-dose recovery, the density of Cx32 plaques on remaining isolated islands of hepatocytes of target lobes gradually diminished over time and did not recover during the off-dose period. Also within target lobes there was gradual loss of the close relation between endothelium and HSC. HSC had largely disappeared from the surviving hepatic parenchyma of target lobes by three months, and their number did not recover during the one-month off-dose period. Within areas of mature CF, there were further increases in VAF and more notably BAF, such that by three months BAF cells became the most common fibroblast phenotype within areas of CF. Conversely, VAF cells predominated in areas of bridging centrilobular fibrosis that became a common feature in both target and nontarget lobes. Centrilobular fibrosis and CF progressed at each time interval, resulting in gross distortion of the normal hepatic parenchymal architecture by three months. In one-month-off-dose animals, there was no obvious reduction in incidence or areas of CF, although there were increased areas of degenerative ducts characterized by decreased cellularity but increased laminar deposition of the surrounding ECM. Within the inflammatory cell population, there was also a gradual increase in the proportion of CD2 positive lymphocytes. At later time points, only active areas of CF had biliary ducts that were positive for HGF and c-Met. A small proportion of metaplastic intestinal ducts showed intense staining for both HGF and c-Met (Figure 8c and 8d).
Discussion
Our detailed time course/stop study design with histological and immunocytochemical investigations and limited 3D reconstruction has provided evidence that the development of CF arises from perturbation of a portal bile ductular hepatocyte repair process that is instigated following severe injury to portal and subcapsular parenchyma. We confirm the initial observation of Sirica and colleagues that certain areas of intestinal metaplasia (IM) within early CF show persistent expression of c-Met and evidence of increased cell proliferation. This phenotype is also characteristic of the “intestinal form” of CC that later develops, suggesting an important role of IM in the development of carcinoma (Radaeva, Ferreira-Gonzales, and Sirica 1999). It is now well established that mesenchymal/epithelial interaction plays an important part in epithelial differentiation in the gut and other tissues (Yuasa 2003; Scharfmann 1999; Hagios, Lochter, and Bissell 1998). Furthermore, the stroma and the signals that stromal cells secrete play an important role in cancer progression and behavior (Tisty and Hein 2001; Mueller and Fusenig 2004; Kalluri and Zeisberg 2006).
Multiple mutations in p53 and p16 have been reported in human CC (Jankowski et al. 1999; Trudgill et al. 2003), yet mutational changes have not been reported in examples of IM in animal models of CF. Without evidence of a mutational change, an epigenetic process should be considered. However, furan intoxication is associated with considerable oxidative stress, which is suggested as an indirect mechanism of subsequent genotoxicity (Radaeva, Ferreira-Gonzales, and Sirica 1999; Hickling et al. 2010).
From our results, we postulate two distinct processes that have a profound influence on the outcome of furan intoxication. In the first process, there is rapid restitution of the hepatic structure with maintenance of the relationship of the various cell types. In the second, there is disruption of the normal hepatic structure with abnormal expansion of bile ducts and subsequent CF. The differences in the response are superimposed on three anatomic forms of injury: general centrilobular necrosis and repair by hepatocyte regeneration, focal panlobular necrosis and portal biliary response, and focal subcapsular necrosis and subcapsular response. It is unclear what determines the difference in response, but it is probable that there is severe perturbation of the relationship between the epithelial and mesenchymal components. Following initial injury, the immediate response was a massive deposition of fibronectin. This deposition resolved rapidly in areas subsequently repaired by hepatocyte regeneration but was retained in the most severely injured areas preceding failure of hepatocyte regeneration and development of CF. This change may, in part, explain the difference in response, as high concentrations of fibronectin inhibit hepatocyte proliferation (Kim et al. 1997). Furthermore, in areas of repair of centrilobular injury by simple hepatocyte proliferation, the normal sinusoidal structure was maintained, although there was an initial marked retraction of hepatic stellate cell processes during this phase (days 1 to 3). Proliferation of bile ducts and deposition of connective tissue are two features that characterize CF, which is further defined by areas of IM within the ductal component. The lesion is thus morphologically complex, and in this article, we have further characterized the developing lesion using immunocytochemical markers for fibroblasts, ECM, endothelium, and epithelium. The epithelial response to severe pan-lobular injury is summarized in Figure 14. This shows an orderly response in which biliary cells emerge from existing portal tracts at seven days. The majority of these outgrowths form well-differentiated biliary ducts that appear to be part of an orchestrated ductular repair process.
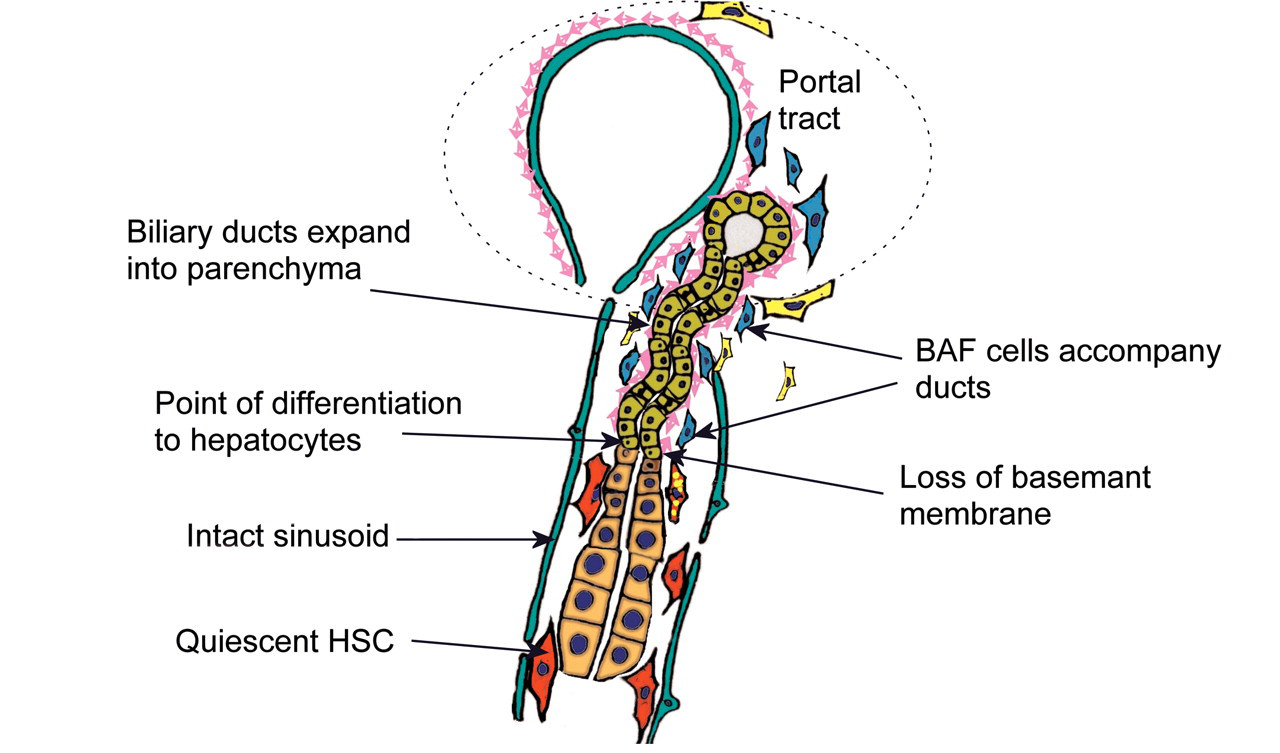
Illustration of ordered hepatocyte repair by expansion of biliary ducts and conversion to hepatocytes. Biliary ducts expand into injured parenchyma contained within basement membrane and accompanied by BAF, utilizing undamaged sinusoids as a scaffold. Conversion to hepatocyte phenotype coincides with loss of basement membrane and switch of fibroblast phenotype to HSC. There is minimal accompanying inflammation in this process.
Similar ductular responses following injury by hepatotoxins other than furan have been previously reported, and the term “oval” cell, originally described by Farber (1956), has been commonly applied to the ductular extensions within liver parenchyma. A more detailed classification is offered by Sell and colleagues (Sell 1997), where three types of ductular response (types I, II, and III) can be distinguished based upon the location of the responding liver stem cell population. Such a definition would characterize the response in the present investigation as a “type II” HPC response. Sell and colleagues additionally describe the response of a periductular pluripotent reserve cell population (type 0) that appears capable of differentiating to hepatocytes (Sell 2001; Yin, Lynch, and Sell 1999). Periductular hepatocyte regeneration was not seen in areas of CF in our investigation, although it is of note that the type 0 cells described by Sell share expression of the Thy-1 marker with the BAF population that we describe. We have also shown that HGF and its receptor c-Met are expressed by the expanding ducts, with the receptor most strongly expressed at the tip of growing ducts and HGF concentrated in cells just posterior to the tip. This distribution suggests that HGF may have an important role in controlling duct proliferation.
The Thy-1 positive BAF population remained in intimate contact with the basement membrane of the expanding biliary cell ducts, suggesting an instructional role in a manner described for fibroblasts located in a similar position in intestinal epithelium. Thy-1 positive fibroblast populations are described in eye, lung, and skin (Koumas et al. 2003; Phan 2003; Zhou et al. 2004; Barker et al. 2004), and although there are reports of a Thy-1 mesenchymal cell population in fetal mouse liver (Hoppo et al. 2004), we believe this is the first observation of such a cell population in a rat model of CC. Dissolution of the basement membrane and loss of BAF coincides with differentiation of ductular cells to hepatocytes. Parenchymal HSC then become the sole accompanying mesenchymal cell type, and a normal sinusoidal relation with hepatocytes, HSC, and endothelial cells is reestablished. In areas of dysregulated repair there was a characteristic failure in the process of basement membrane degradation, and this may be a crucial step in the normal repair process. In these areas, there was also a gradual loss of the normal sinusoidal structure as determined by CD31 staining together with a persistent inflammatory cell infiltration and persistence of VAF in the parenchyma. The involvement of portal fibroblast populations in liver fibrosis is consistent with the investigations of Ramadori and Saile (2002), Cassiman et al. (2002), and Wells et al. (2004). The dysregulated process leading to instigation of CF with IM is illustrated in Figure 15.
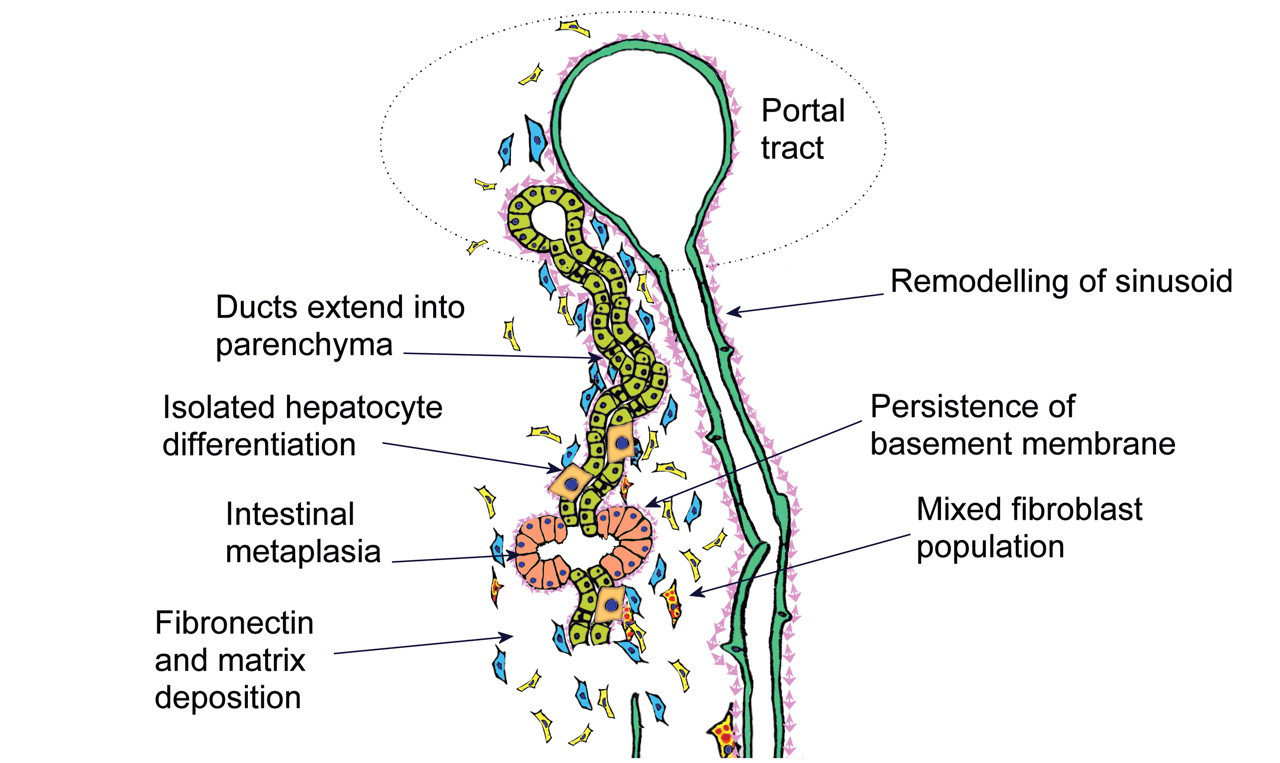
Illustration of dysregulation of the hepatocyte repair process. Biliary ducts expand into injured parenchyma contained within basement membrane and accompanied by BAF, but conversion to hepatocyte phenotype is impaired with persistence of basement membrane and a mixed fibroblast population amongst an ECM rich in fibronectin. Sinusoidal remodeling and continuing chronic inflammation coincide with sporadic piecemeal differentiation to hepatocytes and appearance of intestinal metaplastic ducts. These features of CF appear as early as day 10 of furan treatment and progress even during the off-dose recovery period.
A number of potential sources have been proposed for the origin of IM within areas of CF: biliary cells, hepatocytes, cholangiolar HPC stem cell (type I to III), pericholangiolar, bone marrow derived, HPC stem cells (type 0), and mesenchymal-epithelial transition. Three-dimensional reconstruction of the proliferating biliary tree from serial histological sections confirm that IM is an integral part of the ductal system. Furthermore, in some areas the metaplastic ducts show a mixed biliary/intestinal phenotype. A similar response is seen in the modified Solt-Farber procedure in the rat that uses a combination of bile duct ligation followed by treatment with hepatotoxins (Alison et al. 1997; Paku et al. 2001, 2004; Sell 2001). However, this does not agree with the study of Jamison et al. (1996), who concluded that the IM observed in liver following chronic chloroform exposure did not arise from bile ducts but from hepatocytes.
The lack of staining for laminin β2 and β3 chains indicates that laminin 5 is not present in the basement membrane beneath areas of IM. Laminin 5 is considered a key regulator in the expression of the normal intestinal phenotype (Beaulieu 1997). Its absence indicates that this intestinal differentiation is not equivalent to that seen in the gut. Nonetheless, deposition of fibronectin in areas of IM was similar to that of the fibronectin-rich matrix surrounding normal intestinal crypts.
A possible conclusion from this study is that it is loss of the normal cellular signals that control appearance of the hepatocyte phenotype that facilitates abnormal differentiation and therefore appearance of an intestinal phenotype. A similar conclusion was made by Paku et al. (2004) following administration of 2-AAF to rat. Epithelial differentiation is dependent on interaction with mesenchyme in a number of tissues including the gut, pancreas, mammary gland, lung, and prostate (Beaulieu and Vachon 1994; Simon-Assmann et al. 1995; Yuasa 2003; Scharfmann 1999). The differentiation of the gut requires the differential expression of a number of genes including various members of the homeobox genes and the WNT signaling pathway. The expression of these genes is site-dependent and requires interaction between the epithelium and ECM (Kedinger et al. 1998). The WNT signaling pathway and β-catenin play an important role in hepatic development and growth and in a variety of pathological processes including oxidative stress and fibrosis (Thomson and Monga 2007). Factors regulating bile duct proliferation and differentiation are poorly understood. However, it would be reasonable to assume that, as in other organs, interaction between the epithelium and mesoderm is important (Jhandier et al. 2005). Indeed, Jhandier et al. (2005) suggested that activated portal fibroblasts are instrumental for bile duct proliferation.
The use of specific cellular and ECM markers in this study highlights the complex nature of the hepatic response to injury. We have reported in an accompanying paper evidence of sustained oxidative stress and upregulation of cdk-1, c-Met, and phosphorylated c-Jun proteins in livers following furan administration (Hickling et al. 2010). Oxidative stress in hepatocytes has been shown to stimulate secretion of collagen and laminins by adjacent cells (Nieto et al. 1999; Nieto and Cederbaum 2003). Alternatively, there is increasing evidence that the observed increase in ECM in fibrosis actually results from deficiency in matrix degradation (Benyon and Arthur 1998). Matrix degradation is associated with the termination of an inflammatory repair response that coincides with the terminal differentiation of epithelium and apoptosis of myofibroblasts. The factors that terminate the repair process are poorly understood (Powell et al. 1999) but may be crucial in the control of the reserve hepatocyte repair process that is stimulated by chronic furan administration.
This present study also indicated further variation in fibroblast populations in areas undergoing HPC type II repair or alternatively progressing to CF, particularly in target lobes. Evidence of increased proliferation of fibroblasts and migration of VAF from the capsule into the injured parenchyma was detected. The expression of αSMA, a key myofibroblast marker, was found to vary with time and even location in furan-induced lesions. Immunostaining for matrix proteins secreted by fibroblasts also uncovered additional regional variation in fibroblast phenotype that is not well represented in current literature. Indeed, our observations indicate a diversity of mesenchymal cell response to liver injury that is only apparent by utilization of a panel of fibroblast markers, and we suggest that the resident parenchymal HSC population plays a minor role in instigation and progression of CF.
Although it is unclear what determines the difference in the hepatic response, these data indicate that the instigation of CF results from lack of appropriate termination signals for a “type II” hepatocyte repair response rather than any instructional cues for intestinal differentiation that may be signaled from the complex and heterogeneous microenvironment. The foundation for such aberrant ductular proliferation leading to CF appears to be laid during the initial stages, that is, the first week of furan treatment at this high dose. The failure to terminate a repair response during furan exposure in the rat may still imply a genetic component, but the interplay of epithelial and mesenchymal components early in the process that are described in this study suggest otherwise. The mechanism of interference with repair and how this may eventually lead to acquisition of genetic injury are key unanswered questions and that warrant one further investigation to provide a better risk assessment of the potential of furan to induce CC in man.