
Abstract
Furan is a potent cholangiocarcinogen in rat by an as yet undefined mechanism. The risk to man remains unclear. Using a time-course stop study design, we have investigated the potential of furan to induce oxidative stress and DNA damage associated with inflammatory and regenerative responses in rat liver. Furan was administered via oral gavage (30 mg/kg b.w. 5 daily doses per week), and livers were analyzed at time points between eight hr and three months. A one-month recovery group previously treated for three months was also included. There was a marked association between CYP2E1 expression and DNA oxidation (8-oxo-dG) in areas of centrilobular hepatocyte necrosis seen after a single dose. After one-month recovery from three-month treatment, 8-oxo-dG was still observed in areas of furan-induced cholangiofibrosis. Furan-induced changes in the expression of various genes associated with oxidative stress, DNA damage, and cell cycle control were identified during treatment and recovery. We propose that furan-induced cholangiocarcinomas emerge from areas of cholangiofibrosis as a result of a combination of chronic, persistent indirect damage to DNA through oxygen radicals coupled with persistent proliferative signals, including loss of connexin 32, that act to convert this DNA damage to fixed mutations.
Introduction
Furan is an industrial compound used as a solvent for resins and in the formation of lacquers. It is also used as an intermediate in the synthesis of organic chemicals (including herbicides, plastics, and pharmaceuticals) (Burka, Washburn, and Irwin 1991). Furan can also be generated from decomposition of sugars, polyunsaturated fatty acids, and most notably ascorbic acid (Perez-Locas and Yaylayan 2004). It has also been detected in foods, particularly coffee and canned meats (Maga 1979). The potency of furan in inducing cholangiocarcinoma (CC) in rat and hepatocellular carcinoma in mouse is therefore of current concern regarding risk to man.
Cholangiocarcinoma accounts for an estimated 10–15% of primary hepatobiliary neoplasms worldwide (Chapman 1999; Parkin et al. 1993) with a high prevalence in parts of Southeast Asia (Thuluvath et al. 1997). In England and Wales, CC mortality rates have risen over the past thirty years, and since the mid-1990s more deaths have been coded annually as CC than hepatocellular carcinoma (HCC) (Khan et al. 2002; Taylor-Robinson et al. 2001). Human intrahepatic CC is usually a fatal malignant neoplasm, which is considered to originate from biliary epithelium or hepatic stem cells (oval cells) (Crosby et al. 2002). Common risk factors include chronic inflammation to the biliary tree, via chemical or mechanical irritation, inducing conditions such as primary sclerosing cholangitis, hepatolithiasis, and fibropolycystic disease (Chapman 1999; Holzinger, Z’graggen, and Buchler 1999; Kuszyk et al. 1997; Sirica, Lai, and Zhang 2001).
In the rat a morphological path from cholangiofibrosis (CF) to CC has been described following administration of the potent carcinogen nitromorpholine to rats (Bannasch 1976), which involve four identifiable morphologies: reactive proliferation of bile ducts following necrosis of liver parenchyma, development of CF, cholangiofibroma that grows expansively, and CC that grows invasively.
The sequence of CC development has also been extensively studied in the furan-induced rat CC model. The National Toxicology Program (NTP; 1993) conducted a two-year study to evaluate the carcinogenic potential of furan in rats and mice. The study involved furan administered by oral gavage to both male and female rats at doses of 2, 4, or 8 mg/kg b.w., five days a week for two years. The long exposure to rats caused an 86–100% incidence of CC by the end of the treatment period compared to control. It was further reported that male rats treated with 30 mg/kg b.w. furan over a ninety-day period developed CF, which, following nine or fifteen months without further treatment, progressed to yield 100% incidence of CC (Maronpot et al. 1991). However, it was noted that furan-induced early CF possesses most or all of the morphological features of malignancy, apart from expansile growth and metastasis. This highlights the difficulty in effectively diagnosing CF from CC in the absence of an effective molecular marker of malignancy. Indeed, the search for molecular indicators of genetic damage following administration of furan in rat has produced inconsistent results. A single dose of furan (which induced necrosis and regenerative cell proliferation) has been shown, for example, to induce a transient increase in the expression of the myc, fos, and Ha-ras oncogenes (Butterworth et al. 1994) and the growth factor HGF (Sprankle et al. 1994), although this was not maintained during continued treatment (up to six weeks) (Sirica 1996). It has also been suggested that there is an association between increased c-Neu, TGF-β1, and mannose-6-phosphate/insulin-like growth factor II receptor expression and progression to the malignant phenotype in the rat furan-induced CC model. Aberrant production of HGF mRNA and protein is associated with putative precursor lesions and CC. This expression of HGF closely paralleled that of its receptor c-Met (Elmore and Sirica 1991; Lai et al. 2000; Sirica 1996, 1997). We have also investigated the relationship between HGF and c-Met expression in furan-induced CF (Hickling et al. 2010 [this issue]).
Most common gene alterations in human CC include K-ras codon 12 and p53 mutation with no specific “hotspots” (Arora et al. 1999; Furubo et al. 1999; Itoi et al. 1999; Kang et al. 1999; Tannapfel et al. 2000). Similarly, there is evidence of Ha-ras mutation in liver tumors induced by furan in B6C3F1 mice (Johansson et al. 1997). However, the relation between hepatocellular carcinoma in mice and CC in rat is unclear. Limited analyses of furan-induced CC in rat did not show K-ras exon 1 or 2 mutations by direct sequencing or p53 mutations by immunohistochemistry or direct sequencing of exons 5-8 (Sirica 1996; Hitchcock et al. 2002).
In summary, the potential for a genotoxic mechanism of action of furan in the rat is questionable, and while some studies show furan to be genotoxic both in vitro and in vivo, the majority of studies were negative or gave equivocal results (e.g., Lee, Bian, and Chen 1994; McGregor et al. 1988; NTP 1993, 2002; Peterson, Naruko, and Predecki 2000; Wilson et al. 1992; Kellert et al. 2008). Furthermore, the major metabolic pathway to cis-2-butene-1,4-dial, mediated by CYP2E1, does not appear to produce mutagenesis (Glatt, Schneider, and Liu 2005) despite evidence of DNA adduct formation (Byrns, Predecki, and Peterson 2002; Byrns, Vu, and Peterson 2004).
One area that deserves attention is the possibility of secondary oxidative damage to DNA in vivo during chronic furan administration. During chronic inflammation, cytokines are produced locally that cause an induction of NO synthase in epithelial cells and the activation of macrophages that both lead to the generation of NO and its derivatives (Holzinger, Z’graggen, and Buchler 1999). The production of iNOS and NO has been associated with accumulation of 8-oxo-dG lesions, a dominant oxidative DNA lesion that is highly mutagenic and predisposes to the development of GC-TA transversions. The aim of this present study was to improve understanding of the mechanism of CC production by furan. Specifically, we wished to determine the potential for furan to induce oxidative stress and oxidative DNA damage associated with inflammatory and regenerative responses in the rat liver in vivo and to investigate potential associated gene expression changes that might influence the process of CC formation. It has previously been demonstrated that gene expression changes indicative of oxidative stress are a feature of the response of the rat liver to furan (Huang et al. 2004). We have used the same dose level and dosing regimen as that detailed by Maronpot et al. (1991), that is, daily oral gavage of furan in corn oil at 30 mg/kg for our time-course stop study design.
Materials and Methods
Animals and Animal Husbandry
The studies were conducted in accordance with the standards of animal care and ethics described in “Guidance on the Operations of the Animals (Scientific Procedures) Act 1986” issued by the U.K. Home Office. Any clinical expression of toxicity remained within a moderate severity limit as described in the guidelines included in the project license issued by the Home Office.
Male Sprague Dawley Crl CD® BR rats from Charles River, UK (Margate, Kent, UK) (190-240 g, six to eight weeks old), were chosen as there was no known sex difference in incidence of induced CC in the rat (Maronpot et al. 1991). They were given access to standard R&M no.1 diet and tap water ad libitum. Animals were housed in groups of five in solid-bottom cages maintained at 21 ± 2°C, twelve hr light and twelve hr dark. All animals were acclimatized for at least five days prior to commencement of the study. Furan (CAS 110-00-9, Sigma-Aldrich Co. Ltd, Sigma-Aldrich Poole, Dorset, UK, >99% pure) was prepared in corn oil vehicle on the day of use and stored in sealed brown bottles. Furan was administered orally via gavage in corn oil at 30 mg/kg (5 daily doses per week). Animals (n = 5) were removed and euthanized at 8 hr; 1, 3, 7, 10, 12, and 20 days; and 1, 2, and 3 months of furan treatment. A recovery group was included at the three-month time point (one-month off dose) to enable assessment of lesion reversibility. Control animals were included at the one-day, one-month, and three-month time points. They received corn oil under similar conditions to test animals. Animals were euthanized by i.p. overdose of sodium pentobarbitone in accordance with U.K. Home Office license procedures. At necropsy samples of caudate, right, median, and left lobes of the liver were fixed in 4% paraformaldehyde in 0.1M phosphate buffer pH 7.2 at room temperature for sixteen to twenty-four hr prior to processing to paraffin wax. Four-micron (μm) sections were cut using a Leica 2155 microtome. Sections were baked onto Superfrost™ plus microscope slides overnight at 37°C prior to storage at room temperature. Additional samples immersed in liquid nitrogen had frozen sections cut using a Leica cryostat set at 5 μm. These sections were placed on Superfrost™ plus microscope slides and fixed in acetone/chloroform (50:50) for five min, air-dried, and then either used immediately or stored at –80°C until use.
Immunohistochemistry
A minimum of three animals were selected from each time point for immunocytochemical investigation of markers of proliferation, apoptosis, proliferative drive, and cell communication together with DNA oxidative damage. The antibodies and detection system used are listed in Table 1 .
Primary antibodies, detection antibodies, and detection systems.
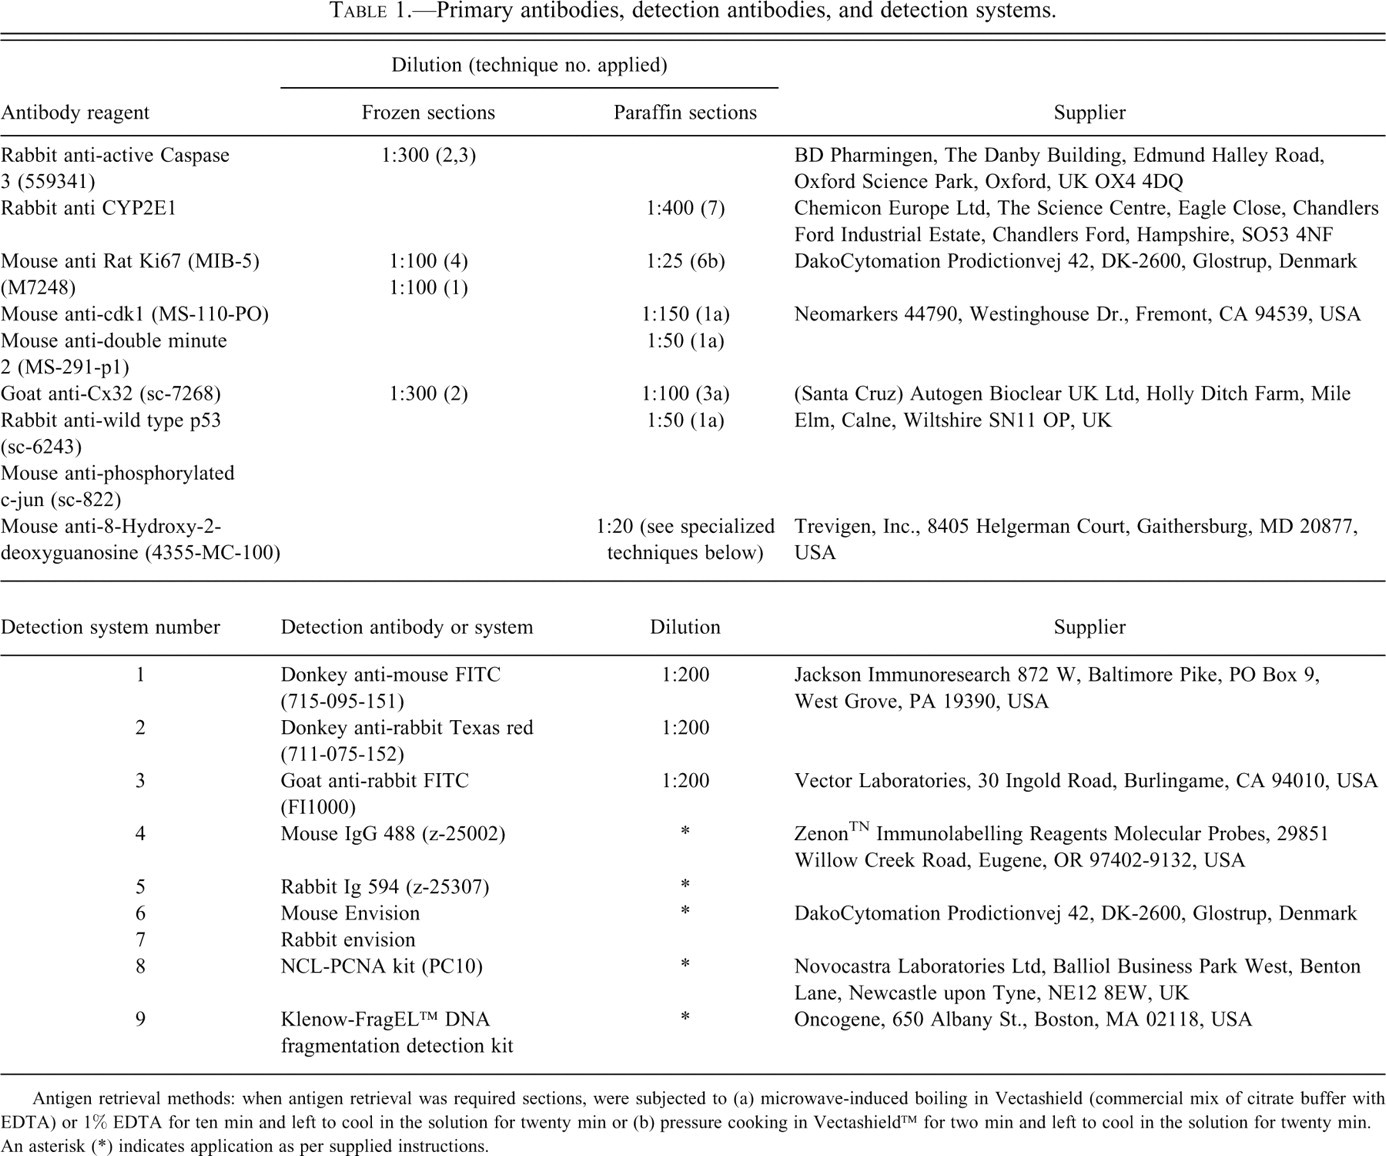
Antigen retrieval methods: when antigen retrieval was required sections, were subjected to (a) microwave-induced boiling in Vectashield (commercial mix of citrate buffer with EDTA) or 1% EDTA for ten min and left to cool in the solution for twenty min or (b) pressure cooking in Vectashield™ for two min and left to cool in the solution for twenty min. An asterisk (*) indicates application as per supplied instructions.
Immunocytochemical Methods
Similar methods were used for fluorescent and colorimetric techniques.
The applied techniques for paraffin sections were based on methods outlined by Miller (2002). Frozen sections were bought to room temperature and air-dried for thirty min before being fixed in 0.04% paraformaldehyde in PBS for three min followed by washing in PBS and then were stained using a standard indirect immunofluorescent technique. Prior to drying and mounting, sections were postfixed in 4% paraformaldehyde in PBS for five min.
For dual and triple labeling, sections were prepared as above, but prior to the postfixation step were reincubated with further primary antibodies labeled prior to application with the appropriate Zenon™ reagent (Molecular Probes Inc. Eugene OR, USA) that bound alexafluor dyes of complementary fluorescent color to these additional primary antibodies. Incubation was for one hr at room temperature.
Specificity was demonstrated by the exchange of the primary antibody for isotype control, nonimmune serum or immune serum of the same isotype against an unrelated antigen. For certain antibodies, the target antigen was also added to the primary antibody solution to adsorb the antibody and prevent staining. Titration of primary antibody was performed to select an optimum concentration that showed no or minimal background staining. Sections were examined using an Axiocam 2 fluorescent microscope (Carl Zeiss, Welwyn Garden City, UK) fitted with an Axiocam camera and running Axiovision software. Copies of some photomicrographs were digitally altered to match the color balance and intensity of the original histologic slide.
Measurement of Proliferation
Sections from the target caudate and right lobes were stained for Ki67, a marker that is considered to reflect the proliferative intent of a cell within certain limitations (reviewed by Xue et al. 2003). The proportion of stained to unstained cells was obtained from an unbiased selection of fields within the sections. For hepatocytes a minimum of 5,000 cells were counted, and for biliary cells a minimum of 500 cells were counted. Sections of intestine were used to confirm the ability to detect cells in a proliferative state.
Measurement of Apoptosis
Apoptotic hepatocytes in hematoxylin and eosin (H&E)–stained sections were identified morphologically by (1) loss of contact with adjacent cells, (2) nuclear clumping and appearance of apoptotic bodies, and (3) increase in cytoplasmic eosinophilia. The number of apoptotic hepatocytes from a minimum of 1,000 hepatocytes was counted per section from three animals per time point. Apoptosis was also measured using the Klenow-FragEL™ DNA Fragmentation Detection Kit (Oncogene Research Products, San Diego, CA, USA) using methods outlined by Grasl-Kraupp et al. (1995) and by detection of activated Caspase 3 using the procedures described above. Counts of stained apoptotic hepatocytes were in general agreement with the counts of apoptotic cells detected by morphology, despite these techniques detecting different stages of the process.
Additional Specialized Techniques
Anti-8-oxo-dG staining was performed as detailed in instructions supplied with antibody. Briefly, de-waxed sections were incubated with 10 μg/ml proteinase K in PBS for ten min at 37°C. Following a wash with PBS, DNA was denatured by soaking the slides in 4N HCl for seven min. The tissue was then neutralized by soaking the slides in 50 mM Tris-base for five min at room temperature. Unspecific sites were blocked by a one-hr incubation with 10% normal horse serum in 10 mM Tris-HCl, pH 7.5 prior to application of mouse anti-8-oxo-dG primary monoclonal antibody (Japan Institute for the Control of Aging, Japan, ukuroi, Shizuoka, Japan) diluted 1:20 in Tris-HCl, pH 7.5 and 10% normal horse serum overnight at 4°C. Following a wash in PBS, sections were incubated with an FITC conjugated secondary antibody (diluted in PBS) for 60 min. Sections were washed with PBS and dH2O and then allowed to dry (10-15 min) prior to mounting and examination.
Klelow-FragEL™ DNA Fragmentation Detection was conducted (as detailed in instructions supplied with kit). Briefly, prior to application of Klenow Labelling Reaction mixture, sections were permeabilized in 0.02 mg/ml protease K in 10 mM Tris pH8 at room temperature for three to ten min prior to blocking of endogenous peroxidase (3% H2O2 in methanol for five min). Sections were then preincubated in Klenow Equilibration buffer before a 1 in 10 dilution of the recommended labeling reaction mix was applied for 1.5 hr at 37°C. The reaction was then stopped via application of stop buffer prior to detection of exposed DNA fragments with DAB solution for thirty min. Sections of normal intestine were used as a positive control.
Gene Expression Analysis
Tissue samples used for gene expression analyses were from the areas in which CF occurred (caudate and right lobes). Total cellular RNA was isolated using the Trizol™M (Gibco BRL, Grand Island, NY, USA) reagent. The procedure was performed according to the manufacturer’s recommended protocol, based on the method of Chomczynski and Sacchi (1987). The resultant RNA was purified using the RNeasy™M (Qiagen, Crawley West Sussex, UK) columns following the manufacturer’s protocol, and pelleted and resuspended in RNase free water at a final concentration of 1 μg/μl.
All experiments were performed using Affymetrix U34A oligonucleotide arrays, as described at http://www.affymetrix.com/products/arrays/specific/rgu34.affx. Total RNA from each sample was used to prepare biotinylated target RNA, with minor modifications from the manufacturer’s recommendations (http://www.affymetrix.com/support/technical/manual/expression_manual.affx).
Briefly, 10 μg of mRNA was used to generate first-strand cDNA by using a T7-linked oligo(dT) primer. After second-strand synthesis, in vitro transcription was performed with biotinylated UTP and CTP (Enzo Diagnostics, New York, USA), resulting in approximately 100-fold amplification of RNA. A complete description of procedures is available at http://bioinformatics.picr.man.ac.uk/mbcf/downloads/GeneChip_Target_Prep_Protocol-CR-UK_v2.pdf. The target cDNA generated from each sample was processed as per manufacturer’s recommendation using an Affymetrix GeneChip Instrument System (http://www.affymetrix.com/support/technical/manual/expression_manual.affx). Briefly, spike controls were added to 10 μg fragmented cDNA before overnight hybridization. Arrays were then washed and stained with streptavidin-phycoerythrin, before being scanned on an Affymetrix GeneChip scanner. Additionally, quality and amount of starting RNA was confirmed using an agarose gel. After scanning, array images were assessed by eye to confirm scanner alignment and the absence of significant bubbles or scratches on the chip surface. 3′/5′ ratios for GAPDH (1.38-3.40) and beta-actin (2.68-7.03) were confirmed to be within acceptable limits, and BioB spike controls were found to be present on 100% of chips, with BioC, BioD, and CreX also present in increasing intensity. When scaled to a target intensity of 500 (using Affymetrix MAS 4.0 array analysis software), scaling factors for all arrays were within acceptable limits (0.255-0.735), as were background, Q values, and mean intensities. Data have been loaded into MIAMEXPRESS, and the ArrayExpress accession number is E-MEXP-1421. Only genes expressed either twofold higher or lower in treatment groups compared with control, and showing statistical significance, were included in analysis. Statistical analysis was performed using GeneSpring™ v4.2 (SiliconGenetics, Cheshire, UK) and the Welch t-test (p value .05).
Quantitative Real-Time PCR
TaqMan© quantitative real-time PCR was used to quantitate mRNA levels for selected genes. Two primers and one probe were designed for each gene as shown below using Perkin-Elmer PrimerExpress v1.0 software. Primer and probe sequences are listed below. Probes were labeled with 6-carboxyfluorescein (FAM) or VIC on the 5′ nucleotide and TAMRA on the 3′ nucleotide. Annexin II, Bax alpha, CAII, c-FABP, c-myc, cyclin E, GST-P subunit, IRF-1, p21/waf1, S-100 related protein (S100), and TB-10 primers were all used at a final concentration of 50 nM and the probes at 100 nM. 18S and GAPDH primers were used at 50 nM and probes at 200 nM. Primers were as follows: AnnexinII_F GACATTGCCTTCGCCTACCA AnnexinII_R CCAGACAAGGCCGACTTCA AnnexinII_T CCAAAAAGGAACTGCCATCGGCG BaxAlpha_F ACCATCATGGGCTGGACACT BaxAlpha_R CCACCCTGGTCTTGGATCC BaxAlpha_T TCCTCCGGGAGCGGCTGCTT CAII_F GGATACAGCAAGAGCAACGGA CAII_R GGACTGTCGGTCTCCATTGG CAII_T AGAGAACTGGCACAAGGAGTT CCCCATT c-FABP_F GCCAAACCAGACTGCATCATT c-FABP_R CGTCTTCACCGTGCTCTCAG c-FABP_T CGACGGCAACAACCTCACCGTCA c-Myc_F ACATCAGCGGTCGCAACC c-Myc_R TCTGCCCGTTGCAATGG c-Myc_T TCGCCGCCTCTGGGAAACTTTG cyclinE_F AAGGTGGTTCCGACCTCTCA cyclinE_R CCGGATCTTGCAAAAAAACG cyclinE_T TCCGATCCAGAAAAAGGAAGCCAA ATGT GSTP_F GCAGCTCCCCAAGTTTCAAG GSTP_R CGACCCAGGTGCCTCAAG GSTP_T TGGAGACCTCACCCTTTACCAATCT AATGCC IRF1_F CCCAAGACTTGGAAGGCAAA IRF1_R TGGTCCTTCACTTCCTCGATG IRF1_T CCGGTGTGCCATGAACTCCCTACC p21/WAF1_F CCTGTTCCACACAGGAGCAA p21/WAF1_R CGGCTCAACTGCTCACTGTC p21/WAF1_T ATGCCGTCGTCTGTTCGGTCCC S100_F CCCTCTGGCTGTGGACAAA S100_R AGCTCTGGAAGCCCACTTTTC S100_T TAATGAAAGACCTGGACCAGTG CCGAGA TB-10_F GGAAATCGCCAGCTTCGATA TB-10_R GGTCGGCAGGGTGTTCTTC TB-10_T CCAAGCTGAAGAAAACCGAGACGCA
Briefly 1x Master Mix, forward and reverse primers, probe and RNase free water were mixed together and 21 μl added to each well used. The sample (20 ng/well), standards (100, 10, 1, 0.1, 0.01, 0 μg/μl), or negative controls were then added. Thermal cycling in the ABI PRISM 7700 sequence detection system consisted of two min at 50°C and then ten min at 95°C followed by forty cycles of 95°C for fifteen sec and 60°C for sixty sec. Abundance of each gene was determined relative to mRNA of 18SrNA gene.
Results
Development of Metaplasia and Cholangiofibrosis
The description of histological changes focuses on the response of liver epithelia to furan administration. The detailed histopathological changes associated with furan administration are provided in the accompanying article (Hickling et al. 2010) and summarized below and in Figure 1. Following a single administration of 30 mg/kg furan, centrilobular and subcapsular hepatocyte necrosis and apoptosis were observed after both eight hr and one day of treatment in most lobes of liver, with the caudate, right, and lateral edges of the left lobe being most severely affected. All animals were affected by this initial furan administration. There was, however, variability in the extent of the subsequent response to injury. By day 3, in spite of daily furan administration, hepatocytes within the parenchyma were essentially restored in all but the innermost centrilobular areas by compensatory hepatocyte proliferation (Figure 1A and 1B). However, in severely damaged areas, primarily the right and caudate lobes (hereafter referred to as “target lobes”), the initial injury extended to incorporate the whole liver lobule including portal tracts. Here, commencing on day 7, there was an additional focal proliferative response of biliary ducts, into the injured parenchyma that could differentiate into either hepatocytes or intestinal cells (Figure 1C and 1D). The occurrence of this failure of repair of the initial injury by hepatocytes correlated well with the subsequent incidence and location of biliary proliferation, intestinal metaplasia, and CF that became apparent from day 12. The histological appearance now mirrored that originally described in the rat by Tatematsu et al. (1984, 1985) following partial hepatectomy and administration of 2-AAF and also following chronic furan administration (Elmore and Sirica 1991; Wilson et al. 1992). Intestinal metaplasia was characterized by the appearance of cells that were columnar in appearance with a prominent brush border and a basally placed nucleus that first became apparent at day 10. Temporal changes in proliferation (Ki67 staining) of hepatocytes and biliary cells and apoptosis (morphologic appearance) of hepatocytes after 30 mg/kg b.w. for up to three months are shown in Figure 2A through C. Control Ki67 counts for rat biliary cells and hepatocytes were similar to those reported by Beaussier et al. (2005) and Nguyen et al. (2007). Control apoptotic cell counts were within the published range (0.02–0.04%) (Vieyra et al. 2002). Apoptotic indices were also supported by immunohistochemical analysis of caspase 3 (Figure 3C) and Klenow FragEL™ staining (data not shown). Both the proliferative and apoptotic responses of hepatocytes were increased throughout the treatment period after day 1 but were reduced to control levels after the off-dose period. It was notable that while the hepatocyte response was general to all liver lobes, the biliary response was focal and confined to areas of severe initial damage in target lobes.
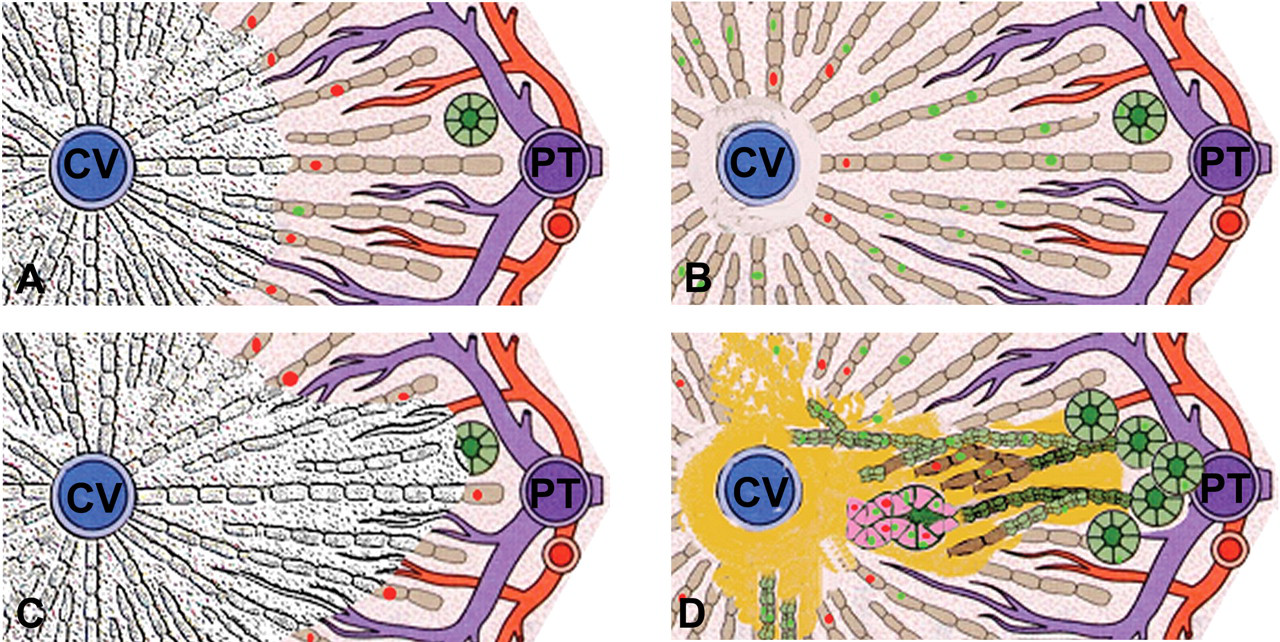
Illustration of temporal hepatic histopathology leading to formation of cholangiofibrosis (for more detail, see Hickling et al. 2010 [this issue]). (A) and (B) illustrate general injury and response to furan treatment. (A) General centrilobular parenchymal necrosis, degeneration, and inflammation around central vein (CV) seen twenty-four hr after one furan dose with increased p53 (red nuclei) in hepatocytes adjacent to lesion. Hepatotocytes around portal tracts (PT) are unaffected. (B) Repair of damaged parenchyma by continued raised proliferation rate (green nuclei) of surviving hepatocytes (day 3 of treatment onward). Inflammation/fibrosis persists around CV from 12 days of furan treatment. (C) and (D) illustrate focal more severe injury and response in target lobes. (C) Focal pan-lobular necrosis in target lobes that incorporate PT after a single furan dose with increased p53 (red nuclei) in hepatocytes adjacent to lesion. (D) Proliferation/expansion of biliary/oval cell ducts into liver parenchyma with most ducts differentiating to hepatocytes (brown) but some ducts differentiating to cells with an intestinal phenotype (pink) (10-20 days of treatment). Hepatocytes around injured zones still exhibit raised P53 (red nuclei) and increased proliferation (green nuclei). Typical CF can be present by twelve days of treatment.
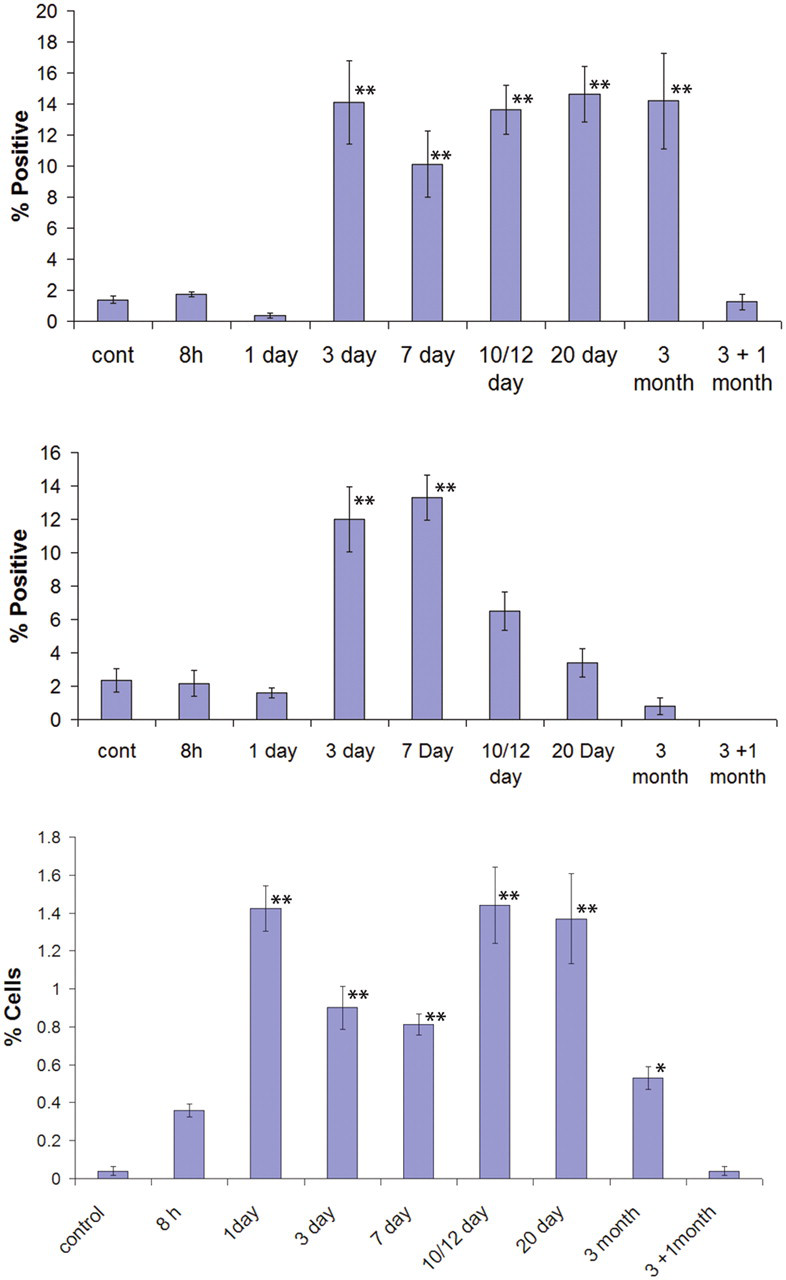
Proliferative and apoptotic indices of hepatocytes and biliary cells during furan treatment. (A) The percentage of hepatocytes immunostained for Ki67 during furan treatment (n = 5,000). (B) The percentage of biliary cells immunostained for Ki67 during treatment with furan (n = 500). (C) Percentage of apoptotic hepatocytes by morphology during furan treatment (n = 1,000). Three animals per time point were included in analysis. Statistical analyses were performed using one-way ANOVA followed by comparison with control using Dunnett’s test. *p ≤ .05. **p ≤ .01. ***p ≤ .001. Error bars = SEM.
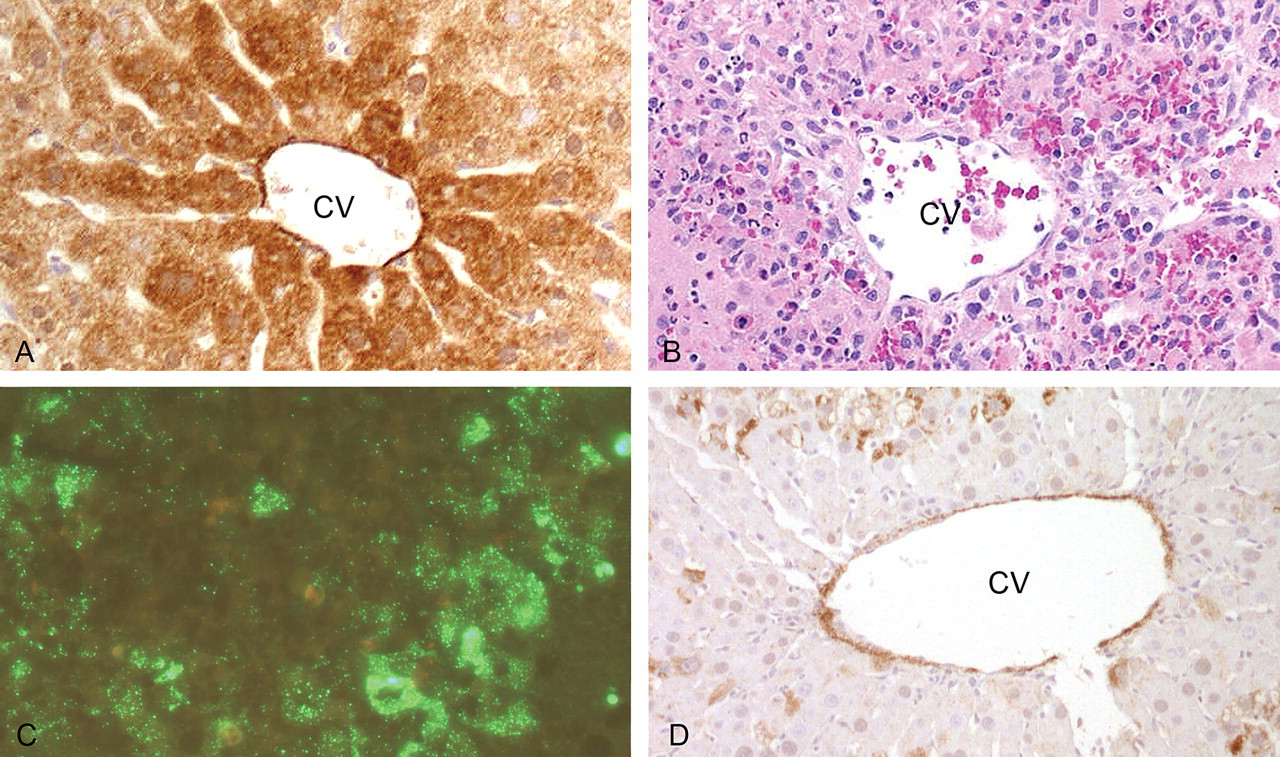
Relationship between CYP2E1 expression and hepatocyte necrosis following a single dose of furan and subsequent reduction of CYP2E1 expression. (A) Dense CYP2E1 immunostaining (brown) in centrilobular hepatocytes of control liver (CV—central vein). (B) Centrilobular hepatocellular necrosis and inflammation, consistent with activation of furan to toxic moiety via CYP2E1. (C) Caspase 3 immunofluorescent staining (green) implying apoptosis associated with injured centrilobular hepatocytes. (D) Subsequent reduced CYP2E1 expression (absent or patchy brown staining) in centrilobular hepatocytes after three days of furan treatment.
Association of Furan Toxicity with CYP2E1 Containing Hepatocytes
Figure 3 shows the relationship between the expression of CYP2E1 in control rats (Figure 3A) and the induced necrosis (Figure 3B) and apoptosis (Figure 3C). This is in accord with a likely role of CYP2E1 in the metabolic activation of furan to its hepatotoxic moiety (Parmar and Burka 1993). In addition, it is notable that CYP2E1 expression was significantly reduced in areas of hepatocyte regeneration observed from day 3 (Figure 3D), which is consistent with reduced potential to generate the hepatotoxic CYP2E1 metabolite.
Specific Markers Related to Cell Proliferation and DNA Damage in Hepatocytes
Staining for cdk-1 (a marker of commitment to mitosis), wild-type p53, and mdm-2 was not seen in control livers. However, following three days of furan treatment, immunostaining for cdk-1 and phospho-c-jun was apparent in surviving hepatocytes (Figure 4A and 4B). Following a single dose of furan, pronounced nuclear staining of wild-type p53 was observed within and around necrotic centrilobular and subcapsular regions (Figure 4C). The degree of p53 staining decreased at later time points. We have previously investigated the presence of p53 and ras gene mutations in furan-induced CC derived from similar treatment regimens and found no evidence for such changes (Hitchcock et al. 2003). In accord with this, a detectable immunohistochemical response using an antimutant p53 antibody was not seen throughout the time course studied (data not shown). In human tumors that lack p53 mutations, amplification of the mdm-2 gene has often been observed (Furubo et al. 1999). After furan treatment, the majority of hepatocytes showed only background labeling of mdm-2, similar to controls; however, hepatocytes adjacent to areas of CF together with some biliary and metaplastic intestinal cells exhibited increased mdm-2 expression.
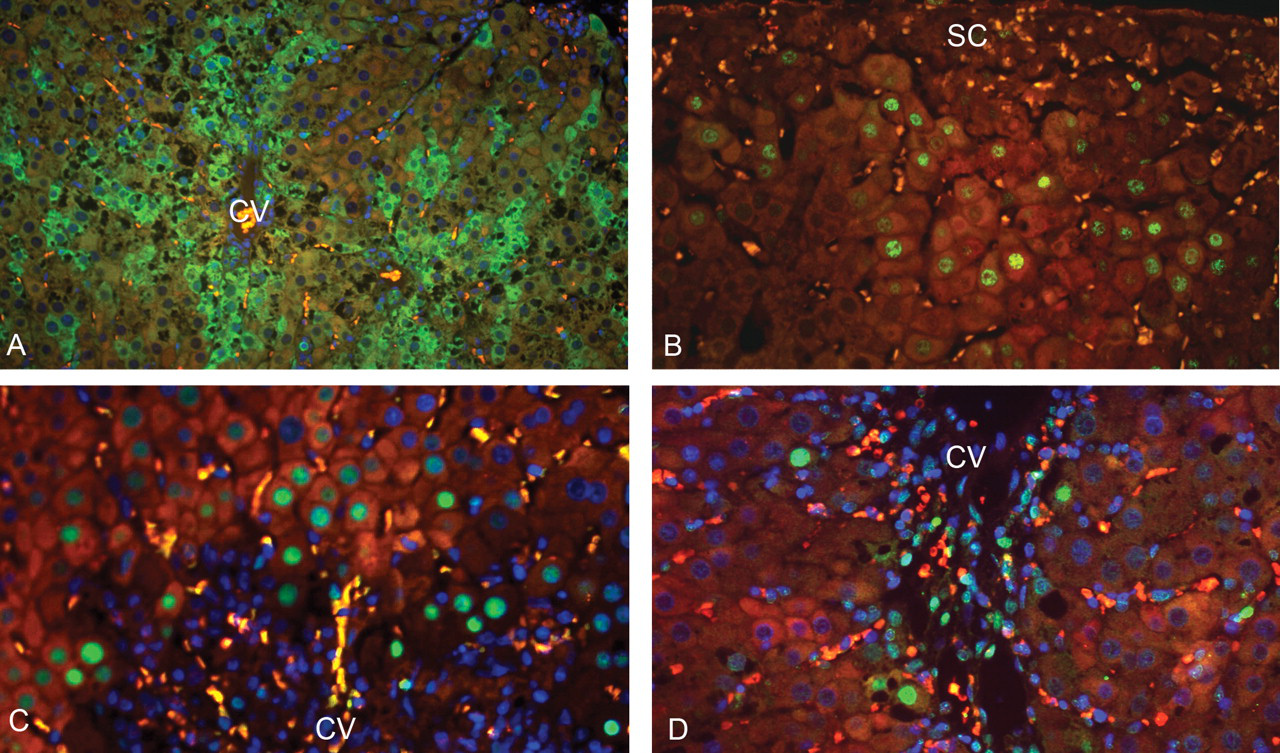
Coincident localization of markers relating to proliferation and DNA damage in hepatocytes. (A) Cytoplasmic cdk-1 immunofluorescence (green) of hepatocytes associated with regeneration after three days of furan treatment (CV—central vein). (B) Phospho-c-jun nuclear immunofluorescence (green) associated with hepatocyte regeneration below injured subcapsular area (SC) after three days of furan treatment. (C) Wild-type p53 nuclear immunofluorescent staining (green) in hepatocytes of centrilobular areas following a single dose of furan. Nuclei are counterstained blue. (D) 8-oxo-dG nuclear immunofluorescent staining (green) in hepatocytes of centrilobular areas following a single dose of furan. Nuclei are counterstained blue. Note that red blood cells are autofluorescent orange in these micrographs.
8-oxo-dG was observed by immunohistochemistry at a low level in hepatocytes of control liver samples. However, furan treatment caused a marked increase in 8-oxo-dG detection in hepatocytes adjacent to and incorporated within necrotic centrilobular and subcapsular regions (Figure 4D) similar to the changes seen in p53 expression at day 1. Associated with compensatory hepatocyte proliferation, expression of Cx32 plaques (known to be a regulator of cell division) was reduced (Figure 5A and B). Interestingly, Cx32 did not reappear in hepatocytes in areas associated with development of intestinal metaplasia and subsequent CF.
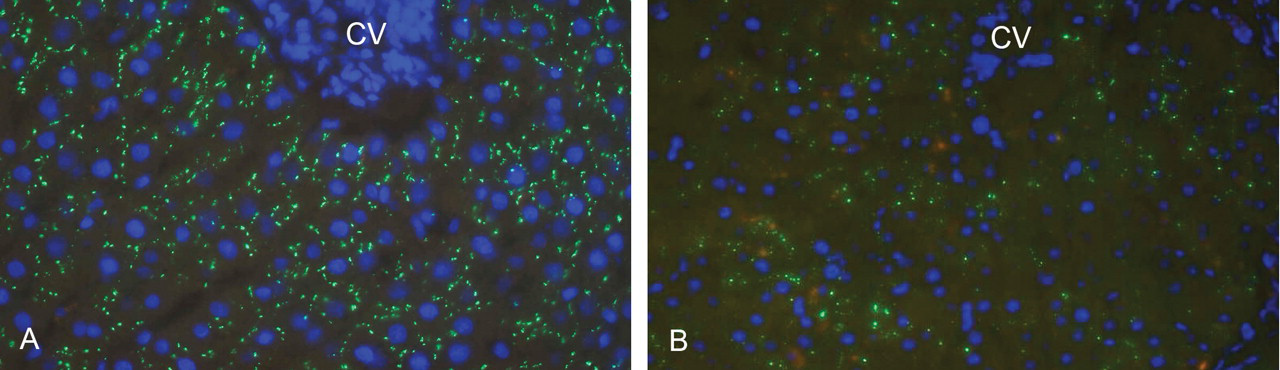
Distribution of Cx32 plaques in hepatocytes of control and following three-months of furan treatment. (A) Cx32 in control (green) showing punctate localization on hepatocyte membranes. Nuclei are counterstained blue. (B) Cx32 immunofluorescent staining (green) after three-months of furan treatment showing absent or incomplete patchy distribution. Nuclei are counterstained blue. CV = central vein.
Specific Markers Related to Cell Proliferation and DNA Damage in Biliary Cells
Staining for cdk-1, phospho-c-jun, wild-type p53, or mdm-2 was not seen in biliary cells of control livers. However, following furan administration, immunostaining for cdk-1 and phospho-c-jun was apparent in proliferating expanding biliary ducts and associated metaplastic intestinal cells (Figure 6A and 6B). Some biliary ducts, metaplastic intestinal cells, and also adjacent hepatocytes were wild-type p53 positive even after one-month recovery. Similar areas also exhibited increased mdm-2 expression (Figure 6C). In cholangiofibrotic lesions in animals sampled at end of treatment or after one-month recovery, biliary epithelia and metaplastic ducts also showed increased staining for 8-oxo-dG, as did hepatocytes in the proximity of the target areas associated with inflammation (Figure 6D).
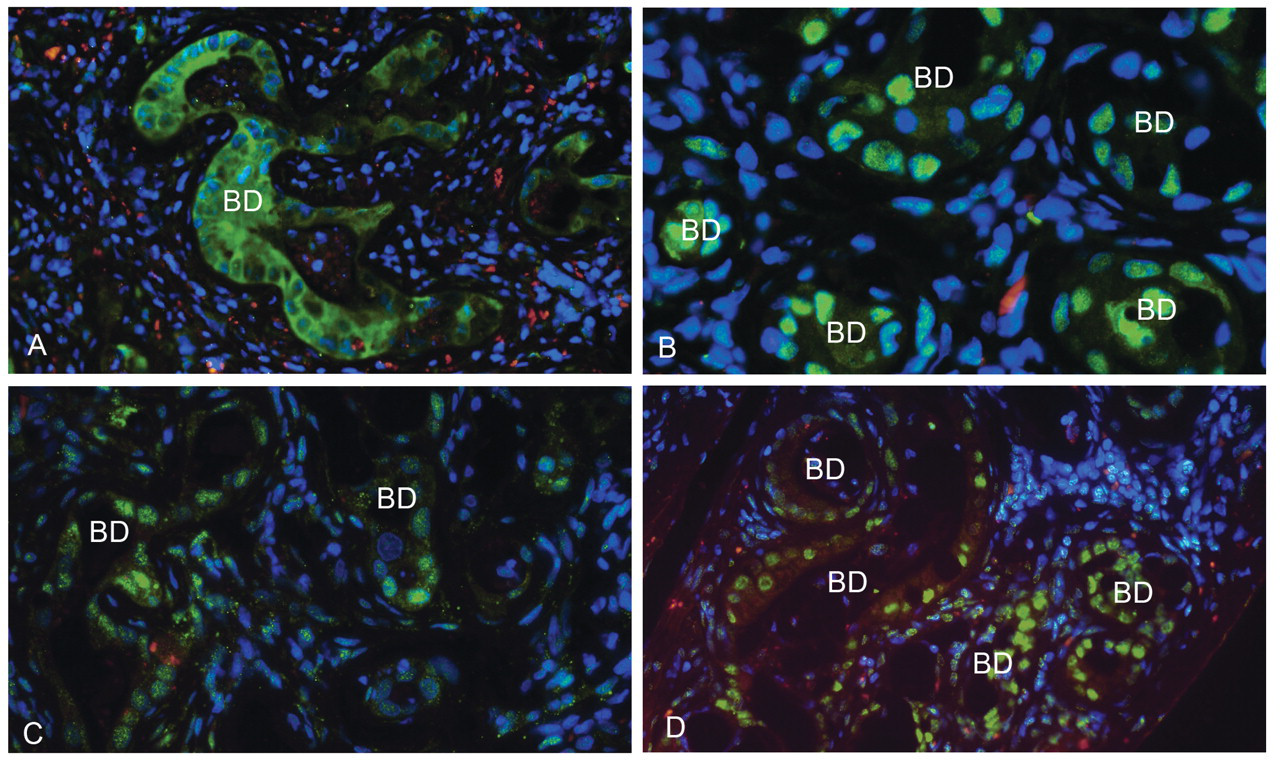
Markers relating to proliferation and DNA damage in biliary cells. (A) Cdk-1 immunofluorescence (green) in certain metaplastic intestinal ducts in areas of CF after three-months' treatment plus one-month recovery (BD—biliary duct). Nuclei are counterstained blue. (B) Phospho-c-jun immunofluorescence (green) in certain metaplastic intestinal ducts in areas of CF after three-months' treatment plus one-month recovery. Nuclei are counterstained blue. (C) Mdm-2 immunofluorescent staining (green) in biliary ducts within areas of CF after three-months' treatment plus one-month recovery. Nuclei are counterstained blue. (D) 8-oxo-dG immunofluorescent staining (green) in biliary and metaplastic intestinal cells after three-months' treatment plus one-month recovery. Nuclei are counterstained blue.
Differential Gene Expression
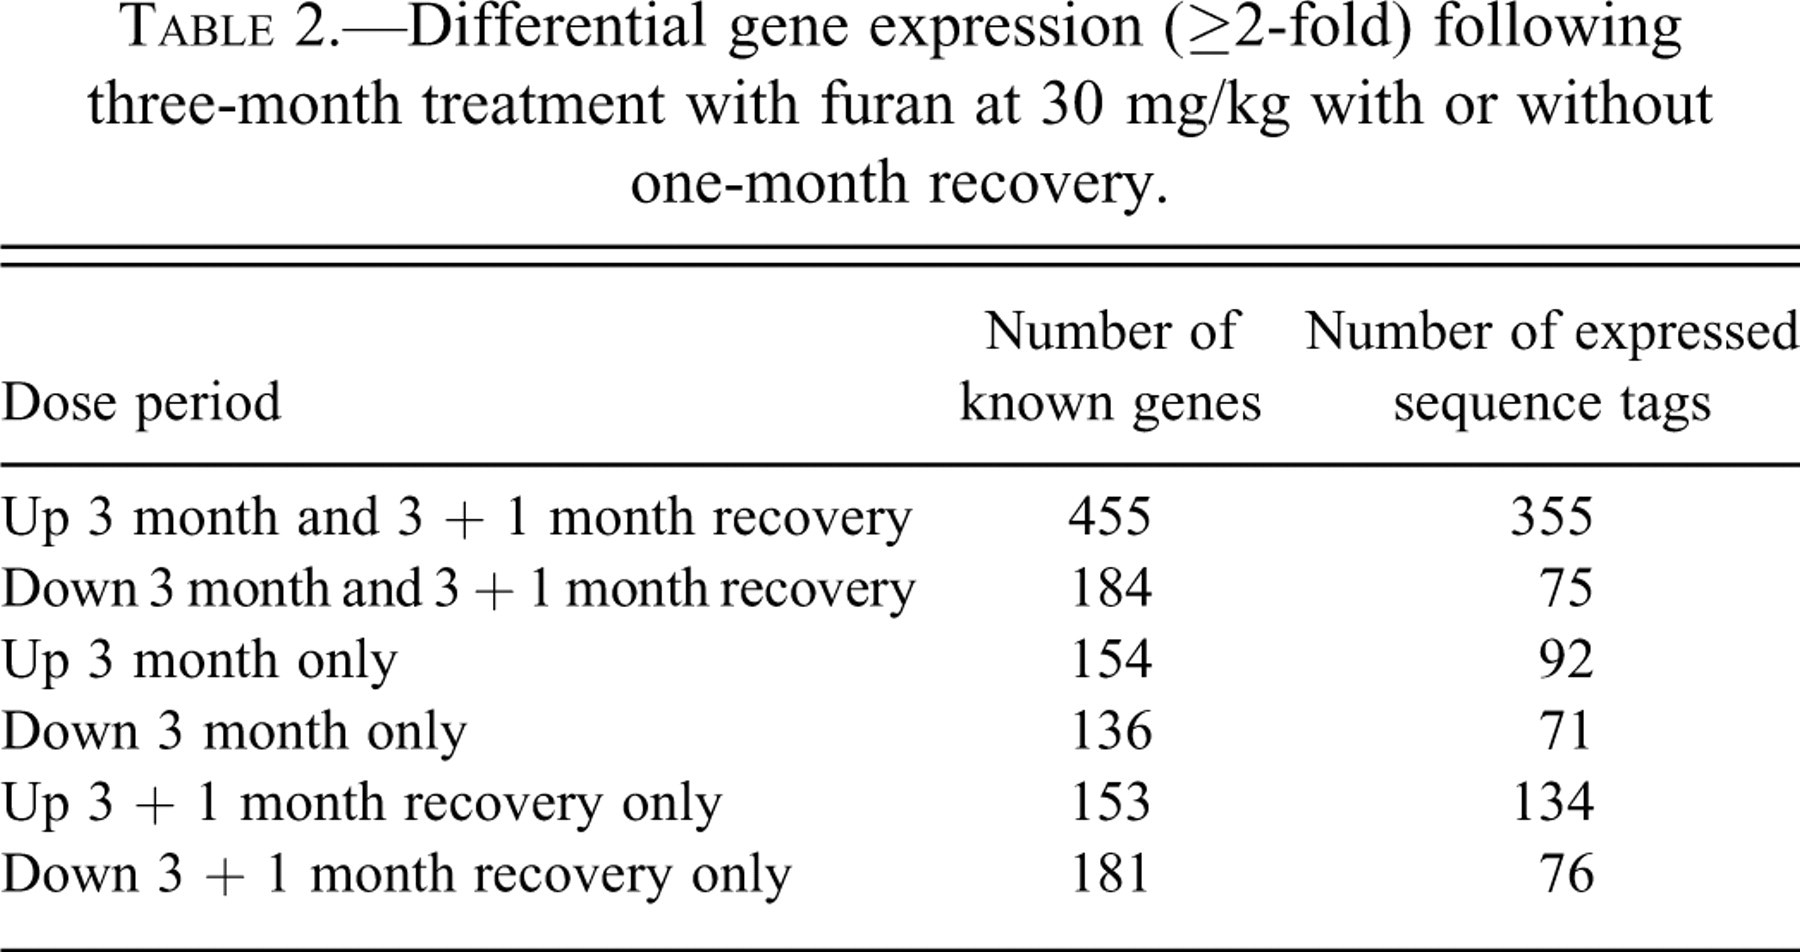
In studies on differential gene expression, we were primarily interested in those changes associated with the development and maintenance of the cholangiofibrotic lesion. Hence, those gene expression changes (up- and down-regulated) observed and maintained after three-months of furan treatment and with one-month recovery were considered. These persistent changes could be important in the subsequent development of furan-induced CC and could reflect mutational events or permanent change in differentiation. The number of known genes and expressed sequence tags (ESTs) found to be differentially expressed (up or down) based on the criteria set in the Methods section and the extent to which these persisted after one-month off-dose is indicated in Table 2 .
Differential gene expression (≥2-fold) following three-month treatment with furan at 30 mg/kg with or without one-month recovery.
Affymetrix software used a detection algorithm on the probe pair intensities to generate a detection p value. This was then used to assign a Present, Marginal, or Absent call. These “calls” were used to further limit the number of genes for detailed analysis. This left 135 genes that showed increased expression at 3 months and 3+1 month and 57 genes that exhibited decreased expression at 3 months and 3+1 month relative to control. Literature searches using NCBI Genbank (http://www.ncbi.nlm.nih.gov/) and Medline (http://gateway.uk.ovid.com/athens/) were performed on all these genes. These were then grouped according to their ontologies for ease of analysis (Table 3 ). In particular, amongst those gene expression changes that persisted were genes involved in cellular/oxidative stress such as heat shock protein 70 (HSP70), GST, IRF-1, and cytochrome b558 and a number of genes involved in cell proliferation (including cyclin E, annexin II, and c-myc).
Ontology of altered gene expression in both three-month treatment and three-month treatment with one-month recovery following use of detection algorithm and threshold cutoff (over two-fold, statistically significant).
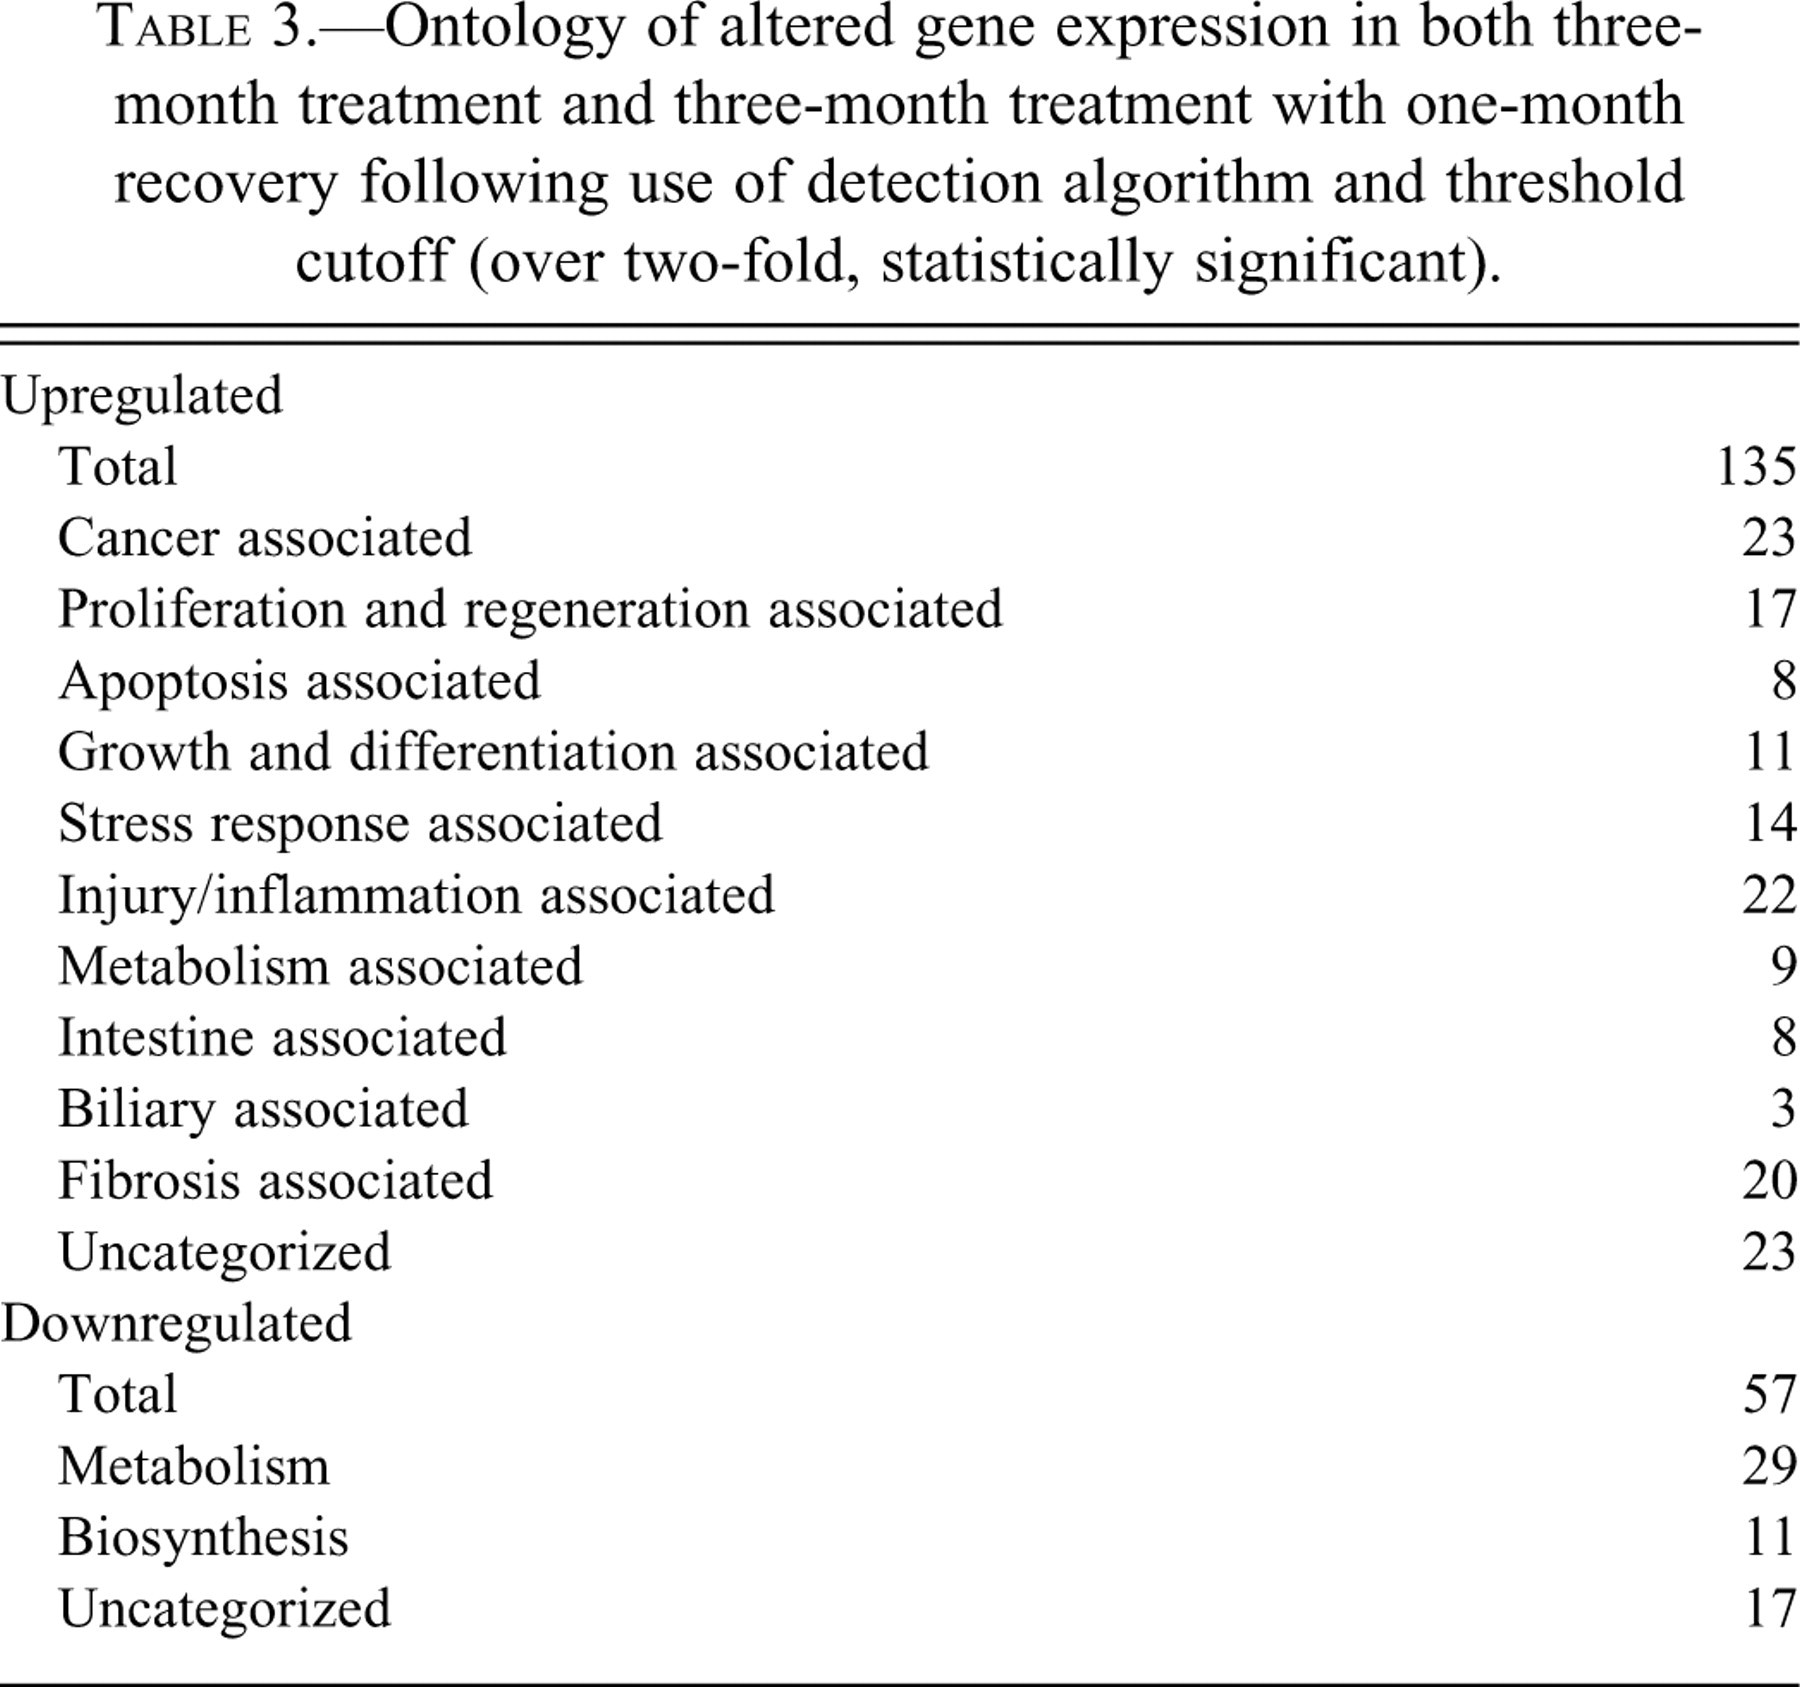
Genes associated with apoptosis were also differentially expressed, such as TB-10 and mANT. A number of persistent gene expression changes were associated with transformation and tumor progression (carbonic anhydrase II, TB-10) and metastasis (cutaneous fatty acid binding protein and S-100).
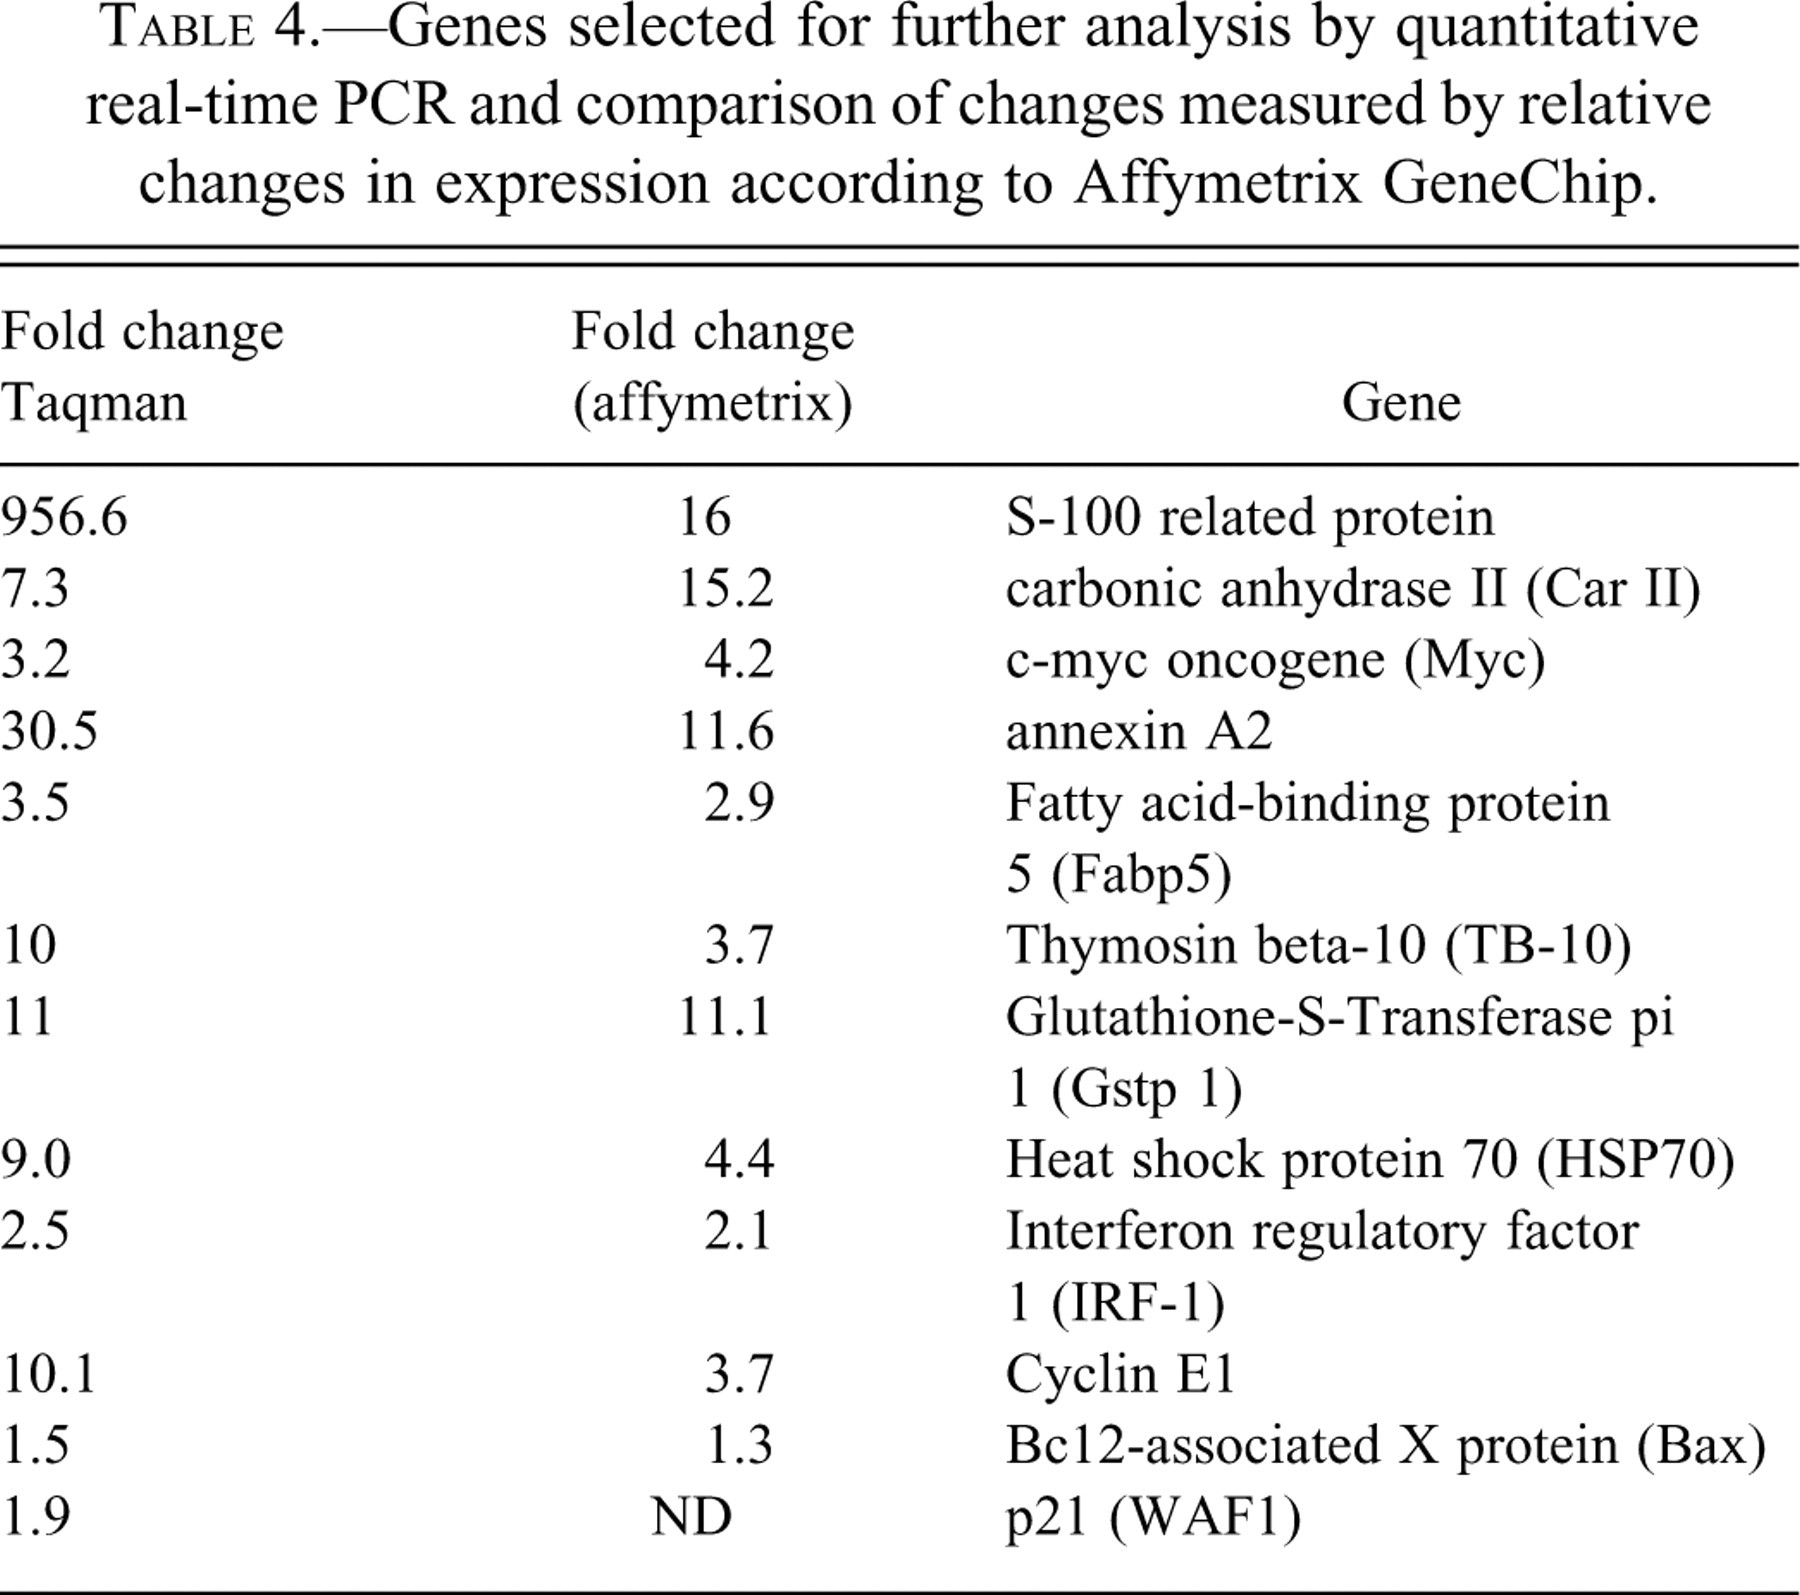
It is also noted that a number of genes associated with stress, growth arrest, and DNA damage as well as a subset of genes associated with proliferation were differentially regulated following three-months of furan treatment but not in the “off-dose” group. These included increased expression of HSP27 and HSP90, GADD45, cyclins D1 and G and chromosomal protein HMG2, PCNA, cyclin D1, and intestinal DNA replication protein and ornithine decarboxylase. The majority of the above relevant genes that persisted in altered expression after one-month off-dose were selected for further validation and analysis by quantitative real-time PCR, and the relative changes in expression as determined by the two techniques are shown in Table 4 . In addition, bax-alpha and p21 (waf-1) were also included because of their high relevance to apoptosis and proliferation.
Genes selected for further analysis by quantitative real-time PCR and comparison of changes measured by relative changes in expression according to Affymetrix GeneChip.
Discussion
Furan administration initially induced necrosis and acute inflammation in all liver lobes but with a higher incidence/severity in the right, caudate, and lateral areas of the left lobe. These are lobes previously reported as being more susceptible to furan administration (Elmore and Sirica 1992; Hamadeh et al. 2004; Wilson et al. 1992). It was speculated that the site specificity might be related to direct diffusion from the stomach to these proximate regions (Wilson et al. 1992) or due to regional differences in blood flow to liver lobes (Hamadeh et al. 2004). Neither hypothesis has been proven. In accord with Wilson et al.’s (1992) observations, compensatory hepatocyte proliferation of surviving hepatocytes in portal areas was observed to rapidly replace lost hepatocytes. However, within the confines of susceptible target lobes, the initial injury induced by furan could, on occasion, extend to incorporate portal tracts, particularly in subcapsular regions. In this situation, no compensatory hepatocyte repair was possible. It is considered that this focal injury to portal tracts following a single dose is a major factor in the subsequent induction of CF. The specific portal injury resulted in rapid proliferation of biliary cell ductules into the liver parenchyma that typically differentiated to hepatocytes as part of an ordered repair process. However, after ten days of furan treatment, this repair process became dysregulated in areas of target lobes, resulting in failure of hepatocyte differentiation of the ducts and the appearance of intestinal metaplasia and CF. This process is similar to changes described by Paku et al. (2001, 2004) and is described in detail in Hickling et al. (2010 [this issue]). The cholangiofibrotic lesions continue to expand, even after cessation of furan treatment, and are accompanied by a persistent chronic inflammatory infiltrate. An association between intestinal metaplasia and development of CC has been made by Ren, Silberg, and Sirica (2000). The apparent irreversible progression from early CF to CC has led to the suggestion that the metaplastic intestinal cells are genetically altered and represent the first stage in the sequence of development of CC (Elmore and Sirica 1991; Radaeva, Ferreira-Gonzalez, and Sirica 1999; Sirica, Elmore, and Sano 1991; Sirica, Radaeva, and Caran 1997). In this study, in animals left off-dose for one month, recovery of hepatocyte populations was noted, but incomplete resolution or indeed expansion of cholangiofibrotic lesions was apparent. This may suggest that these lesions are premalignant, which is in agreement with the conclusions of Maronpot et al. (1991). However, the mechanism(s) whereby furan induces CC are unclear. We provide evidence herein that DNA damage as a secondary oxidative mechanism associated with persistent cell proliferation may be important.
There was a marked association between the centrilobular and subcapsular hepatic necrosis following a single dose of furan and the expression of CYP2E1. This agrees with previous data linking CYP2E1 in the metabolism of furan to toxic products in rat and mouse liver (Carfagna, Held, and Kedderis 1993; Chen, Tsao, and Duguid 1995, Franssonsteen et al. 1997). Importantly, detection of DNA oxidation (8-oxo-dG) also correlated with these sites, which is again consistent with the generation of free radicals following CYP2E1 metabolism of furan, possibly involving uncoupling of oxidative phosphorylation (Peterson, Naruko, and Predecki 2000). It is known that CYP2E1 uncoupling can also contribute to production of reactive oxygen species.
The finding of significantly reduced CYP2E1 protein in the majority of replacement hepatocytes during chronic furan treatment may contribute to the observed resistance of these cells to furan-induced injury and a consequent reduction in compensatory hepatocyte proliferation at later time points. Thereby, surviving hepatocytes following chronic furan treatment have been selected based upon relatively low CYP2E1 expression. However, chronic furan administration was also associated with a marked inflammatory response in target lobes that developed CF. Such inflammation was found to persist following withdrawal of furan treatment. Oxidative stress to surrounding tissues would be an expected consequence. Indeed, in addition to the presence of hepatocyte 8-oxo-dG, damage was also identified in biliary epithelia and metaplastic intestinal cells. Although changes in the expression of various genes associated with oxidative stress, DNA damage, and cell cycle control were no longer identified after one-month recovery from treatment, this was not the case for all such changes in gene expression indicating persistence of oxidative stress.
The observation of continued inflammation/injury was also supported by increased expression of 22 genes associated with this biological process. Details of individual gene changes can be found in the ArrayExpress submission. Previous studies by Hamadeh et al. (2004) indicated that the expression of a large number of liver ESTs were modified by furan treatment. In particular, changes in expression of genes associated with the demonstrated fibrogenesis and stellate cell activation were shown in the same affected areas of the liver. More specifically, many of the gene expression changes seen in our study confirm the key changes in global gene expression in rat liver following exposure to 40 mg/kg b.w. per day of furan for up to fourteen days that related to modulation of expression of genes involved in lipid metabolism, fibrogenesis, apoptosis, inflammation, regenerative proliferation, and oxidative stress (Huang et al. 2004). An important feature of both the study of Huang et al. (2004) and our present study is that the evidence from gene expression and cellular markers indicate the presence of oxidative stress that may contribute to DNA damage. Huang et al. also note that upregulation of ribosomal proteins and elongation factor-1 alpha may also be important in the carcinogenic process. The growth arrest and DNA damage inducible (GADD) genes and cyclin G are induced by a variety of genotoxic and nongenotoxic stresses through p53 dependent induction. Their induction plays an important role in the cell’s response to DNA damage, and GADD45 has a vital role in growth arrest (Marhin et al. 1997). Cyclin G expression contributes to G2/M cell cycle arrest in response to DNA damage (Shimizu et al. 1998) and plays a role in modulating apoptosis (Okamoto and Prives 1999).
Pro-inflammatory cytokines (TNFα and IL-1) induce activation of c-jun via phosphorylation through the MAP kinase cascades JNK and p38 (Shaulian and Karin 2001). These changes in hepatocellular p53 and phosphor-c-jun protein were followed by overexpression of these same proteins in proliferating biliary epithelia and metaplastic intestinal ducts and nearby hepatocytes even following cessation of furan treatment. The p53 pathway is involved in central cellular functions including gene transcription, DNA repair, cell cycle control, differentiation, and apoptosis. Furan treatment was associated with an initial overexpression of both wild-type p53 and phosphorylated c-jun in a large number of cells (mainly hepatocytes) near areas of necrosis. Increased cdk-1 immunostaining indicates commitment to mitosis, but increased immunostaining of both p53 and cdk-1 is also consistent with cell cycle arrest in G2 (Ohi and Gould 1999).
It is known that p53 induces the transcription of the gene for its own negative regulator, mdm-2. The mdm-2 protein binds to the p53 protein and inhibits p53 function and transcriptional activity. Amplified mdm-2 can therefore halt p53 function and expression (McKenzie et al. 1997). In this study, mdm-2 protein overexpression relative to controls was observed in those same regions in which p53 protein overexpression was observed; thus, inactivation of wild-type p53 through mdm-2 overexpression could impair p53-dependent DNA repair and apoptosis. The changes in p53 and mdm-2 are found specifically in those areas associated with oxidative DNA damage. The oxidative stress associated with inflammation and the proliferation of cells may combine to enhance mutational events.
An important consideration when interpreting microarray data is that the technique is applied to a heterogeneous cell population, particularly in the liver (Rockett, Esdaile, and Gibson 1999) and that the proportions of these cells alter with furan treatment. Thus, gene expression changes observed after furan dosing may reflect not only changes in hepatocytes but also, to a large extent, the increase in the relative proportion of biliary and metaplastic intestinal cells, together with mesenchymal and nonresident inflammatory cells. This change will certainly contribute to the gene expression differences (e.g., cyclin E, Tα-10, annexin II, and c-myc) that may reflect increased proliferation (Nelsen et al. 2001; Oster et al. 2002; Santelli et al. 1999) as well as many other events. For example, hyperplastic biliary ducts and metaplastic intestinal cells in furan-induced CF have been previously shown to express GST-P (Elmore and Sirica 1991) and are the most likely contributors to the differential gene expression observed. We have recently used laser capture microdissection to illustrate notable heterogeneity in gene expression changes in cholangiofibrotic tissue and that, for example, increased expression of annexin II, CAII, and heat shock protein 70 was largely associated with metaplastic intestinal cells in these lesions (Hitchcock et al. 2003).
Interestingly, a gene expression study by Shackel et al. (2001) of human primary biliary cirrhosis (PBC) using cDNA microarrays displayed a number of similarities in the profile of gene changes to those observed following furan exposure. Both furan-induced CF and human PBC are associated with alterations in expression of genes associated with inflammation, oxidative stress, fibrosis, regeneration, and proliferation.
A key question is whether the carcinogenic effects of furan are through a genotoxic or nongenotoxic mechanism. In the rat, although recognizing the potential for a direct genotoxic component, we propose that the cholangiocarcinomas emerge from areas of CF as a result of a combination of chronic, persistent indirect damage to DNA through oxygen radicals. Loss of Cx32 has been associated with the effects of many nongenotoxic carcinogens (Mally and Chipman 2002), and the persistent proliferative signals may contribute synergistically to convert this DNA damage to fixed mutations. These findings are in accord with the multistage cascade of events that lead to CC (Holzinger, Z’graggen, and Buchler 1999). Importantly, these features remain even after withdrawal of furan treatment. It remains unclear, however, as to why other hepatotoxic chemicals such as carbon tetrachloride do not produce such irreparable, persistent changes leading to CC and also why hepatocellular carcinomas (in the absence of fibrosis) are found in the mouse liver following furan treatment. It is possible that a more direct genotoxic component of action (Byrns, Predecki, and Peterson 2002; Byrns, Vu, and Peterson 2004; Halila et al. 2005; Paku et al. 2001, 2004) occurs in the mouse that needs to be understood.
Footnotes
Acknowledgments
The authors dedicate this article to the late Professor Roger Coleman, who provided valuable contributions in the early stages of this project.